Crime rate in Peoria, Illinois (IL): murders, rapes, robberies, assaults, burglaries, thefts, auto thefts, arson, law enforcement employees, police officers, crime map
Crime rate in Peoria, IL
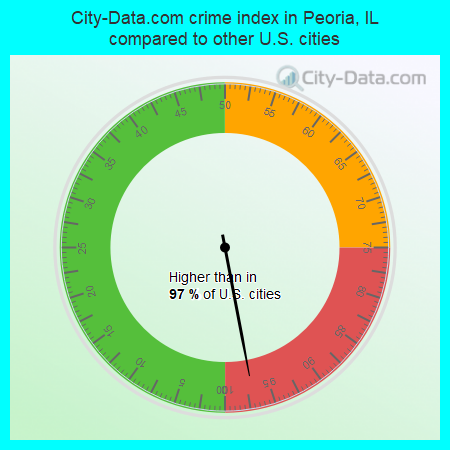
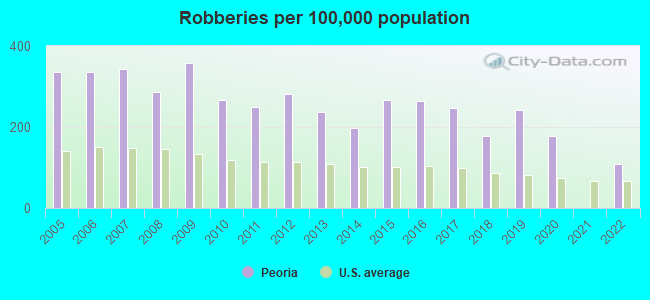
The 2022 crime rate in Peoria, IL is 509 (City-Data.com crime index), which is 2.1 times greater than the U.S. average. It was higher than in 97.0% U.S. cities. The 2022 Peoria crime rate rose by 23808% compared to 2021. In the last 5 years Peoria has seen rise of violent crime and decreasing property crime.See how dangerous Peoria, IL is compared to the nearest cities:
(Note: Higher means more crime)
(Note: Higher means more crime)
| Peoria: | 509.4 |
| Peoria Heights: | 341.6 |
| East Peoria: | 245.3 |
| Creve Coeur: | 348.4 |
| Bartonville: | 250.3 |
| Marquette Heights: | 28.2 |
| North Pekin: | 13.8 |
| Washington: | 86.2 |
| Pekin: | 286.8 |
The City-Data.com crime index weighs serious crimes and violent crimes more heavily. Higher means more crime, U.S. average is 246.1. It adjusts for the number of visitors and daily workers commuting into cities.
- means the value is smaller than the state average.- means the value is about the same as the state average.
- means the value is bigger than the state average.
- means the value is much bigger than the state average.
According to our research of Illinois and other state lists, there were 431 registered sex offenders living in Peoria, Illinois as of May 26, 2024.
The ratio of all residents to sex offenders in Peoria is 268 to 1.
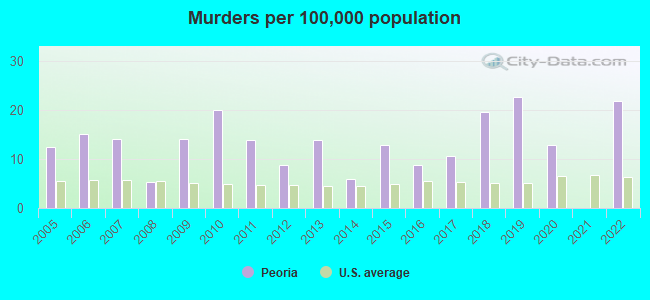
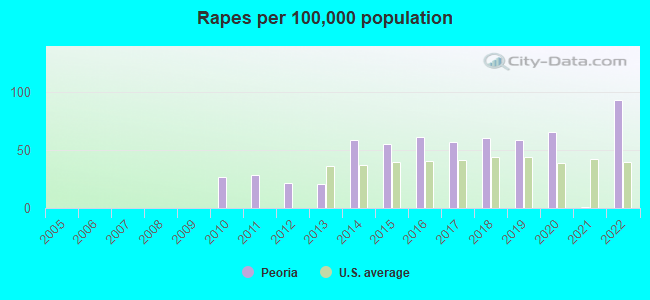
Violent crime rate in 2022
| Peoria: | 673.4 |
| U.S. Average: | 219.8 |
Violent crime rate in 2021
| Peoria: | 1.4 |
| U.S. Average: | 224.8 |
Violent crime rate in 2020
| Peoria: | 544.9 |
| U.S. Average: | 228.2 |
Violent crime rate in 2019
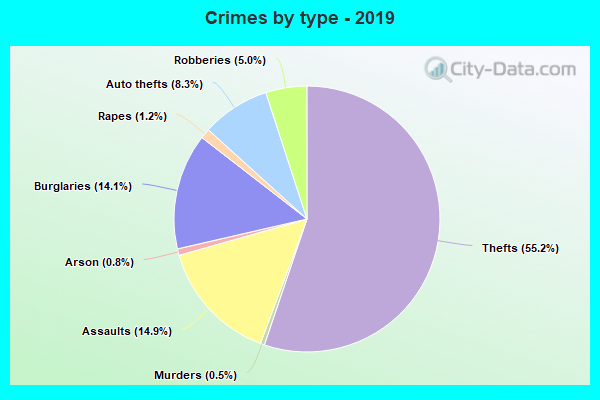
| Peoria: | 584.9 |
| U.S. Average: | 219.9 |
Violent crime rate in 2018
| Peoria: | 441.4 |
| U.S. Average: | 221.2 |
Violent crime rate in 2017
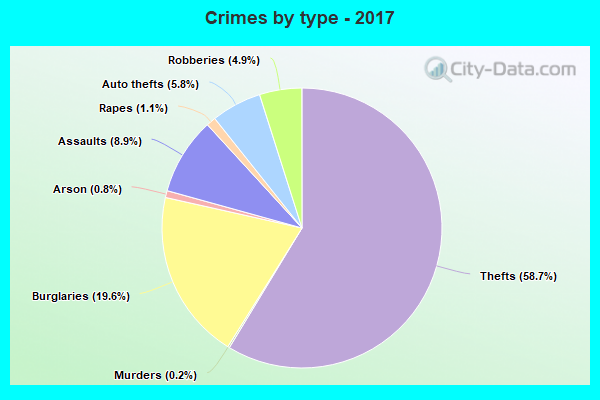
| Peoria: | 424.0 |
| U.S. Average: | 226.2 |
Violent crime rate in 2016
| Peoria: | 423.5 |
| U.S. Average: | 227.3 |
Violent crime rate in 2015
| Peoria: | 377.4 |
| U.S. Average: | 219.3 |
Violent crime rate in 2014
| Peoria: | 362.6 |
| U.S. Average: | 211.1 |
Violent crime rate in 2013
| Peoria: | 369.1 |
| U.S. Average: | 214.2 |
Violent crime rate in 2012
| Peoria: | 422.4 |
| U.S. Average: | 187.4 |
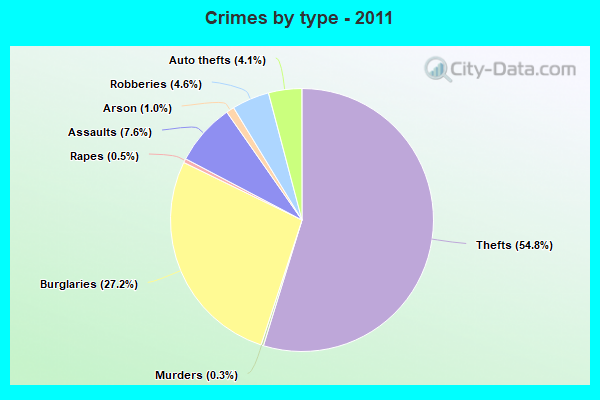
Violent crime rate in 2011
| Peoria: | 387.9 |
| U.S. Average: | 187.1 |
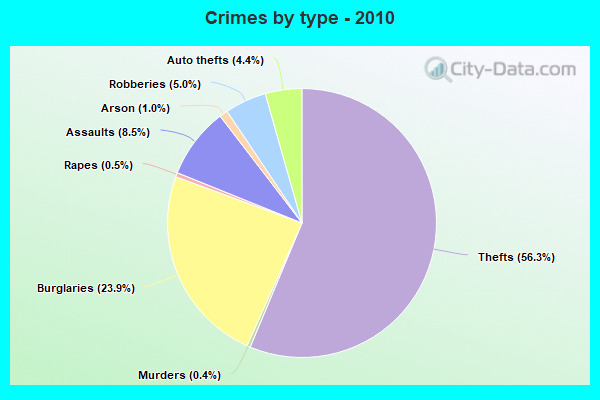
Violent crime rate in 2010
| Peoria: | 425.6 |
| U.S. Average: | 195.7 |
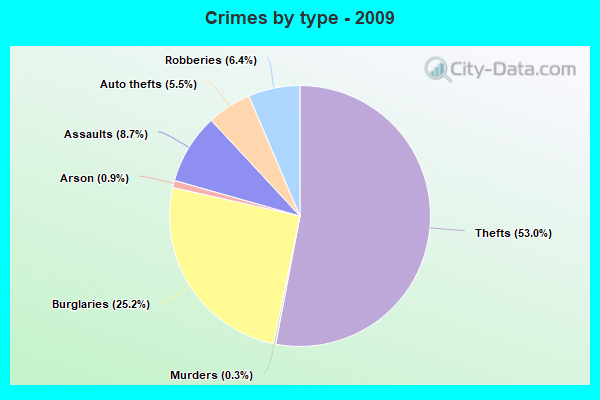
Violent crime rate in 2009
| Peoria: | 449.5 |
| U.S. Average: | 208.9 |
Violent crime rate in 2008
| Peoria: | 358.7 |
| U.S. Average: | 222.5 |
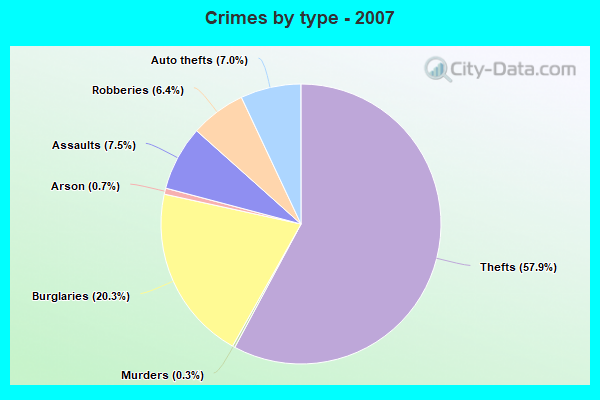
Violent crime rate in 2007
| Peoria: | 314.7 |
| U.S. Average: | 229.1 |
Violent crime rate in 2006
| Peoria: | 337.5 |
| U.S. Average: | 232.6 |
Violent crime rate in 2005
| Peoria: | 335.1 |
| U.S. Average: | 227.0 |
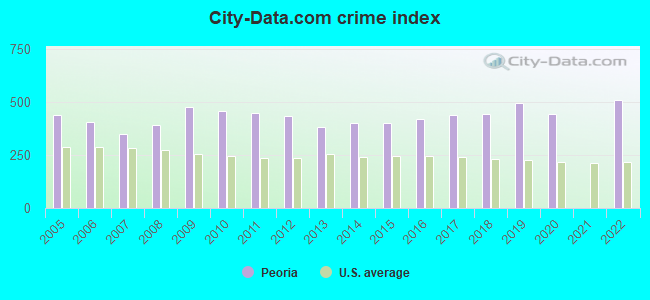
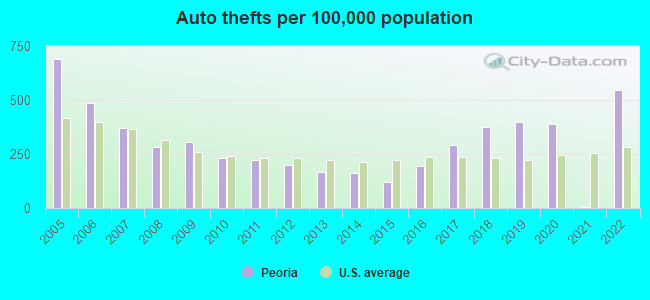
Property crime rate in 2022
| Peoria: | 303.5 |
| U.S. Average: | 166.5 |
Property crime rate in 2021
| Peoria: | 2.5 |
| U.S. Average: | 157.8 |
Property crime rate in 2020
| Peoria: | 294.1 |
| U.S. Average: | 169.6 |
Property crime rate in 2019
| Peoria: | 329.9 |
| U.S. Average: | 179.7 |
Property crime rate in 2018
| Peoria: | 356.3 |
| U.S. Average: | 190.2 |
Property crime rate in 2017
| Peoria: | 387.0 |
| U.S. Average: | 206.4 |
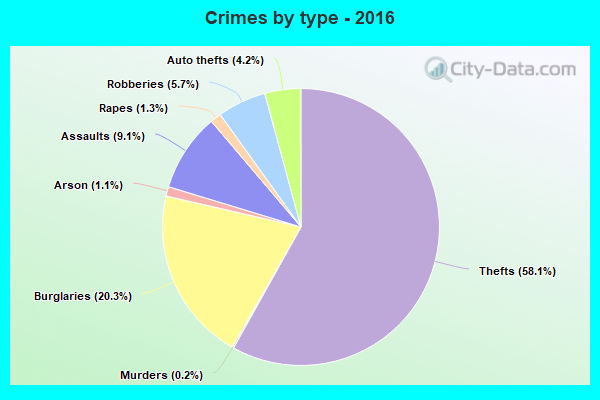
Property crime rate in 2016
| Peoria: | 353.8 |
| U.S. Average: | 216.6 |
Property crime rate in 2015
| Peoria: | 342.4 |
| U.S. Average: | 221.5 |
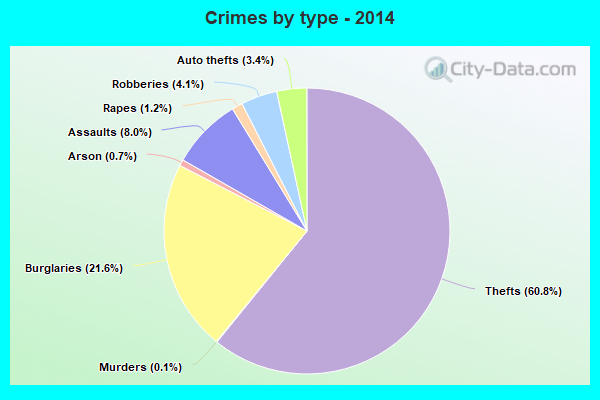
Property crime rate in 2014
| Peoria: | 381.2 |
| U.S. Average: | 230.8 |
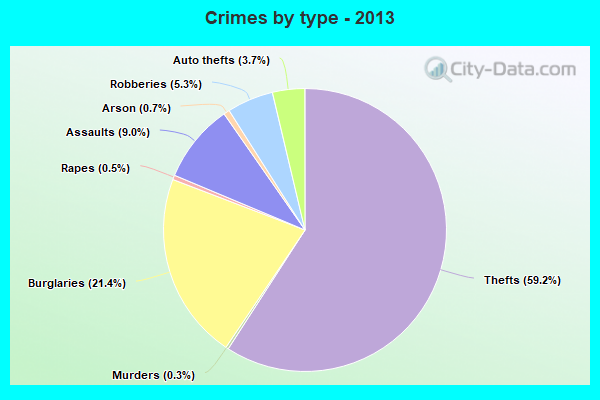
Property crime rate in 2013
| Peoria: | 352.4 |
| U.S. Average: | 250.4 |
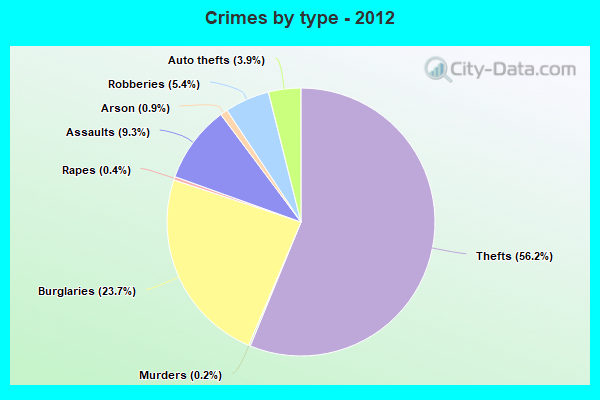
Property crime rate in 2012
| Peoria: | 422.7 |
| U.S. Average: | 267.3 |
Property crime rate in 2011
| Peoria: | 481.8 |
| U.S. Average: | 273.5 |
Property crime rate in 2010
| Peoria: | 438.1 |
| U.S. Average: | 276.4 |
Property crime rate in 2009
| Peoria: | 474.8 |
| U.S. Average: | 285.6 |
Property crime rate in 2008
| Peoria: | 396.5 |
| U.S. Average: | 302.2 |
Property crime rate in 2007
| Peoria: | 336.2 |
| U.S. Average: | 309.2 |
Property crime rate in 2006
| Peoria: | 424.9 |
| U.S. Average: | 317.3 |
Property crime rate in 2005
| Peoria: | 505.9 |
| U.S. Average: | 322.3 |
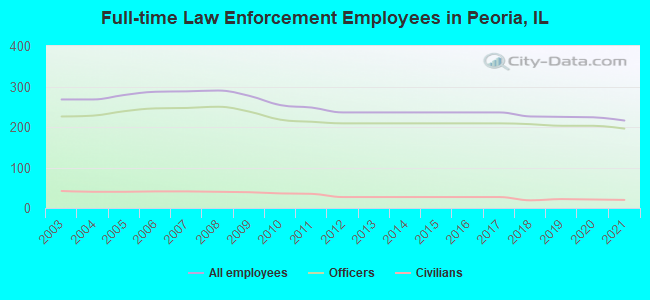
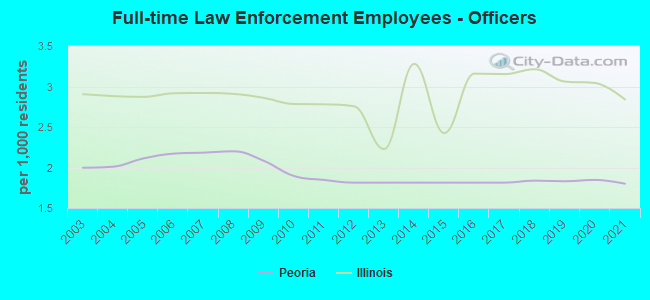
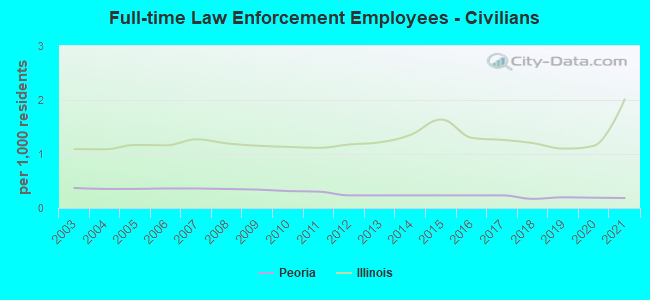
Full-time law enforcement employees in 2021, including police officers: 216 (196 officers - 171 male; 25 female).
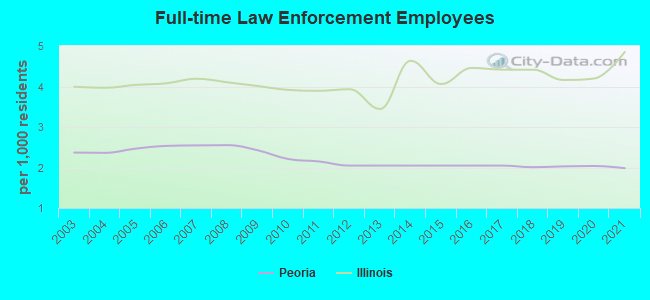
| Officers per 1,000 residents here: | 1.80 |
| Illinois average: | 2.84 |
Full-time law enforcement employees in 2020, including police officers: 224 (203 officers - 178 male; 25 female).
| Officers per 1,000 residents here: | 1.85 |
| Illinois average: | 3.04 |
Full-time law enforcement employees in 2019, including police officers: 225 (203 officers - 182 male; 21 female).
| Officers per 1,000 residents here: | 1.83 |
| Illinois average: | 3.06 |
Full-time law enforcement employees in 2018, including police officers: 226 (207 officers - 186 male; 21 female).
| Officers per 1,000 residents here: | 1.84 |
| Illinois average: | 3.21 |
Full-time law enforcement employees in 2012, including police officers: 236 (209 officers - 188 male; 21 female).
| Officers per 1,000 residents here: | 1.81 |
| Illinois average: | 2.76 |
Full-time law enforcement employees in 2011, including police officers: 248 (213 officers - 191 male; 22 female).
| Officers per 1,000 residents here: | 1.85 |
| Illinois average: | 2.78 |
Full-time law enforcement employees in 2010, including police officers: 254 (218 officers - 196 male; 22 female).
| Officers per 1,000 residents here: | 1.90 |
| Illinois average: | 2.78 |
Full-time law enforcement employees in 2009, including police officers: 277 (238 officers - 214 male; 24 female).
| Officers per 1,000 residents here: | 2.08 |
| Illinois average: | 2.86 |
Full-time law enforcement employees in 2008, including police officers: 290 (250 officers - 224 male; 26 female).
| Officers per 1,000 residents here: | 2.20 |
| Illinois average: | 2.91 |
Full-time law enforcement employees in 2007, including police officers: 288 (247 officers - 221 male; 26 female).
| Officers per 1,000 residents here: | 2.18 |
| Illinois average: | 2.92 |
Full-time law enforcement employees in 2006, including police officers: 287 (246 officers - 221 male; 25 female).
| Officers per 1,000 residents here: | 2.17 |
| Illinois average: | 2.92 |
Full-time law enforcement employees in 2005, including police officers: 279 (239 officers - 216 male; 23 female).
| Officers per 1,000 residents here: | 2.11 |
| Illinois average: | 2.87 |
Full-time law enforcement employees in 2004, including police officers: 268 (228 officers - 205 male; 23 female).
| Officers per 1,000 residents here: | 2.01 |
| Illinois average: | 2.88 |
Full-time law enforcement employees in 2003, including police officers: 268 (226 officers - 204 male; 22 female).
| Officers per 1,000 residents here: | 2.00 |
| Illinois average: | 2.90 |


Zip codes: 61528, 61602, 61603, 61606, 61614, 61615, 61616, 61625.