Crime rate in Pasadena, Texas (TX): murders, rapes, robberies, assaults, burglaries, thefts, auto thefts, arson, law enforcement employees, police officers, crime map
Crime rate in Pasadena, TX
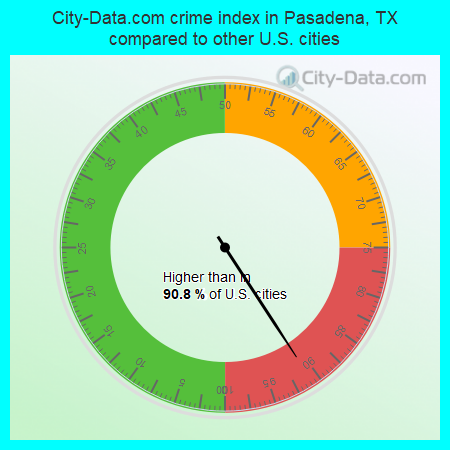
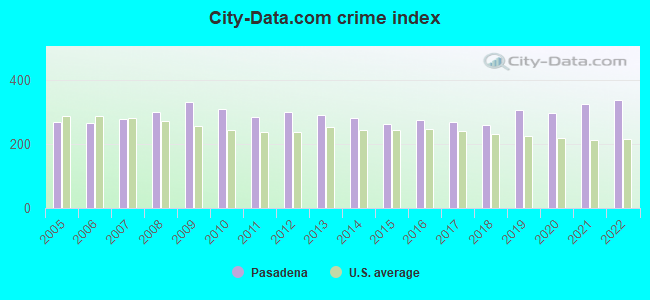
The 2022 crime rate in Pasadena, TX is 337 (City-Data.com crime index), which is 1.4 times greater than the U.S. average. It was higher than in 90.8% U.S. cities. The 2022 Pasadena crime rate rose by 4% compared to 2021. The number of homicides stood at 11 - an increase of 3 compared to 2021. In the last 5 years Pasadena has seen increasing violent crime and increasing property crime.See how dangerous Pasadena, TX is compared to the nearest cities:
(Note: Higher means more crime)
(Note: Higher means more crime)
| Pasadena: | 337.1 |
| South Houston: | 385.1 |
| Deer Park: | 114.1 |
| Galena Park: | 167.7 |
| Jacinto City: | 185.3 |
| La Porte: | 135.1 |
| Webster: | 549.9 |
| Brookside Village: | 137.1 |
| Shoreacres: | 36.9 |
The City-Data.com crime index weighs serious crimes and violent crimes more heavily. Higher means more crime, U.S. average is 246.1. It adjusts for the number of visitors and daily workers commuting into cities.
- means the value is smaller than the state average.- means the value is about the same as the state average.
- means the value is bigger than the state average.
- means the value is much bigger than the state average.
According to our research of Texas and other state lists, there were 117 registered sex offenders living in Pasadena, Texas as of May 23, 2024.
The ratio of all residents to sex offenders in Pasadena is 1,311 to 1.
The ratio of registered sex offenders to all residents in this city is much lower than the state average.

Violent crime rate in 2022
| Pasadena: | 364.5 |
| U.S. Average: | 219.8 |
Violent crime rate in 2021
| Pasadena: | 369.4 |
| U.S. Average: | 224.8 |
Violent crime rate in 2020
| Pasadena: | 334.2 |
| U.S. Average: | 228.2 |
Violent crime rate in 2019
| Pasadena: | 330.2 |
| U.S. Average: | 219.9 |
Violent crime rate in 2018
| Pasadena: | 262.5 |
| U.S. Average: | 221.2 |
Violent crime rate in 2017
| Pasadena: | 265.9 |
| U.S. Average: | 226.2 |
Violent crime rate in 2016
| Pasadena: | 260.3 |
| U.S. Average: | 227.3 |
Violent crime rate in 2015
| Pasadena: | 228.4 |
| U.S. Average: | 219.3 |
Violent crime rate in 2014
| Pasadena: | 229.6 |
| U.S. Average: | 211.1 |
Violent crime rate in 2013
| Pasadena: | 213.1 |
| U.S. Average: | 214.2 |
Violent crime rate in 2012
| Pasadena: | 225.8 |
| U.S. Average: | 187.4 |
Violent crime rate in 2011
| Pasadena: | 211.3 |
| U.S. Average: | 187.1 |
Violent crime rate in 2010
| Pasadena: | 234.8 |
| U.S. Average: | 195.7 |
Violent crime rate in 2009
| Pasadena: | 267.4 |
| U.S. Average: | 208.9 |
Violent crime rate in 2008
| Pasadena: | 250.8 |
| U.S. Average: | 222.5 |
Violent crime rate in 2007
| Pasadena: | 226.2 |
| U.S. Average: | 229.1 |
Violent crime rate in 2006
| Pasadena: | 214.1 |
| U.S. Average: | 232.6 |
Violent crime rate in 2005
| Pasadena: | 218.6 |
| U.S. Average: | 227.0 |
Property crime rate in 2022
| Pasadena: | 244.9 |
| U.S. Average: | 166.5 |
Property crime rate in 2021
| Pasadena: | 228.2 |
| U.S. Average: | 157.8 |
Property crime rate in 2020
| Pasadena: | 200.3 |
| U.S. Average: | 169.6 |
Property crime rate in 2019
| Pasadena: | 214.9 |
| U.S. Average: | 179.7 |
Property crime rate in 2018
| Pasadena: | 185.4 |
| U.S. Average: | 190.2 |
Property crime rate in 2017
| Pasadena: | 209.1 |
| U.S. Average: | 206.4 |
Property crime rate in 2016
| Pasadena: | 222.5 |
| U.S. Average: | 216.6 |
Property crime rate in 2015
| Pasadena: | 243.7 |
| U.S. Average: | 221.5 |
Property crime rate in 2014
| Pasadena: | 261.6 |
| U.S. Average: | 230.8 |
Property crime rate in 2013
| Pasadena: | 311.8 |
| U.S. Average: | 250.4 |
Property crime rate in 2012
| Pasadena: | 312.3 |
| U.S. Average: | 267.3 |
Property crime rate in 2011
| Pasadena: | 311.0 |
| U.S. Average: | 273.5 |
Property crime rate in 2010
| Pasadena: | 323.2 |
| U.S. Average: | 276.4 |
Property crime rate in 2009
| Pasadena: | 344.7 |
| U.S. Average: | 285.6 |
Property crime rate in 2008
| Pasadena: | 290.7 |
| U.S. Average: | 302.2 |
Property crime rate in 2007
| Pasadena: | 286.3 |
| U.S. Average: | 309.2 |
Property crime rate in 2006
| Pasadena: | 272.1 |
| U.S. Average: | 317.3 |
Property crime rate in 2005
| Pasadena: | 282.2 |
| U.S. Average: | 322.3 |


Full-time law enforcement employees in 2021, including police officers: 367 (274 officers - 250 male; 24 female).
| Officers per 1,000 residents here: | 1.83 |
| Texas average: | 2.07 |
Full-time law enforcement employees in 2020, including police officers: 373 (282 officers - 258 male; 24 female).
| Officers per 1,000 residents here: | 1.86 |
| Texas average: | 2.05 |
Full-time law enforcement employees in 2019, including police officers: 369 (291 officers - 266 male; 25 female).
| Officers per 1,000 residents here: | 1.89 |
| Texas average: | 2.02 |
Full-time law enforcement employees in 2017, including police officers: 358 (263 officers - 246 male; 17 female).
| Officers per 1,000 residents here: | 1.71 |
| Texas average: | 2.06 |
Full-time law enforcement employees in 2016, including police officers: 345 (268 officers - 250 male; 18 female).
| Officers per 1,000 residents here: | 1.73 |
| Texas average: | 2.11 |
Full-time law enforcement employees in 2015, including police officers: 341 (272 officers - 254 male; 18 female).
| Officers per 1,000 residents here: | 1.75 |
| Texas average: | 2.13 |
Full-time law enforcement employees in 2013, including police officers: 341 (256 officers - 240 male; 16 female).
| Officers per 1,000 residents here: | 1.67 |
| Texas average: | 2.05 |
Full-time law enforcement employees in 2012, including police officers: 339 (268 officers - 251 male; 17 female).
| Officers per 1,000 residents here: | 1.73 |
| Texas average: | 1.95 |
Full-time law enforcement employees in 2011, including police officers: 334 (260 officers - 246 male; 14 female).
| Officers per 1,000 residents here: | 1.71 |
| Texas average: | 2.17 |
Full-time law enforcement employees in 2010, including police officers: 343 (265 officers - 250 male; 15 female).
| Officers per 1,000 residents here: | 1.78 |
| Texas average: | 2.20 |
Full-time law enforcement employees in 2009, including police officers: 346 (270 officers - 257 male; 13 female).
| Officers per 1,000 residents here: | 1.84 |
| Texas average: | 2.23 |
Full-time law enforcement employees in 2008, including police officers: 337 (257 officers - 243 male; 14 female).
| Officers per 1,000 residents here: | 1.75 |
| Texas average: | 2.17 |
Full-time law enforcement employees in 2007, including police officers: 337 (252 officers - 238 male; 14 female).
| Officers per 1,000 residents here: | 1.74 |
| Texas average: | 2.18 |
Full-time law enforcement employees in 2006, including police officers: 334 (256 officers - 240 male; 16 female).
| Officers per 1,000 residents here: | 1.73 |
| Texas average: | 2.13 |
Full-time law enforcement employees in 2005, including police officers: 332 (253 officers - 240 male; 13 female).
| Officers per 1,000 residents here: | 1.73 |
| Texas average: | 2.18 |
Full-time law enforcement employees in 2004, including police officers: 326 (254 officers - 241 male; 13 female).
| Officers per 1,000 residents here: | 1.73 |
| Texas average: | 2.19 |
Full-time law enforcement employees in 2003, including police officers: 345 (253 officers - 242 male; 11 female).
| Officers per 1,000 residents here: | 1.72 |
| Texas average: | 2.17 |


Zip codes: 77502.