Crime rate in Jackson, Tennessee (TN): murders, rapes, robberies, assaults, burglaries, thefts, auto thefts, arson, law enforcement employees, police officers, crime map
Crime rate in Jackson, TN
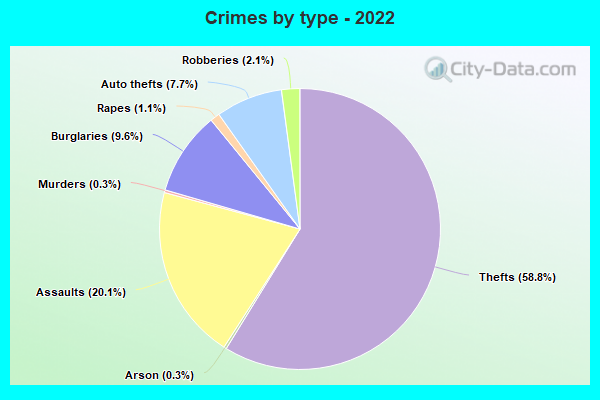
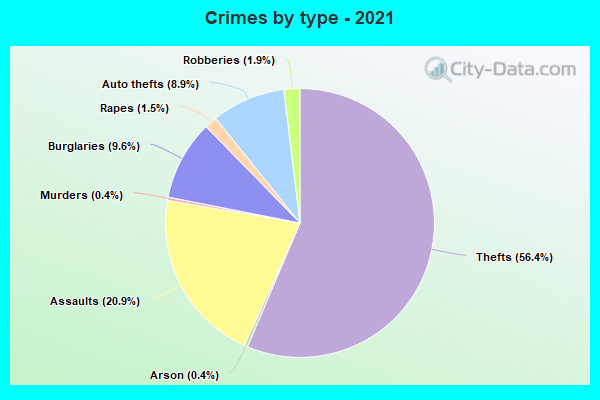
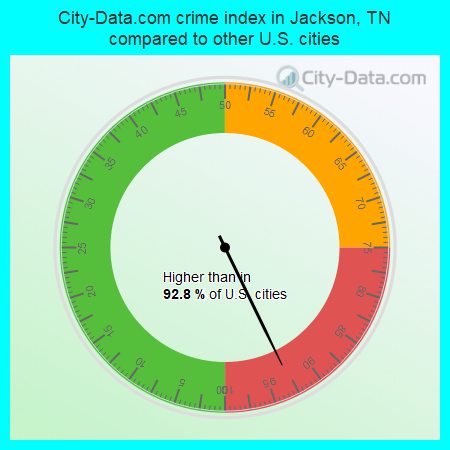
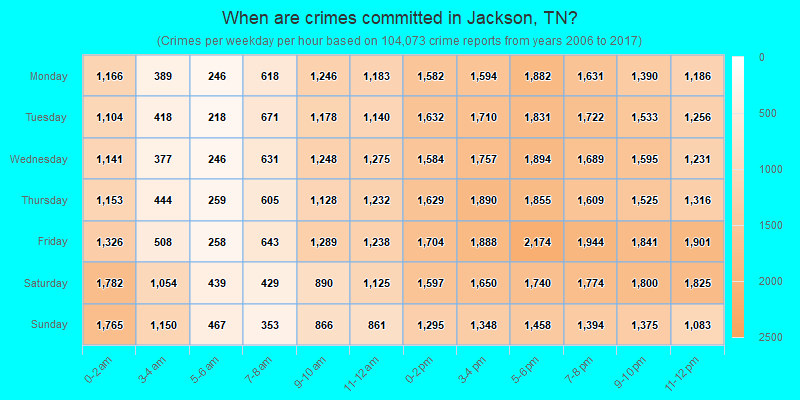
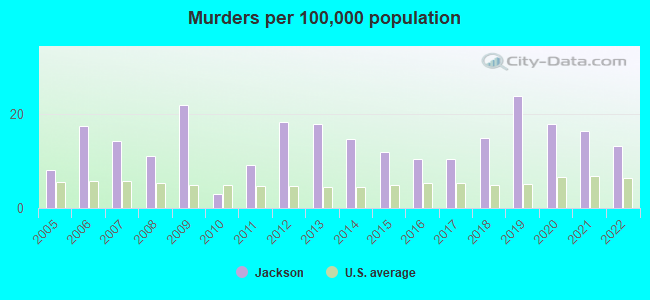
The 2022 crime rate in Jackson, TN is 375 (City-Data.com crime index), which is 1.5 times greater than the U.S. average. It was higher than in 92.8% U.S. cities. The 2022 Jackson crime rate fell by 8% compared to 2021. The number of homicides stood at 9 - a decrease of 2 compared to 2021. In the last 5 years Jackson has seen decreasing violent crime and decline of property crime.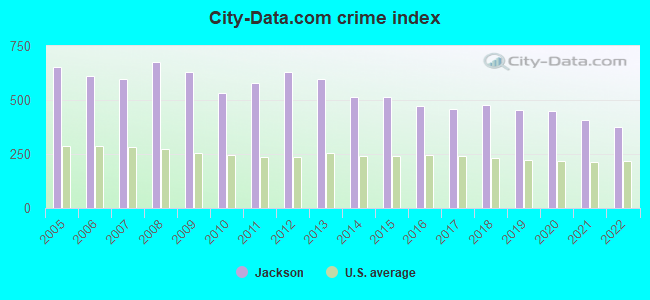
The City-Data.com crime index weighs serious crimes and violent crimes more heavily. Higher means more crime, U.S. average is 246.1. It adjusts for the number of visitors and daily workers commuting into cities.
- means the value is smaller than the state average.- means the value is about the same as the state average.
- means the value is bigger than the state average.
- means the value is much bigger than the state average.
According to our research of Tennessee and other state lists, there were 461 registered sex offenders living in Jackson, Tennessee as of May 23, 2024.
The ratio of all residents to sex offenders in Jackson is 148 to 1.
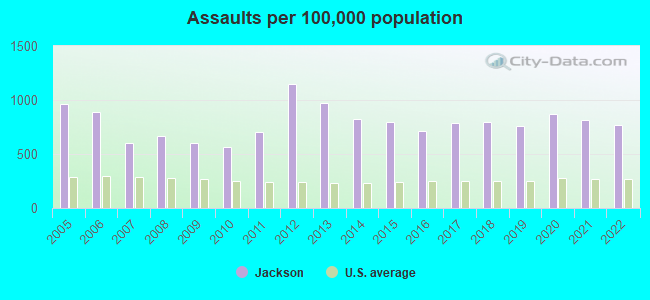
Violent crime rate in 2022
| Jackson: | 490.0 |
| U.S. Average: | 219.8 |
Violent crime rate in 2021
| Jackson: | 534.4 |
| U.S. Average: | 224.8 |
Violent crime rate in 2020
| Jackson: | 568.2 |
| U.S. Average: | 228.2 |
Violent crime rate in 2019
| Jackson: | 543.2 |
| U.S. Average: | 219.9 |
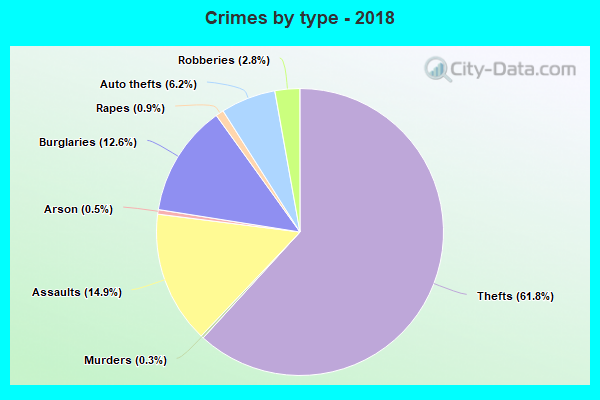
Violent crime rate in 2018
| Jackson: | 549.8 |
| U.S. Average: | 221.2 |
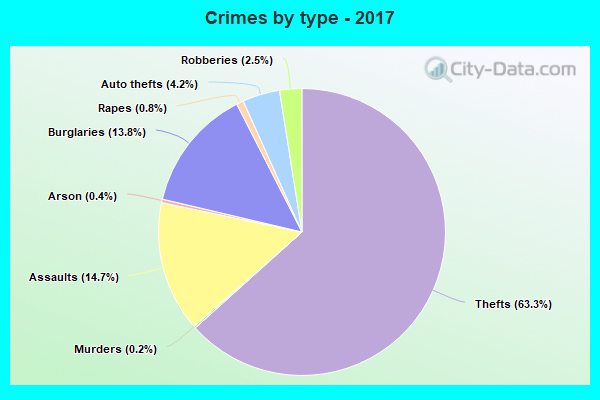
Violent crime rate in 2017
| Jackson: | 525.1 |
| U.S. Average: | 226.2 |
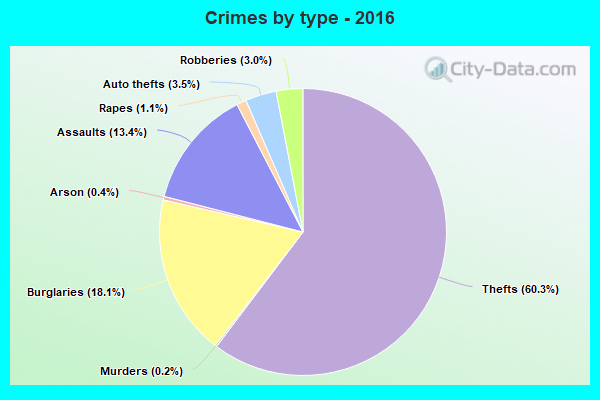
Violent crime rate in 2016
| Jackson: | 518.0 |
| U.S. Average: | 227.3 |
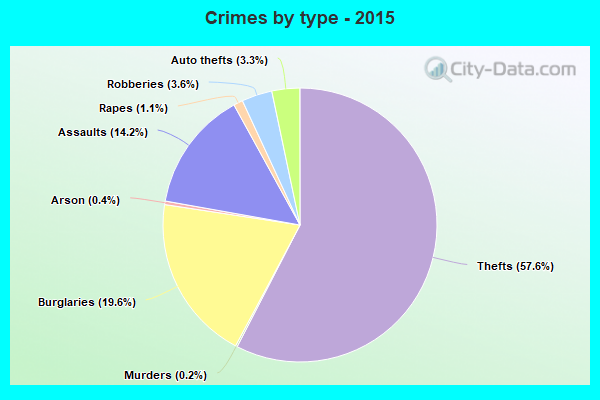
Violent crime rate in 2015
| Jackson: | 586.7 |
| U.S. Average: | 219.3 |
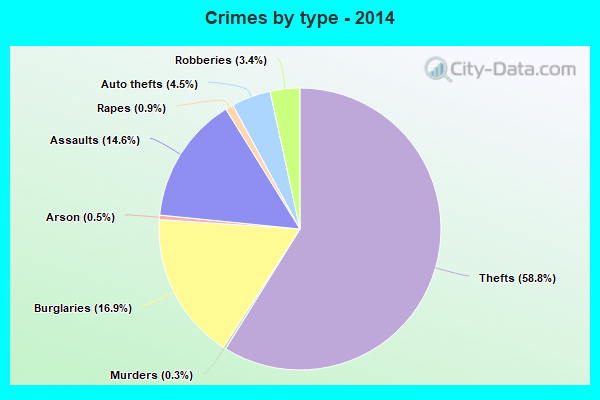
Violent crime rate in 2014
| Jackson: | 588.6 |
| U.S. Average: | 211.1 |
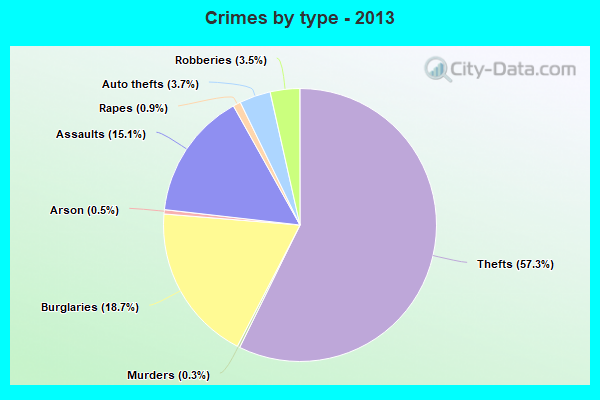
Violent crime rate in 2013
| Jackson: | 695.4 |
| U.S. Average: | 214.2 |
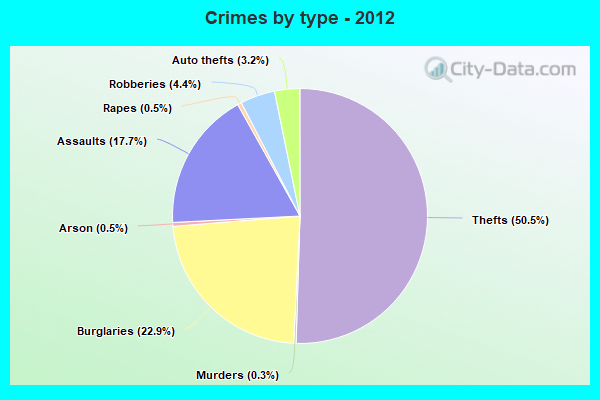
Violent crime rate in 2012
| Jackson: | 785.9 |
| U.S. Average: | 187.4 |
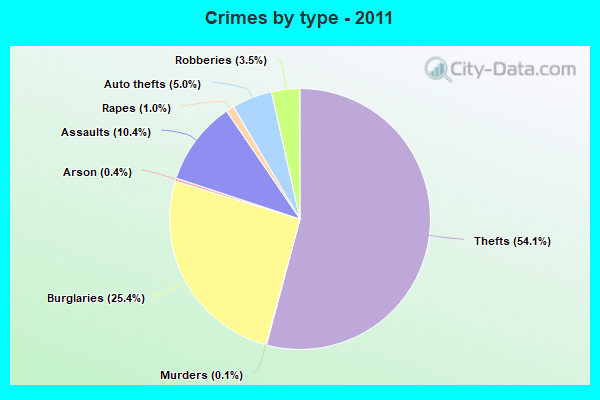
Violent crime rate in 2011
| Jackson: | 554.0 |
| U.S. Average: | 187.1 |
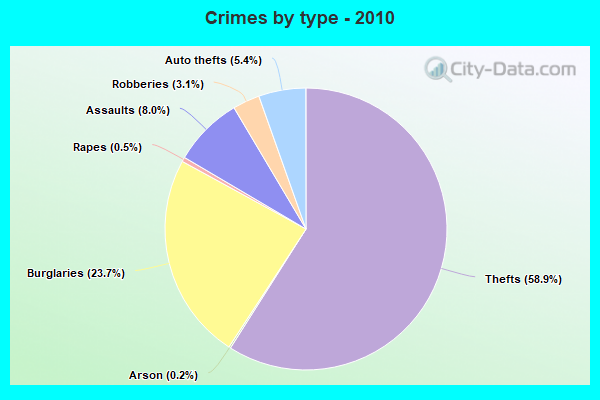
Violent crime rate in 2010
| Jackson: | 440.1 |
| U.S. Average: | 195.7 |
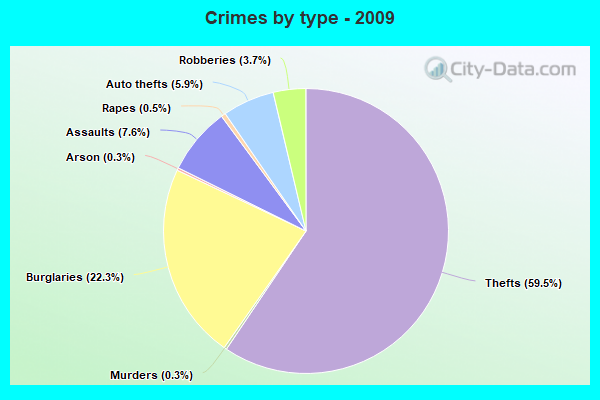
Violent crime rate in 2009
| Jackson: | 527.3 |
| U.S. Average: | 208.9 |
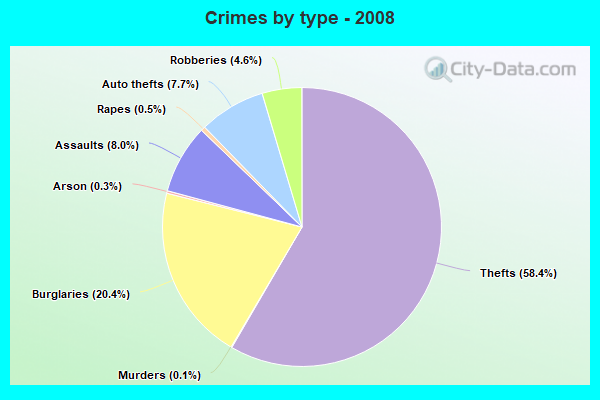
Violent crime rate in 2008
| Jackson: | 594.2 |
| U.S. Average: | 222.5 |
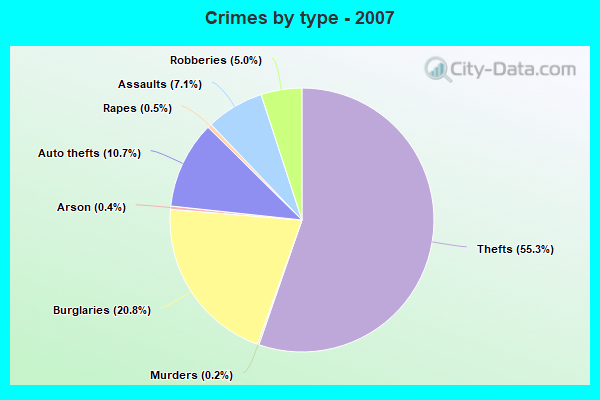
Violent crime rate in 2007
| Jackson: | 502.2 |
| U.S. Average: | 229.1 |
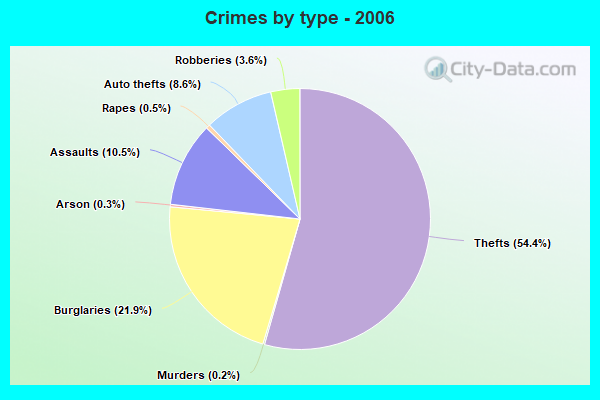
Violent crime rate in 2006
| Jackson: | 579.4 |
| U.S. Average: | 232.6 |
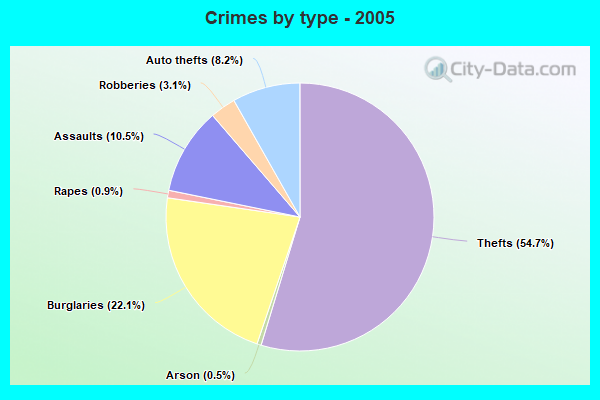
Violent crime rate in 2005
| Jackson: | 618.2 |
| U.S. Average: | 227.0 |
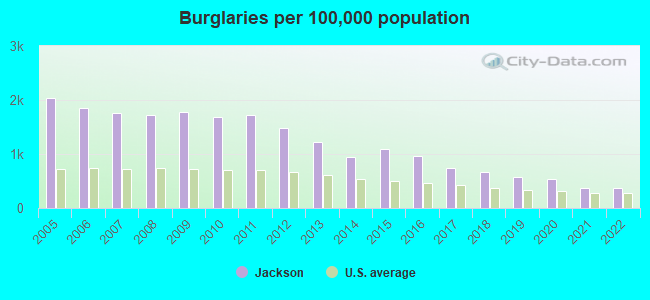
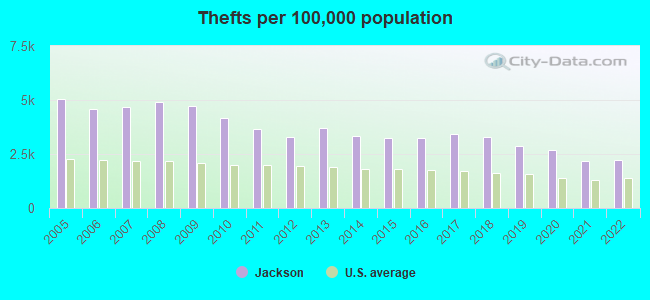
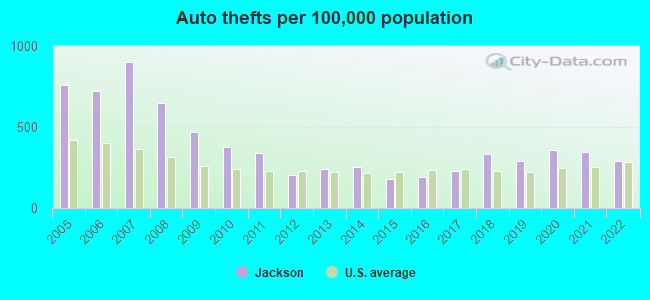
Property crime rate in 2022
| Jackson: | 229.1 |
| U.S. Average: | 166.5 |
Property crime rate in 2021
| Jackson: | 236.1 |
| U.S. Average: | 157.8 |
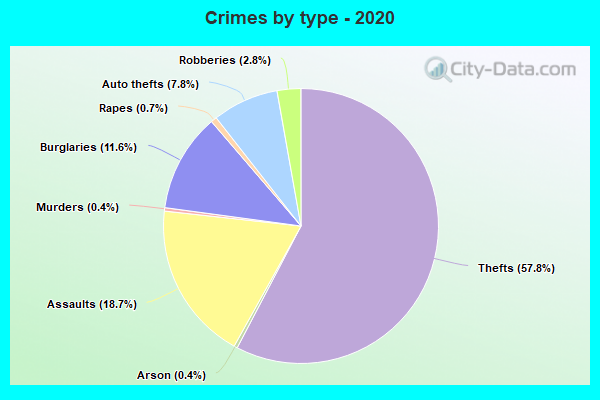
Property crime rate in 2020
| Jackson: | 296.7 |
| U.S. Average: | 169.6 |
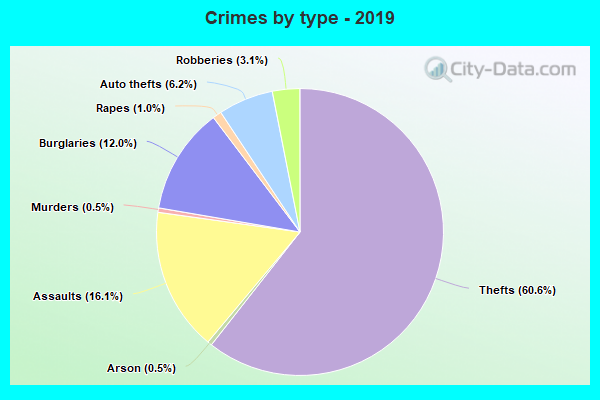
Property crime rate in 2019
| Jackson: | 299.8 |
| U.S. Average: | 179.7 |
Property crime rate in 2018
| Jackson: | 349.2 |
| U.S. Average: | 190.2 |
Property crime rate in 2017
| Jackson: | 353.0 |
| U.S. Average: | 206.4 |
Property crime rate in 2016
| Jackson: | 384.5 |
| U.S. Average: | 216.6 |
Property crime rate in 2015
| Jackson: | 408.5 |
| U.S. Average: | 221.5 |
Property crime rate in 2014
| Jackson: | 394.1 |
| U.S. Average: | 230.8 |
Property crime rate in 2013
| Jackson: | 463.6 |
| U.S. Average: | 250.4 |
Property crime rate in 2012
| Jackson: | 490.8 |
| U.S. Average: | 267.3 |
Property crime rate in 2011
| Jackson: | 577.0 |
| U.S. Average: | 273.5 |
Property crime rate in 2010
| Jackson: | 601.0 |
| U.S. Average: | 276.4 |
Property crime rate in 2009
| Jackson: | 659.7 |
| U.S. Average: | 285.6 |
Property crime rate in 2008
| Jackson: | 687.4 |
| U.S. Average: | 302.2 |
Property crime rate in 2007
| Jackson: | 618.6 |
| U.S. Average: | 309.2 |
Property crime rate in 2006
| Jackson: | 608.5 |
| U.S. Average: | 317.3 |
Property crime rate in 2005
| Jackson: | 665.1 |
| U.S. Average: | 322.3 |
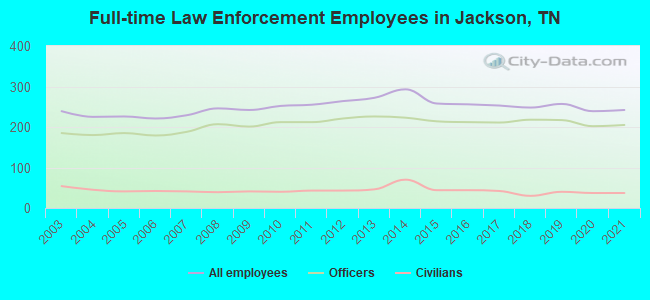
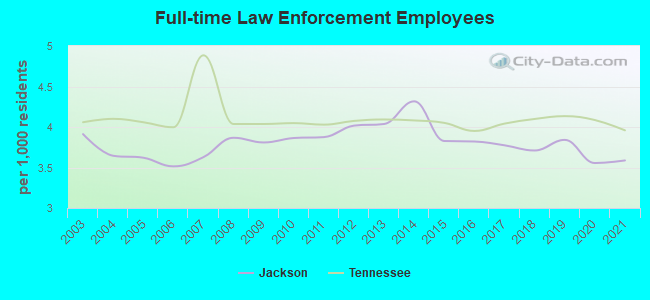
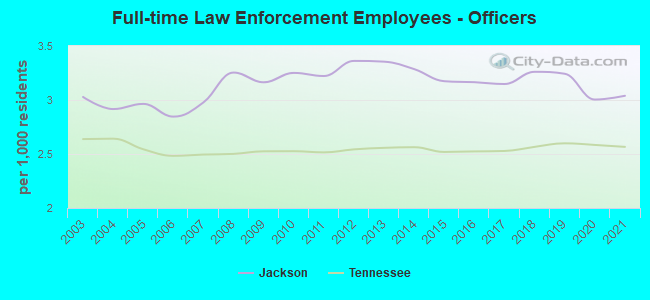
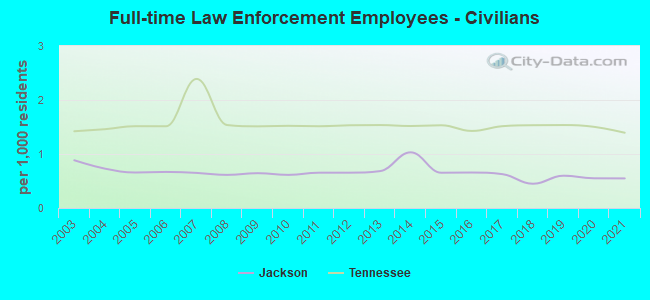
Full-time law enforcement employees in 2021, including police officers: 242 (205 officers - 187 male; 18 female).
| Officers per 1,000 residents here: | 3.04 |
| Tennessee average: | 2.57 |
Full-time law enforcement employees in 2020, including police officers: 239 (202 officers - 186 male; 16 female).
| Officers per 1,000 residents here: | 3.00 |
| Tennessee average: | 2.58 |
Full-time law enforcement employees in 2019, including police officers: 257 (217 officers - 200 male; 17 female).
| Officers per 1,000 residents here: | 3.24 |
| Tennessee average: | 2.60 |
Full-time law enforcement employees in 2018, including police officers: 248 (218 officers - 189 male; 29 female).
| Officers per 1,000 residents here: | 3.26 |
| Tennessee average: | 2.57 |
Full-time law enforcement employees in 2017, including police officers: 253 (211 officers - 192 male; 19 female).
| Officers per 1,000 residents here: | 3.15 |
| Tennessee average: | 2.53 |
Full-time law enforcement employees in 2016, including police officers: 256 (212 officers - 191 male; 21 female).
| Officers per 1,000 residents here: | 3.16 |
| Tennessee average: | 2.52 |
Full-time law enforcement employees in 2015, including police officers: 258 (214 officers - 193 male; 21 female).
| Officers per 1,000 residents here: | 3.17 |
| Tennessee average: | 2.52 |
Full-time law enforcement employees in 2014, including police officers: 293 (223 officers - 198 male; 25 female).
| Officers per 1,000 residents here: | 3.29 |
| Tennessee average: | 2.56 |
Full-time law enforcement employees in 2013, including police officers: 272 (226 officers - 203 male; 23 female).
| Officers per 1,000 residents here: | 3.35 |
| Tennessee average: | 2.56 |
Full-time law enforcement employees in 2012, including police officers: 264 (221 officers - 197 male; 24 female).
| Officers per 1,000 residents here: | 3.36 |
| Tennessee average: | 2.54 |
Full-time law enforcement employees in 2011, including police officers: 255 (212 officers - 188 male; 24 female).
| Officers per 1,000 residents here: | 3.22 |
| Tennessee average: | 2.52 |
Full-time law enforcement employees in 2010, including police officers: 252 (212 officers - 189 male; 23 female).
| Officers per 1,000 residents here: | 3.25 |
| Tennessee average: | 2.53 |
Full-time law enforcement employees in 2009, including police officers: 242 (201 officers - 178 male; 23 female).
| Officers per 1,000 residents here: | 3.16 |
| Tennessee average: | 2.52 |
Full-time law enforcement employees in 2008, including police officers: 246 (207 officers - 183 male; 24 female).
| Officers per 1,000 residents here: | 3.25 |
| Tennessee average: | 2.50 |
Full-time law enforcement employees in 2007, including police officers: 229 (188 officers - 166 male; 22 female).
| Officers per 1,000 residents here: | 2.98 |
| Tennessee average: | 2.50 |
Full-time law enforcement employees in 2006, including police officers: 221 (179 officers - 156 male; 23 female).
| Officers per 1,000 residents here: | 2.85 |
| Tennessee average: | 2.48 |
Full-time law enforcement employees in 2005, including police officers: 226 (185 officers - 161 male; 24 female).
| Officers per 1,000 residents here: | 2.96 |
| Tennessee average: | 2.54 |
Full-time law enforcement employees in 2004, including police officers: 225 (180 officers - 158 male; 22 female).
| Officers per 1,000 residents here: | 2.92 |
| Tennessee average: | 2.64 |
Full-time law enforcement employees in 2003, including police officers: 239 (185 officers - 163 male; 22 female).
| Officers per 1,000 residents here: | 3.03 |
| Tennessee average: | 2.64 |