Crime rate in Irving, Texas (TX): murders, rapes, robberies, assaults, burglaries, thefts, auto thefts, arson, law enforcement employees, police officers, crime map

Crime rate in Irving, TX
The 2022 crime rate in Irving, TX is 242 (City-Data.com crime index), which is about the average for the U.S. cities. It was higher than in 81.5% U.S. cities. The 2022 Irving crime rate fell by 3% compared to 2021. The number of homicides stood at 12. In the last 5 years Irving has seen rise of violent crime and increasing property crime.See how dangerous Irving, TX is compared to the nearest cities:
(Note: Higher means more crime)
(Note: Higher means more crime)
| Irving: | 241.7 |
| Euless: | 207.7 |
| Farmers Branch: | 289.2 |
| Coppell: | 103.8 |
| Cockrell Hill: | 175.8 |
| Grapevine: | 197.7 |
| Grand Prairie: | 153.8 |
| Highland Park: | 126.5 |
| Bedford: | 179.0 |
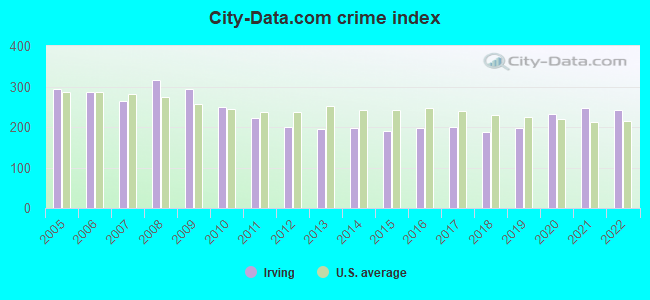
The City-Data.com crime index weighs serious crimes and violent crimes more heavily. Higher means more crime, U.S. average is 246.1. It adjusts for the number of visitors and daily workers commuting into cities.
- means the value is smaller than the state average.- means the value is about the same as the state average.
- means the value is bigger than the state average.
- means the value is much bigger than the state average.
According to our research of Texas and other state lists, there were 175 registered sex offenders living in Irving, Texas as of May 20, 2024.
The ratio of all residents to sex offenders in Irving is 1,362 to 1.
The ratio of registered sex offenders to all residents in this city is much lower than the state average.
Violent crime rate in 2022
| Irving: | 203.2 |
| U.S. Average: | 219.8 |
Violent crime rate in 2021
| Irving: | 210.0 |
| U.S. Average: | 224.8 |
Violent crime rate in 2020
| Irving: | 184.6 |
| U.S. Average: | 228.2 |
Violent crime rate in 2019
| Irving: | 140.2 |
| U.S. Average: | 219.9 |
Violent crime rate in 2018
| Irving: | 122.0 |
| U.S. Average: | 221.2 |
Violent crime rate in 2017
| Irving: | 129.5 |
| U.S. Average: | 226.2 |
Violent crime rate in 2016
| Irving: | 119.0 |
| U.S. Average: | 227.3 |
Violent crime rate in 2015
| Irving: | 111.6 |
| U.S. Average: | 219.3 |
Violent crime rate in 2014
| Irving: | 121.5 |
| U.S. Average: | 211.1 |
Violent crime rate in 2013
| Irving: | 122.6 |
| U.S. Average: | 214.2 |
Violent crime rate in 2012
| Irving: | 121.2 |
| U.S. Average: | 187.4 |
Violent crime rate in 2011
| Irving: | 127.5 |
| U.S. Average: | 187.1 |
Violent crime rate in 2010
| Irving: | 134.8 |
| U.S. Average: | 195.7 |
Violent crime rate in 2009
| Irving: | 160.5 |
| U.S. Average: | 208.9 |
Violent crime rate in 2008
| Irving: | 193.0 |
| U.S. Average: | 222.5 |
Violent crime rate in 2007
| Irving: | 158.7 |
| U.S. Average: | 229.1 |
Violent crime rate in 2006
| Irving: | 180.8 |
| U.S. Average: | 232.6 |
Violent crime rate in 2005
| Irving: | 197.2 |
| U.S. Average: | 227.0 |
Property crime rate in 2022
| Irving: | 209.5 |
| U.S. Average: | 166.5 |
Property crime rate in 2021
| Irving: | 206.1 |
| U.S. Average: | 157.8 |
Property crime rate in 2020
| Irving: | 206.0 |
| U.S. Average: | 169.6 |
Property crime rate in 2019
| Irving: | 194.8 |
| U.S. Average: | 179.7 |
Property crime rate in 2018
| Irving: | 191.3 |
| U.S. Average: | 190.2 |
Property crime rate in 2017
| Irving: | 216.4 |
| U.S. Average: | 206.4 |
Property crime rate in 2016
| Irving: | 234.8 |
| U.S. Average: | 216.6 |
Property crime rate in 2015
| Irving: | 223.0 |
| U.S. Average: | 221.5 |
Property crime rate in 2014
| Irving: | 228.0 |
| U.S. Average: | 230.8 |
Property crime rate in 2013
| Irving: | 235.9 |
| U.S. Average: | 250.4 |
Property crime rate in 2012
| Irving: | 251.5 |
| U.S. Average: | 267.3 |
Property crime rate in 2011
| Irving: | 289.9 |
| U.S. Average: | 273.5 |
Property crime rate in 2010
| Irving: | 321.1 |
| U.S. Average: | 276.4 |
Property crime rate in 2009
| Irving: | 388.6 |
| U.S. Average: | 285.6 |
Property crime rate in 2008
| Irving: | 393.2 |
| U.S. Average: | 302.2 |
Property crime rate in 2007
| Irving: | 327.2 |
| U.S. Average: | 309.2 |
Property crime rate in 2006
| Irving: | 341.9 |
| U.S. Average: | 317.3 |
Property crime rate in 2005
| Irving: | 342.5 |
| U.S. Average: | 322.3 |


Full-time law enforcement employees in 2021, including police officers: 553 (380 officers - 339 male; 41 female).
| Officers per 1,000 residents here: | 1.57 |
| Texas average: | 2.07 |
Full-time law enforcement employees in 2020, including police officers: 574 (376 officers - 338 male; 38 female).
| Officers per 1,000 residents here: | 1.55 |
| Texas average: | 2.05 |
Full-time law enforcement employees in 2019, including police officers: 525 (364 officers - 328 male; 36 female).
| Officers per 1,000 residents here: | 1.48 |
| Texas average: | 2.02 |
Full-time law enforcement employees in 2018, including police officers: 530 (354 officers - 325 male; 29 female).
| Officers per 1,000 residents here: | 1.45 |
| Texas average: | 2.18 |
Full-time law enforcement employees in 2017, including police officers: 490 (341 officers - 313 male; 28 female).
| Officers per 1,000 residents here: | 1.41 |
| Texas average: | 2.06 |
Full-time law enforcement employees in 2016, including police officers: 482 (330 officers - 302 male; 28 female).
| Officers per 1,000 residents here: | 1.37 |
| Texas average: | 2.11 |
Full-time law enforcement employees in 2015, including police officers: 504 (342 officers - 317 male; 25 female).
| Officers per 1,000 residents here: | 1.45 |
| Texas average: | 2.13 |
Full-time law enforcement employees in 2014, including police officers: 551 (339 officers - 315 male; 24 female).
| Officers per 1,000 residents here: | 1.46 |
| Texas average: | 2.01 |
Full-time law enforcement employees in 2013, including police officers: 473 (329 officers - 304 male; 25 female).
| Officers per 1,000 residents here: | 1.44 |
| Texas average: | 2.05 |
Full-time law enforcement employees in 2012, including police officers: 478 (329 officers - 306 male; 23 female).
| Officers per 1,000 residents here: | 1.47 |
| Texas average: | 1.95 |
Full-time law enforcement employees in 2011, including police officers: 482 (336 officers - 310 male; 26 female).
| Officers per 1,000 residents here: | 1.52 |
| Texas average: | 2.17 |
Full-time law enforcement employees in 2010, including police officers: 503 (339 officers - 313 male; 26 female).
| Officers per 1,000 residents here: | 1.57 |
| Texas average: | 2.20 |
Full-time law enforcement employees in 2009, including police officers: 485 (344 officers - 319 male; 25 female).
| Officers per 1,000 residents here: | 1.70 |
| Texas average: | 2.23 |
Full-time law enforcement employees in 2008, including police officers: 496 (342 officers - 320 male; 22 female).
| Officers per 1,000 residents here: | 1.71 |
| Texas average: | 2.17 |
Full-time law enforcement employees in 2007, including police officers: 456 (319 officers - 297 male; 22 female).
| Officers per 1,000 residents here: | 1.62 |
| Texas average: | 2.18 |
Full-time law enforcement employees in 2006, including police officers: 457 (323 officers - 298 male; 25 female).
| Officers per 1,000 residents here: | 1.62 |
| Texas average: | 2.13 |
Full-time law enforcement employees in 2005, including police officers: 468 (320 officers - 296 male; 24 female).
| Officers per 1,000 residents here: | 1.62 |
| Texas average: | 2.18 |
Full-time law enforcement employees in 2004, including police officers: 459 (309 officers - 286 male; 23 female).
| Officers per 1,000 residents here: | 1.56 |
| Texas average: | 2.19 |
Full-time law enforcement employees in 2003, including police officers: 450 (313 officers - 290 male; 23 female).
| Officers per 1,000 residents here: | 1.57 |
| Texas average: | 2.17 |


Zip codes: 75038.