Crime rate in Fremont, California (CA): murders, rapes, robberies, assaults, burglaries, thefts, auto thefts, arson, law enforcement employees, police officers, crime map
Crime rate in Fremont, CA
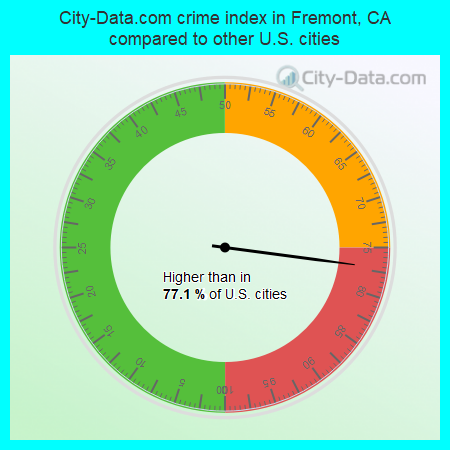
The 2022 crime rate in Fremont, CA is 212 (City-Data.com crime index), which is about the average for the U.S. cities. It was higher than in 77.1% U.S. cities. The 2022 Fremont crime rate rose by 26% compared to 2020. The number of homicides stood at 4 - an increase of 2 compared to 2020. In the last 5 years Fremont has seen decreasing violent crime and increasing property crime.See how dangerous Fremont, CA is compared to the nearest cities:
(Note: Higher means more crime)
(Note: Higher means more crime)
| Fremont: | 212.0 |
| Newark: | 342.8 |
| Union City: | 221.3 |
| Hayward: | 285.1 |
| Milpitas: | 253.3 |
| East Palo Alto: | 336.8 |
| Pleasanton: | 116.1 |
| Palo Alto: | 202.0 |
| Mountain View: | 222.4 |
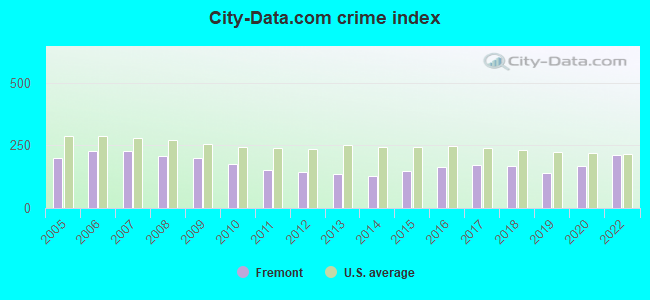
The City-Data.com crime index weighs serious crimes and violent crimes more heavily. Higher means more crime, U.S. average is 246.1. It adjusts for the number of visitors and daily workers commuting into cities.
- means the value is smaller than the state average.- means the value is about the same as the state average.
- means the value is bigger than the state average.
- means the value is much bigger than the state average.
According to our research of California and other state lists, there were 243 registered sex offenders living in Fremont, California as of June 01, 2024.
The ratio of all residents to sex offenders in Fremont is 959 to 1.
The ratio of registered sex offenders to all residents in this city is lower than the state average.

Violent crime rate in 2022
| Fremont: | 115.7 |
| U.S. Average: | 219.8 |
Violent crime rate in 2020
| Fremont: | 90.3 |
| U.S. Average: | 228.2 |
Violent crime rate in 2019
| Fremont: | 91.1 |
| U.S. Average: | 219.9 |
Violent crime rate in 2018
| Fremont: | 118.9 |
| U.S. Average: | 221.2 |
Violent crime rate in 2017
| Fremont: | 106.8 |
| U.S. Average: | 226.2 |
Violent crime rate in 2016
| Fremont: | 101.5 |
| U.S. Average: | 227.3 |
Violent crime rate in 2015
| Fremont: | 84.3 |
| U.S. Average: | 219.3 |
Violent crime rate in 2014
| Fremont: | 67.5 |
| U.S. Average: | 211.1 |
Violent crime rate in 2013
| Fremont: | 67.0 |
| U.S. Average: | 214.2 |
Violent crime rate in 2012
| Fremont: | 74.5 |
| U.S. Average: | 187.4 |
Violent crime rate in 2011
| Fremont: | 98.1 |
| U.S. Average: | 187.1 |
Violent crime rate in 2010
| Fremont: | 125.4 |
| U.S. Average: | 195.7 |
Violent crime rate in 2009
| Fremont: | 130.7 |
| U.S. Average: | 208.9 |
Violent crime rate in 2008
| Fremont: | 153.8 |
| U.S. Average: | 222.5 |
Violent crime rate in 2007
| Fremont: | 164.4 |
| U.S. Average: | 229.1 |
Violent crime rate in 2006
| Fremont: | 153.7 |
| U.S. Average: | 232.6 |
Violent crime rate in 2005
| Fremont: | 139.7 |
| U.S. Average: | 227.0 |
Property crime rate in 2022
| Fremont: | 264.6 |
| U.S. Average: | 166.5 |
Property crime rate in 2020
| Fremont: | 213.6 |
| U.S. Average: | 169.6 |
Property crime rate in 2019
| Fremont: | 151.5 |
| U.S. Average: | 179.7 |
Property crime rate in 2018
| Fremont: | 172.5 |
| U.S. Average: | 190.2 |
Property crime rate in 2017
| Fremont: | 186.8 |
| U.S. Average: | 206.4 |
Property crime rate in 2016
| Fremont: | 192.3 |
| U.S. Average: | 216.6 |
Property crime rate in 2015
| Fremont: | 183.2 |
| U.S. Average: | 221.5 |
Property crime rate in 2014
| Fremont: | 171.3 |
| U.S. Average: | 230.8 |
Property crime rate in 2013
| Fremont: | 184.1 |
| U.S. Average: | 250.4 |
Property crime rate in 2012
| Fremont: | 204.4 |
| U.S. Average: | 267.3 |
Property crime rate in 2011
| Fremont: | 195.2 |
| U.S. Average: | 273.5 |
Property crime rate in 2010
| Fremont: | 207.7 |
| U.S. Average: | 276.4 |
Property crime rate in 2009
| Fremont: | 238.0 |
| U.S. Average: | 285.6 |
Property crime rate in 2008
| Fremont: | 238.3 |
| U.S. Average: | 302.2 |
Property crime rate in 2007
| Fremont: | 265.6 |
| U.S. Average: | 309.2 |
Property crime rate in 2006
| Fremont: | 274.3 |
| U.S. Average: | 317.3 |
Property crime rate in 2005
| Fremont: | 231.6 |
| U.S. Average: | 322.3 |


Full-time law enforcement employees in 2021, including police officers: 289 (189 officers - 169 male; 20 female).
| Officers per 1,000 residents here: | 0.80 |
| California average: | 2.30 |
Full-time law enforcement employees in 2020, including police officers: 301 (195 officers - 172 male; 23 female).
| Officers per 1,000 residents here: | 0.80 |
| California average: | 2.36 |
Full-time law enforcement employees in 2019, including police officers: 281 (181 officers - 160 male; 21 female).
| Officers per 1,000 residents here: | 0.75 |
| California average: | 2.35 |
Full-time law enforcement employees in 2018, including police officers: 278 (181 officers - 162 male; 19 female).
| Officers per 1,000 residents here: | 0.76 |
| California average: | 2.34 |
Full-time law enforcement employees in 2017, including police officers: 278 (178 officers - 162 male; 16 female).
| Officers per 1,000 residents here: | 0.75 |
| California average: | 2.32 |
Full-time law enforcement employees in 2016, including police officers: 282 (180 officers - 165 male; 15 female).
| Officers per 1,000 residents here: | 0.76 |
| California average: | 2.32 |
Full-time law enforcement employees in 2015, including police officers: 280 (180 officers - 163 male; 17 female).
| Officers per 1,000 residents here: | 0.77 |
| California average: | 1.98 |
Full-time law enforcement employees in 2014, including police officers: 276 (181 officers - 162 male; 19 female).
| Officers per 1,000 residents here: | 0.80 |
| California average: | 2.00 |
Full-time law enforcement employees in 2013, including police officers: 267 (169 officers - 149 male; 20 female).
| Officers per 1,000 residents here: | 0.75 |
| California average: | 2.34 |
Full-time law enforcement employees in 2012, including police officers: 273 (175 officers - 155 male; 20 female).
| Officers per 1,000 residents here: | 0.80 |
| California average: | 2.36 |
Full-time law enforcement employees in 2011, including police officers: 265 (166 officers - 148 male; 18 female).
| Officers per 1,000 residents here: | 0.77 |
| California average: | 2.09 |
Full-time law enforcement employees in 2010, including police officers: 277 (178 officers - 161 male; 17 female).
| Officers per 1,000 residents here: | 0.83 |
| California average: | 2.46 |
Full-time law enforcement employees in 2009, including police officers: 275 (177 officers - 161 male; 16 female).
| Officers per 1,000 residents here: | 0.87 |
| California average: | 2.52 |
Full-time law enforcement employees in 2008, including police officers: 281 (179 officers - 165 male; 14 female).
| Officers per 1,000 residents here: | 0.89 |
| California average: | 2.55 |
Full-time law enforcement employees in 2007, including police officers: 292 (190 officers - 174 male; 16 female).
| Officers per 1,000 residents here: | 0.94 |
| California average: | 2.48 |
Full-time law enforcement employees in 2006, including police officers: 291 (188 officers - 173 male; 15 female).
| Officers per 1,000 residents here: | 0.93 |
| California average: | 2.38 |
Full-time law enforcement employees in 2005, including police officers: 288 (181 officers - 164 male; 17 female).
| Officers per 1,000 residents here: | 0.89 |
| California average: | 2.34 |
Full-time law enforcement employees in 2004, including police officers: 300 (192 officers - 174 male; 18 female).
| Officers per 1,000 residents here: | 0.93 |
| California average: | 2.36 |
Full-time law enforcement employees in 2003, including police officers: 292 (186 officers - 167 male; 19 female).
| Officers per 1,000 residents here: | 0.89 |
| California average: | 2.42 |


