Crime rate in El Paso, Texas (TX): murders, rapes, robberies, assaults, burglaries, thefts, auto thefts, arson, law enforcement employees, police officers, crime map
Crime rate in El Paso, TX
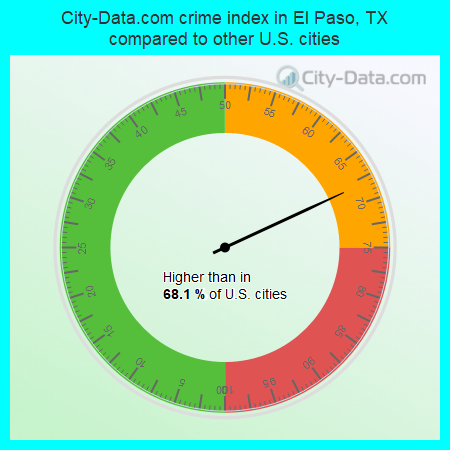
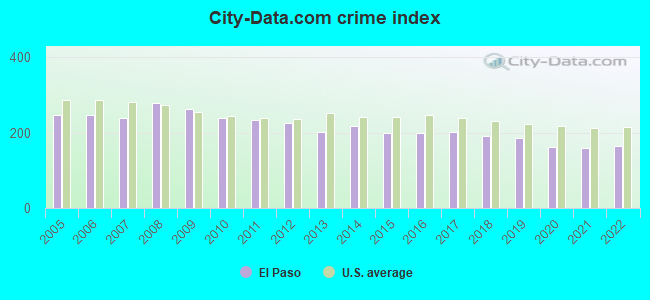
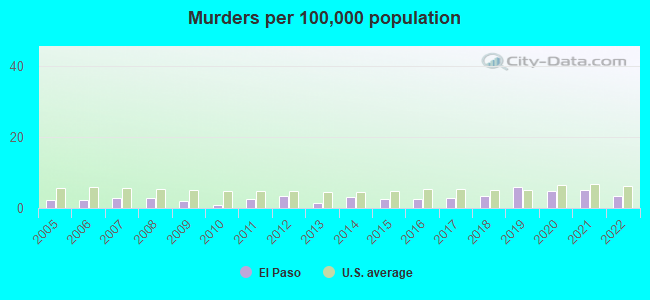
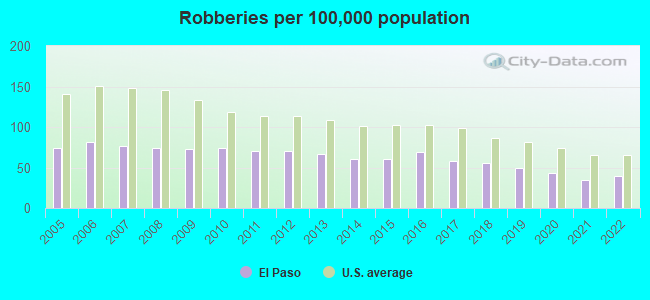
The 2022 crime rate in El Paso, TX is 166 (City-Data.com crime index), which is 1.5 times lower than the U.S. average. It was higher than in 68.1% U.S. cities. The 2022 El Paso crime rate rose by 4% compared to 2021. The number of homicides stood at 22 - a decrease of 12 compared to 2021. In the last 5 years El Paso has seen decline of violent crime and decline of property crime.See how dangerous El Paso, TX is compared to the nearest cities:
(Note: Higher means more crime)
(Note: Higher means more crime)
| El Paso: | 166.2 |
| Sunland Park: | 149.2 |
| Socorro: | 135.1 |
| Horizon City: | 80.2 |
| San Elizario: | 24.6 |
| Anthony: | 144.7 |
| Clint: | 3.5 |
| Anthony: | 75.2 |
| Mesilla: | 118.0 |
The City-Data.com crime index weighs serious crimes and violent crimes more heavily. Higher means more crime, U.S. average is 246.1. It adjusts for the number of visitors and daily workers commuting into cities.
- means the value is smaller than the state average.- means the value is about the same as the state average.
- means the value is bigger than the state average.
- means the value is much bigger than the state average.
According to our research of Texas and other state lists, there were 1,272 registered sex offenders living in El Paso, Texas as of May 20, 2024.
The ratio of all residents to sex offenders in El Paso is 537 to 1.
The ratio of registered sex offenders to all residents in this city is lower than the state average.
Violent crime rate in 2022
| El Paso: | 183.0 |
| U.S. Average: | 219.8 |
Violent crime rate in 2021
| El Paso: | 166.6 |
| U.S. Average: | 224.8 |
Violent crime rate in 2020
| El Paso: | 191.8 |
| U.S. Average: | 228.2 |
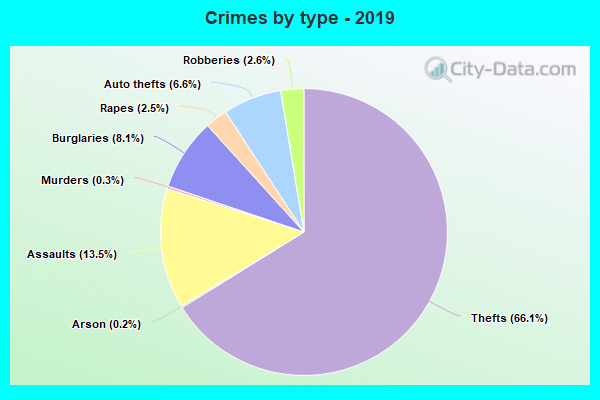
Violent crime rate in 2019
| El Paso: | 212.0 |
| U.S. Average: | 219.9 |
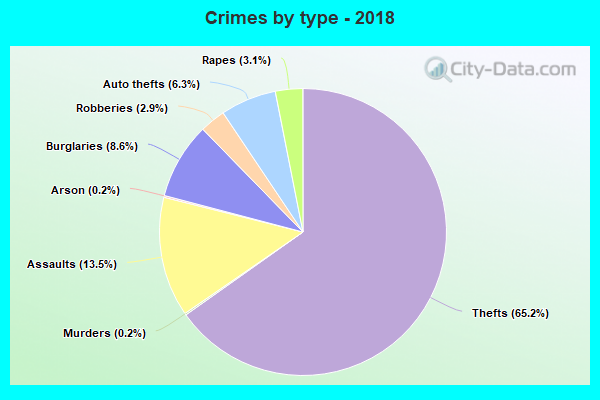
Violent crime rate in 2018
| El Paso: | 219.9 |
| U.S. Average: | 221.2 |
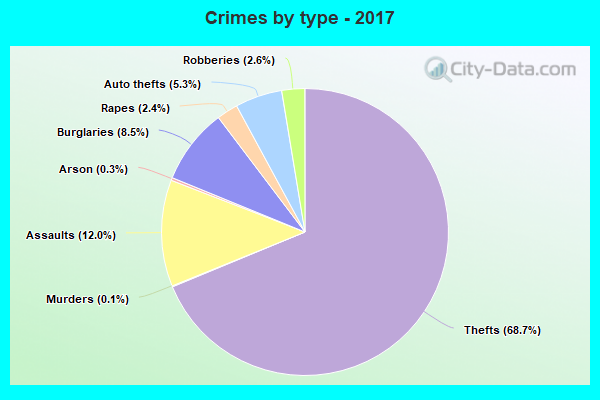
Violent crime rate in 2017
| El Paso: | 220.5 |
| U.S. Average: | 226.2 |
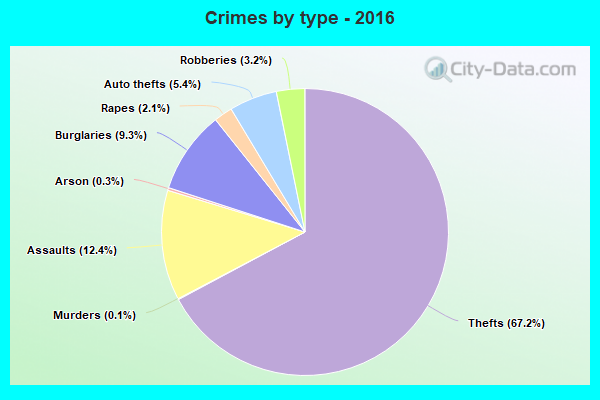
Violent crime rate in 2016
| El Paso: | 221.7 |
| U.S. Average: | 227.3 |
Violent crime rate in 2015
| El Paso: | 210.5 |
| U.S. Average: | 219.3 |
Violent crime rate in 2014
| El Paso: | 225.6 |
| U.S. Average: | 211.1 |
Violent crime rate in 2013
| El Paso: | 200.7 |
| U.S. Average: | 214.2 |
Violent crime rate in 2012
| El Paso: | 230.3 |
| U.S. Average: | 187.4 |
Violent crime rate in 2011
| El Paso: | 235.6 |
| U.S. Average: | 187.1 |
Violent crime rate in 2010
| El Paso: | 235.3 |
| U.S. Average: | 195.7 |
Violent crime rate in 2009
| El Paso: | 246.3 |
| U.S. Average: | 208.9 |
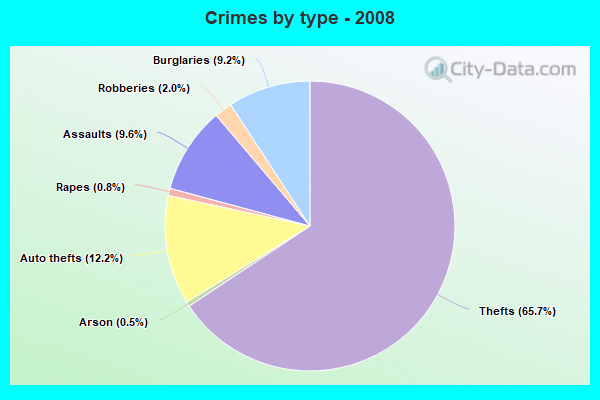
Violent crime rate in 2008
| El Paso: | 249.6 |
| U.S. Average: | 222.5 |
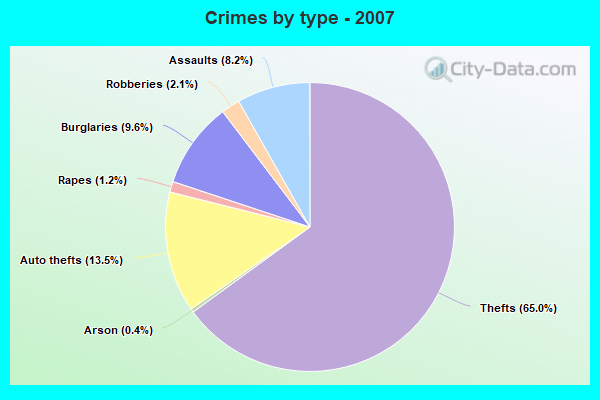
Violent crime rate in 2007
| El Paso: | 200.0 |
| U.S. Average: | 229.1 |
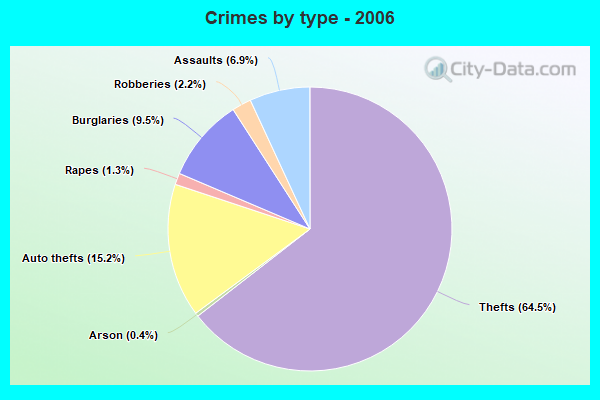
Violent crime rate in 2006
| El Paso: | 191.7 |
| U.S. Average: | 232.6 |
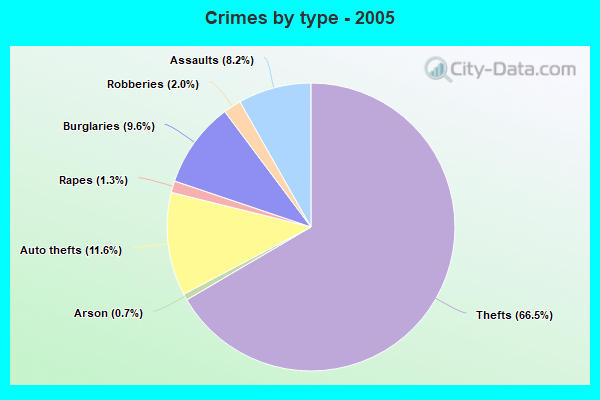
Violent crime rate in 2005
| El Paso: | 210.4 |
| U.S. Average: | 227.0 |
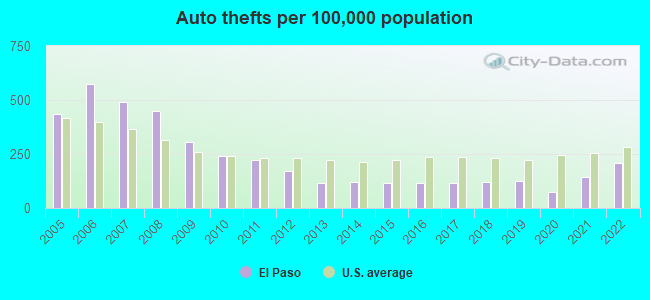
Property crime rate in 2022
| El Paso: | 111.2 |
| U.S. Average: | 166.5 |
Property crime rate in 2021
| El Paso: | 104.8 |
| U.S. Average: | 157.8 |
Property crime rate in 2020
| El Paso: | 91.4 |
| U.S. Average: | 169.6 |
Property crime rate in 2019
| El Paso: | 112.6 |
| U.S. Average: | 179.7 |
Property crime rate in 2018
| El Paso: | 111.3 |
| U.S. Average: | 190.2 |
Property crime rate in 2017
| El Paso: | 130.8 |
| U.S. Average: | 206.4 |
Property crime rate in 2016
| El Paso: | 132.5 |
| U.S. Average: | 216.6 |
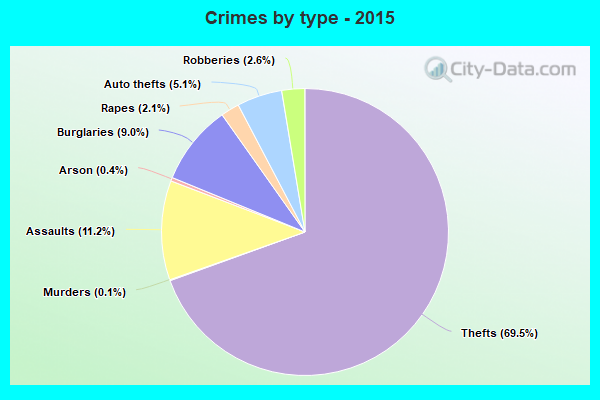
Property crime rate in 2015
| El Paso: | 138.4 |
| U.S. Average: | 221.5 |
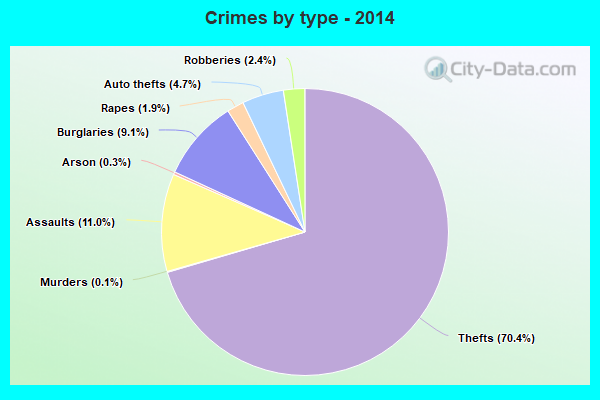
Property crime rate in 2014
| El Paso: | 154.0 |
| U.S. Average: | 230.8 |
Property crime rate in 2013
| El Paso: | 165.2 |
| U.S. Average: | 250.4 |
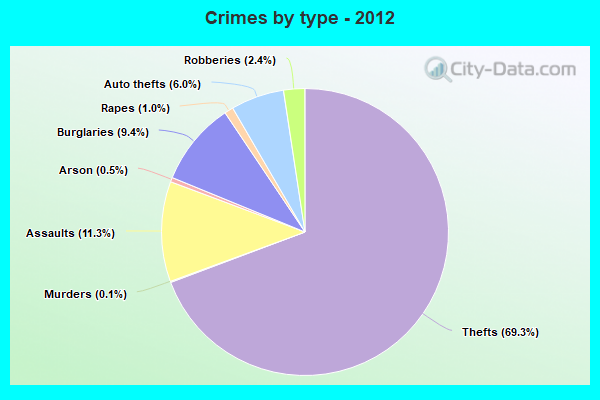
Property crime rate in 2012
| El Paso: | 179.2 |
| U.S. Average: | 267.3 |
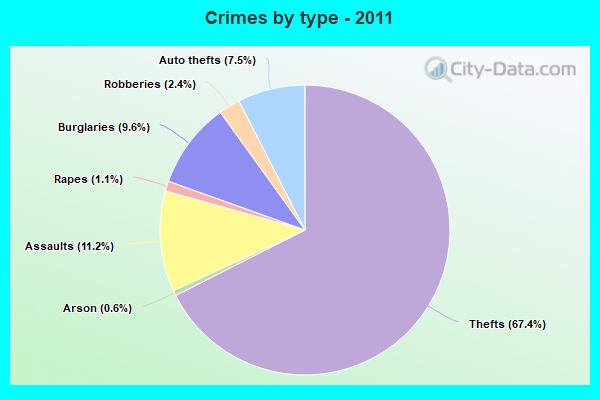
Property crime rate in 2011
| El Paso: | 187.1 |
| U.S. Average: | 273.5 |
Property crime rate in 2010
| El Paso: | 203.1 |
| U.S. Average: | 276.4 |
Property crime rate in 2009
| El Paso: | 228.5 |
| U.S. Average: | 285.6 |
Property crime rate in 2008
| El Paso: | 256.7 |
| U.S. Average: | 302.2 |
Property crime rate in 2007
| El Paso: | 223.5 |
| U.S. Average: | 309.2 |
Property crime rate in 2006
| El Paso: | 239.3 |
| U.S. Average: | 317.3 |
Property crime rate in 2005
| El Paso: | 223.3 |
| U.S. Average: | 322.3 |
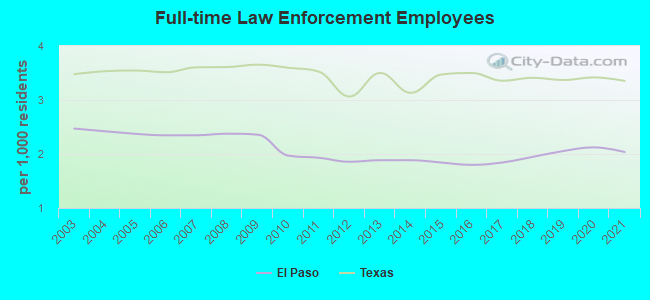
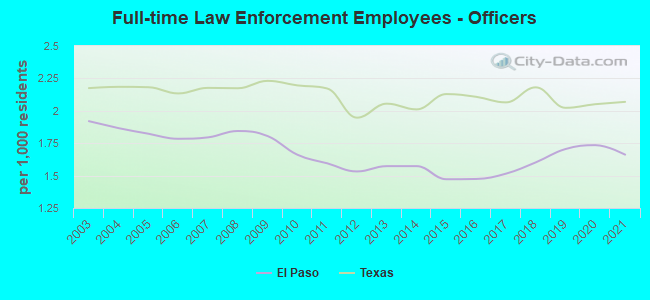
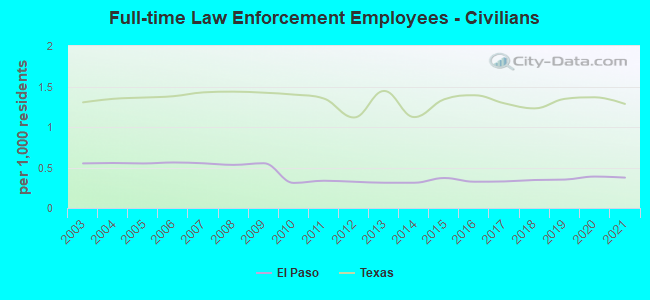
Full-time law enforcement employees in 2021, including police officers: 1,395 (1,138 officers - 979 male; 159 female).
| Officers per 1,000 residents here: | 1.66 |
| Texas average: | 2.07 |
Full-time law enforcement employees in 2020, including police officers: 1,455 (1,189 officers - 1,024 male; 165 female).
| Officers per 1,000 residents here: | 1.74 |
| Texas average: | 2.05 |
Full-time law enforcement employees in 2019, including police officers: 1,412 (1,171 officers - 1,008 male; 163 female).
| Officers per 1,000 residents here: | 1.71 |
| Texas average: | 2.02 |
Full-time law enforcement employees in 2018, including police officers: 1,341 (1,103 officers - 959 male; 144 female).
| Officers per 1,000 residents here: | 1.60 |
| Texas average: | 2.18 |
Full-time law enforcement employees in 2017, including police officers: 1,269 (1,043 officers - 911 male; 132 female).
| Officers per 1,000 residents here: | 1.51 |
| Texas average: | 2.06 |
Full-time law enforcement employees in 2016, including police officers: 1,236 (1,013 officers - 894 male; 119 female).
| Officers per 1,000 residents here: | 1.47 |
| Texas average: | 2.11 |
Full-time law enforcement employees in 2015, including police officers: 1,264 (1,010 officers - 893 male; 117 female).
| Officers per 1,000 residents here: | 1.47 |
| Texas average: | 2.13 |
Full-time law enforcement employees in 2013, including police officers: 1,281 (1,069 officers - 942 male; 127 female).
| Officers per 1,000 residents here: | 1.57 |
| Texas average: | 2.05 |
Full-time law enforcement employees in 2012, including police officers: 1,254 (1,035 officers - 918 male; 117 female).
| Officers per 1,000 residents here: | 1.53 |
| Texas average: | 1.95 |
Full-time law enforcement employees in 2011, including police officers: 1,280 (1,057 officers - 935 male; 122 female).
| Officers per 1,000 residents here: | 1.59 |
| Texas average: | 2.17 |
Full-time law enforcement employees in 2010, including police officers: 1,279 (1,078 officers - 952 male; 126 female).
| Officers per 1,000 residents here: | 1.66 |
| Texas average: | 2.20 |
Full-time law enforcement employees in 2009, including police officers: 1,459 (1,117 officers - 988 male; 129 female).
| Officers per 1,000 residents here: | 1.81 |
| Texas average: | 2.23 |
Full-time law enforcement employees in 2008, including police officers: 1,455 (1,129 officers - 1,000 male; 129 female).
| Officers per 1,000 residents here: | 1.84 |
| Texas average: | 2.17 |
Full-time law enforcement employees in 2007, including police officers: 1,446 (1,106 officers - 977 male; 129 female).
| Officers per 1,000 residents here: | 1.80 |
| Texas average: | 2.18 |
Full-time law enforcement employees in 2006, including police officers: 1,444 (1,098 officers - 978 male; 120 female).
| Officers per 1,000 residents here: | 1.78 |
| Texas average: | 2.13 |
Full-time law enforcement employees in 2005, including police officers: 1,428 (1,097 officers - 981 male; 116 female).
| Officers per 1,000 residents here: | 1.82 |
| Texas average: | 2.18 |
Full-time law enforcement employees in 2004, including police officers: 1,438 (1,108 officers - 997 male; 111 female).
| Officers per 1,000 residents here: | 1.87 |
| Texas average: | 2.19 |
Full-time law enforcement employees in 2003, including police officers: 1,449 (1,126 officers - 1,014 male; 112 female).
| Officers per 1,000 residents here: | 1.92 |
| Texas average: | 2.17 |


Zip codes: 79901, 79902, 79903, 79904, 79905, 79906, 79907, 79908, 79911, 79912, 79915, 79920, 79922, 79924, 79925, 79927, 79930, 79934, 79935, 79936.