Crime rate in Coral Gables, Florida (FL): murders, rapes, robberies, assaults, burglaries, thefts, auto thefts, arson, law enforcement employees, police officers, crime map
Crime rate in Coral Gables, FL
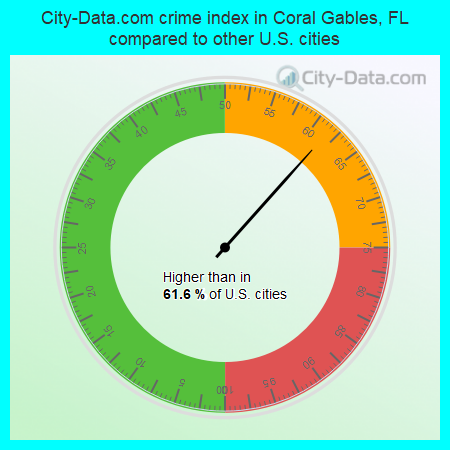
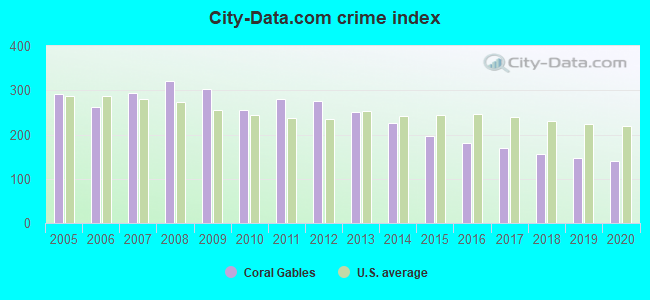
The 2020 crime rate in Coral Gables, FL is 139 (City-Data.com crime index), which is 1.8 times lower than the U.S. average. It was higher than in 61.6% U.S. cities. The 2020 Coral Gables crime rate fell by 6% compared to 2019. In the last 5 years Coral Gables has seen decline of violent crime and decline of property crime.See how dangerous Coral Gables, FL is compared to the nearest cities:
(Note: Higher means more crime)
(Note: Higher means more crime)
| Coral Gables: | 138.8 |
| South Miami: | 265.8 |
| West Miami: | 97.4 |
| Miami: | 137.1 |
| Pinecrest: | 134.4 |
| Virginia Gardens: | 79.1 |
| Miami Springs: | 301.0 |
| Sweetwater: | 61.9 |
| Key Biscayne: | 74.0 |
The City-Data.com crime index weighs serious crimes and violent crimes more heavily. Higher means more crime, U.S. average is 246.1. It adjusts for the number of visitors and daily workers commuting into cities.
- means the value is smaller than the state average.- means the value is about the same as the state average.
- means the value is bigger than the state average.
- means the value is much bigger than the state average.
According to our research of Florida and other state lists, there were 9 registered sex offenders living in Coral Gables, Florida as of May 22, 2024.
The ratio of all residents to sex offenders in Coral Gables is 5,717 to 1.
The ratio of registered sex offenders to all residents in this city is much lower than the state average.

Violent crime rate in 2020
| Coral Gables: | 58.0 |
| U.S. Average: | 228.2 |
Violent crime rate in 2019
| Coral Gables: | 52.4 |
| U.S. Average: | 219.9 |
Violent crime rate in 2018
| Coral Gables: | 82.2 |
| U.S. Average: | 221.2 |
Violent crime rate in 2017
| Coral Gables: | 85.5 |
| U.S. Average: | 226.2 |
Violent crime rate in 2016
| Coral Gables: | 81.8 |
| U.S. Average: | 227.3 |
Violent crime rate in 2015
| Coral Gables: | 85.0 |
| U.S. Average: | 219.3 |
Violent crime rate in 2014
| Coral Gables: | 80.5 |
| U.S. Average: | 211.1 |
Violent crime rate in 2013
| Coral Gables: | 86.6 |
| U.S. Average: | 214.2 |
Violent crime rate in 2012
| Coral Gables: | 95.0 |
| U.S. Average: | 187.4 |
Violent crime rate in 2011
| Coral Gables: | 105.4 |
| U.S. Average: | 187.1 |
Violent crime rate in 2010
| Coral Gables: | 109.0 |
| U.S. Average: | 195.7 |
Violent crime rate in 2009
| Coral Gables: | 123.9 |
| U.S. Average: | 208.9 |
Violent crime rate in 2008
| Coral Gables: | 142.2 |
| U.S. Average: | 222.5 |
Violent crime rate in 2007
| Coral Gables: | 146.9 |
| U.S. Average: | 229.1 |
Violent crime rate in 2006
| Coral Gables: | 123.1 |
| U.S. Average: | 232.6 |
Violent crime rate in 2005
| Coral Gables: | 158.0 |
| U.S. Average: | 227.0 |
Property crime rate in 2020
| Coral Gables: | 170.9 |
| U.S. Average: | 169.6 |
Property crime rate in 2019
| Coral Gables: | 192.1 |
| U.S. Average: | 179.7 |
Property crime rate in 2018
| Coral Gables: | 167.5 |
| U.S. Average: | 190.2 |
Property crime rate in 2017
| Coral Gables: | 197.9 |
| U.S. Average: | 206.4 |
Property crime rate in 2016
| Coral Gables: | 219.0 |
| U.S. Average: | 216.6 |
Property crime rate in 2015
| Coral Gables: | 238.5 |
| U.S. Average: | 221.5 |
Property crime rate in 2014
| Coral Gables: | 307.6 |
| U.S. Average: | 230.8 |
Property crime rate in 2013
| Coral Gables: | 353.5 |
| U.S. Average: | 250.4 |
Property crime rate in 2012
| Coral Gables: | 384.6 |
| U.S. Average: | 267.3 |
Property crime rate in 2011
| Coral Gables: | 383.3 |
| U.S. Average: | 273.5 |
Property crime rate in 2010
| Coral Gables: | 343.2 |
| U.S. Average: | 276.4 |
Property crime rate in 2009
| Coral Gables: | 430.8 |
| U.S. Average: | 285.6 |
Property crime rate in 2008
| Coral Gables: | 430.0 |
| U.S. Average: | 302.2 |
Property crime rate in 2007
| Coral Gables: | 374.5 |
| U.S. Average: | 309.2 |
Property crime rate in 2006
| Coral Gables: | 348.9 |
| U.S. Average: | 317.3 |
Property crime rate in 2005
| Coral Gables: | 391.9 |
| U.S. Average: | 322.3 |


Full-time law enforcement employees in 2021, including police officers: 283 (193 officers - 158 male; 35 female).
| Officers per 1,000 residents here: | 3.91 |
| Florida average: | 2.33 |
Full-time law enforcement employees in 2020, including police officers: 268 (178 officers - 150 male; 28 female).
| Officers per 1,000 residents here: | 3.56 |
| Florida average: | 2.26 |
Full-time law enforcement employees in 2019, including police officers: 240 (169 officers - 143 male; 26 female).
| Officers per 1,000 residents here: | 3.28 |
| Florida average: | 2.40 |
Full-time law enforcement employees in 2018, including police officers: 255 (182 officers - 153 male; 29 female).
| Officers per 1,000 residents here: | 3.52 |
| Florida average: | 2.21 |
Full-time law enforcement employees in 2017, including police officers: 252 (170 officers - 148 male; 22 female).
| Officers per 1,000 residents here: | 3.30 |
| Florida average: | 2.41 |
Full-time law enforcement employees in 2016, including police officers: 229 (160 officers - 141 male; 19 female).
| Officers per 1,000 residents here: | 3.08 |
| Florida average: | 2.36 |
Full-time law enforcement employees in 2015, including police officers: 229 (171 officers - 151 male; 20 female).
| Officers per 1,000 residents here: | 3.27 |
| Florida average: | 2.39 |
Full-time law enforcement employees in 2014, including police officers: 242 (169 officers - 150 male; 19 female).
| Officers per 1,000 residents here: | 3.36 |
| Florida average: | 2.29 |
Full-time law enforcement employees in 2012, including police officers: 243 (175 officers - 157 male; 18 female).
| Officers per 1,000 residents here: | 3.61 |
| Florida average: | 2.45 |
Full-time law enforcement employees in 2011, including police officers: 239 (170 officers - 153 male; 17 female).
| Officers per 1,000 residents here: | 3.59 |
| Florida average: | 2.35 |
Full-time law enforcement employees in 2010, including police officers: 239 (170 officers - 153 male; 17 female).
| Officers per 1,000 residents here: | 3.63 |
| Florida average: | 2.47 |
Full-time law enforcement employees in 2009, including police officers: 251 (177 officers - 160 male; 17 female).
| Officers per 1,000 residents here: | 4.14 |
| Florida average: | 2.50 |
Full-time law enforcement employees in 2008, including police officers: 259 (185 officers - 164 male; 21 female).
| Officers per 1,000 residents here: | 4.46 |
| Florida average: | 2.43 |
Full-time law enforcement employees in 2007, including police officers: 257 (185 officers - 167 male; 18 female).
| Officers per 1,000 residents here: | 4.32 |
| Florida average: | 2.45 |
Full-time law enforcement employees in 2006, including police officers: 258 (184 officers - 166 male; 18 female).
| Officers per 1,000 residents here: | 4.22 |
| Florida average: | 2.54 |
Full-time law enforcement employees in 2005, including police officers: 259 (178 officers - 157 male; 21 female).
| Officers per 1,000 residents here: | 4.10 |
| Florida average: | 2.40 |
Full-time law enforcement employees in 2004, including police officers: 250 (167 officers - 147 male; 20 female).
| Officers per 1,000 residents here: | 3.84 |
| Florida average: | 2.53 |
Full-time law enforcement employees in 2003, including police officers: 241 (165 officers - 144 male; 21 female).
| Officers per 1,000 residents here: | 3.80 |
| Florida average: | 2.55 |


Zip codes: 33133, 33134, 33135, 33143, 33146, 33155, 33156, 33157, 33158.