Crime rate in Columbus, Georgia (GA): murders, rapes, robberies, assaults, burglaries, thefts, auto thefts, arson, law enforcement employees, police officers, crime map
Crime rate in Columbus, GA
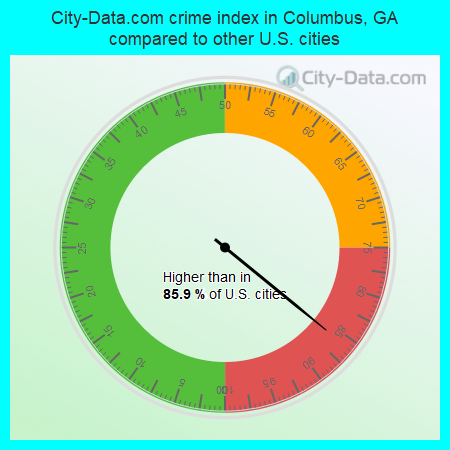
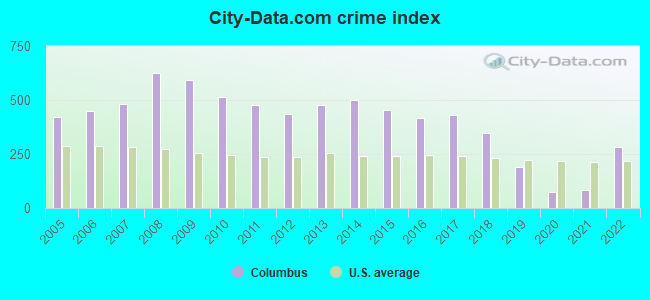
The 2022 crime rate in Columbus, GA is 281 (City-Data.com crime index), which is about the average for the U.S. cities. It was higher than in 85.9% U.S. cities. The 2022 Columbus crime rate rose by 240% compared to 2021. The number of homicides stood at 19 - an increase of 12 compared to 2021. In the last 5 years Columbus has seen increasing violent crime and decreasing property crime.See how dangerous Columbus, GA is compared to the nearest cities:
(Note: Higher means more crime)
(Note: Higher means more crime)
| Columbus: | 280.9 |
| Phenix City: | 449.6 |
| Waverly Hall: | 6.3 |
| Hamilton: | 6.5 |
| Pine Mountain: | 79.6 |
| Valley: | 405.0 |
| Shiloh: | 26.1 |
| Talbotton: | 128.0 |
| Buena Vista: | 1.9 |
The City-Data.com crime index weighs serious crimes and violent crimes more heavily. Higher means more crime, U.S. average is 246.1. It adjusts for the number of visitors and daily workers commuting into cities.
- means the value is smaller than the state average.- means the value is about the same as the state average.
- means the value is bigger than the state average.
- means the value is much bigger than the state average.
According to our research of Georgia and other state lists, there were 734 registered sex offenders living in Columbus, Georgia as of May 23, 2024.
The ratio of all residents to sex offenders in Columbus is 253 to 1.
Violent crime rate in 2022
| Columbus: | 342.2 |
| U.S. Average: | 219.8 |
Violent crime rate in 2021
| Columbus: | 100.7 |
| U.S. Average: | 224.8 |
Violent crime rate in 2020
| Columbus: | 80.9 |
| U.S. Average: | 228.2 |
Violent crime rate in 2019
| Columbus: | 174.2 |
| U.S. Average: | 219.9 |
Violent crime rate in 2018
| Columbus: | 306.0 |
| U.S. Average: | 221.2 |
Violent crime rate in 2017
| Columbus: | 373.7 |
| U.S. Average: | 226.2 |
Violent crime rate in 2016
| Columbus: | 321.0 |
| U.S. Average: | 227.3 |
Violent crime rate in 2015
| Columbus: | 308.4 |
| U.S. Average: | 219.3 |
Violent crime rate in 2014
| Columbus: | 293.6 |
| U.S. Average: | 211.1 |
Violent crime rate in 2013
| Columbus: | 279.4 |
| U.S. Average: | 214.2 |
Violent crime rate in 2012
| Columbus: | 274.2 |
| U.S. Average: | 187.4 |
Violent crime rate in 2011
| Columbus: | 264.6 |
| U.S. Average: | 187.1 |
Violent crime rate in 2010
| Columbus: | 286.5 |
| U.S. Average: | 195.7 |
Violent crime rate in 2009
| Columbus: | 332.7 |
| U.S. Average: | 208.9 |
Violent crime rate in 2008
| Columbus: | 385.6 |
| U.S. Average: | 222.5 |
Violent crime rate in 2007
| Columbus: | 313.8 |
| U.S. Average: | 229.1 |
Violent crime rate in 2006
| Columbus: | 269.7 |
| U.S. Average: | 232.6 |
Violent crime rate in 2005
| Columbus: | 236.3 |
| U.S. Average: | 227.0 |
Property crime rate in 2022
| Columbus: | 192.3 |
| U.S. Average: | 166.5 |
Property crime rate in 2021
| Columbus: | 52.6 |
| U.S. Average: | 157.8 |
Property crime rate in 2020
| Columbus: | 50.1 |
| U.S. Average: | 169.6 |
Property crime rate in 2019
| Columbus: | 162.6 |
| U.S. Average: | 179.7 |
Property crime rate in 2018
| Columbus: | 309.8 |
| U.S. Average: | 190.2 |
Property crime rate in 2017
| Columbus: | 418.5 |
| U.S. Average: | 206.4 |
Property crime rate in 2016
| Columbus: | 446.6 |
| U.S. Average: | 216.6 |
Property crime rate in 2015
| Columbus: | 517.5 |
| U.S. Average: | 221.5 |
Property crime rate in 2014
| Columbus: | 649.6 |
| U.S. Average: | 230.8 |
Property crime rate in 2013
| Columbus: | 615.3 |
| U.S. Average: | 250.4 |
Property crime rate in 2012
| Columbus: | 537.4 |
| U.S. Average: | 267.3 |
Property crime rate in 2011
| Columbus: | 638.7 |
| U.S. Average: | 273.5 |
Property crime rate in 2010
| Columbus: | 679.8 |
| U.S. Average: | 276.4 |
Property crime rate in 2009
| Columbus: | 781.2 |
| U.S. Average: | 285.6 |
Property crime rate in 2008
| Columbus: | 740.3 |
| U.S. Average: | 302.2 |
Property crime rate in 2007
| Columbus: | 549.2 |
| U.S. Average: | 309.2 |
Property crime rate in 2006
| Columbus: | 554.5 |
| U.S. Average: | 317.3 |
Property crime rate in 2005
| Columbus: | 535.6 |
| U.S. Average: | 322.3 |


Full-time law enforcement employees in 2021, including police officers: 429 (336 officers - 264 male; 72 female).
| Officers per 1,000 residents here: | 1.71 |
| Georgia average: | 2.45 |
Full-time law enforcement employees in 2020, including police officers: 487 (386 officers - 310 male; 76 female).
| Officers per 1,000 residents here: | 1.97 |
| Georgia average: | 2.63 |
Full-time law enforcement employees in 2018, including police officers: 503 (403 officers - 334 male; 69 female).
| Officers per 1,000 residents here: | 2.08 |
| Georgia average: | 2.75 |
Full-time law enforcement employees in 2014, including police officers: 559 (461 officers - 385 male; 76 female).
| Officers per 1,000 residents here: | 2.23 |
| Georgia average: | 2.60 |
Full-time law enforcement employees in 2013, including police officers: 552 (454 officers - 376 male; 78 female).
| Officers per 1,000 residents here: | 2.26 |
| Georgia average: | 2.73 |
Full-time law enforcement employees in 2012, including police officers: 568 (467 officers - 392 male; 75 female).
| Officers per 1,000 residents here: | 2.38 |
| Georgia average: | 2.77 |
Full-time law enforcement employees in 2011, including police officers: 569 (464 officers - 387 male; 77 female).
| Officers per 1,000 residents here: | 2.41 |
| Georgia average: | 2.78 |
Full-time law enforcement employees in 2010, including police officers: 582 (480 officers - 397 male; 83 female).
| Officers per 1,000 residents here: | 2.53 |
| Georgia average: | 2.86 |
Full-time law enforcement employees in 2009, including police officers: 562 (462 officers - 388 male; 74 female).
| Officers per 1,000 residents here: | 2.48 |
| Georgia average: | 2.73 |
Full-time law enforcement employees in 2008, including police officers: 495 (403 officers - 342 male; 61 female).
| Officers per 1,000 residents here: | 2.16 |
| Georgia average: | 2.72 |
Full-time law enforcement employees in 2007, including police officers: 473 (377 officers - 318 male; 59 female).
| Officers per 1,000 residents here: | 2.00 |
| Georgia average: | 2.72 |
Full-time law enforcement employees in 2006, including police officers: 452 (349 officers - 305 male; 44 female).
| Officers per 1,000 residents here: | 1.83 |
| Georgia average: | 2.56 |
Full-time law enforcement employees in 2005, including police officers: 464 (362 officers - 316 male; 46 female).
| Officers per 1,000 residents here: | 1.93 |
| Georgia average: | 2.53 |
Full-time law enforcement employees in 2004, including police officers: 470 (360 officers - 318 male; 42 female).
| Officers per 1,000 residents here: | 1.91 |
| Georgia average: | 2.62 |
Full-time law enforcement employees in 2003, including police officers: 467 (365 officers - 322 male; 43 female).
| Officers per 1,000 residents here: | 1.94 |
| Georgia average: | 2.76 |


Zip codes: 31907.