Crime rate in Cary, North Carolina (NC): murders, rapes, robberies, assaults, burglaries, thefts, auto thefts, arson, law enforcement employees, police officers, crime map
Crime rate in Cary, NC
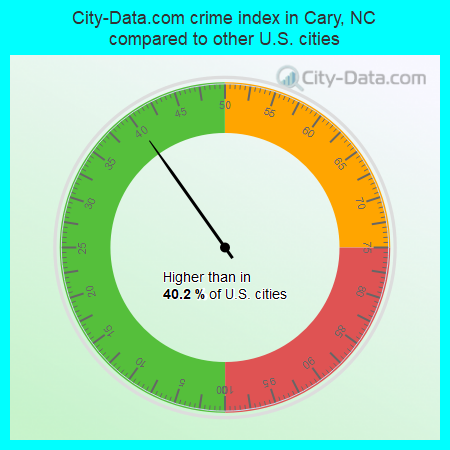
The 2022 crime rate in Cary, NC is 74 (City-Data.com crime index), which is 3.3 times smaller than the U.S. average. It was higher than in 40.2% U.S. cities. The 2022 Cary crime rate rose by 8% compared to 2021. In the last 5 years Cary has seen increasing violent crime and rise of property crime.See how dangerous Cary, NC is compared to the nearest cities:
(Note: Higher means more crime)
(Note: Higher means more crime)
| Cary: | 74.0 |
| Morrisville: | 135.4 |
| Apex: | 73.4 |
| Holly Springs: | 68.6 |
| Raleigh: | 259.5 |
| Garner: | 277.2 |
| Fuquay-Varina: | 60.4 |
| Durham: | 375.1 |
| Chapel Hill: | 149.7 |
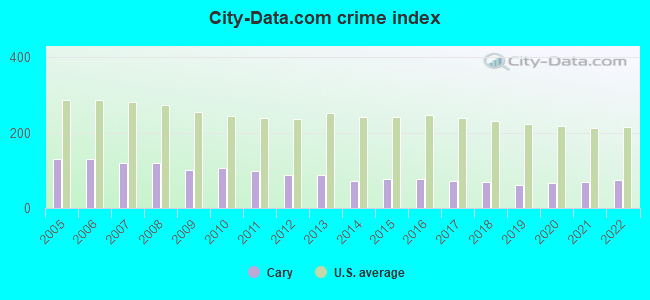
The City-Data.com crime index weighs serious crimes and violent crimes more heavily. Higher means more crime, U.S. average is 246.1. It adjusts for the number of visitors and daily workers commuting into cities.
- means the value is smaller than the state average.
According to our research of North Carolina and other state lists, there were 41 registered sex offenders living in Cary, North Carolina as of May 23, 2024.
The ratio of all residents to sex offenders in Cary is 4,000 to 1.
The ratio of registered sex offenders to all residents in this city is much lower than the state average.
Violent crime rate in 2022
| Cary: | 43.1 |
| U.S. Average: | 219.8 |
Violent crime rate in 2021
| Cary: | 44.2 |
| U.S. Average: | 224.8 |
Violent crime rate in 2020
| Cary: | 40.4 |
| U.S. Average: | 228.2 |
Violent crime rate in 2019
| Cary: | 37.7 |
| U.S. Average: | 219.9 |
Violent crime rate in 2018
| Cary: | 41.9 |
| U.S. Average: | 221.2 |
Violent crime rate in 2017
| Cary: | 41.0 |
| U.S. Average: | 226.2 |
Violent crime rate in 2016
| Cary: | 52.8 |
| U.S. Average: | 227.3 |
Violent crime rate in 2015
| Cary: | 33.1 |
| U.S. Average: | 219.3 |
Violent crime rate in 2014
| Cary: | 36.5 |
| U.S. Average: | 211.1 |
Violent crime rate in 2013
| Cary: | 39.0 |
| U.S. Average: | 214.2 |
Violent crime rate in 2012
| Cary: | 44.7 |
| U.S. Average: | 187.4 |
Violent crime rate in 2011
| Cary: | 45.3 |
| U.S. Average: | 187.1 |
Violent crime rate in 2010
| Cary: | 50.7 |
| U.S. Average: | 195.7 |
Violent crime rate in 2009
| Cary: | 53.8 |
| U.S. Average: | 208.9 |
Violent crime rate in 2008
| Cary: | 51.1 |
| U.S. Average: | 222.5 |
Violent crime rate in 2007
| Cary: | 61.7 |
| U.S. Average: | 229.1 |
Violent crime rate in 2006
| Cary: | 63.6 |
| U.S. Average: | 232.6 |
Violent crime rate in 2005
| Cary: | 71.3 |
| U.S. Average: | 227.0 |
Property crime rate in 2022
| Cary: | 88.4 |
| U.S. Average: | 166.5 |
Property crime rate in 2021
| Cary: | 69.2 |
| U.S. Average: | 157.8 |
Property crime rate in 2020
| Cary: | 71.4 |
| U.S. Average: | 169.6 |
Property crime rate in 2019
| Cary: | 65.8 |
| U.S. Average: | 179.7 |
Property crime rate in 2018
| Cary: | 74.2 |
| U.S. Average: | 190.2 |
Property crime rate in 2017
| Cary: | 83.7 |
| U.S. Average: | 206.4 |
Property crime rate in 2016
| Cary: | 75.1 |
| U.S. Average: | 216.6 |
Property crime rate in 2015
| Cary: | 93.5 |
| U.S. Average: | 221.5 |
Property crime rate in 2014
| Cary: | 90.2 |
| U.S. Average: | 230.8 |
Property crime rate in 2013
| Cary: | 113.2 |
| U.S. Average: | 250.4 |
Property crime rate in 2012
| Cary: | 111.5 |
| U.S. Average: | 267.3 |
Property crime rate in 2011
| Cary: | 121.7 |
| U.S. Average: | 273.5 |
Property crime rate in 2010
| Cary: | 144.6 |
| U.S. Average: | 276.4 |
Property crime rate in 2009
| Cary: | 133.7 |
| U.S. Average: | 285.6 |
Property crime rate in 2008
| Cary: | 159.9 |
| U.S. Average: | 302.2 |
Property crime rate in 2007
| Cary: | 151.8 |
| U.S. Average: | 309.2 |
Property crime rate in 2006
| Cary: | 179.1 |
| U.S. Average: | 317.3 |
Property crime rate in 2005
| Cary: | 160.4 |
| U.S. Average: | 322.3 |


Full-time law enforcement employees in 2021, including police officers: 216 (171 officers - 145 male; 26 female).
| Officers per 1,000 residents here: | 0.96 |
| North Carolina average: | 2.27 |
Full-time law enforcement employees in 2020, including police officers: 212 (174 officers - 150 male; 24 female).
| Officers per 1,000 residents here: | 1.00 |
| North Carolina average: | 2.31 |
Full-time law enforcement employees in 2019, including police officers: 227 (186 officers - 161 male; 25 female).
| Officers per 1,000 residents here: | 1.08 |
| North Carolina average: | 2.30 |
Full-time law enforcement employees in 2018, including police officers: 231 (190 officers - 167 male; 23 female).
| Officers per 1,000 residents here: | 1.11 |
| North Carolina average: | 2.33 |
Full-time law enforcement employees in 2017, including police officers: 227 (187 officers - 168 male; 19 female).
| Officers per 1,000 residents here: | 1.12 |
| North Carolina average: | 2.36 |
Full-time law enforcement employees in 2016, including police officers: 223 (185 officers - 163 male; 22 female).
| Officers per 1,000 residents here: | 1.12 |
| North Carolina average: | 2.38 |
Full-time law enforcement employees in 2015, including police officers: 226 (189 officers - 166 male; 23 female).
| Officers per 1,000 residents here: | 1.18 |
| North Carolina average: | 2.39 |
Full-time law enforcement employees in 2014, including police officers: 232 (197 officers - 175 male; 22 female).
| Officers per 1,000 residents here: | 1.27 |
| North Carolina average: | 2.41 |
Full-time law enforcement employees in 2013, including police officers: 222 (184 officers - 161 male; 23 female).
| Officers per 1,000 residents here: | 1.24 |
| North Carolina average: | 2.39 |
Full-time law enforcement employees in 2012, including police officers: 215 (180 officers - 157 male; 23 female).
| Officers per 1,000 residents here: | 1.28 |
| North Carolina average: | 2.37 |
Full-time law enforcement employees in 2011, including police officers: 211 (173 officers - 150 male; 23 female).
| Officers per 1,000 residents here: | 1.26 |
| North Carolina average: | 2.39 |
Full-time law enforcement employees in 2010, including police officers: 201 (165 officers - 143 male; 22 female).
| Officers per 1,000 residents here: | 1.22 |
| North Carolina average: | 2.40 |
Full-time law enforcement employees in 2009, including police officers: 193 (163 officers - 140 male; 23 female).
| Officers per 1,000 residents here: | 1.22 |
| North Carolina average: | 2.41 |
Full-time law enforcement employees in 2008, including police officers: 189 (159 officers - 139 male; 20 female).
| Officers per 1,000 residents here: | 1.27 |
| North Carolina average: | 2.40 |
Full-time law enforcement employees in 2007, including police officers: 188 (150 officers - 130 male; 20 female).
| Officers per 1,000 residents here: | 1.31 |
| North Carolina average: | 2.38 |
Full-time law enforcement employees in 2006, including police officers: 184 (152 officers - 135 male; 17 female).
| Officers per 1,000 residents here: | 1.40 |
| North Carolina average: | 2.42 |
Full-time law enforcement employees in 2005, including police officers: 173 (143 officers - 125 male; 18 female).
| Officers per 1,000 residents here: | 1.39 |
| North Carolina average: | 2.44 |
Full-time law enforcement employees in 2004, including police officers: 171 (140 officers - 123 male; 17 female).
| Officers per 1,000 residents here: | 1.38 |
| North Carolina average: | 2.43 |
Full-time law enforcement employees in 2003, including police officers: 165 (135 officers - 120 male; 15 female).
| Officers per 1,000 residents here: | 1.36 |
| North Carolina average: | 2.43 |


