Crime rate in Cape Coral, Florida (FL): murders, rapes, robberies, assaults, burglaries, thefts, auto thefts, arson, law enforcement employees, police officers, crime map
Crime rate in Cape Coral, FL
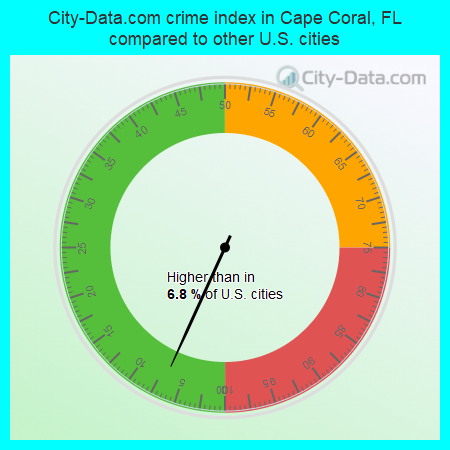
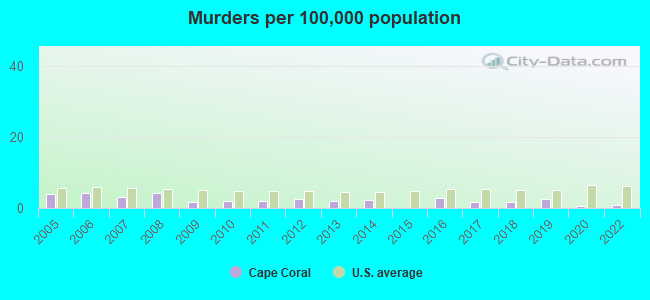
The 2022 crime rate in Cape Coral, FL is 9 (City-Data.com crime index), which is 26.4 times smaller than the U.S. average. It was higher than in 8.3% U.S. cities. The 2022 Cape Coral crime rate fell by 89% compared to 2020. The number of homicides stood at 2 - an increase of 1 compared to 2020. In the last 5 years Cape Coral has seen decreasing violent crime and decreasing property crime.See how dangerous Cape Coral, FL is compared to the nearest cities:
(Note: Higher means more crime)
(Note: Higher means more crime)
| Cape Coral: | 9.3 |
| Fort Myers: | 242.7 |
| Sanibel: | 27.3 |
| Punta Gorda: | 72.1 |
| North Port: | 88.2 |
| Naples: | 106.2 |
| Arcadia: | 479.8 |
| Venice: | 86.4 |
The City-Data.com crime index weighs serious crimes and violent crimes more heavily. Higher means more crime, U.S. average is 246.1. It adjusts for the number of visitors and daily workers commuting into cities.
- means the value is smaller than the state average.- means the value is about the same as the state average.
According to our research of Florida and other state lists, there were 169 registered sex offenders living in Cape Coral, Florida as of May 23, 2024.
The ratio of all residents to sex offenders in Cape Coral is 1,064 to 1.
The ratio of registered sex offenders to all residents in this city is lower than the state average.

Violent crime rate in 2022
| Cape Coral: | 10.1 |
| U.S. Average: | 219.8 |
Violent crime rate in 2020
| Cape Coral: | 69.2 |
| U.S. Average: | 228.2 |
Violent crime rate in 2019
| Cape Coral: | 66.2 |
| U.S. Average: | 219.9 |
Violent crime rate in 2018
| Cape Coral: | 78.0 |
| U.S. Average: | 221.2 |
Violent crime rate in 2017
| Cape Coral: | 70.5 |
| U.S. Average: | 226.2 |
Violent crime rate in 2016
| Cape Coral: | 71.0 |
| U.S. Average: | 227.3 |
Violent crime rate in 2015
| Cape Coral: | 61.8 |
| U.S. Average: | 219.3 |
Violent crime rate in 2014
| Cape Coral: | 78.5 |
| U.S. Average: | 211.1 |
Violent crime rate in 2013
| Cape Coral: | 65.2 |
| U.S. Average: | 214.2 |
Violent crime rate in 2012
| Cape Coral: | 80.5 |
| U.S. Average: | 187.4 |
Violent crime rate in 2011
| Cape Coral: | 82.5 |
| U.S. Average: | 187.1 |
Violent crime rate in 2010
| Cape Coral: | 99.8 |
| U.S. Average: | 195.7 |
Violent crime rate in 2009
| Cape Coral: | 108.6 |
| U.S. Average: | 208.9 |
Violent crime rate in 2008
| Cape Coral: | 127.0 |
| U.S. Average: | 222.5 |
Violent crime rate in 2007
| Cape Coral: | 122.7 |
| U.S. Average: | 229.1 |
Violent crime rate in 2006
| Cape Coral: | 143.6 |
| U.S. Average: | 232.6 |
Violent crime rate in 2005
| Cape Coral: | 138.2 |
| U.S. Average: | 227.0 |
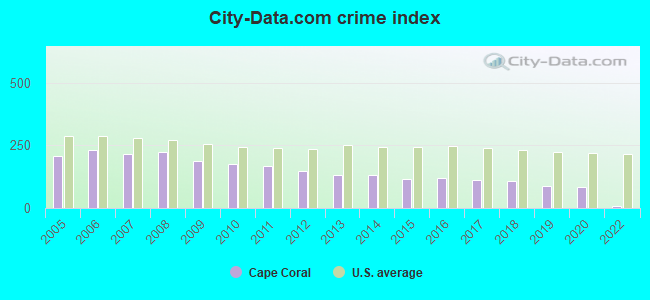
Property crime rate in 2022
| Cape Coral: | 5.3 |
| U.S. Average: | 166.5 |
Property crime rate in 2020
| Cape Coral: | 83.0 |
| U.S. Average: | 169.6 |
Property crime rate in 2019
| Cape Coral: | 85.6 |
| U.S. Average: | 179.7 |
Property crime rate in 2018
| Cape Coral: | 114.3 |
| U.S. Average: | 190.2 |
Property crime rate in 2017
| Cape Coral: | 133.9 |
| U.S. Average: | 206.4 |
Property crime rate in 2016
| Cape Coral: | 147.6 |
| U.S. Average: | 216.6 |
Property crime rate in 2015
| Cape Coral: | 148.4 |
| U.S. Average: | 221.5 |
Property crime rate in 2014
| Cape Coral: | 166.3 |
| U.S. Average: | 230.8 |
Property crime rate in 2013
| Cape Coral: | 185.8 |
| U.S. Average: | 250.4 |
Property crime rate in 2012
| Cape Coral: | 198.2 |
| U.S. Average: | 267.3 |
Property crime rate in 2011
| Cape Coral: | 232.8 |
| U.S. Average: | 273.5 |
Property crime rate in 2010
| Cape Coral: | 235.1 |
| U.S. Average: | 276.4 |
Property crime rate in 2009
| Cape Coral: | 255.0 |
| U.S. Average: | 285.6 |
Property crime rate in 2008
| Cape Coral: | 292.7 |
| U.S. Average: | 302.2 |
Property crime rate in 2007
| Cape Coral: | 285.5 |
| U.S. Average: | 309.2 |
Property crime rate in 2006
| Cape Coral: | 300.4 |
| U.S. Average: | 317.3 |
Property crime rate in 2005
| Cape Coral: | 249.2 |
| U.S. Average: | 322.3 |


Full-time law enforcement employees in 2021, including police officers: 360 (272 officers - 226 male; 46 female).
| Officers per 1,000 residents here: | 1.32 |
| Florida average: | 2.33 |
Full-time law enforcement employees in 2020, including police officers: 337 (255 officers - 209 male; 46 female).
| Officers per 1,000 residents here: | 1.28 |
| Florida average: | 2.26 |
Full-time law enforcement employees in 2018, including police officers: 311 (228 officers - 191 male; 37 female).
| Officers per 1,000 residents here: | 1.21 |
| Florida average: | 2.21 |
Full-time law enforcement employees in 2017, including police officers: 317 (219 officers - 190 male; 29 female).
| Officers per 1,000 residents here: | 1.19 |
| Florida average: | 2.41 |
Full-time law enforcement employees in 2016, including police officers: 306 (221 officers - 190 male; 31 female).
| Officers per 1,000 residents here: | 1.23 |
| Florida average: | 2.36 |
Full-time law enforcement employees in 2015, including police officers: 308 (223 officers - 193 male; 30 female).
| Officers per 1,000 residents here: | 1.28 |
| Florida average: | 2.39 |
Full-time law enforcement employees in 2014, including police officers: 302 (210 officers - 185 male; 25 female).
| Officers per 1,000 residents here: | 1.24 |
| Florida average: | 2.29 |
Full-time law enforcement employees in 2013, including police officers: 309 (221 officers - 198 male; 23 female).
| Officers per 1,000 residents here: | 1.35 |
| Florida average: | 2.39 |
Full-time law enforcement employees in 2012, including police officers: 306 (215 officers - 191 male; 24 female).
| Officers per 1,000 residents here: | 1.35 |
| Florida average: | 2.45 |
Full-time law enforcement employees in 2011, including police officers: 298 (214 officers - 188 male; 26 female).
| Officers per 1,000 residents here: | 1.37 |
| Florida average: | 2.35 |
Full-time law enforcement employees in 2010, including police officers: 320 (228 officers - 200 male; 28 female).
| Officers per 1,000 residents here: | 1.48 |
| Florida average: | 2.47 |
Full-time law enforcement employees in 2009, including police officers: 333 (236 officers - 208 male; 28 female).
| Officers per 1,000 residents here: | 1.44 |
| Florida average: | 2.50 |
Full-time law enforcement employees in 2008, including police officers: 340 (243 officers - 212 male; 31 female).
| Officers per 1,000 residents here: | 1.49 |
| Florida average: | 2.43 |
Full-time law enforcement employees in 2007, including police officers: 358 (257 officers - 220 male; 37 female).
| Officers per 1,000 residents here: | 1.61 |
| Florida average: | 2.45 |
Full-time law enforcement employees in 2006, including police officers: 333 (209 officers - 178 male; 31 female).
| Officers per 1,000 residents here: | 1.47 |
| Florida average: | 2.54 |
Full-time law enforcement employees in 2005, including police officers: 276 (171 officers - 145 male; 26 female).
| Officers per 1,000 residents here: | 1.31 |
| Florida average: | 2.40 |
Full-time law enforcement employees in 2004, including police officers: 248 (160 officers - 137 male; 23 female).
| Officers per 1,000 residents here: | 1.32 |
| Florida average: | 2.53 |
Full-time law enforcement employees in 2003, including police officers: 235 (151 officers - 128 male; 23 female).
| Officers per 1,000 residents here: | 1.31 |
| Florida average: | 2.55 |


