Crime rate in Aurora, Colorado (CO): murders, rapes, robberies, assaults, burglaries, thefts, auto thefts, arson, law enforcement employees, police officers, crime map
Crime rate in Aurora, CO
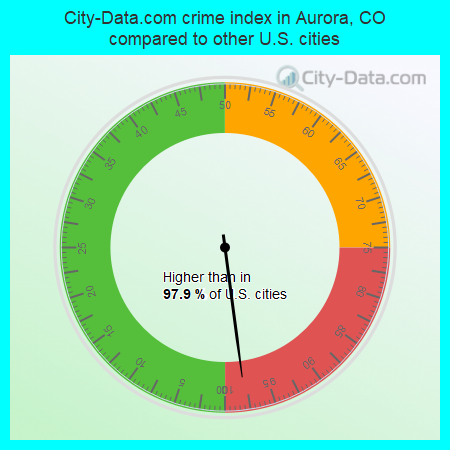
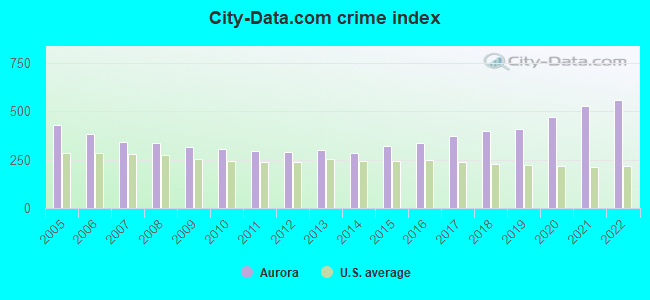
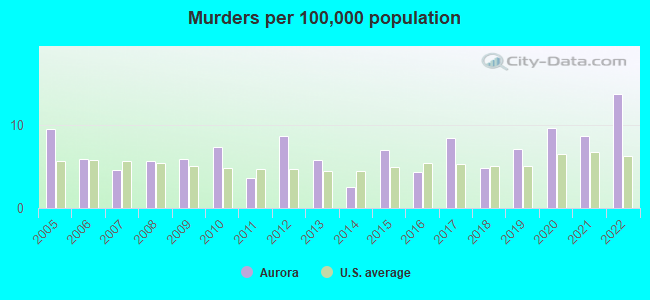
The 2022 crime rate in Aurora, CO is 559 (City-Data.com crime index), which is 2.3 times higher than the U.S. average. It was higher than in 97.9% U.S. cities. The 2022 Aurora crime rate rose by 6% compared to 2021. The number of homicides stood at 54 - an increase of 20 compared to 2021. In the last 5 years Aurora has seen rise of violent crime and increasing property crime.See how dangerous Aurora, CO is compared to the nearest cities:
(Note: Higher means more crime)
(Note: Higher means more crime)
| Aurora: | 559.2 |
| Glendale: | 1,745.2 |
| Greenwood Village: | 559.6 |
| Cherry Hills Village: | 71.4 |
| Denver: | 685.0 |
| Centennial: | 162.0 |
| Englewood: | 654.0 |
| Lone Tree: | 651.6 |
| Commerce City: | 437.9 |
The City-Data.com crime index weighs serious crimes and violent crimes more heavily. Higher means more crime, U.S. average is 246.1. It adjusts for the number of visitors and daily workers commuting into cities.
- means the value is smaller than the state average.- means the value is about the same as the state average.
- means the value is bigger than the state average.
- means the value is much bigger than the state average.
According to our research of Colorado and other state lists, there were 1,040 registered sex offenders living in Aurora, Colorado as of May 23, 2024.
The ratio of all residents to sex offenders in Aurora is 348 to 1.

Violent crime rate in 2022
| Aurora: | 597.1 |
| U.S. Average: | 219.8 |
Violent crime rate in 2021
| Aurora: | 567.9 |
| U.S. Average: | 224.8 |
Violent crime rate in 2020
| Aurora: | 517.7 |
| U.S. Average: | 228.2 |
Violent crime rate in 2019
| Aurora: | 442.9 |
| U.S. Average: | 219.9 |
Violent crime rate in 2018
| Aurora: | 429.7 |
| U.S. Average: | 221.2 |
Violent crime rate in 2017
| Aurora: | 373.6 |
| U.S. Average: | 226.2 |
Violent crime rate in 2016
| Aurora: | 314.3 |
| U.S. Average: | 227.3 |
Violent crime rate in 2015
| Aurora: | 290.5 |
| U.S. Average: | 219.3 |
Violent crime rate in 2014
| Aurora: | 246.5 |
| U.S. Average: | 211.1 |
Violent crime rate in 2013
| Aurora: | 249.4 |
| U.S. Average: | 214.2 |
Violent crime rate in 2012
| Aurora: | 248.0 |
| U.S. Average: | 187.4 |
Violent crime rate in 2011
| Aurora: | 254.4 |
| U.S. Average: | 187.1 |
Violent crime rate in 2010
| Aurora: | 261.8 |
| U.S. Average: | 195.7 |
Violent crime rate in 2009
| Aurora: | 276.4 |
| U.S. Average: | 208.9 |
Violent crime rate in 2008
| Aurora: | 294.3 |
| U.S. Average: | 222.5 |
Violent crime rate in 2007
| Aurora: | 285.7 |
| U.S. Average: | 229.1 |
Violent crime rate in 2006
| Aurora: | 322.0 |
| U.S. Average: | 232.6 |
Violent crime rate in 2005
| Aurora: | 331.7 |
| U.S. Average: | 227.0 |
Property crime rate in 2022
| Aurora: | 454.7 |
| U.S. Average: | 166.5 |
Property crime rate in 2021
| Aurora: | 408.3 |
| U.S. Average: | 157.8 |
Property crime rate in 2020
| Aurora: | 342.0 |
| U.S. Average: | 169.6 |
Property crime rate in 2019
| Aurora: | 269.8 |
| U.S. Average: | 179.7 |
Property crime rate in 2018
| Aurora: | 279.0 |
| U.S. Average: | 190.2 |
Property crime rate in 2017
| Aurora: | 279.1 |
| U.S. Average: | 206.4 |
Property crime rate in 2016
| Aurora: | 264.9 |
| U.S. Average: | 216.6 |
Property crime rate in 2015
| Aurora: | 252.6 |
| U.S. Average: | 221.5 |
Property crime rate in 2014
| Aurora: | 249.7 |
| U.S. Average: | 230.8 |
Property crime rate in 2013
| Aurora: | 272.3 |
| U.S. Average: | 250.4 |
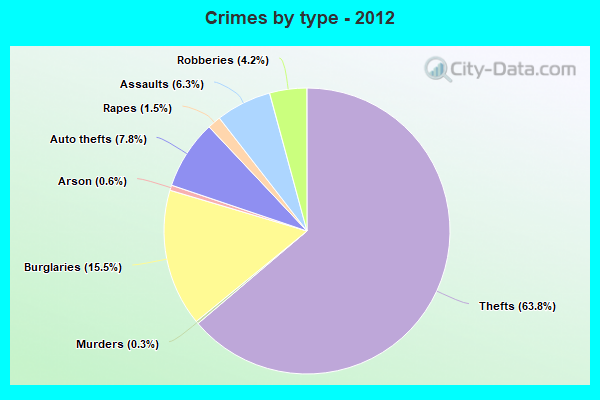
Property crime rate in 2012
| Aurora: | 255.8 |
| U.S. Average: | 267.3 |
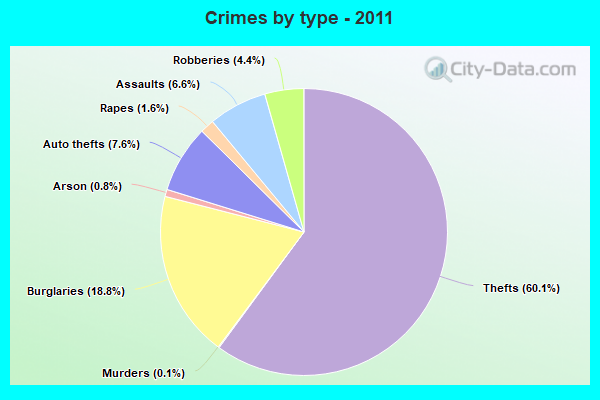
Property crime rate in 2011
| Aurora: | 273.6 |
| U.S. Average: | 273.5 |
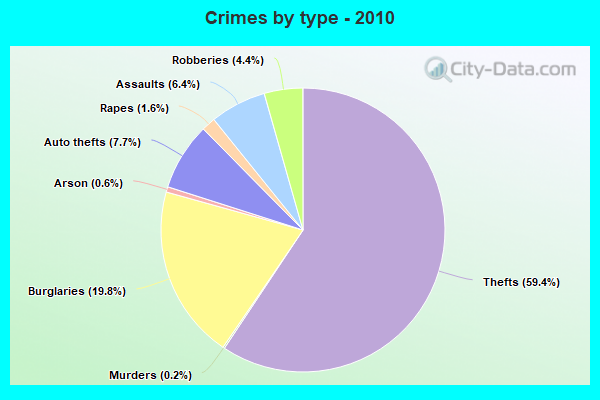
Property crime rate in 2010
| Aurora: | 287.8 |
| U.S. Average: | 276.4 |
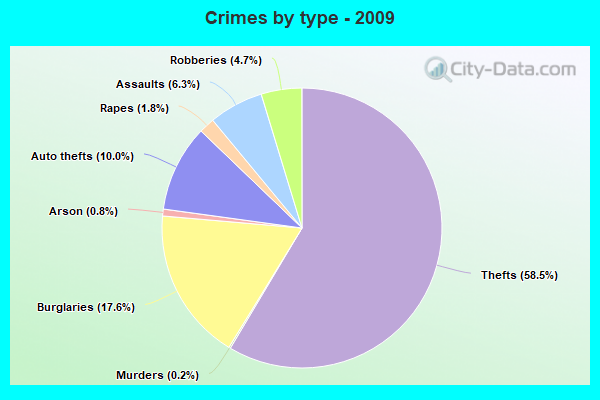
Property crime rate in 2009
| Aurora: | 285.7 |
| U.S. Average: | 285.6 |
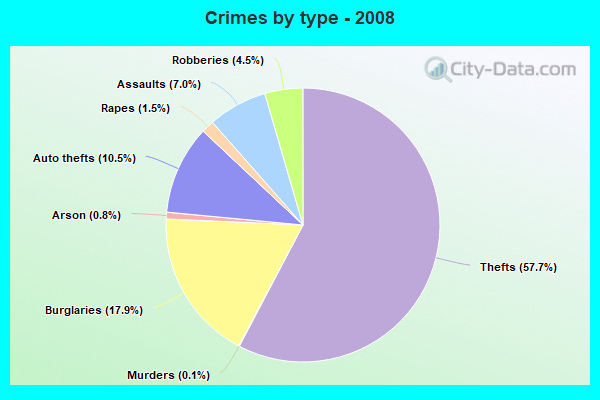
Property crime rate in 2008
| Aurora: | 314.8 |
| U.S. Average: | 302.2 |
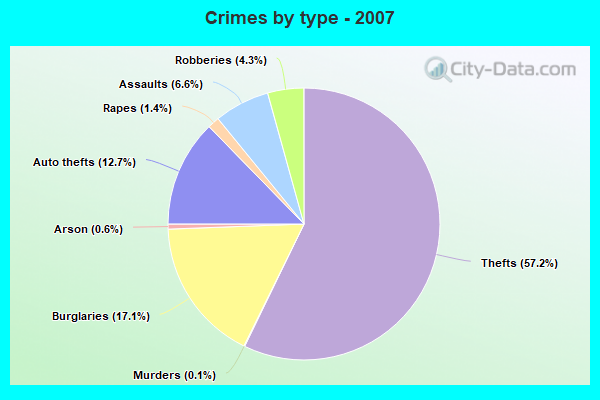
Property crime rate in 2007
| Aurora: | 330.4 |
| U.S. Average: | 309.2 |
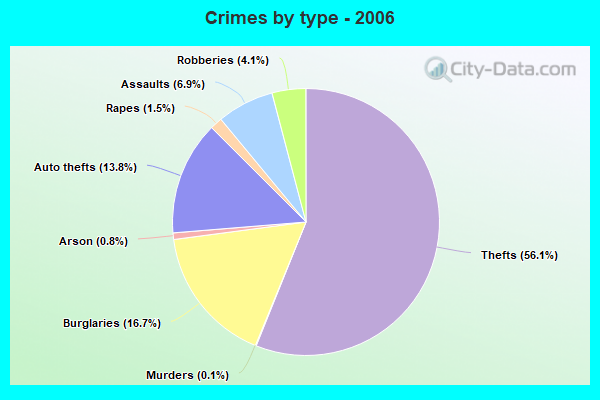
Property crime rate in 2006
| Aurora: | 367.4 |
| U.S. Average: | 317.3 |
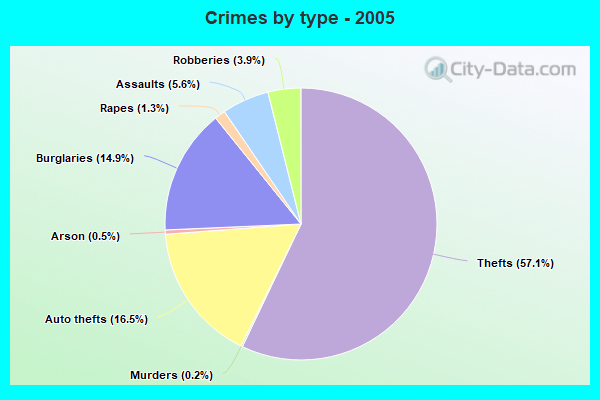
Property crime rate in 2005
| Aurora: | 427.8 |
| U.S. Average: | 322.3 |

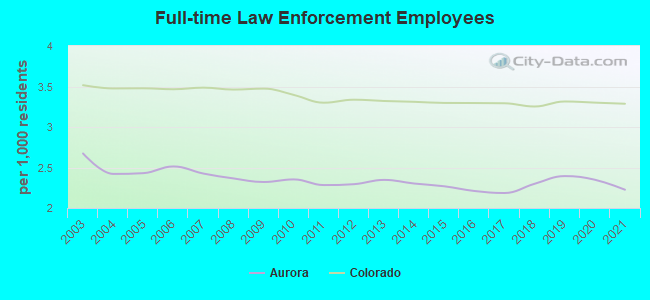
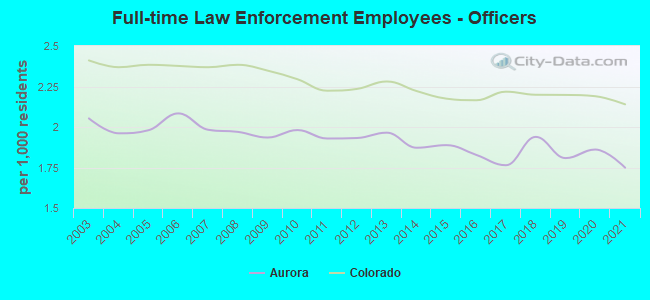
Full-time law enforcement employees in 2021, including police officers: 877 (689 officers - 611 male; 78 female).
| Officers per 1,000 residents here: | 1.75 |
| Colorado average: | 2.14 |
Full-time law enforcement employees in 2020, including police officers: 906 (718 officers - 627 male; 91 female).
| Officers per 1,000 residents here: | 1.86 |
| Colorado average: | 2.19 |
Full-time law enforcement employees in 2019, including police officers: 911 (688 officers - 610 male; 78 female).
| Officers per 1,000 residents here: | 1.81 |
| Colorado average: | 2.20 |
Full-time law enforcement employees in 2018, including police officers: 857 (723 officers - 644 male; 79 female).
| Officers per 1,000 residents here: | 1.94 |
| Colorado average: | 2.20 |
Full-time law enforcement employees in 2017, including police officers: 804 (649 officers - 580 male; 69 female).
| Officers per 1,000 residents here: | 1.76 |
| Colorado average: | 2.22 |
Full-time law enforcement employees in 2016, including police officers: 810 (670 officers - 601 male; 69 female).
| Officers per 1,000 residents here: | 1.83 |
| Colorado average: | 2.17 |
Full-time law enforcement employees in 2015, including police officers: 817 (680 officers - 608 male; 72 female).
| Officers per 1,000 residents here: | 1.89 |
| Colorado average: | 2.18 |
Full-time law enforcement employees in 2014, including police officers: 808 (657 officers - 589 male; 68 female).
| Officers per 1,000 residents here: | 1.87 |
| Colorado average: | 2.22 |
Full-time law enforcement employees in 2013, including police officers: 806 (675 officers - 607 male; 68 female).
| Officers per 1,000 residents here: | 1.97 |
| Colorado average: | 2.28 |
Full-time law enforcement employees in 2012, including police officers: 773 (651 officers - 587 male; 64 female).
| Officers per 1,000 residents here: | 1.93 |
| Colorado average: | 2.23 |
Full-time law enforcement employees in 2011, including police officers: 755 (638 officers - 580 male; 58 female).
| Officers per 1,000 residents here: | 1.93 |
| Colorado average: | 2.22 |
Full-time law enforcement employees in 2010, including police officers: 765 (644 officers - 585 male; 59 female).
| Officers per 1,000 residents here: | 1.98 |
| Colorado average: | 2.30 |
Full-time law enforcement employees in 2009, including police officers: 752 (627 officers - 567 male; 60 female).
| Officers per 1,000 residents here: | 1.94 |
| Colorado average: | 2.35 |
Full-time law enforcement employees in 2008, including police officers: 748 (623 officers - 565 male; 58 female).
| Officers per 1,000 residents here: | 1.97 |
| Colorado average: | 2.38 |
Full-time law enforcement employees in 2007, including police officers: 746 (610 officers - 557 male; 53 female).
| Officers per 1,000 residents here: | 1.98 |
| Colorado average: | 2.37 |
Full-time law enforcement employees in 2006, including police officers: 761 (631 officers - 571 male; 60 female).
| Officers per 1,000 residents here: | 2.08 |
| Colorado average: | 2.38 |
Full-time law enforcement employees in 2005, including police officers: 719 (586 officers - 527 male; 59 female).
| Officers per 1,000 residents here: | 1.98 |
| Colorado average: | 2.38 |
Full-time law enforcement employees in 2004, including police officers: 711 (576 officers - 518 male; 58 female).
| Officers per 1,000 residents here: | 1.96 |
| Colorado average: | 2.37 |
Full-time law enforcement employees in 2003, including police officers: 772 (593 officers - 531 male; 62 female).
| Officers per 1,000 residents here: | 2.05 |
| Colorado average: | 2.41 |


Zip codes: 80010, 80011, 80012, 80013, 80014, 80015, 80016, 80017, 80019, 80045, 80102, 80112, 80137, 80138, 80220, 80231, 80247.