Van Buren County, Tennessee (TN)
County owner-occupied free and clear houses and condos in 2010: 915
County owner-occupied houses and condos in 2000: 1,866
Renter-occupied apartments: 390 (it was 314 in 2000)
| % of renters here: | 14% |
| State: | 32% |
Land area: 273 sq. mi.
Water area: 1.1 sq. mi.
Population density: 23 people per square mile (low).
Industries providing employment: Manufacturing (23.9%), Educational, health and social services (17.5%), Public administration (13.7%).
Type of workers:
- Private wage or salary: 64%
- Government: 23%
- Self-employed, not incorporated: 13%
- Unpaid family work: 0%
- OSM Map
- General Map
- Google Map
- MSN Map

- 5,93494.2%White Non-Hispanic Alone
- 2634.2%Two or more races
- 601.0%Hispanic or Latino
- 200.3%American Indian and Alaska Native alone
- 140.2%Asian alone
- 70.1%Black Non-Hispanic Alone

| Median resident age: | 47.8 years |
| Tennessee median age: | 39.2 years |
| Males: 3,168 | |
| Females: 3,127 |

 | COVID-19 in Tennessee (237 replies) |
| Cookeville Economy (18 replies) |
| Large tributaries of the Caney Fork River (0 replies) |
| Lake Holiday questions (8 replies) |
| Tennessee Population Estimates 2016 (28 replies) |
| Feeling Different About Moving To Crossville Tn (31 replies) |
| Van Buren County: | 2.0 people |
| Tennessee: | 2 people |
Estimated median household income in 2022: $45,581 ($28,165 in 1999)
| This county: | $45,581 |
| Tennessee: | $65,254 |
Median contract rent in 2022 for apartments: $450 (lower quartile is $320, upper quartile is $532)
| This county: | $450 |
| State: | $884 |
Estimated median house or condo value in 2022: $162,831 (it was $52,900 in 2000)
| Van Buren: | $162,831 |
| Tennessee: | $284,800 |
Mean price in 2022:
Median monthly housing costs for homes and condos with a mortgage: $874Detached houses: $219,547
Here: $219,547 State: $374,382 Townhouses or other attached units: $242,233
Here: $242,233 State: $354,101 Mobile homes: $70,843
Here: $70,843 State: $101,421
Median monthly housing costs for units without a mortgage: $342
Institutionalized population: 94
Crime in 2021 (reported by the sheriff's office or county police, not the county total):
- Murders: 0
- Rapes: 0
- Robberies: 0
- Assaults: 2
- Burglaries: 0
- Thefts: 5
- Auto thefts: 1
Crime in 2020 (reported by the sheriff's office or county police, not the county total):
- Murders: 0
- Rapes: 1
- Robberies: 0
- Assaults: 0
- Burglaries: 2
- Thefts: 25
- Auto thefts: 4
Single-family new house construction building permits:
- 2022: 6 buildings, average cost: $131,000
- 2021: 2 buildings, average cost: $145,000
- 2020: 5 buildings, average cost: $116,000
- 2019: 0 buildings
- 2018: 2 buildings, average cost: $100,000
- 2017: 2 buildings, average cost: $188,300
- 2016: 0 buildings
- 2015: 0 buildings


Median real estate property taxes paid for housing units with mortgages in 2022: $714 (0.4%)
Median real estate property taxes paid for housing units with no mortgage in 2022: $524 (0.4%)


| Van Buren County: | 16.2% |
| Tennessee: | 13.3% |
Median age of residents in 2022: 47.8 years old
(Males: 47.1 years old, Females: 48.3 years old)
(Median age for: White residents: 47.5 years old, Hispanic or Latino residents: 24.2 years old)
Fair market rent in 2006 for a 1-bedroom apartment in Van Buren County is $373 a month.
Fair market rent for a 2-bedroom apartment is $460 a month.
Fair market rent for a 3-bedroom apartment is $597 a month.
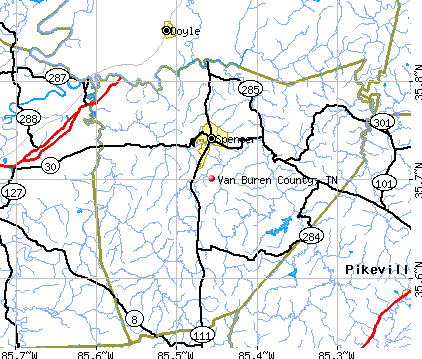
Cities in this county include: Spencer, Welchland, Mooneyham.
Neighboring counties: Cleveland County, North Carolina  , Dyer County
  , San Miguel County, New Mexico , Greene County, Arkansas , Yell County, Arkansas , Rutherford County, North Carolina , White County
  .
.
| Here: | 4.1% |
| Tennessee: | 3.0% |


Current college students: 149
People 25 years of age or older with a high school degree or higher: 80.6%
People 25 years of age or older with a bachelor's degree or higher: 10.2%
Number of foreign born residents: 14 (99.1% naturalized citizens)
| Van Buren County: | 0.2% |
| Whole state: | 5.6% |

- Year of entry for the foreign-born population
- 02010 or later
- 02000 to 2009
- 01990 to 1999
- 01980 to 1989
- 01970 to 1979
- 9Before 1970
Mean travel time to work (commute): minutes
Percentage of county residents living and working in this county: 99.4%
Housing units in structures:
- One, detached: 2,034
- One, attached: 39
- Two: 41
- 3 or 4: 63
- 5 to 9: 9
- Mobile homes: 762
- Boats, RVs, vans, etc.: 3
Housing units in Van Buren County with a mortgage: 768 (85 second mortgage, 5 home equity loan, 71 both second mortgage and home equity loan)
Houses without a mortgage: 25
| Here: | 96.8% with mortgage |
| State: | 97.8% with mortgage |
Religion statistics for Van Buren County
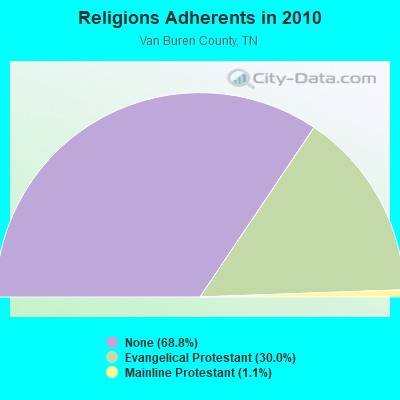
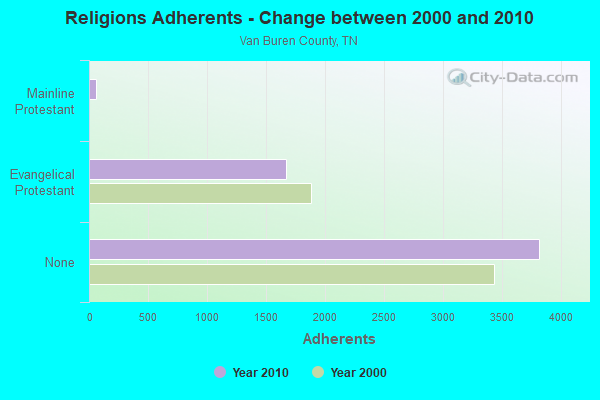
| Religion | Adherents | Congregations |
|---|---|---|
| Evangelical Protestant | 1,667 | 22 |
| Mainline Protestant | 62 | 1 |
| Catholic | - | - |
| None | 3,819 | - |
Source: Clifford Grammich, Kirk Hadaway, Richard Houseal, Dale E.Jones, Alexei Krindatch, Richie Stanley and Richard H.Taylor. 2012. 2010 U.S.Religion Census: Religious Congregations & Membership Study. Association of Statisticians of American Religious Bodies. Jones, Dale E., et al. 2002. Congregations and Membership in the United States 2000. Nashville, TN: Glenmary Research Center.
Food Environment Statistics:
| Van Buren County: | 5.54 / 10,000 pop. |
| Tennessee: | 5.16 / 10,000 pop. |
| Van Buren County: | 11.9% |
| Tennessee: | 11.4% |
| Van Buren County: | 30.5% |
| State: | 30.2% |
| Here: | 14.9% |
| State: | 13.5% |
Agriculture in Van Buren County:
Average size of farms: 137 acresAverage value of agricultural products sold per farm: $11,966
Average value of crops sold per acre for harvested cropland: $72.00
The value of nursery, greenhouse, floriculture, and sod as a percentage of the total market value of agricultural products sold: 8.89%
The value of livestock, poultry, and their products as a percentage of the total market value of agricultural products sold: 84.81%
Average total farm production expenses per farm: $9,944
Harvested cropland as a percentage of land in farms: 18.39%
Average market value of all machinery and equipment per farm: $33,041
The percentage of farms operated by a family or individual: 93.04%
Average age of principal farm operators: 57 years
Average number of cattle and calves per 100 acres of all land in farms: 23.67
Milk cows as a percentage of all cattle and calves: 5.98%
Corn for grain: 83 harvested acres
Land in orchards: 14 acres
Earthquake activity:
Van Buren County-area historical earthquake activity is significantly above Tennessee state average. It is 132% greater than the overall U.S. average.On 4/29/2003 at 08:59:39, a magnitude 4.9 (4.4 MB, 4.6 MW, 4.9 LG, Class: Light, Intensity: IV - V) earthquake occurred 84.0 miles away from Van Buren County center
On 11/30/1973 at 07:48:41, a magnitude 4.7 (4.7 MB, 4.6 ML) earthquake occurred 84.2 miles away from the county center
On 7/27/1980 at 18:52:21, a magnitude 5.2 (5.1 MB, 4.7 MS, 5.0 UK, 5.2 UK, Class: Moderate, Intensity: VI - VII) earthquake occurred 192.4 miles away from the county center
On 4/18/2008 at 09:36:59, a magnitude 5.4 (5.1 MB, 4.8 MS, 5.4 MW, 5.2 MW) earthquake occurred 232.7 miles away from the county center
On 12/12/2018 at 09:14:43, a magnitude 4.4 (4.4 MW, Depth: 4.9 mi) earthquake occurred 41.2 miles away from Van Buren County center
On 4/29/2003 at 08:59:39, a magnitude 4.6 (4.6 MW, Depth: 12.3 mi) earthquake occurred 84.0 miles away from the county center
Magnitude types: regional Lg-wave magnitude (LG), body-wave magnitude (MB), local magnitude (ML), surface-wave magnitude (MS), moment magnitude (MW)
Most recent natural disasters:
- Tennessee Covid-19 Pandemic, Incident Period: January 20, 2020, FEMA Id: 4514, Natural disaster type: Other
- Tennessee Severe Storms, Flooding, Landslides, And Mudslides, Incident Period: February 19, 2019 - March 30, 2019, FEMA Id: 4427, Natural disaster type: Storm, Mudslide, Landslide, Flood
- Tennessee Severe Winter Storm and Flooding, Incident Period: February 15, 2015 to February 23, 2015, Major Disaster (Presidential) Declared DR-4211: April 02, 2015, FEMA Id: 4211, Natural disaster type: Winter Storm, Flood
- Tennessee Hurricane Katrina Evacuation, Incident Period: August 29, 2005 to October 01, 2005, Emergency Declared EM-3217: September 05, 2005, FEMA Id: 3217, Natural disaster type: Hurricane
- Tennessee Severe Storms and Flooding, Incident Period: February 14, 2003 to February 26, 2003, Major Disaster (Presidential) Declared DR-1456: March 20, 2003, FEMA Id: 1456, Natural disaster type: Storm, Flood
- Tennessee Severe Storms, Tornadoes and Flooding, Incident Period: November 09, 2002 to November 12, 2002, Major Disaster (Presidential) Declared DR-1441: November 13, 2002, FEMA Id: 1441, Natural disaster type: Storm, Tornado, Flood
- Tennessee Storms and Flooding, Incident Period: January 23, 2002 to March 20, 2002, Major Disaster (Presidential) Declared DR-1408: April 05, 2002, FEMA Id: 1408, Natural disaster type: Storm, Flood
- Tennessee Winter Storm, Incident Period: December 23, 1998 to December 29, 1998, Major Disaster (Presidential) Declared DR-1260: January 15, 1999, FEMA Id: 1260, Natural disaster type: Winter Storm
- Tennessee Severe Storms and Flooding, Incident Period: January 06, 1998 to February 12, 1998, Major Disaster (Presidential) Declared DR-1197: January 13, 1998, FEMA Id: 1197, Natural disaster type: Storm, Flood
- Tennessee Heavy Rain, Flash Flooding, Incident Period: March 25, 1994 to April 03, 1994, Major Disaster (Presidential) Declared DR-1022: April 14, 1994, FEMA Id: 1022, Natural disaster type: Flash Flood, Heavy Rain
- 5 other natural disasters have been reported since 1953.
The number of natural disasters in Van Buren County (15) is near the US average (15).
Major Disasters (Presidential) Declared: 11
Emergencies Declared: 2
Causes of natural disasters: Floods: 9, Storms: 7, Winter Storms: 4, Flash Floods: 2, Heavy Rains: 2, Hurricane: 1, Ice Storm: 1, Landslide: 1, Mudslide: 1, Snowfall: 1, Tornado: 1, Other: 1 (Note: some incidents may be assigned to more than one category).

Means of transportation to work:
- Drove a car alone: 864 (73.0%)
- Carpooled: 92 (7.8%)
- Bicycle: 4 (0.3%)
- Walked: 101 (8.5%)
- Worked at home: 105 (8.9%)


- Health care and social assistance (17%)
- Manufacturing (16%)
- Public administration (14%)
- Retail trade (10%)
- Accommodation and food services (9%)
- Educational services (8%)
- Professional, scientific, and technical services (6%)

- Health care and social assistance (19%)
- Manufacturing (18%)
- Public administration (16%)
- Retail trade (11%)
- Accommodation and food services (10%)
- Educational services (9%)
- Professional, scientific, and technical services (6%)

- Production occupations (21%)
- Management occupations (20%)
- Installation, maintenance, and repair occupations (9%)
- Construction and extraction occupations (7%)
- Building and grounds cleaning and maintenance occupations (6%)
- Material moving occupations (5%)
- Law enforcement workers including supervisors (5%)

- Management occupations (16%)
- Production occupations (11%)
- Food preparation and serving related occupations (11%)
- Office and administrative support occupations (9%)
- Business and financial operations occupations (8%)
- Healthcare support occupations (8%)
- Health diagnosing and treating practitioners and other technical occupations (6%)

- Taiwan (57%)
- Denmark (0%)
- Ireland (0%)
- Norway (0%)
- Sweden (0%)
- United Kingdom, excluding England and Scotland (0%)
- England (0%)

- American (34%)
- English (16%)
- Irish (15%)
- German (9%)
- Scotch-Irish (5%)
- Swiss (3%)
- Scottish (3%)


21 people in local jails and other municipal confinement facilities
61 people in nursing homes
17 people in local jails and other confinement facilities (including police lockups)
11.18% of this county's 2021 resident taxpayers lived in other counties in 2020 ($57,350 average adjusted gross income)
| Here: | 11.18% |
| Tennessee average: | 8.49% |
10 or fewer of this county's residents moved from foreign countries.
8.12% relocated from other counties in Tennessee ($36,859 average AGI)
3.06% relocated from other states ($20,496 average AGI)
Van Buren County: 3.06% Tennessee average: 4.34%

Top counties from which taxpayers relocated into this county between 2020 and 2021:
| from White County, TN | |
| from Warren County, TN |
7.37% of this county's 2020 resident taxpayers moved to other counties in 2021 ($41,459 average adjusted gross income)
| Here: | 7.37% |
| Tennessee average: | 7.40% |
10 or fewer of this county's residents moved to foreign countries.
6.38% relocated to other counties in Tennessee ($37,345 average AGI)
1.00% relocated to other states ($4,108 average AGI)
Van Buren County: 1.00% Tennessee average: 3.20%

Top counties to which taxpayers relocated from this county between 2020 and 2021:
| to White County, TN | |
| to Warren County, TN |
Births per 1000 population from 1990 to 1999: 10.6
Births per 1000 population from 2000 to 2006: 10.5

Deaths per 1000 population from 1990 to 1999: 8.8
Deaths per 1000 population from 2000 to 2009: 9.8
Deaths per 1000 population from 2010 to 2020: 13.7

Infant deaths per 1000 live births from 1990 to 1999: 11.5
Infant deaths per 1000 live births from 2000 to 2006: 7.5

Persons under 19 years old without health insurance coverage in 2018: 5.5%


Persons enrolled in hospital insurance and/or supplemental medical insurance (Medicare) in July 1, 2007: 1,037 (768 aged, 269 disabled)
Children under 18 without health insurance coverage in 2007: 104 (9%)


Most common underlying causes of death in Van Buren County, Tennessee in 1999 - 2019:
- Acute myocardial infarction, unspecified (12)
- Chronic obstructive pulmonary disease, unspecified (11)
- Atherosclerotic cardiovascular disease, so described (10)
Population without health insurance coverage in 2000: 11%
Children under 18 without health insurance coverage in 2000: 3%
Medical specialist MDs per 100,000 population in 2005: 1,261
Dentists per 100,000 population in 1998: 18
Total deaths per 100,000 population, July 2005 - July 2006: 18
Limited-service eating places per 100,000 population in 2005 : 18
Crimes per 100,000 population in 1996: 1
Household type by relationship:
Households: 6,295- Male householders: 1,311 (337 living alone), Female householders: 1,240 (388 living alone)
1,305 spouses (1,278 opposite-sex spouses), 241 unmarried partners, (198 opposite-sex unmarried partners), 1,471 children (1,315 natural, 43 adopted, 110 stepchildren), 221 grandchildren, 16 brothers or sisters, 59 parents, 21 foster children, 140 other relatives, 174 non-relatives
- In group quarters: 101
Size of family households: 780 2-persons, 346 3-persons, 183 4-persons, 178 5-persons, 81 6-persons, 100 7-or-more-persons.
Size of nonfamily households: 725 1-person, 158 2-persons, 4 4-persons.
733 married couples with children.
198 single-parent households (70 men, 128 women).
94.8% of residents of Van Buren speak English at home.
1.2% of residents speak Spanish at home (68% speak English very well, 32% speak English well).
3.9% of residents speak other Indo-European language at home (42% speak English very well, 44% speak English well, 14% don't speak English at all).
0.3% of residents speak other language at home (100% speak English very well).
In fiscal year 2004:
Federal Government expenditure: $26,489,000 ($4,842 per capita)
Department of Defense expenditure: $408,000
Federal direct payments to individuals for retirement and disability: $9,824,000
Federal other direct payments to individuals: $7,167,000
Federal direct payments not to individuals: $166,000
Federal grants: $8,407,000
Federal procurement contracts: $674,000 ($81,000 Department of Defense)
Federal salaries and wages: $251,000 ($0,000 Department of Defense)
Federal Government direct loans: $5,000
Federal guaranteed/insured loans: $269,000
Federal Government insurance: $5,823,000
Population change from April 1, 2000 to July 1, 2005:
Births: 314| Here: | 57 per 1000 residents |
| State: | 69 per 1000 residents |
Deaths: 281
| Here: | 51 per 1000 residents |
| State: | 50 per 1000 residents |
Net international migration: 0
| Here: | 0 per 1000 residents |
| State: | +8 per 1000 residents |
Net internal migration: -57
| Here: | |
| State: |

Total withdrawal of fresh water for public supply: 0.90 millions of gallons per day (all from surface)
| Here: | 6.0 |
| State: | 6.5 |
| Here: | 4.7 |
| State: | 4.4 |

- Year house built in Van Buren County, Tennessee
- 02020 or later
- 4212010 to 2019
- 4102000 to 2009
- 3011990 to 1999
- 3891980 to 1989
- 7511970 to 1979
- 2681960 to 1969
- 1091950 to 1959
- 641940 to 1949
- 2351939 or earlier

- Rooms in owner-occupied houses in Van Buren County, Tennessee
- 151 room
- 92 rooms
- 503 rooms
- 1734 rooms
- 5365 rooms
- 5196 rooms
- 2307 rooms
- 2768 rooms
- 2409+ rooms

- Rooms in renter-occupied apartments in Van Buren County, Tennessee
- 01 room
- 182 rooms
- 263 rooms
- 1644 rooms
- 1715 rooms
- 576 rooms
- 27 rooms
- 418 rooms
- 139+ rooms

- Bedrooms in owner-occupied houses in Van Buren County, Tennessee
- 18no bedroom
- 661 bedroom
- 3492 bedrooms
- 1,3183 bedrooms
- 1704 bedrooms
- 1325+ bedrooms

- Bedrooms in renter-occupied apartments in Van Buren County, Tennessee
- 0no bedroom
- 581 bedroom
- 2242 bedrooms
- 1973 bedrooms
- 114 bedrooms
- 35+ bedrooms

- Cars and other vehicles available in Van Buren County in owner-occupied houses/condos
- 168no vehicle
- 3541 vehicle
- 8202 vehicles
- 3663 vehicles
- 2484 vehicles
- 1015+ vehicles

- Cars and other vehicles available in Van Buren County in renter-occupied apartments
- 113no vehicle
- 2851 vehicle
- 562 vehicles
- 253 vehicles
- 174 vehicles
- 05+ vehicles
88.2% of Van Buren County residents lived in the same house 1 years ago.
Out of people who lived in different houses, 29% lived in this county.
Out of people who lived in different counties, 68% lived in Tennessee.
| Van Buren County: | 88.2% |
| State average: | 87.0% |
Place of birth for U.S.-born residents:
- This state: 4,364
- Other state: 1,876
- Northeast: 203
- Midwest: 655
- South: 901
- West: 100


- 61.1%Electricity
- 12.9%Wood
- 10.9%Utility gas
- 9.7%Bottled, tank, or LP gas
- 5.3%Fuel oil, kerosene, etc.

- 59.6%Electricity
- 12.1%Utility gas
- 9.2%Wood
- 8.6%No fuel used
- 8.4%Bottled, tank, or LP gas
- 2.1%Other fuel
Private vs. public school enrollment:
| Here: | 19.0% |
| Tennessee: | 15.0% |
| Here: | 0.0% |
| Tennessee: | 16.2% |
| Here: | 0.0% |
| Tennessee: | 23.5% |


Van Buren County government finances - Expenditure in 2017:
- Charges - Other: $657,000
Elementary and Secondary Education - Other: $388,000
Elementary and Secondary Education School Lunch: $67,000
Solid Waste Management: $55,000
- Construction - Elementary and Secondary Education: $574,000
- Current Operations - Elementary and Secondary Education: $7,791,000
Regular Highways: $1,593,000
Police Protection: $582,000
Health - Other: $538,000
General - Other: $427,000
Correctional Institutions: $410,000
Central Staff Services: $290,000
Financial Administration: $283,000
Judicial and Legal Services: $257,000
Solid Waste Management: $187,000
General Public Buildings: $159,000
Natural Resources - Other: $81,000
Parks and Recreation: $41,000
Local Fire Protection: $37,000
- Federal Intergovernmental - Other: $7,000
- General - Interest on Debt: $75,000
- Intergovernmental to Local - Other - General - Other: $144,000
Other - Local Fire Protection: $105,000
Other - Libraries: $29,000
Other - Parks and Recreation: $13,000
Other - Judicial and Legal Services: $10,000
Other - Elementary and Secondary Education: $5,000
Other - Health - Other: $1,000
- Intergovernmental to State - Health - Other: $13,000
- Local Intergovernmental - General Local Government Support: $132,000
Education: $14,000
- Long Term Debt - Beginning Outstanding - Unspecified Public Purpose: $2,585,000
Outstanding Unspecified Public Purpose: $2,402,000
Retired Unspecified Public Purpose: $183,000
- Miscellaneous - General Revenue - Other: $261,000
Fines and Forfeits: $143,000
Interest Earnings: $54,000
Donations From Private Sources: $8,000
Rents: $5,000
Sale of Property: $4,000
- Other Capital Outlay - General - Other: $550,000
Elementary and Secondary Education: $548,000
Regular Highways: $17,000
Police Protection: $5,000
Financial Administration: $2,000
Natural Resources - Other: $2,000
Central Staff Services: $1,000
- Other Funds - Cash and Securities: $6,263,000
- Sinking Funds - Cash and Securities: $455,000
- State Intergovernmental - Education: $6,464,000
Highways: $1,463,000
Other: $482,000
General Local Government Support: $234,000
Health and Hospitals: $10,000
- Tax - Property: $2,098,000
General Sales and Gross Receipts: $461,000
Other Selective Sales: $186,000
Alcoholic Beverage Sales: $27,000
Occupation and Business License - Other: $21,000
Public Utility License: $10,000
Motor Vehicle License: $4,000
- Total Salaries and Wages: $7,148,000
Van Buren County government finances - Revenue in 2017:
- Charges - Other: $657,000
Elementary and Secondary Education - Other: $388,000
Elementary and Secondary Education School Lunch: $67,000
Solid Waste Management: $55,000
- Construction - Elementary and Secondary Education: $574,000
- Current Operations - Elementary and Secondary Education: $7,791,000
Regular Highways: $1,593,000
Police Protection: $582,000
Health - Other: $538,000
General - Other: $427,000
Correctional Institutions: $410,000
Central Staff Services: $290,000
Financial Administration: $283,000
Judicial and Legal Services: $257,000
Solid Waste Management: $187,000
General Public Buildings: $159,000
Natural Resources - Other: $81,000
Parks and Recreation: $41,000
Local Fire Protection: $37,000
- Federal Intergovernmental - Other: $7,000
- General - Interest on Debt: $75,000
- Intergovernmental to Local - Other - General - Other: $144,000
Other - Local Fire Protection: $105,000
Other - Libraries: $29,000
Other - Parks and Recreation: $13,000
Other - Judicial and Legal Services: $10,000
Other - Elementary and Secondary Education: $5,000
Other - Health - Other: $1,000
- Intergovernmental to State - Health - Other: $13,000
- Local Intergovernmental - General Local Government Support: $132,000
Education: $14,000
- Long Term Debt - Beginning Outstanding - Unspecified Public Purpose: $2,585,000
Outstanding Unspecified Public Purpose: $2,402,000
Retired Unspecified Public Purpose: $183,000
- Miscellaneous - General Revenue - Other: $261,000
Fines and Forfeits: $143,000
Interest Earnings: $54,000
Donations From Private Sources: $8,000
Rents: $5,000
Sale of Property: $4,000
- Other Capital Outlay - General - Other: $550,000
Elementary and Secondary Education: $548,000
Regular Highways: $17,000
Police Protection: $5,000
Financial Administration: $2,000
Natural Resources - Other: $2,000
Central Staff Services: $1,000
- Other Funds - Cash and Securities: $6,263,000
- Sinking Funds - Cash and Securities: $455,000
- State Intergovernmental - Education: $6,464,000
Highways: $1,463,000
Other: $482,000
General Local Government Support: $234,000
Health and Hospitals: $10,000
- Tax - Property: $2,098,000
General Sales and Gross Receipts: $461,000
Other Selective Sales: $186,000
Alcoholic Beverage Sales: $27,000
Occupation and Business License - Other: $21,000
Public Utility License: $10,000
Motor Vehicle License: $4,000
- Total Salaries and Wages: $7,148,000
Van Buren County government finances - Debt in 2017:
- Charges - Other: $657,000
Elementary and Secondary Education - Other: $388,000
Elementary and Secondary Education School Lunch: $67,000
Solid Waste Management: $55,000
- Construction - Elementary and Secondary Education: $574,000
- Current Operations - Elementary and Secondary Education: $7,791,000
Regular Highways: $1,593,000
Police Protection: $582,000
Health - Other: $538,000
General - Other: $427,000
Correctional Institutions: $410,000
Central Staff Services: $290,000
Financial Administration: $283,000
Judicial and Legal Services: $257,000
Solid Waste Management: $187,000
General Public Buildings: $159,000
Natural Resources - Other: $81,000
Parks and Recreation: $41,000
Local Fire Protection: $37,000
- Federal Intergovernmental - Other: $7,000
- General - Interest on Debt: $75,000
- Intergovernmental to Local - Other - General - Other: $144,000
Other - Local Fire Protection: $105,000
Other - Libraries: $29,000
Other - Parks and Recreation: $13,000
Other - Judicial and Legal Services: $10,000
Other - Elementary and Secondary Education: $5,000
Other - Health - Other: $1,000
- Intergovernmental to State - Health - Other: $13,000
- Local Intergovernmental - General Local Government Support: $132,000
Education: $14,000
- Long Term Debt - Beginning Outstanding - Unspecified Public Purpose: $2,585,000
Outstanding Unspecified Public Purpose: $2,402,000
Retired Unspecified Public Purpose: $183,000
- Miscellaneous - General Revenue - Other: $261,000
Fines and Forfeits: $143,000
Interest Earnings: $54,000
Donations From Private Sources: $8,000
Rents: $5,000
Sale of Property: $4,000
- Other Capital Outlay - General - Other: $550,000
Elementary and Secondary Education: $548,000
Regular Highways: $17,000
Police Protection: $5,000
Financial Administration: $2,000
Natural Resources - Other: $2,000
Central Staff Services: $1,000
- Other Funds - Cash and Securities: $6,263,000
- Sinking Funds - Cash and Securities: $455,000
- State Intergovernmental - Education: $6,464,000
Highways: $1,463,000
Other: $482,000
General Local Government Support: $234,000
Health and Hospitals: $10,000
- Tax - Property: $2,098,000
General Sales and Gross Receipts: $461,000
Other Selective Sales: $186,000
Alcoholic Beverage Sales: $27,000
Occupation and Business License - Other: $21,000
Public Utility License: $10,000
Motor Vehicle License: $4,000
- Total Salaries and Wages: $7,148,000
Van Buren County government finances - Cash and Securities in 2017:
- Charges - Other: $657,000
Elementary and Secondary Education - Other: $388,000
Elementary and Secondary Education School Lunch: $67,000
Solid Waste Management: $55,000
- Construction - Elementary and Secondary Education: $574,000
- Current Operations - Elementary and Secondary Education: $7,791,000
Regular Highways: $1,593,000
Police Protection: $582,000
Health - Other: $538,000
General - Other: $427,000
Correctional Institutions: $410,000
Central Staff Services: $290,000
Financial Administration: $283,000
Judicial and Legal Services: $257,000
Solid Waste Management: $187,000
General Public Buildings: $159,000
Natural Resources - Other: $81,000
Parks and Recreation: $41,000
Local Fire Protection: $37,000
- Federal Intergovernmental - Other: $7,000
- General - Interest on Debt: $75,000
- Intergovernmental to Local - Other - General - Other: $144,000
Other - Local Fire Protection: $105,000
Other - Libraries: $29,000
Other - Parks and Recreation: $13,000
Other - Judicial and Legal Services: $10,000
Other - Elementary and Secondary Education: $5,000
Other - Health - Other: $1,000
- Intergovernmental to State - Health - Other: $13,000
- Local Intergovernmental - General Local Government Support: $132,000
Education: $14,000
- Long Term Debt - Beginning Outstanding - Unspecified Public Purpose: $2,585,000
Outstanding Unspecified Public Purpose: $2,402,000
Retired Unspecified Public Purpose: $183,000
- Miscellaneous - General Revenue - Other: $261,000
Fines and Forfeits: $143,000
Interest Earnings: $54,000
Donations From Private Sources: $8,000
Rents: $5,000
Sale of Property: $4,000
- Other Capital Outlay - General - Other: $550,000
Elementary and Secondary Education: $548,000
Regular Highways: $17,000
Police Protection: $5,000
Financial Administration: $2,000
Natural Resources - Other: $2,000
Central Staff Services: $1,000
- Other Funds - Cash and Securities: $6,263,000
- Sinking Funds - Cash and Securities: $455,000
- State Intergovernmental - Education: $6,464,000
Highways: $1,463,000
Other: $482,000
General Local Government Support: $234,000
Health and Hospitals: $10,000
- Tax - Property: $2,098,000
General Sales and Gross Receipts: $461,000
Other Selective Sales: $186,000
Alcoholic Beverage Sales: $27,000
Occupation and Business License - Other: $21,000
Public Utility License: $10,000
Motor Vehicle License: $4,000
- Total Salaries and Wages: $7,148,000
Supplemental Security Income (SSI) in 2006:
- Total number of recipients: 201
- Number of aged recipients: 29
- Number of blind and disabled recipients: 172
- Number of recipients under 18: 15
- Number of recipients between 18 and 64: 123
- Number of recipients older than 64: 63
- Number of recipients also receiving OASDI: 99
- Amount of payments (thousands of dollars): 91
| Most common first names in Van Buren County, TN among deceased individuals | ||
| Name | Count | Lived (average) |
|---|---|---|
| James | 37 | 70.8 years |
| William | 34 | 77.6 years |
| John | 24 | 73.8 years |
| Robert | 17 | 73.4 years |
| Mary | 16 | 73.6 years |
| Thomas | 15 | 72.8 years |
| Charles | 14 | 68.8 years |
| Joe | 13 | 70.3 years |
| Willie | 11 | 77.8 years |
| George | 10 | 78.6 years |
| Most common last names in Van Buren County, TN among deceased individuals | ||
| Last name | Count | Lived (average) |
|---|---|---|
| Hale | 27 | 77.6 years |
| Simmons | 25 | 70.4 years |
| Shockley | 24 | 72.8 years |
| Yates | 24 | 75.4 years |
| Madewell | 23 | 73.7 years |
| Bouldin | 20 | 76.4 years |
| Baker | 20 | 75.8 years |
| Sullivan | 19 | 70.0 years |
| Mooneyham | 17 | 77.4 years |
| Davis | 15 | 76.9 years |