Tipton County, Tennessee (TN)
County owner-occupied free and clear houses and condos in 2010: 4,250
County owner-occupied houses and condos in 2000: 13,793
Renter-occupied apartments: 5,521 (it was 4,313 in 2000)
| % of renters here: | 24% |
| State: | 32% |
Land area: 459 sq. mi.
Water area: 15.4 sq. mi.
Population density: 135 people per square mile (average).
Industries providing employment: Educational, health and social services (20.3%), Retail trade (13.8%), Manufacturing (12.1%).
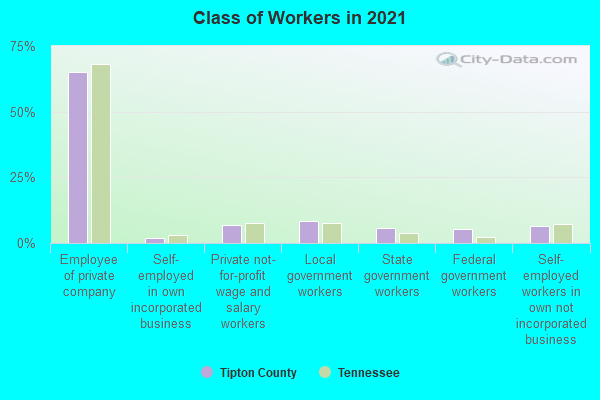
Type of workers:
- Private wage or salary: 73%
- Government: 20%
- Self-employed, not incorporated: 6%
- Unpaid family work: 0%
- OSM Map
- General Map
- Google Map
- MSN Map

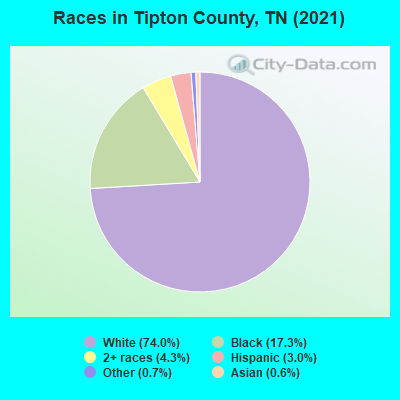
- 45,96274.1%White Non-Hispanic Alone
- 11,02917.8%Black Non-Hispanic Alone
- 2,2353.6%Two or more races
- 1,9263.1%Hispanic or Latino
- 4730.8%Some other race alone
- 3520.6%Asian alone
- 420.07%American Indian and Alaska Native alone
| Median resident age: | 38.7 years |
| Tennessee median age: | 39.2 years |
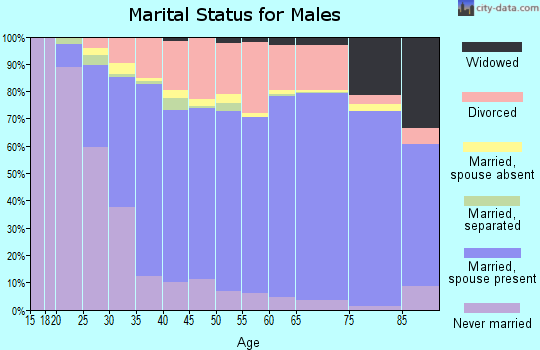
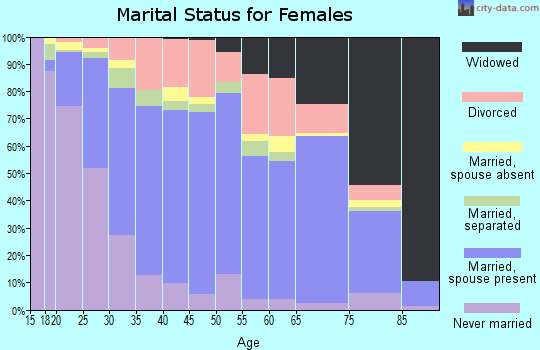
| Males: 30,822 | |
| Females: 31,420 |

 | Tipton County, TN sheriff warns thieves about coming to his county (0 replies) |
| Tennessee's 2020 Census results (74 replies) |
| New metro area definitions and populations (19 replies) |
| COVID-19 in Tennessee (237 replies) |
| 2019 TN Population Estimates (19 replies) |
| Mempis safe for young family? (27 replies) |
| Tipton County: | 2.0 people |
| Tennessee: | 2 people |
Estimated median household income in 2022: $72,019 ($41,856 in 1999)
| This county: | $72,019 |
| Tennessee: | $65,254 |
Median contract rent in 2022 for apartments: $793 (lower quartile is $599, upper quartile is $1,020)
| This county: | $793 |
| State: | $884 |
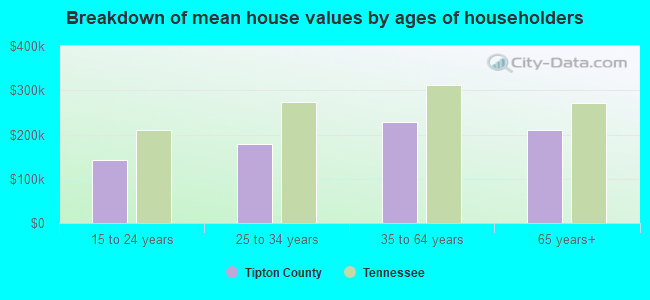
Estimated median house or condo value in 2022: $249,706 (it was $87,400 in 2000)
| Tipton: | $249,706 |
| Tennessee: | $284,800 |
Median monthly housing costs for homes and condos with a mortgage: $1,389
Median monthly housing costs for units without a mortgage: $432
Institutionalized population: 960
Crime in 2021 (reported by the sheriff's office or county police, not the county total):
- Murders: 2
- Rapes: 10
- Robberies: 5
- Assaults: 96
- Burglaries: 64
- Thefts: 224
- Auto thefts: 49
Crime in 2020 (reported by the sheriff's office or county police, not the county total):
- Murders: 0
- Rapes: 15
- Robberies: 5
- Assaults: 115
- Burglaries: 92
- Thefts: 261
- Auto thefts: 47
Health of residents in Tipton County based on CDC Behavioral Risk Factor Surveillance System Survey Questionnaires from 2013 to 2021:
General health status score of residents in this county from 1 (poor) to 5 (excellent) is 3.2. This is significantly worse than average.64.6% of residents exercised in the past month. This is less than average.
41.4% of residents smoked 100+ cigarettes in their lives. This is about average.
42.2% of adult residents drank alcohol in the past 30 days. This is less than average.
60.4% of residents visited a dentist within the past year. This is less than average.
Average weight of males is 203 pounds. This is more than average.
Average weight of females is 171 pounds. This is more than average.
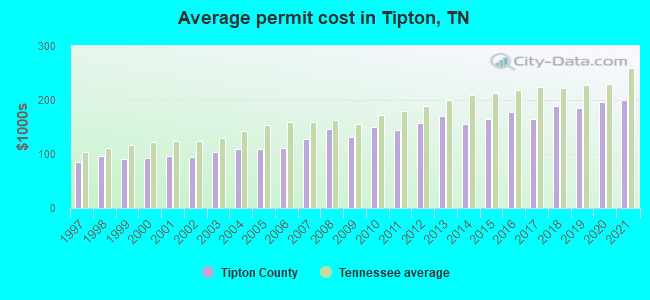
Single-family new house construction building permits:
- 2022: 177 buildings, average cost: $236,400
- 2021: 263 buildings, average cost: $199,800
- 2020: 210 buildings, average cost: $196,000
- 2019: 172 buildings, average cost: $184,500
- 2018: 183 buildings, average cost: $188,300
- 2017: 159 buildings, average cost: $164,900
- 2016: 155 buildings, average cost: $177,100
- 2015: 105 buildings, average cost: $164,800
- 2014: 130 buildings, average cost: $154,800
- 2013: 114 buildings, average cost: $169,700
- 2012: 91 buildings, average cost: $157,300
- 2011: 61 buildings, average cost: $145,200
- 2010: 100 buildings, average cost: $149,700
- 2009: 120 buildings, average cost: $130,500
- 2008: 177 buildings, average cost: $145,600
- 2007: 385 buildings, average cost: $127,400
- 2006: 481 buildings, average cost: $110,600
- 2005: 626 buildings, average cost: $109,200
- 2004: 606 buildings, average cost: $108,500
- 2003: 512 buildings, average cost: $103,700
- 2002: 471 buildings, average cost: $94,700
- 2001: 499 buildings, average cost: $95,600
- 2000: 479 buildings, average cost: $93,300
- 1999: 667 buildings, average cost: $91,000
- 1998: 600 buildings, average cost: $96,300
- 1997: 469 buildings, average cost: $85,300

Median real estate property taxes paid for housing units with mortgages in 2022: $1,197 (0.5%)
Median real estate property taxes paid for housing units with no mortgage in 2022: $992 (0.5%)


| Tipton County: | 10.3% |
| Tennessee: | 13.3% |
Median age of residents in 2022: 38.7 years old
(Males: 37.4 years old, Females: 39.5 years old)
(Median age for: White residents: 40.7 years old, Black residents: 34.8 years old, American Indian residents: 33.4 years old, Asian residents: 47.7 years old, Hispanic or Latino residents: 29.9 years old, Other race residents: 31.2 years old)
Area name: Memphis, TN-MS-AR HUD Metro FMR Area
Fair market rent in 2006 for a 1-bedroom apartment in Tipton County is $572 a month.
Fair market rent for a 2-bedroom apartment is $636 a month.
Fair market rent for a 3-bedroom apartment is $847 a month.
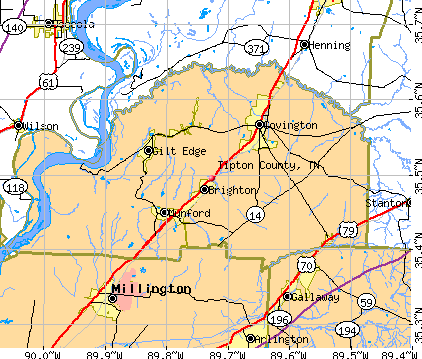
Cities in this county include: Covington, Drummonds, Munford, Atoka, Brighton, Tabernacle, Mason, Gilt Edge, Burlison, Garland.
Notable locations in this county outside city limits:
Notable locations in Tipton County: Waldrop Store (A), Chestuee Golf and Country Club (B), Midway Drive-In (C), Mine Road Landfill (D), Camp Cherokee (E), Raht Ferry (F), McMinn County District 6 Riceville Volunteer Fire Department (G), McMinn County District 10 Clearwater Rural Fire Department (H), Abitibi - Bowater Emergency Response Team (I), McMinn County District 8 Hillsview Rural Fire Department (J), Etowah Water Works (K), McMinn County District 9 Union Grove Rural Fire Department (L), McMinn County District 7 Idlewild Rural Fire Department (M), McMinn County District 11 Claxton Volunteer Rural Fire Department (N). Display/hide their locations on the map
Churches in Tipton County include: New Bethel Baptist Church (A), Cambria Baptist Church (B), Pond Hill Church (C), Rose Hill Church (D), South Liberty Church (E), Spring Creek Church (F), Rockview Church (G), Rocky Mount Church (H), Bethel Springs Baptist Church (I). Display/hide their locations on the map
Cemeteries: Horton Cemetery (1), Swafford Cemetery (2), Hyde Cemetery (3), Thomas Cemetery (4), Thompson Cemetery (5), Thorn Hill Cemetery (6), Isbell Cemetery (7). Display/hide their locations on the map
Lakes and reservoirs: Pierce Pond (A), Webb Lake (B), Lake Comfort (C), Nagle Lake (D), L and N Reservoir (E), Mountain View Lake (F), Williams Lake (G), William Browder Lake (H). Display/hide their locations on the map
Streams, rivers, and creeks: Little Chestuee Creek (A), Lathan Spring Branch (B), Kyker Branch (C), Kibble Branch (D), Acre Spring Branch (E), Chatata Creek (F), Gay Branch (G), Prospect Branch (H), Snake Island Branch (I). Display/hide their locations on the map
Parks in Tipton County include: Rogers Creek Wildlife Management Area (1), Knox Park (2). Display/hide their locations on the map
Neighboring counties: Crawford County, Arkansas  , Franklin County
  , Hughes County, Oklahoma , Loudon County , Randolph County, North Carolina , Williamson County , Wheeler County, Texas .
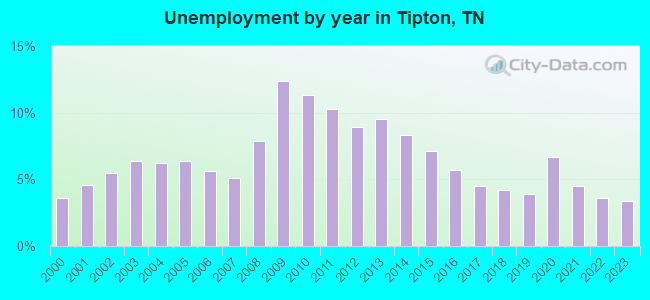
| Here: | 3.6% |
| Tennessee: | 3.0% |
Current college students: 1,769
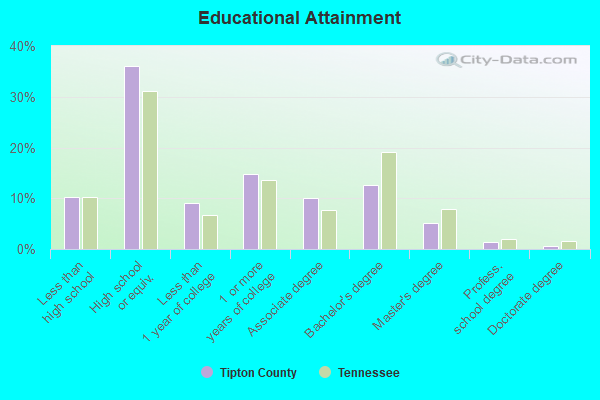
People 25 years of age or older with a high school degree or higher: 89.0%
People 25 years of age or older with a bachelor's degree or higher: 19.6%
Number of foreign born residents: 954 (53.8% naturalized citizens)
| Tipton County: | 1.5% |
| Whole state: | 5.6% |
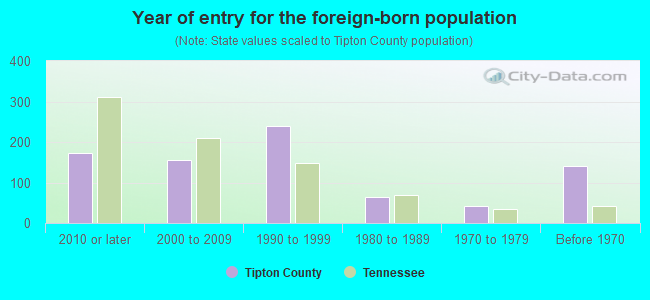
- Year of entry for the foreign-born population
- 1632010 or later
- 1602000 to 2009
- 2721990 to 1999
- 641980 to 1989
- 431970 to 1979
- 140Before 1970
Mean travel time to work (commute): ! minutes
Percentage of county residents living and working in this county: 98.4%
Housing units in structures:
- One, detached: 20,429
- One, attached: 219
- Two: 189
- 3 or 4: 550
- 5 to 9: 470
- 10 to 19: 27
- 20 to 49: 209
- 50 or more: 56
- Mobile homes: 2,455
- Boats, RVs, vans, etc.: 35
Housing units in Tipton County with a mortgage: 11,235 (1,060 second mortgage, 25 home equity loan, 829 both second mortgage and home equity loan)
Houses without a mortgage: 123
| Here: | 8.2% with mortgage |
| State: | 97.8% with mortgage |
Religion statistics for Tipton County
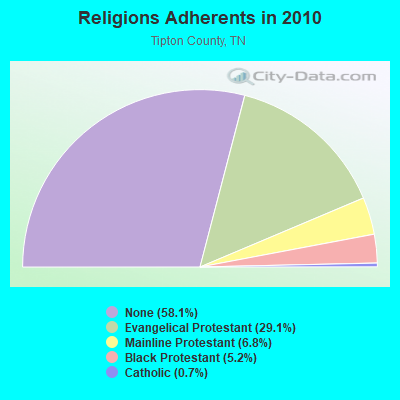
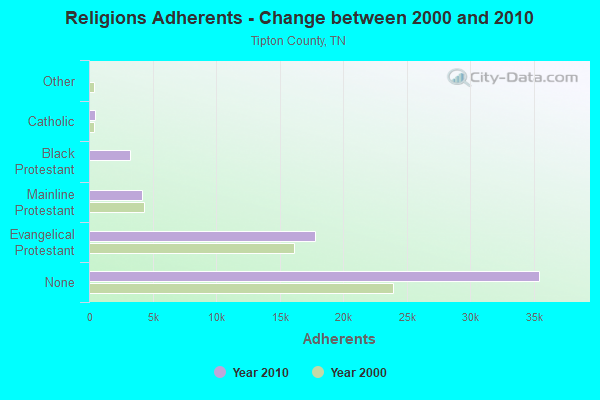
| Religion | Adherents | Congregations |
|---|---|---|
| Evangelical Protestant | 17,792 | 76 |
| Mainline Protestant | 4,172 | 20 |
| Black Protestant | 3,196 | 18 |
| Catholic | 450 | 1 |
| Other | 4 | 1 |
| None | 35,467 | - |
Source: Clifford Grammich, Kirk Hadaway, Richard Houseal, Dale E.Jones, Alexei Krindatch, Richie Stanley and Richard H.Taylor. 2012. 2010 U.S.Religion Census: Religious Congregations & Membership Study. Association of Statisticians of American Religious Bodies. Jones, Dale E., et al. 2002. Congregations and Membership in the United States 2000. Nashville, TN: Glenmary Research Center.
Food Environment Statistics:
| Tipton County: | 1.56 / 10,000 pop. |
| State: | 1.99 / 10,000 pop. |
| This county: | 0.87 / 10,000 pop. |
| Tennessee: | 0.65 / 10,000 pop. |
| Tipton County: | 5.03 / 10,000 pop. |
| Tennessee: | 5.16 / 10,000 pop. |
| This county: | 3.82 / 10,000 pop. |
| State: | 6.56 / 10,000 pop. |
| Tipton County: | 10.8% |
| Tennessee: | 11.4% |
| Tipton County: | 33.2% |
| State: | 30.2% |
| Here: | 11.1% |
| State: | 13.5% |
Agriculture in Tipton County:
Average size of farms: 269 acresAverage value of agricultural products sold per farm: $50,430
Average value of crops sold per acre for harvested cropland: $230.00
The value of nursery, greenhouse, floriculture, and sod as a percentage of the total market value of agricultural products sold: 0.52%
The value of livestock, poultry, and their products as a percentage of the total market value of agricultural products sold: 6.87%
Average total farm production expenses per farm: $49,154
Harvested cropland as a percentage of land in farms: 75.86%
Irrigated harvested cropland as a percentage of land in farms: 1.57%
Average market value of all machinery and equipment per farm: $79,422
The percentage of farms operated by a family or individual: 94.10%
Average age of principal farm operators: 60 years
Average number of cattle and calves per 100 acres of all land in farms: 7.04
Corn for grain: 15797 harvested acres
All wheat for grain: 15506 harvested acres
Upland cotton: 53675 harvested acres
Soybeans for beans: 46429 harvested acres
Vegetables: 158 harvested acres
Land in orchards: 80 acres
Tornado activity:
Tipton County historical area-adjusted tornado activity is significantly below Tennessee state average. It is 1516614.7 times below overall U.S. average.Tornadoes in this county have caused 5 fatalities and 166 injuries recorded between 1950 and 2004.
On 4/3/1974, a category 3 (max. wind speeds 158-206 mph) tornado killed 3 people and injured 50 people and caused between $50,000 and $500,000 in damages.
Earthquake activity:
Tipton County-area historical earthquake activity is significantly above Tennessee state average. It is 383% greater than the overall U.S. average.On 3/25/1976 at 00:41:20, a magnitude 5.0 (4.9 MB, 5.0 LG, Class: Moderate, Intensity: VI - VII) earthquake occurred 35.1 miles away from Tipton County center
On 5/4/1991 at 01:18:54, a magnitude 5.0 (4.4 MB, 4.6 LG, 5.0 LG, Depth: 3.1 mi) earthquake occurred 74.2 miles away from the county center
On 4/27/1989 at 16:47:49, a magnitude 4.7 (4.6 MB, 4.7 LG, 4.3 LG, Class: Light, Intensity: IV - V) earthquake occurred 35.5 miles away from the county center
On 9/26/1990 at 13:18:51, a magnitude 5.0 (4.7 MB, 4.8 LG, 5.0 LG, Depth: 7.7 mi) earthquake occurred 116.2 miles away from the county center
On 4/18/2008 at 09:36:59, a magnitude 5.4 (5.1 MB, 4.8 MS, 5.4 MW, 5.2 MW) earthquake occurred 228.5 miles away from Tipton County center
On 3/25/1976 at 01:00:11, a magnitude 4.5 (4.1 MB, 4.5 LG) earthquake occurred 43.1 miles away from the county center
Magnitude types: regional Lg-wave magnitude (LG), body-wave magnitude (MB), surface-wave magnitude (MS), moment magnitude (MW)
Most recent natural disasters:
- Tennessee Covid-19 Pandemic, Incident Period: January 20, 2020, FEMA Id: 4514, Natural disaster type: Other
- Tennessee Severe Storms, Flooding, Landslides, And Mudslides, Incident Period: February 19, 2019 - March 30, 2019, FEMA Id: 4427, Natural disaster type: Storm, Mudslide, Landslide, Flood
- Tennessee Severe Storms, Tornadoes, Straight-line Winds, and Flooding, Incident Period: June 05, 2014 to June 10, 2014, Major Disaster (Presidential) Declared DR-4189: August 13, 2014, FEMA Id: 4189, Natural disaster type: Storm, Tornado, Flood, Wind
- Tennessee Severe Winter Storm, Incident Period: March 02, 2014 to March 04, 2014, Major Disaster (Presidential) Declared DR-4171: April 11, 2014, FEMA Id: 4171, Natural disaster type: Winter Storm
- Tennessee Severe Storms, Tornadoes, Straight-line Winds, and Flooding, Incident Period: April 19, 2011 to June 07, 2011, Major Disaster (Presidential) Declared DR-1979: May 09, 2011, FEMA Id: 1979, Natural disaster type: Storm, Tornado, Flood, Wind
- Tennessee Severe Storms, Flooding, Straight-Line Winds, and Tornadoes, Incident Period: April 30, 2010 to May 18, 2010, Major Disaster (Presidential) Declared DR-1909: May 04, 2010, FEMA Id: 1909, Natural disaster type: Storm, Tornado, Flood, Wind
- Tennessee Severe Storms, Tornadoes, Straight-line Winds, and Flooding, Incident Period: February 05, 2008 to February 06, 2008, Major Disaster (Presidential) Declared DR-1745: February 07, 2008, FEMA Id: 1745, Natural disaster type: Storm, Tornado, Flood, Wind
- Tennessee Hurricane Katrina Evacuation, Incident Period: August 29, 2005 to October 01, 2005, Emergency Declared EM-3217: September 05, 2005, FEMA Id: 3217, Natural disaster type: Hurricane
- Tennessee Severe Storms, Tornadoes and Flooding, Incident Period: May 04, 2003 to May 30, 2003, Major Disaster (Presidential) Declared DR-1464: May 08, 2003, FEMA Id: 1464, Natural disaster type: Storm, Tornado, Flood
- Tennessee Severe Storms, Tornadoes and Flooding, Incident Period: November 09, 2002 to November 12, 2002, Major Disaster (Presidential) Declared DR-1441: November 13, 2002, FEMA Id: 1441, Natural disaster type: Storm, Tornado, Flood
- 5 other natural disasters have been reported since 1953.
The number of natural disasters in Tipton County (15) is near the US average (15).
Major Disasters (Presidential) Declared: 12
Emergencies Declared: 1
Causes of natural disasters: Floods: 11, Storms: 11, Tornadoes: 6, Winds: 4, Winter Storms: 2, Flash Flood: 1, Hurricane: 1, Ice Storm: 1, Landslide: 1, Mudslide: 1, Other: 1 (Note: some incidents may be assigned to more than one category).
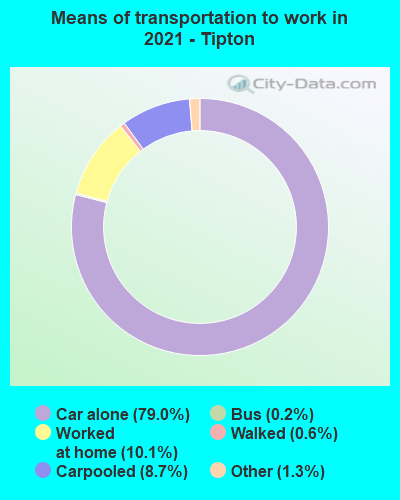
Means of transportation to work:
- Drove a car alone: 10,472 (72.5%)
- Carpooled: 1,268 (8.8%)
- Bus: 22 (0.2%)
- Taxicab, motorcycle, or other means: 270 (1.9%)
- Walked: 33 (0.2%)
- Worked at home: 2,620 (18.1%)

- Health care and social assistance (21%)
- Educational services (12%)
- Retail trade (12%)
- Public administration (7%)
- Manufacturing (6%)
- Accommodation and food services (5%)
- Finance and insurance (5%)
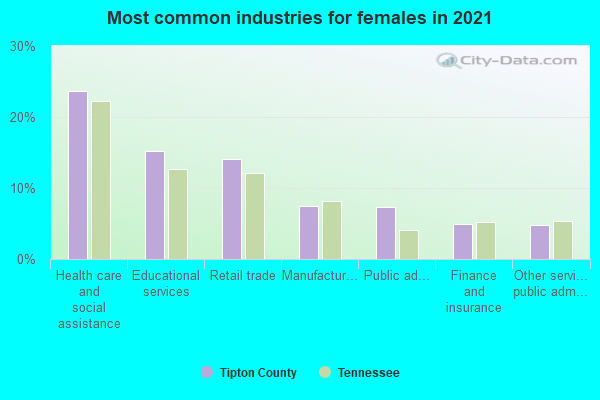
- Health care and social assistance (24%)
- Educational services (14%)
- Retail trade (13%)
- Public administration (8%)
- Manufacturing (7%)
- Accommodation and food services (6%)
- Finance and insurance (6%)
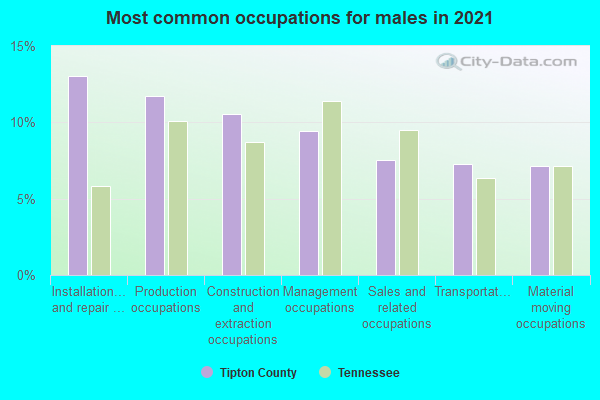
- Installation, maintenance, and repair occupations (15%)
- Production occupations (11%)
- Construction and extraction occupations (10%)
- Management occupations (9%)
- Sales and related occupations (9%)
- Material moving occupations (8%)
- Transportation occupations (6%)
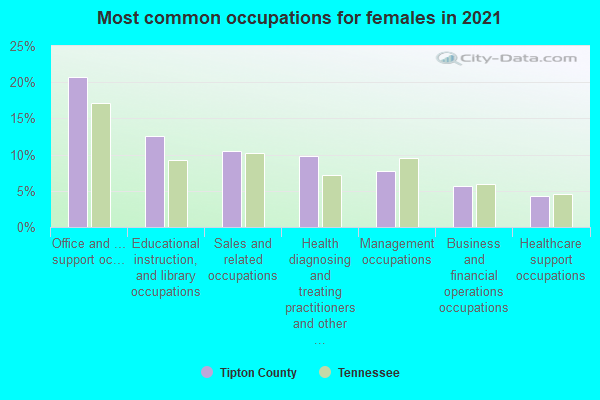
- Office and administrative support occupations (21%)
- Educational instruction, and library occupations (12%)
- Health diagnosing and treating practitioners and other technical occupations (11%)
- Sales and related occupations (9%)
- Management occupations (9%)
- Food preparation and serving related occupations (6%)
- Business and financial operations occupations (5%)

- Philippines (20%)
- Mexico (18%)
- Spain (16%)
- Cuba (9%)
- Sierra Leone (8%)
- Germany (6%)
- United Kingdom, excluding England and Scotland (4%)

- American (37%)
- English (7%)
- Irish (7%)
- German (3%)
- European (3%)
- Scottish (1%)
- Italian (1%)

People in group quarters in Tipton County, Tennessee in 2010:
- 615 people in federal detention centers
- 233 people in nursing facilities/skilled-nursing facilities
- 112 people in local jails and other municipal confinement facilities
- 2 people in other noninstitutional facilities
People in group quarters in Tipton County, Tennessee in 2000:
- 527 people in state prisons
- 268 people in nursing homes
- 69 people in local jails and other confinement facilities (including police lockups)
- 25 people in other noninstitutional group quarters
6.77% of this county's 2021 resident taxpayers lived in other counties in 2020 ($50,809 average adjusted gross income)
| Here: | 6.77% |
| Tennessee average: | 8.49% |
10 or fewer of this county's residents moved from foreign countries.
4.62% relocated from other counties in Tennessee ($32,778 average AGI)
2.15% relocated from other states ($18,031 average AGI)
Tipton County: 2.15% Tennessee average: 4.34%
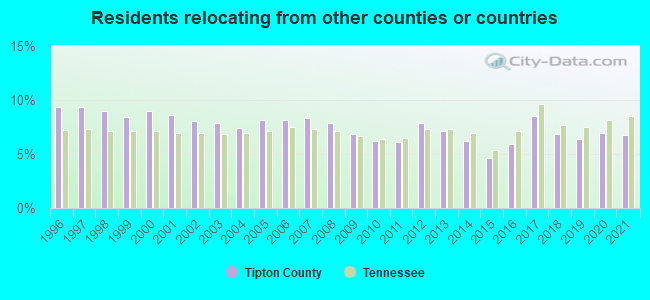
Top counties from which taxpayers relocated into this county between 2020 and 2021:
| from Shelby County, TN | |
| from Lauderdale County, TN | |
| from Fayette County, TN | |
| from DeSoto County, MS | |
| from Rutherford County, TN |
6.13% of this county's 2020 resident taxpayers moved to other counties in 2021 ($48,036 average adjusted gross income)
| Here: | 6.13% |
| Tennessee average: | 7.40% |
10 or fewer of this county's residents moved to foreign countries.
3.97% relocated to other counties in Tennessee ($28,578 average AGI)
2.16% relocated to other states ($19,458 average AGI)
Tipton County: 2.16% Tennessee average: 3.20%
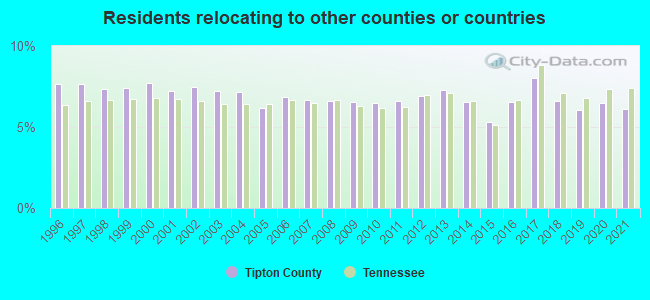
Top counties to which taxpayers relocated from this county between 2020 and 2021:
| to Shelby County, TN | |
| to Lauderdale County, TN | |
| to Fayette County, TN | |
| to DeSoto County, MS | |
| to Haywood County, TN |
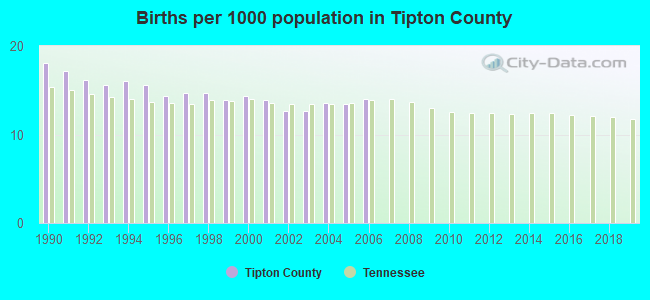
Births per 1000 population from 1990 to 1999: 15.6
Births per 1000 population from 2000 to 2006: 13.5
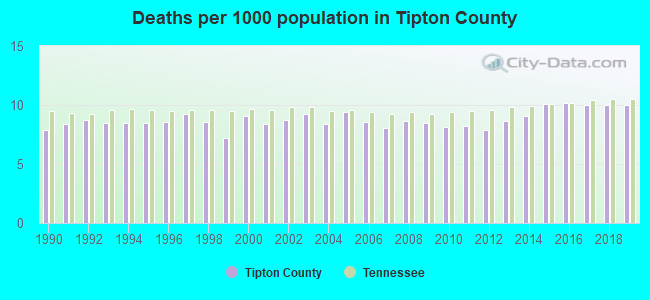
Deaths per 1000 population from 1990 to 1999: 8.4
Deaths per 1000 population from 2000 to 2009: 8.7
Deaths per 1000 population from 2010 to 2020: 9.4
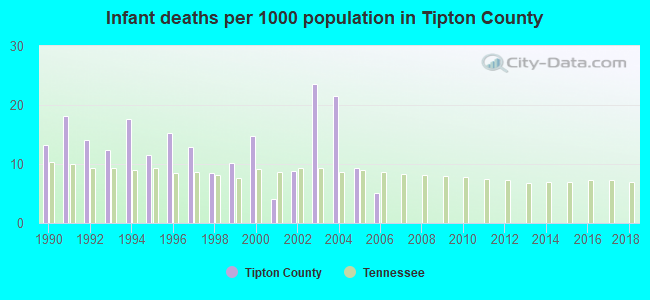
Infant deaths per 1000 live births from 1990 to 1999: 13.4
Infant deaths per 1000 live births from 2000 to 2006: 12.5
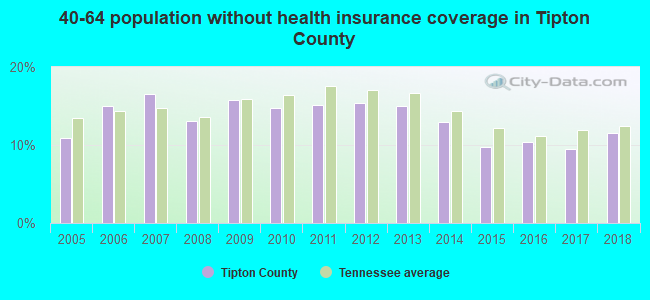
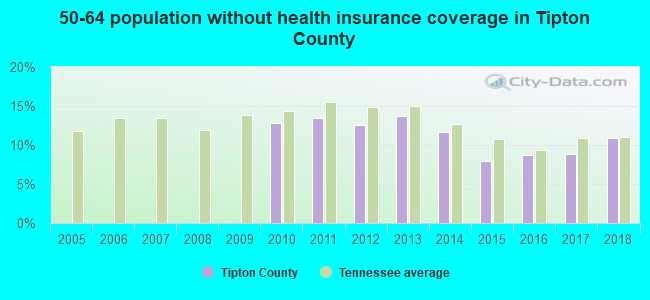
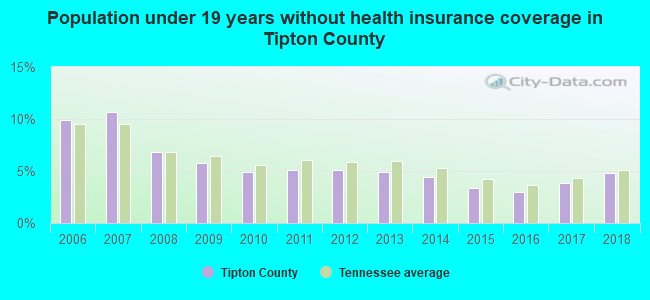
Persons under 19 years old without health insurance coverage in 2018: 4.8%


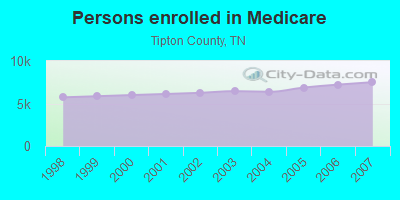
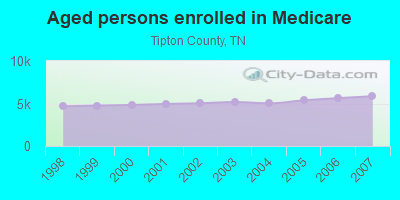
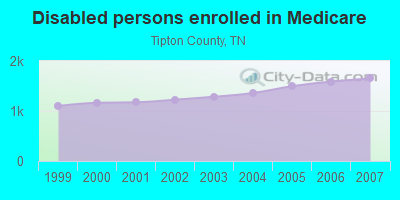
Persons enrolled in hospital insurance and/or supplemental medical insurance (Medicare) in July 1, 2007: 7,510 (5,859 aged, 1,651 disabled)
Children under 18 without health insurance coverage in 2007: 1,037 (6%)
Most common underlying causes of death in Tipton County, Tennessee in 1999 - 2019:
- Acute myocardial infarction, unspecified (1,049)
- Bronchus or lung, unspecified - Malignant neoplasms (857)
- Atherosclerotic heart disease (653)
- Chronic obstructive pulmonary disease, unspecified (532)
- Alzheimer disease, unspecified (320)
- Stroke, not specified as haemorrhage or infarction (255)
- Unspecified dementia (216)
- Pneumonia, unspecified (161)
- Colon, unspecified - Malignant neoplasms (139)
- Congestive heart failure (77)
Population without health insurance coverage in 2000: 12%
Children under 18 without health insurance coverage in 2000: 7%
Short term general hospital admissions per 100,000 population in 2004: 4,117
Short term general hospital beds per 100,000 population in 2004: 99
Emergency room visits per 100,000 population in 2004: 32,663
General practice office based MDs per 100,000 population in 2005: 1,261
Medical specialist MDs per 100,000 population in 2005: 821
Dentists per 100,000 population in 1998: 7
Total births per 100,000 population, July 2005 - July 2006 : 27
Total deaths per 100,000 population, July 2005 - July 2006: 48
Limited-service eating places per 100,000 population in 2005 : 2
Homicides per 1,000,000 population from 2000 to 2006: 77.1. This is less than state average.

- Firearm - 55.8
- Other - 21.3
Suicides per 1,000,000 population from 2000 to 2006: 103.7. This is less than state average.
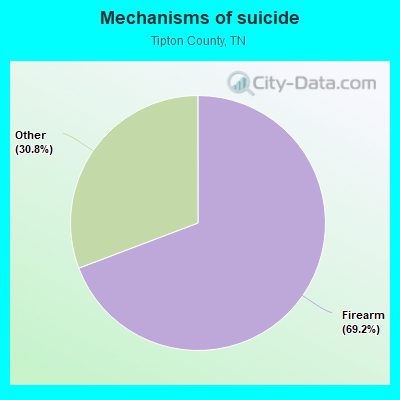
- Firearm - 71.8
- Other - 31.9
Household type by relationship:
Households: 62,242- Male householders: 11,539 (2,069 living alone), Female householders: 11,919 (2,570 living alone)
12,728 spouses (12,692 opposite-sex spouses), 1,298 unmarried partners, (1,261 opposite-sex unmarried partners), 18,770 children (17,134 natural, 374 adopted, 1,235 stepchildren), 2,384 grandchildren, 541 brothers or sisters, 818 parents, 36 foster children, 613 other relatives, 872 non-relatives
- In group quarters: 724
Size of family households: 7,766 2-persons, 4,861 3-persons, 3,120 4-persons, 1,568 5-persons, 395 6-persons, 340 7-or-more-persons.
Size of nonfamily households: 4,641 1-person, 707 2-persons, 62 3-persons, 5 4-persons.
8,529 married couples with children.
4,082 single-parent households (817 men, 3,265 women).
96.6% of residents of Tipton speak English at home.
1.7% of residents speak Spanish at home (70% speak English very well, 13% speak English well, 18% speak English not well).
0.7% of residents speak other Indo-European language at home (99% speak English very well, 1% speak English well).
0.5% of residents speak Asian or Pacific Island language at home (74% speak English very well, 11% speak English well, 15% speak English not well).
0.1% of residents speak other language at home (100% speak English very well).
In fiscal year 2004:
Federal Government expenditure: $283,194,000 ($5,175 per capita)
Department of Defense expenditure: $40,369,000
Federal direct payments to individuals for retirement and disability: $129,858,000
Federal other direct payments to individuals: $53,549,000
Federal direct payments not to individuals: $7,555,000
Federal grants: $69,583,000
Federal procurement contracts: $15,490,000 ($14,031,000 Department of Defense)
Federal salaries and wages: $7,159,000 ($462,000 Department of Defense)
Federal Government direct loans: $3,326,000
Federal guaranteed/insured loans: $58,731,000
Federal Government insurance: $26,590,000
Population change from April 1, 2000 to July 1, 2005:
Births: 3,706| Here: | 66 per 1000 residents |
| State: | 69 per 1000 residents |
Deaths: 2,491
| Here: | 44 per 1000 residents |
| State: | 50 per 1000 residents |
Net international migration: +96
| Here: | +2 per 1000 residents |
| State: | +8 per 1000 residents |
Net internal migration: +3,484
| Here: | +62 per 1000 residents |
| State: | +18 per 1000 residents |

Total withdrawal of fresh water for public supply: 6.23 millions of gallons per day (all from ground)
| Here: | 6.5 |
| State: | 6.5 |
| Here: | 5.2 |
| State: | 4.4 |

- Year house built in Tipton County, Tennessee
- 612020 or later
- 2,0052010 to 2019
- 5,6572000 to 2009
- 5,7371990 to 1999
- 2,9691980 to 1989
- 3,3941970 to 1979
- 1,3111960 to 1969
- 1,2321950 to 1959
- 6031940 to 1949
- 1,0691939 or earlier
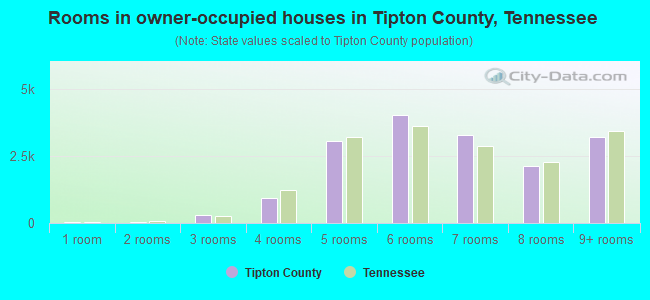
- Rooms in owner-occupied houses in Tipton County, Tennessee
- 341 room
- 252 rooms
- 3653 rooms
- 8904 rooms
- 2,9225 rooms
- 4,4876 rooms
- 3,3997 rooms
- 2,2218 rooms
- 3,4589+ rooms

- Rooms in renter-occupied apartments in Tipton County, Tennessee
- 1071 room
- 542 rooms
- 1593 rooms
- 1,4304 rooms
- 1,3405 rooms
- 1,2906 rooms
- 6387 rooms
- 3048 rooms
- 2619+ rooms
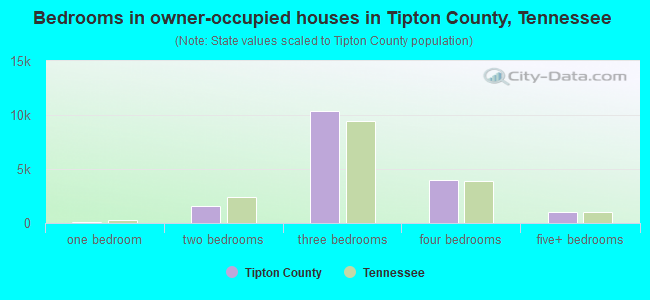
- Bedrooms in owner-occupied houses in Tipton County, Tennessee
- 67no bedroom
- 971 bedroom
- 1,7012 bedrooms
- 10,6733 bedrooms
- 4,1004 bedrooms
- 1,2195+ bedrooms
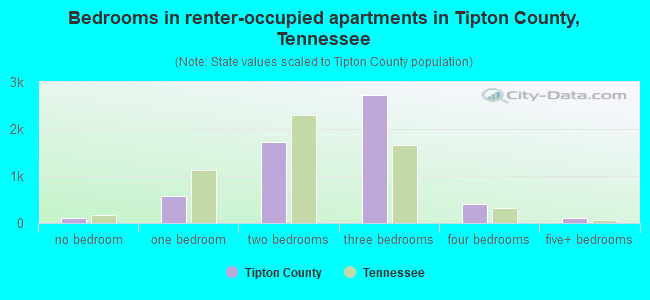
- Bedrooms in renter-occupied apartments in Tipton County, Tennessee
- 118no bedroom
- 3081 bedroom
- 1,8052 bedrooms
- 2,6523 bedrooms
- 6134 bedrooms
- 855+ bedrooms
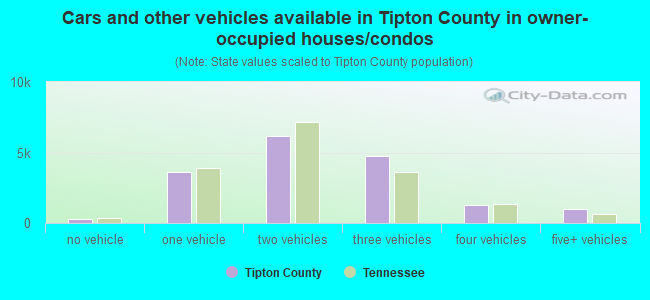
- Cars and other vehicles available in Tipton County in owner-occupied houses/condos
- 379no vehicle
- 3,7591 vehicle
- 6,8552 vehicles
- 4,6873 vehicles
- 1,3404 vehicles
- 7895+ vehicles

- Cars and other vehicles available in Tipton County in renter-occupied apartments
- 597no vehicle
- 2,3711 vehicle
- 1,8302 vehicles
- 5583 vehicles
- 1864 vehicles
- 1125+ vehicles
90.6% of Tipton County residents lived in the same house 1 years ago.
Out of people who lived in different houses, 33% lived in this county.
Out of people who lived in different counties, 62% lived in Tennessee.
| Tipton County: | 90.6% |
| State average: | 87.0% |
Place of birth for U.S.-born residents:
- This state: 42,962
- Other state: 17,391
- Northeast: 1,935
- Midwest: 4,271
- South: 8,678
- West: 2,547
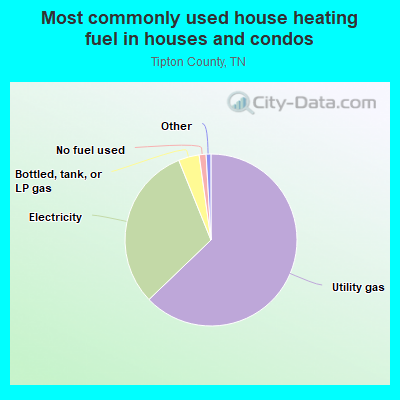
- 63.3%Utility gas
- 31.4%Electricity
- 3.2%Bottled, tank, or LP gas
- 1.3%No fuel used
- 0.6%Wood
- 0.2%Fuel oil, kerosene, etc.
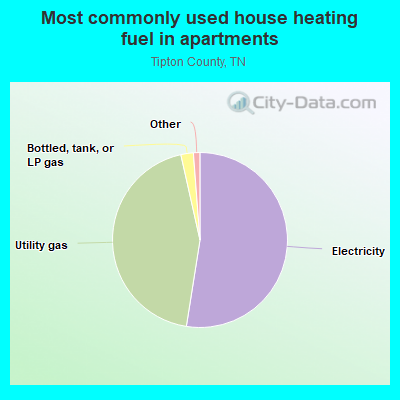
- 53.0%Electricity
- 43.3%Utility gas
- 2.3%Bottled, tank, or LP gas
- 0.7%No fuel used
- 0.4%Other fuel
Private vs. public school enrollment:
| Here: | 9.1% |
| Tennessee: | 15.0% |
| Here: | 8.4% |
| Tennessee: | 16.2% |
| Here: | 12.5% |
| Tennessee: | 23.5% |


Tipton County government finances - Expenditure in 2018:
- Charges - Elementary and Secondary Education - Other: $4,244,000
Elementary and Secondary Education School Lunch: $1,066,000
Solid Waste Management: $367,000
Other: $344,000
Miscellaneous Commercial Activities: $93,000
Elementary and Secondary Education School Tuition and Transportation: $17,000
- Construction - General - Other: $1,183,000
Elementary and Secondary Education: $543,000
Regular Highways: $73,000
- Current Operations - Elementary and Secondary Education: $91,989,000
Police Protection: $5,796,000
Regular Highways: $4,257,000
Correctional Institutions: $2,964,000
General - Other: $2,497,000
Central Staff Services: $2,084,000
Judicial and Legal Services: $1,672,000
Solid Waste Management: $1,318,000
Health - Other: $958,000
Financial Administration: $749,000
General Public Buildings: $354,000
Libraries: $313,000
Local Fire Protection: $275,000
Natural Resources - Other: $206,000
Parks and Recreation: $80,000
Public Welfare - Other: $59,000
Protective Inspection and Regulation - Other: $13,000
- Federal Intergovernmental - Other: $277,000
- General - Interest on Debt: $737,000
- Local Intergovernmental - Other: $2,549,000
Education: $1,117,000
- Long Term Debt - Beginning Outstanding - Unspecified Public Purpose: $15,393,000
Outstanding Unspecified Public Purpose: $12,999,000
Retired Unspecified Public Purpose: $2,394,000
- Miscellaneous - General Revenue - Other: $450,000
Interest Earnings: $393,000
Donations From Private Sources: $328,000
Fines and Forfeits: $236,000
Sale of Property: $72,000
Rents: $40,000
- Other Capital Outlay - Elementary and Secondary Education: $1,591,000
Regular Highways: $1,014,000
- Other Funds - Cash and Securities: $12,180,000
- Sinking Funds - Cash and Securities: $9,273,000
- State Intergovernmental - Education: $74,054,000
Highways: $2,544,000
General Local Government Support: $1,788,000
Public Welfare: $382,000
Other: $119,000
- Tax - Property: $16,896,000
Motor Vehicle License: $3,254,000
Other Selective Sales: $425,000
Occupation and Business License - Other: $196,000
Alcoholic Beverage Sales: $163,000
Other License: $128,000
Public Utility License: $60,000
Public Utilities Sales: $3,000
- Total Salaries and Wages: $57,432,000
Tipton County government finances - Revenue in 2018:
- Charges - Elementary and Secondary Education - Other: $4,244,000
Elementary and Secondary Education School Lunch: $1,066,000
Solid Waste Management: $367,000
Other: $344,000
Miscellaneous Commercial Activities: $93,000
Elementary and Secondary Education School Tuition and Transportation: $17,000
- Construction - General - Other: $1,183,000
Elementary and Secondary Education: $543,000
Regular Highways: $73,000
- Current Operations - Elementary and Secondary Education: $91,989,000
Police Protection: $5,796,000
Regular Highways: $4,257,000
Correctional Institutions: $2,964,000
General - Other: $2,497,000
Central Staff Services: $2,084,000
Judicial and Legal Services: $1,672,000
Solid Waste Management: $1,318,000
Health - Other: $958,000
Financial Administration: $749,000
General Public Buildings: $354,000
Libraries: $313,000
Local Fire Protection: $275,000
Natural Resources - Other: $206,000
Parks and Recreation: $80,000
Public Welfare - Other: $59,000
Protective Inspection and Regulation - Other: $13,000
- Federal Intergovernmental - Other: $277,000
- General - Interest on Debt: $737,000
- Local Intergovernmental - Other: $2,549,000
Education: $1,117,000
- Long Term Debt - Beginning Outstanding - Unspecified Public Purpose: $15,393,000
Outstanding Unspecified Public Purpose: $12,999,000
Retired Unspecified Public Purpose: $2,394,000
- Miscellaneous - General Revenue - Other: $450,000
Interest Earnings: $393,000
Donations From Private Sources: $328,000
Fines and Forfeits: $236,000
Sale of Property: $72,000
Rents: $40,000
- Other Capital Outlay - Elementary and Secondary Education: $1,591,000
Regular Highways: $1,014,000
- Other Funds - Cash and Securities: $12,180,000
- Sinking Funds - Cash and Securities: $9,273,000
- State Intergovernmental - Education: $74,054,000
Highways: $2,544,000
General Local Government Support: $1,788,000
Public Welfare: $382,000
Other: $119,000
- Tax - Property: $16,896,000
Motor Vehicle License: $3,254,000
Other Selective Sales: $425,000
Occupation and Business License - Other: $196,000
Alcoholic Beverage Sales: $163,000
Other License: $128,000
Public Utility License: $60,000
Public Utilities Sales: $3,000
- Total Salaries and Wages: $57,432,000
Tipton County government finances - Debt in 2018:
- Charges - Elementary and Secondary Education - Other: $4,244,000
Elementary and Secondary Education School Lunch: $1,066,000
Solid Waste Management: $367,000
Other: $344,000
Miscellaneous Commercial Activities: $93,000
Elementary and Secondary Education School Tuition and Transportation: $17,000
- Construction - General - Other: $1,183,000
Elementary and Secondary Education: $543,000
Regular Highways: $73,000
- Current Operations - Elementary and Secondary Education: $91,989,000
Police Protection: $5,796,000
Regular Highways: $4,257,000
Correctional Institutions: $2,964,000
General - Other: $2,497,000
Central Staff Services: $2,084,000
Judicial and Legal Services: $1,672,000
Solid Waste Management: $1,318,000
Health - Other: $958,000
Financial Administration: $749,000
General Public Buildings: $354,000
Libraries: $313,000
Local Fire Protection: $275,000
Natural Resources - Other: $206,000
Parks and Recreation: $80,000
Public Welfare - Other: $59,000
Protective Inspection and Regulation - Other: $13,000
- Federal Intergovernmental - Other: $277,000
- General - Interest on Debt: $737,000
- Local Intergovernmental - Other: $2,549,000
Education: $1,117,000
- Long Term Debt - Beginning Outstanding - Unspecified Public Purpose: $15,393,000
Outstanding Unspecified Public Purpose: $12,999,000
Retired Unspecified Public Purpose: $2,394,000
- Miscellaneous - General Revenue - Other: $450,000
Interest Earnings: $393,000
Donations From Private Sources: $328,000
Fines and Forfeits: $236,000
Sale of Property: $72,000
Rents: $40,000
- Other Capital Outlay - Elementary and Secondary Education: $1,591,000
Regular Highways: $1,014,000
- Other Funds - Cash and Securities: $12,180,000
- Sinking Funds - Cash and Securities: $9,273,000
- State Intergovernmental - Education: $74,054,000
Highways: $2,544,000
General Local Government Support: $1,788,000
Public Welfare: $382,000
Other: $119,000
- Tax - Property: $16,896,000
Motor Vehicle License: $3,254,000
Other Selective Sales: $425,000
Occupation and Business License - Other: $196,000
Alcoholic Beverage Sales: $163,000
Other License: $128,000
Public Utility License: $60,000
Public Utilities Sales: $3,000
- Total Salaries and Wages: $57,432,000
Tipton County government finances - Cash and Securities in 2018:
- Charges - Elementary and Secondary Education - Other: $4,244,000
Elementary and Secondary Education School Lunch: $1,066,000
Solid Waste Management: $367,000
Other: $344,000
Miscellaneous Commercial Activities: $93,000
Elementary and Secondary Education School Tuition and Transportation: $17,000
- Construction - General - Other: $1,183,000
Elementary and Secondary Education: $543,000
Regular Highways: $73,000
- Current Operations - Elementary and Secondary Education: $91,989,000
Police Protection: $5,796,000
Regular Highways: $4,257,000
Correctional Institutions: $2,964,000
General - Other: $2,497,000
Central Staff Services: $2,084,000
Judicial and Legal Services: $1,672,000
Solid Waste Management: $1,318,000
Health - Other: $958,000
Financial Administration: $749,000
General Public Buildings: $354,000
Libraries: $313,000
Local Fire Protection: $275,000
Natural Resources - Other: $206,000
Parks and Recreation: $80,000
Public Welfare - Other: $59,000
Protective Inspection and Regulation - Other: $13,000
- Federal Intergovernmental - Other: $277,000
- General - Interest on Debt: $737,000
- Local Intergovernmental - Other: $2,549,000
Education: $1,117,000
- Long Term Debt - Beginning Outstanding - Unspecified Public Purpose: $15,393,000
Outstanding Unspecified Public Purpose: $12,999,000
Retired Unspecified Public Purpose: $2,394,000
- Miscellaneous - General Revenue - Other: $450,000
Interest Earnings: $393,000
Donations From Private Sources: $328,000
Fines and Forfeits: $236,000
Sale of Property: $72,000
Rents: $40,000
- Other Capital Outlay - Elementary and Secondary Education: $1,591,000
Regular Highways: $1,014,000
- Other Funds - Cash and Securities: $12,180,000
- Sinking Funds - Cash and Securities: $9,273,000
- State Intergovernmental - Education: $74,054,000
Highways: $2,544,000
General Local Government Support: $1,788,000
Public Welfare: $382,000
Other: $119,000
- Tax - Property: $16,896,000
Motor Vehicle License: $3,254,000
Other Selective Sales: $425,000
Occupation and Business License - Other: $196,000
Alcoholic Beverage Sales: $163,000
Other License: $128,000
Public Utility License: $60,000
Public Utilities Sales: $3,000
- Total Salaries and Wages: $57,432,000
Supplemental Security Income (SSI) in 2006:
- Total number of recipients: 1,572
- Number of aged recipients: 187
- Number of blind and disabled recipients: 1,385
- Number of recipients under 18: 265
- Number of recipients between 18 and 64: 938
- Number of recipients older than 64: 369
- Number of recipients also receiving OASDI: 568
- Amount of payments (thousands of dollars): 706
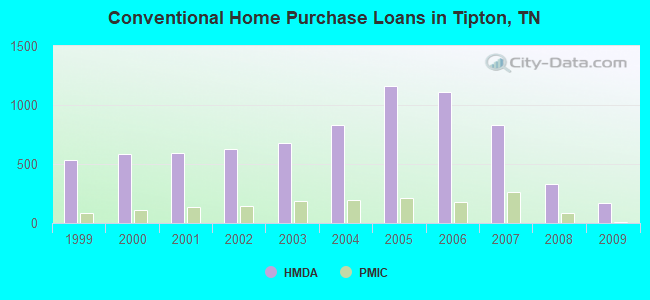
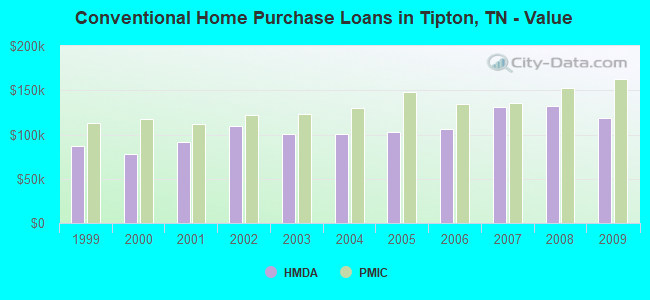
| Home Mortgage Disclosure Act Aggregated Statistics For Year 2009 (Based on 12 full tracts) | ||||||||||||
| A) FHA, FSA/RHS & VA Home Purchase Loans | B) Conventional Home Purchase Loans | C) Refinancings | D) Home Improvement Loans | F) Non-occupant Loans on < 5 Family Dwellings (A B C & D) | G) Loans On Manufactured Home Dwelling (A B C & D) | |||||||
|---|---|---|---|---|---|---|---|---|---|---|---|---|
| Number | Average Value | Number | Average Value | Number | Average Value | Number | Average Value | Number | Average Value | Number | Average Value | |
| LOANS ORIGINATED | 352 | $146,415 | 172 | $118,541 | 1,000 | $143,505 | 81 | $26,074 | 145 | $91,083 | 34 | $53,412 |
| APPLICATIONS APPROVED, NOT ACCEPTED | 7 | $158,429 | 7 | $129,429 | 79 | $143,190 | 6 | $28,500 | 4 | $112,250 | 8 | $49,000 |
| APPLICATIONS DENIED | 42 | $108,929 | 39 | $79,949 | 419 | $138,523 | 40 | $22,650 | 27 | $82,444 | 34 | $68,088 |
| APPLICATIONS WITHDRAWN | 27 | $147,926 | 19 | $128,474 | 308 | $136,737 | 14 | $71,286 | 7 | $107,000 | 7 | $95,000 |
| FILES CLOSED FOR INCOMPLETENESS | 5 | $143,800 | 0 | $0 | 70 | $140,314 | 0 | $0 | 1 | $48,000 | 1 | $74,000 |
| Private Mortgage Insurance Companies Aggregated Statistics For Year 2009 (Based on 11 full tracts) | ||||||
| A) Conventional Home Purchase Loans | B) Refinancings | D) Loans On Manufactured Home Dwelling (A & B) | ||||
|---|---|---|---|---|---|---|
| Number | Average Value | Number | Average Value | Number | Average Value | |
| LOANS ORIGINATED | 9 | $162,333 | 31 | $186,065 | 0 | $0 |
| APPLICATIONS APPROVED, NOT ACCEPTED | 6 | $162,333 | 25 | $186,320 | 0 | $0 |
| APPLICATIONS DENIED | 3 | $199,333 | 5 | $157,200 | 1 | $72,000 |
| APPLICATIONS WITHDRAWN | 1 | $153,000 | 8 | $162,125 | 0 | $0 |
| FILES CLOSED FOR INCOMPLETENESS | 0 | $0 | 2 | $152,500 | 0 | $0 |
| Most common first names in Tipton County, TN among deceased individuals | ||
| Name | Count | Lived (average) |
|---|---|---|
| James | 414 | 71.6 years |
| William | 320 | 73.6 years |
| Mary | 311 | 78.1 years |
| John | 303 | 73.3 years |
| Robert | 208 | 72.5 years |
| Willie | 192 | 73.8 years |
| Charles | 130 | 70.3 years |
| George | 125 | 75.2 years |
| Annie | 124 | 79.2 years |
| Thomas | 96 | 71.1 years |
| Most common last names in Tipton County, TN among deceased individuals | ||
| Last name | Count | Lived (average) |
|---|---|---|
| Smith | 292 | 74.5 years |
| Jones | 129 | 71.6 years |
| Johnson | 118 | 72.6 years |
| Taylor | 116 | 74.1 years |
| Williams | 100 | 74.2 years |
| Wilson | 85 | 76.3 years |
| Jackson | 84 | 72.6 years |
| Gray | 77 | 75.8 years |
| Hall | 75 | 71.9 years |
| Davis | 65 | 74.8 years |
| Businesses in Tipton County, TN | ||||
| Name | Count | Name | Count | |
|---|---|---|---|---|
| AT&T | 3 | Lowe's | 1 | |
| Advance Auto Parts | 2 | MasterBrand Cabinets | 1 | |
| Arby's | 1 | Maurices | 1 | |
| AutoZone | 3 | McDonald's | 4 | |
| Baskin-Robbins | 2 | Nike | 3 | |
| Blockbuster | 1 | Payless | 1 | |
| Burger King | 3 | Penske | 1 | |
| Chevrolet | 1 | Pizza Hut | 3 | |
| Comfort Inn | 1 | Popeyes | 2 | |
| Cricket Wireless | 2 | Quality | 2 | |
| Days Inn | 2 | Quiznos | 1 | |
| Domino's Pizza | 1 | RadioShack | 1 | |
| Econo Lodge | 1 | Rite Aid | 1 | |
| FedEx | 11 | Ryan's Grill | 1 | |
| Ford | 2 | SAS Shoes | 1 | |
| GNC | 1 | SONIC Drive-In | 3 | |
| GameStop | 2 | Sears | 1 | |
| Goodwill | 1 | Starbucks | 1 | |
| H&R Block | 3 | Subway | 5 | |
| Hilton | 1 | Super 8 | 1 | |
| Holiday Inn | 2 | T-Mobile | 2 | |
| Home Depot | 1 | Taco Bell | 3 | |
| IHOP | 1 | U-Haul | 3 | |
| KFC | 3 | UPS | 8 | |
| Kroger | 3 | Walgreens | 3 | |
| La-Z-Boy | 1 | Walmart | 2 | |
| Lane Furniture | 1 | Wendy's | 2 | |
| Little Caesars Pizza | 2 | YMCA | 1 | |