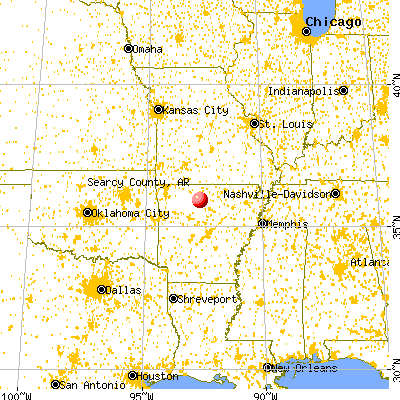
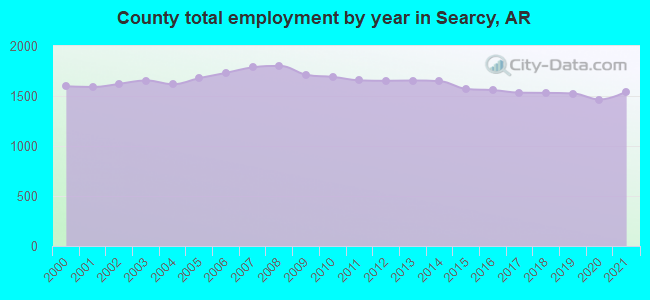
Searcy County, Arkansas (AR)
County owner-occupied free and clear houses and condos in 2010: 1,633
County owner-occupied houses and condos in 2000: 2,737
Renter-occupied apartments: 845 (it was 786 in 2000)
| % of renters here: | 22% |
| State: | 33% |
Land area: 667 sq. mi.
Water area: 1.4 sq. mi.
Population density: 12 people per square mile (low).
Industries providing employment: Educational, health and social services (27.6%), Manufacturing (16.9%), Retail trade (16.3%).
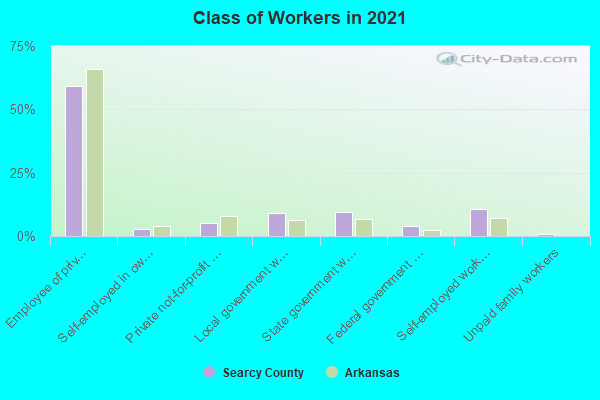
Type of workers:
- Private wage or salary: 69%
- Government: 21%
- Self-employed, not incorporated: 9%
- Unpaid family work: 1%
- OSM Map
- General Map
- Google Map
- MSN Map

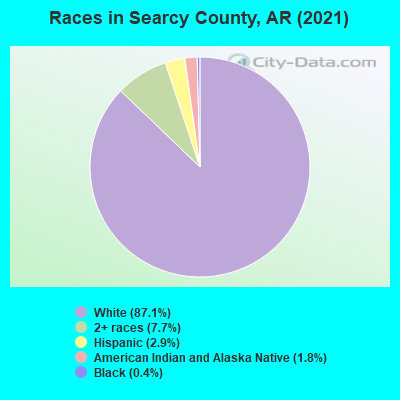
- 6,78884.8%White Non-Hispanic Alone
- 80010.0%Two or more races
- 2503.1%Hispanic or Latino
- 1191.5%American Indian and Alaska Native alone
- 310.4%Black Non-Hispanic Alone
- 210.3%Asian alone
| Median resident age: | 47.5 years |
| Arkansas median age: | 38.9 years |
| Males: 3,977 | |
| Females: 3,973 |

 | Permits, etc in Marion County (27 replies) |
| Planning Move to North Central Arkansas (50 replies) |
| Making the Bible Arkansas's state book (97 replies) |
| Are there anymore dry places in Northwest Arkansas? (33 replies) |
| Moving to Arkansas from the West? (41 replies) |
| Are there counties in Arkansas where I can buy land and live in my campervan? (25 replies) |
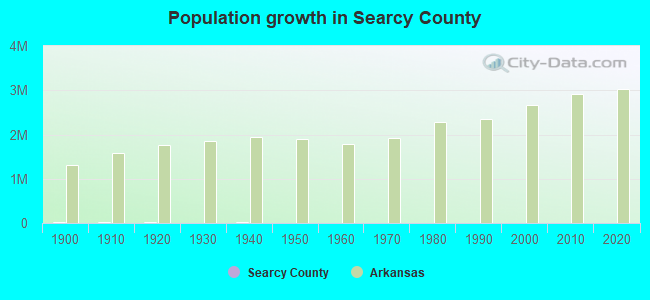
| Searcy County: | 2.0 people |
| Arkansas: | 2 people |
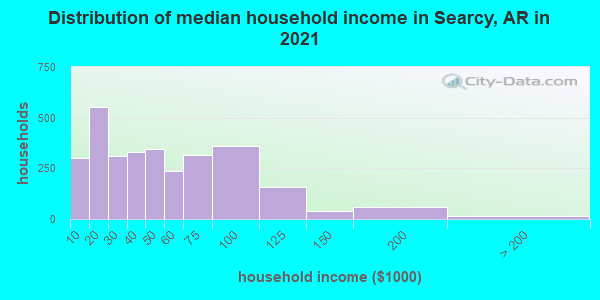
Estimated median household income in 2022: $41,388 ($21,397 in 1999)
| This county: | $41,388 |
| Arkansas: | $55,432 |
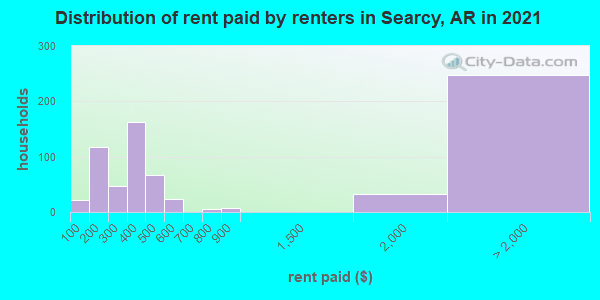
Median contract rent in 2022 for apartments: $329 (lower quartile is $193, upper quartile is $431)
| This county: | $329 |
| State: | $654 |
Estimated median house or condo value in 2022: $118,575 (it was $47,300 in 2000)
| Searcy: | $118,575 |
| Arkansas: | $179,800 |
Median monthly housing costs for homes and condos with a mortgage: $1,099
Median monthly housing costs for units without a mortgage: $353
Institutionalized population: 71
Crime in 2021 (reported by the sheriff's office or county police, not the county total):
- Murders: 0
- Rapes: 3
- Robberies: 0
- Assaults: 14
- Burglaries: 4
- Thefts: 6
- Auto thefts: 1
Crime in 2020 (reported by the sheriff's office or county police, not the county total):
- Murders: 0
- Rapes: 2
- Robberies: 0
- Assaults: 14
- Burglaries: 11
- Thefts: 4
- Auto thefts: 0
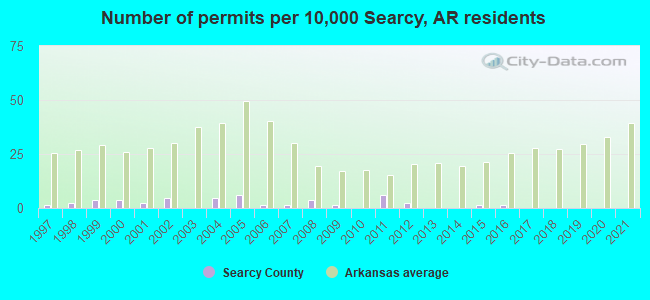
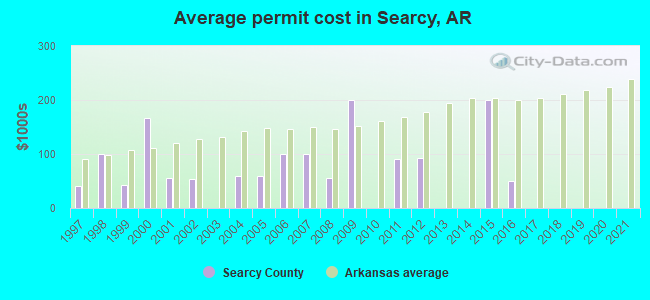
Single-family new house construction building permits:
- 2022: 0 buildings
- 2021: 0 buildings
- 2020: 0 buildings
- 2019: 0 buildings
- 2018: 0 buildings
- 2017: 0 buildings
- 2016: 1 building, cost: $50,000
- 2015: 1 building, cost: $200,000
- 2014: 0 buildings
- 2013: 0 buildings
- 2012: 2 buildings, average cost: $92,000
- 2011: 5 buildings, average cost: $90,000
- 2010: 0 buildings
- 2009: 1 building, cost: $200,000
- 2008: 3 buildings, average cost: $55,000
- 2007: 1 building, cost: $100,000
- 2006: 1 building, cost: $100,000
- 2005: 5 buildings, average cost: $59,000
- 2004: 4 buildings, average cost: $59,800
- 2003: 0 buildings
- 2002: 4 buildings, average cost: $52,500
- 2001: 2 buildings, average cost: $54,500
- 2000: 3 buildings, average cost: $166,700
- 1999: 3 buildings, average cost: $42,700
- 1998: 2 buildings, average cost: $100,000
- 1997: 1 building, cost: $40,000
Median real estate property taxes paid for housing units with mortgages in 2022: $629 (0.4%)
Median real estate property taxes paid for housing units with no mortgage in 2022: $450 (0.4%)

| Searcy County: | 27.5% |
| Arkansas: | 16.8% |
Median age of residents in 2022: 47.5 years old
(Males: 46.9 years old, Females: 49.1 years old)
(Median age for: White residents: 49.1 years old, Black residents: 13.8 years old, American Indian residents: 48.6 years old, Hispanic or Latino residents: 27.0 years old)
Fair market rent in 2006 for a 1-bedroom apartment in Searcy County is $383 a month.
Fair market rent for a 2-bedroom apartment is $460 a month.
Fair market rent for a 3-bedroom apartment is $594 a month.
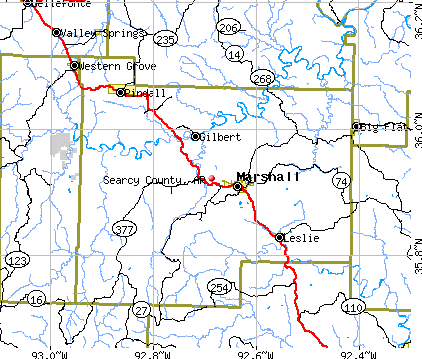
Cities in this county include: Marshall, Leslie, Pindall, St. Joe, Gilbert.
Neighboring counties: Benton County, Tennessee  , Cleburne County
  , Coffee County, Tennessee , Dare County, North Carolina , Greene County, Tennessee , Hyde County, North Carolina , Hutchinson County, Texas
  .
.
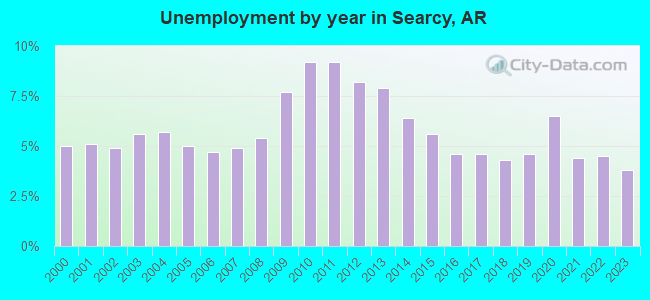
| Here: | 4.5% |
| Arkansas: | 3.4% |
Current college students: 208
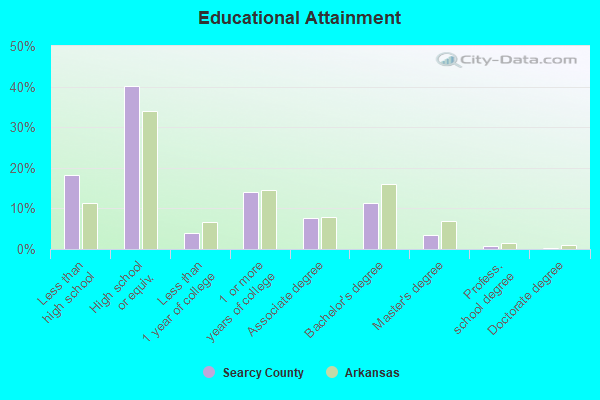
People 25 years of age or older with a high school degree or higher: 82.0%
People 25 years of age or older with a bachelor's degree or higher: 14.9%
Number of foreign born residents: 51 (36.7% naturalized citizens)
| Searcy County: | 0.6% |
| Whole state: | 5.1% |
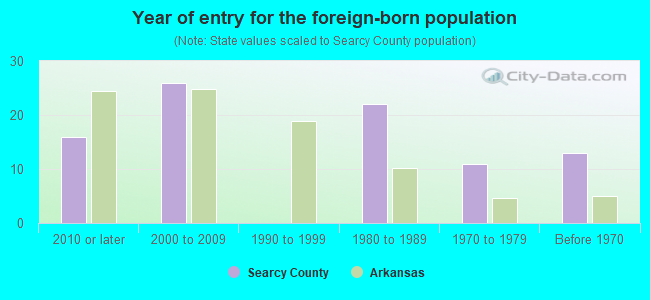
- Year of entry for the foreign-born population
- 152010 or later
- 192000 to 2009
- 01990 to 1999
- 221980 to 1989
- 111970 to 1979
- 13Before 1970
Mean travel time to work (commute): minutes
Percentage of county residents living and working in this county: 99.8%

Housing units in structures:
- One, detached: 3,594
- One, attached: 40
- Two: 11
- 3 or 4: 87
- 5 to 9: 31
- 10 to 19: 10
- 20 to 49: 90
- 50 or more: 2
- Mobile homes: 914
Housing units in Searcy County with a mortgage: 549 (53 second mortgage, 0 home equity loan, 11 both second mortgage and home equity loan)
Houses without a mortgage: 0
| Here: | 100.0% with mortgage |
| State: | 98.4% with mortgage |
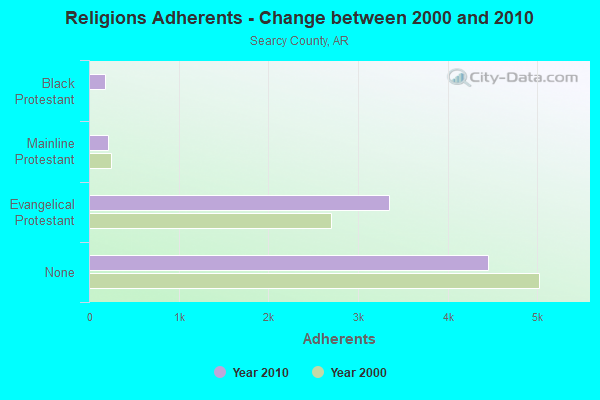
Religion statistics for Searcy County
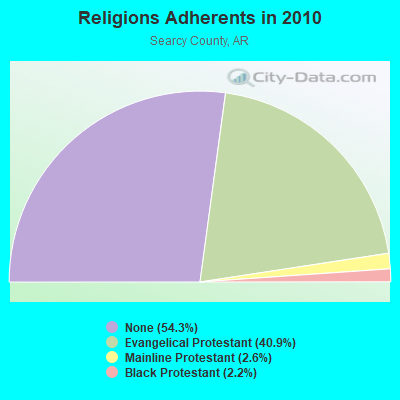
| Religion | Adherents | Congregations |
|---|---|---|
| Evangelical Protestant | 3,350 | 32 |
| Mainline Protestant | 216 | 2 |
| Black Protestant | 178 | 1 |
| Other | - | 1 |
| None | 4,451 | - |
Source: Clifford Grammich, Kirk Hadaway, Richard Houseal, Dale E.Jones, Alexei Krindatch, Richie Stanley and Richard H.Taylor. 2012. 2010 U.S.Religion Census: Religious Congregations & Membership Study. Association of Statisticians of American Religious Bodies. Jones, Dale E., et al. 2002. Congregations and Membership in the United States 2000. Nashville, TN: Glenmary Research Center.
Food Environment Statistics:
| Searcy County: | 2.48 / 10,000 pop. |
| State: | 2.02 / 10,000 pop. |
| Searcy County: | 4.96 / 10,000 pop. |
| Arkansas: | 4.94 / 10,000 pop. |
| This county: | 4.96 / 10,000 pop. |
| State: | 6.66 / 10,000 pop. |
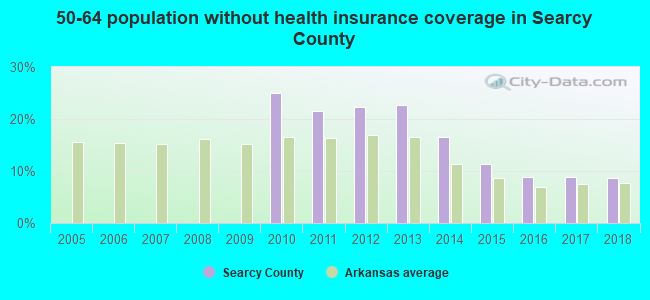
| Searcy County: | 11.7% |
| Arkansas: | 9.8% |
| Searcy County: | 29.1% |
| State: | 29.1% |
| Here: | 17.1% |
| State: | 13.6% |
Agriculture in Searcy County:
Average size of farms: 298 acresAverage value of agricultural products sold per farm: $15,144
Average value of crops sold per acre for harvested cropland: $18.44
The value of livestock, poultry, and their products as a percentage of the total market value of agricultural products sold: 95.94%
Average total farm production expenses per farm: $18,413
Harvested cropland as a percentage of land in farms: 11.18%
Irrigated harvested cropland as a percentage of land in farms: 0.52%
Average market value of all machinery and equipment per farm: $27,937
The percentage of farms operated by a family or individual: 97.07%
Average age of principal farm operators: 57 years
Average number of cattle and calves per 100 acres of all land in farms: 17.76
Milk cows as a percentage of all cattle and calves: 4.08%
Earthquake activity:
Searcy County-area historical earthquake activity is significantly above Arkansas state average. It is 548% greater than the overall U.S. average.On 9/3/2016 at 12:02:44, a magnitude 5.8 (5.8 MW, Depth: 3.5 mi, Class: Moderate, Intensity: VI - VII) earthquake occurred 239.3 miles away from Searcy County center
On 11/6/2011 at 03:53:10, a magnitude 5.7 (5.7 MW, Depth: 3.2 mi) earthquake occurred 230.5 miles away from the county center
On 2/28/2011 at 05:00:50, a magnitude 4.7 (4.7 MW, Depth: 2.0 mi, Class: Light, Intensity: IV - V) earthquake occurred 48.9 miles away from the county center
On 5/4/2001 at 06:42:12, a magnitude 4.7 (4.2 MB, 4.7 LG, 4.5 LG) earthquake occurred 56.8 miles away from the county center
On 1/21/1982 at 00:33:54, a magnitude 4.7 (4.5 MB, 4.7 LG, 4.5 LG) earthquake occurred 58.6 miles away from Searcy County center
On 3/25/1976 at 00:41:20, a magnitude 5.0 (4.9 MB, 5.0 LG) earthquake occurred 133.9 miles away from the county center
Magnitude types: regional Lg-wave magnitude (LG), body-wave magnitude (MB), moment magnitude (MW)
Most recent natural disasters:
- Arkansas Covid-19 Pandemic, Incident Period: January 20, 2020, FEMA Id: 4518, Natural disaster type: Other
- Arkansas Severe Storms, Tornadoes, Straight-line Winds, And Flooding, Incident Period: April 26, 2017 - May 19, 2017, FEMA Id: 4318, Natural disaster type: Storm, Tornado, Flood, Wind
- Arkansas Severe Storms, Tornadoes, Straight-line Winds, and Flooding, Incident Period: December 26, 2015 to January 22, 2016, Major Disaster (Presidential) Declared DR-4254: February 05, 2016, FEMA Id: 4254, Natural disaster type: Storm, Tornado, Flood, Wind
- Arkansas Severe Storms, Tornadoes, Straight-line Winds, and Flooding, Incident Period: May 07, 2015 to June 15, 2015, Major Disaster (Presidential) Declared DR-4226: June 26, 2015, FEMA Id: 4226, Natural disaster type: Storm, Tornado, Flood, Wind
- Arkansas Severe Winter Storm, Incident Period: December 05, 2013 to December 07, 2013, Major Disaster (Presidential) Declared DR-4160: January 06, 2014, FEMA Id: 4160, Natural disaster type: Winter Storm
- Arkansas Severe Storms, Tornadoes, and Flooding, Incident Period: May 30, 2013 to June 03, 2013, Major Disaster (Presidential) Declared DR-4124: June 25, 2013, FEMA Id: 4124, Natural disaster type: Storm, Tornado, Flood
- Arkansas Severe Storms, Tornadoes, and Associated Flooding, Incident Period: April 14, 2011 to June 03, 2011, Major Disaster (Presidential) Declared DR-1975: May 02, 2011, FEMA Id: 1975, Natural disaster type: Storm, Tornado, Flood
- Arkansas Severe Winter Storm, Incident Period: January 26, 2009 to January 30, 2009, Major Disaster (Presidential) Declared DR-1819: February 06, 2009, FEMA Id: 1819, Natural disaster type: Winter Storm
- Arkansas Severe Winter Storm, Incident Period: January 26, 2009 to January 30, 2009, Emergency Declared EM-3301: January 28, 2009, FEMA Id: 3301, Natural disaster type: Winter Storm
- Arkansas Severe Storms, Tornadoes, and Flooding, Incident Period: March 18, 2008 to April 28, 2008, Major Disaster (Presidential) Declared DR-1751: March 26, 2008, FEMA Id: 1751, Natural disaster type: Storm, Tornado, Flood
- 8 other natural disasters have been reported since 1953.
The number of natural disasters in Searcy County (18) is near the US average (15).
Major Disasters (Presidential) Declared: 13
Emergencies Declared: 3
Causes of natural disasters: Floods: 10, Storms: 10, Tornadoes: 7, Winter Storms: 4, Winds: 3, Drought: 1, Hurricane: 1, Ice Storm: 1, Landslide: 1, Other: 1 (Note: some incidents may be assigned to more than one category).

Means of transportation to work:
- Drove a car alone: 1,474 (78.0%)
- Carpooled: 200 (10.6%)
- Bus: 4 (0.2%)
- Taxicab, motorcycle, or other means: 48 (2.5%)
- Walked: 19 (1.0%)
- Worked at home: 131 (6.9%)
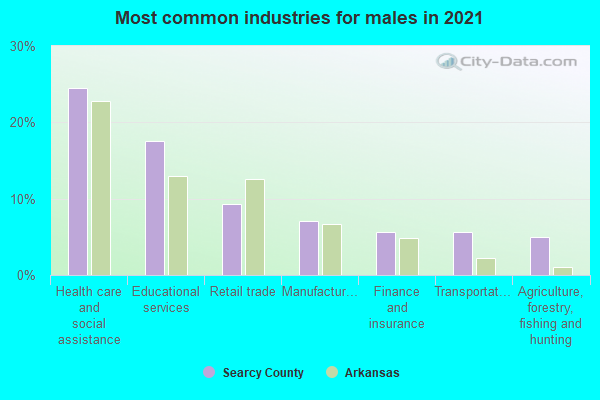
- Health care and social assistance (23%)
- Educational services (21%)
- Retail trade (14%)
- Manufacturing (9%)
- Finance and insurance (6%)
- Accommodation and food services (5%)
- Transportation and warehousing (4%)
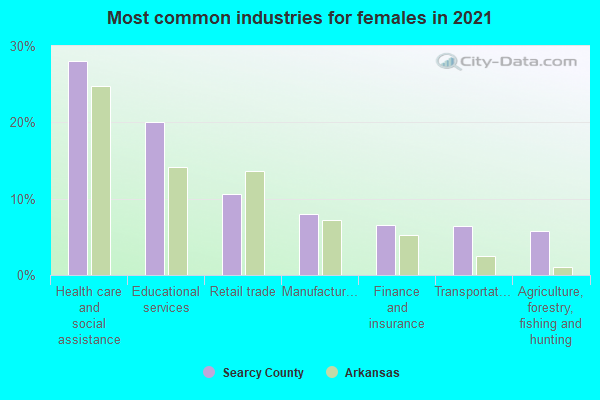
- Health care and social assistance (24%)
- Educational services (22%)
- Retail trade (15%)
- Manufacturing (9%)
- Finance and insurance (6%)
- Accommodation and food services (5%)
- Transportation and warehousing (4%)
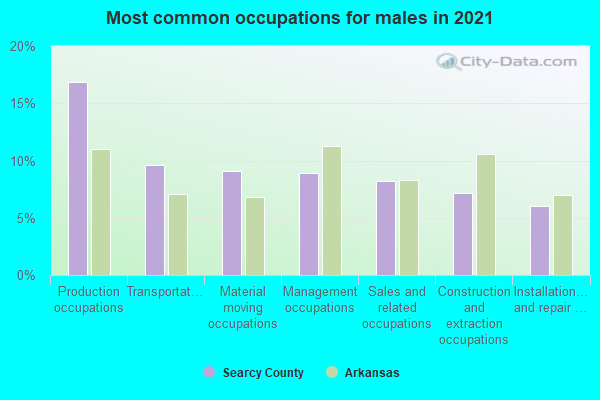
- Production occupations (15%)
- Material moving occupations (13%)
- Management occupations (8%)
- Transportation occupations (8%)
- Installation, maintenance, and repair occupations (8%)
- Sales and related occupations (7%)
- Construction and extraction occupations (7%)
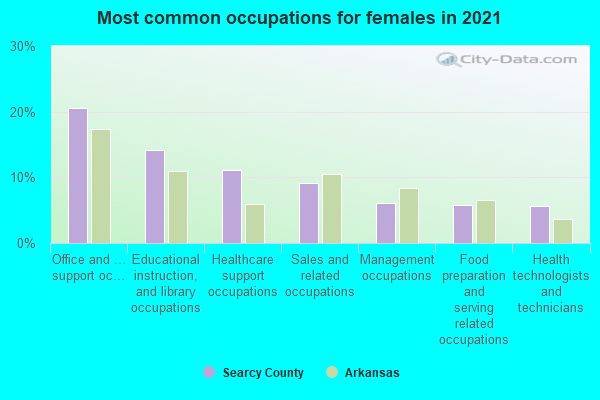
- Office and administrative support occupations (19%)
- Educational instruction, and library occupations (16%)
- Sales and related occupations (12%)
- Healthcare support occupations (7%)
- Management occupations (7%)
- Food preparation and serving related occupations (7%)
- Production occupations (5%)

- Mexico (56%)
- Thailand (36%)
- China, excluding Hong Kong and Taiwan (6%)
- Ireland (0%)
- Norway (0%)
- Sweden (0%)
- United Kingdom, excluding England and Scotland (0%)
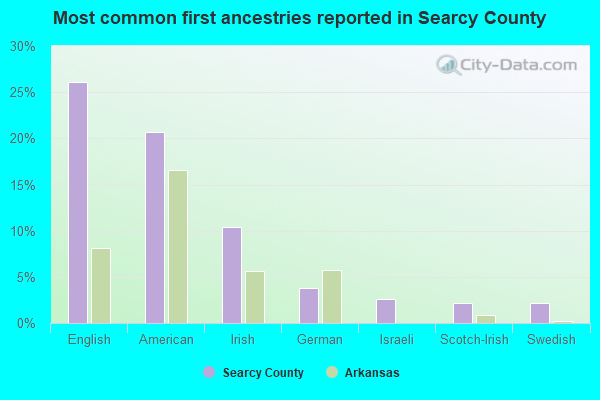
- English (27%)
- American (19%)
- Irish (10%)
- German (4%)
- European (2%)
- Israeli (2%)
- Swedish (2%)


11 people in local jails and other municipal confinement facilities
46 people in nursing homes
6 people in local jails and other confinement facilities (including police lockups)
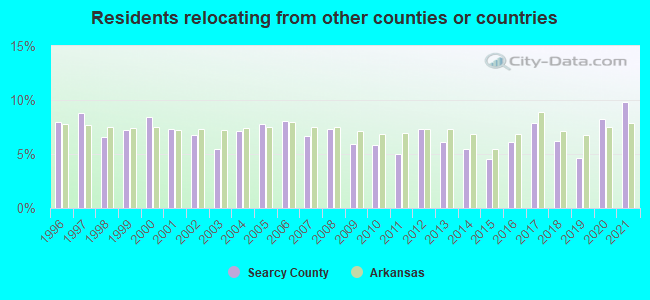
9.81% of this county's 2021 resident taxpayers lived in other counties in 2020 ($53,375 average adjusted gross income)
| Here: | 9.81% |
| Arkansas average: | 7.82% |
10 or fewer of this county's residents moved from foreign countries.
4.94% relocated from other counties in Arkansas ($19,637 average AGI)
4.87% relocated from other states ($33,738 average AGI)
Searcy County: 4.87% Arkansas average: 3.41%
Top counties from which taxpayers relocated into this county between 2020 and 2021:
| from Boone County, AR |
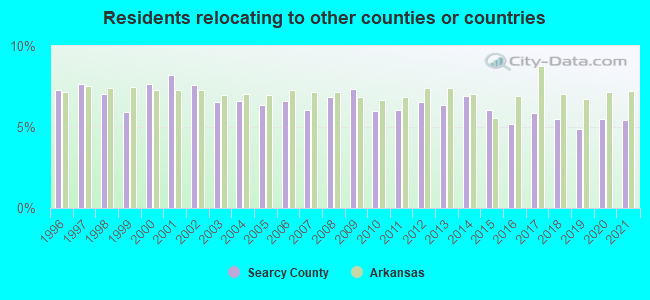
5.46% of this county's 2020 resident taxpayers moved to other counties in 2021 ($37,213 average adjusted gross income)
| Here: | 5.46% |
| Arkansas average: | 7.23% |
10 or fewer of this county's residents moved to foreign countries.
4.54% relocated to other counties in Arkansas ($31,184 average AGI)
0.92% relocated to other states ($6,037 average AGI)
Searcy County: 0.92% Arkansas average: 2.79%
Top counties to which taxpayers relocated from this county between 2020 and 2021:
| to Boone County, AR |
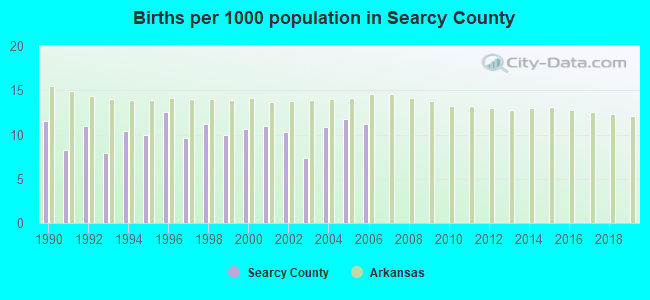
Births per 1000 population from 1990 to 1999: 10.2
Births per 1000 population from 2000 to 2006: 10.4
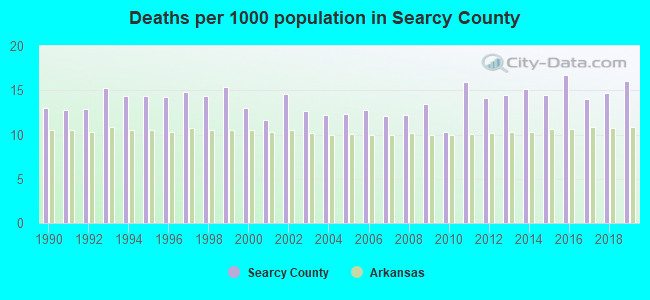
Deaths per 1000 population from 1990 to 1999: 14.1
Deaths per 1000 population from 2000 to 2009: 12.7
Deaths per 1000 population from 2010 to 2020: 14.7
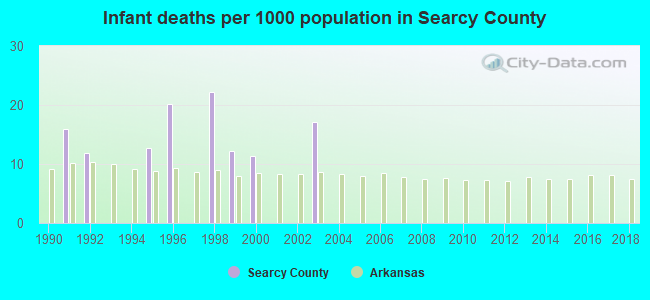
Infant deaths per 1000 live births from 1990 to 1999: 9.5
Infant deaths per 1000 live births from 2000 to 2006: 4.1
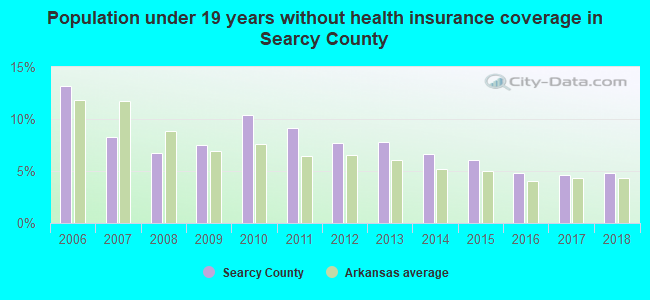
Persons under 19 years old without health insurance coverage in 2018: 4.8%
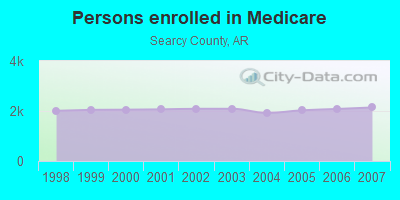
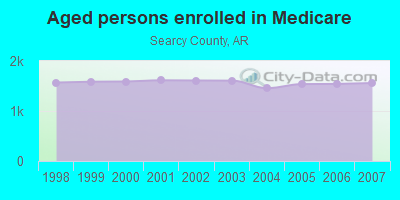
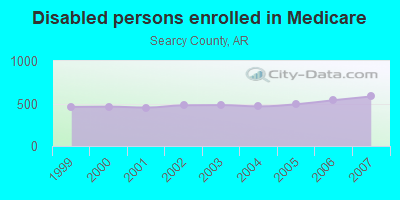
Persons enrolled in hospital insurance and/or supplemental medical insurance (Medicare) in July 1, 2007: 2,142 (1,559 aged, 583 disabled)
Children under 18 without health insurance coverage in 2007: 127 (7%)
Most common underlying causes of death in Searcy County, Arkansas in 1999 - 2019:
- Acute myocardial infarction, unspecified (277)
- Bronchus or lung, unspecified - Malignant neoplasms (104)
- Chronic obstructive pulmonary disease, unspecified (33)
- Stroke, not specified as haemorrhage or infarction (20)
- Atherosclerotic heart disease (11)
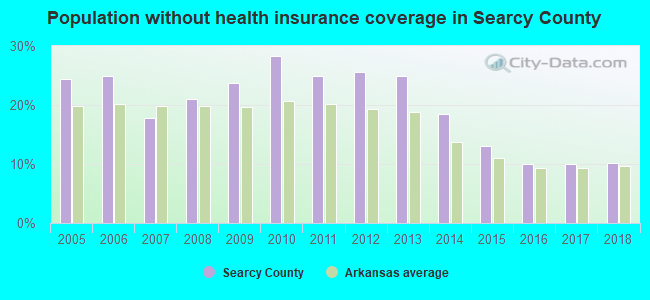
Population without health insurance coverage in 2000: 26%
Children under 18 without health insurance coverage in 2000: 23%
Household type by relationship:
Households: 7,950- Male householders: 1,514 (314 living alone), Female householders: 1,544 (564 living alone)
1,677 spouses (1,664 opposite-sex spouses), 162 unmarried partners, (162 opposite-sex unmarried partners), 2,175 children (2,085 natural, 2 adopted, 89 stepchildren), 180 grandchildren, 119 brothers or sisters, 47 parents, 0 foster children, 159 other relatives, 263 non-relatives
- In group quarters: 85
Size of family households: 1,105 2-persons, 542 3-persons, 169 4-persons, 109 5-persons, 107 6-persons, 23 7-or-more-persons.
Size of nonfamily households: 881 1-person, 116 2-persons, 13 3-persons.
1,114 married couples with children.
275 single-parent households (126 men, 149 women).
98.9% of residents of Searcy speak English at home.
0.6% of residents speak Spanish at home (45% speak English very well, 14% speak English well, 40% speak English not well).
0.1% of residents speak other Indo-European language at home (100% speak English very well).
0.2% of residents speak Asian or Pacific Island language at home (18% speak English very well, 82% speak English well).
In fiscal year 2004:
Federal Government expenditure: $65,712,000 ($8,163 per capita)
Department of Defense expenditure: $2,052,000
Federal direct payments to individuals for retirement and disability: $27,608,000
Federal other direct payments to individuals: $11,892,000
Federal direct payments not to individuals: $706,000
Federal grants: $22,519,000
Federal procurement contracts: $331,000 ($12,000 Department of Defense)
Federal salaries and wages: $2,656,000 ($574,000 Department of Defense)
Federal Government direct loans: $1,700,000
Federal guaranteed/insured loans: $88,000
Federal Government insurance: $0,000
Population change from April 1, 2000 to July 1, 2005:
Births: 387| Here: | 49 per 1000 residents |
| State: | 72 per 1000 residents |
Deaths: 536
| Here: | 67 per 1000 residents |
| State: | 53 per 1000 residents |
Net international migration: -4
| Here: | |
| State: |
Net internal migration: -118
| Here: | |
| State: |
Total withdrawal of fresh water for public supply: 0.81 millions of gallons per day (56% from ground, 44% from surface)
| Here: | 5.7 |
| State: | 6.1 |
| Here: | 4.5 |
| State: | 4.3 |
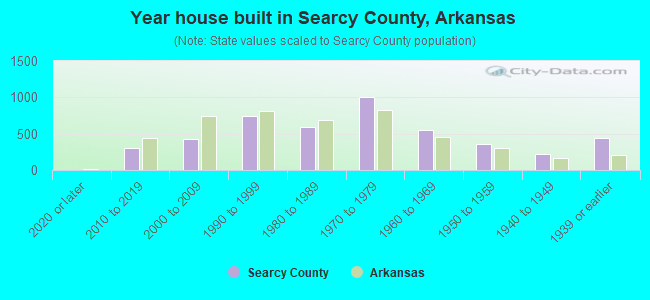
- Year house built in Searcy County, Arkansas
- 132020 or later
- 3972010 to 2019
- 3732000 to 2009
- 7341990 to 1999
- 5701980 to 1989
- 9351970 to 1979
- 5881960 to 1969
- 3361950 to 1959
- 2881940 to 1949
- 4071939 or earlier
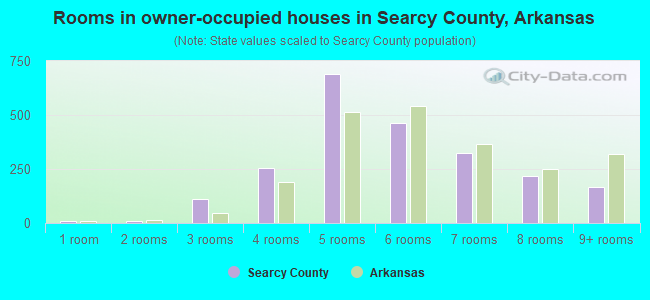
- Rooms in owner-occupied houses in Searcy County, Arkansas
- 91 room
- 182 rooms
- 1483 rooms
- 3084 rooms
- 5665 rooms
- 6016 rooms
- 2857 rooms
- 1988 rooms
- 1309+ rooms
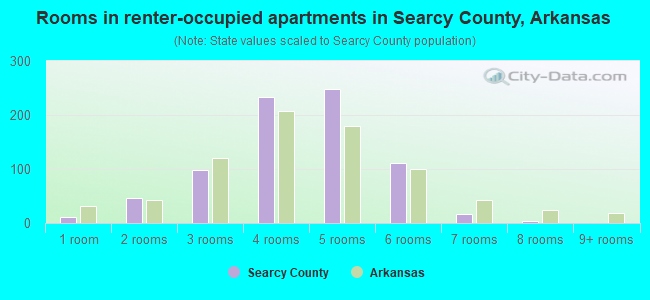
- Rooms in renter-occupied apartments in Searcy County, Arkansas
- 111 room
- 302 rooms
- 1493 rooms
- 2284 rooms
- 2285 rooms
- 1366 rooms
- 217 rooms
- 38 rooms
- 09+ rooms
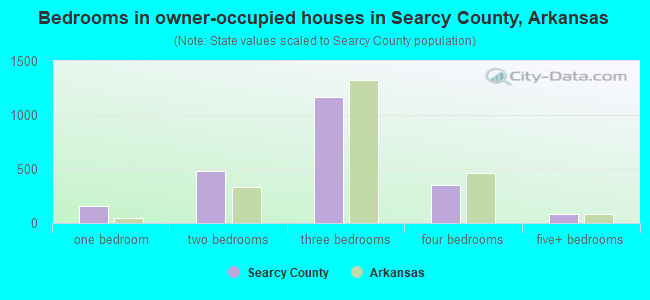
- Bedrooms in owner-occupied houses in Searcy County, Arkansas
- 9no bedroom
- 2381 bedroom
- 5352 bedrooms
- 1,0303 bedrooms
- 3774 bedrooms
- 695+ bedrooms
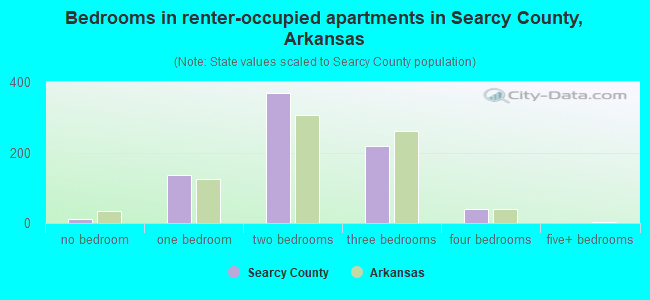
- Bedrooms in renter-occupied apartments in Searcy County, Arkansas
- 11no bedroom
- 1791 bedroom
- 3792 bedrooms
- 2053 bedrooms
- 434 bedrooms
- 05+ bedrooms
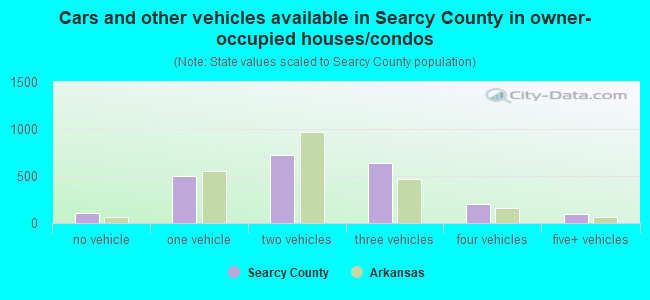
- Cars and other vehicles available in Searcy County in owner-occupied houses/condos
- 109no vehicle
- 5211 vehicle
- 6692 vehicles
- 6153 vehicles
- 2214 vehicles
- 1105+ vehicles
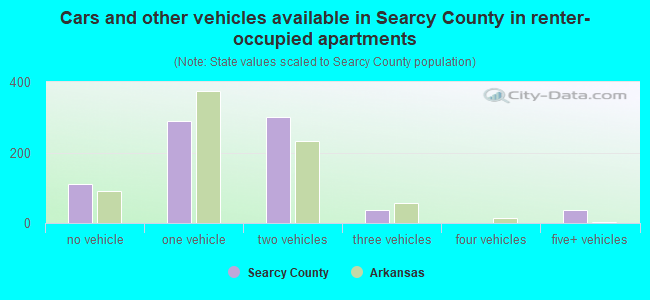
- Cars and other vehicles available in Searcy County in renter-occupied apartments
- 145no vehicle
- 3061 vehicle
- 2942 vehicles
- 393 vehicles
- 04 vehicles
- 325+ vehicles
90.3% of Searcy County residents lived in the same house 1 years ago.
Out of people who lived in different houses, 32% lived in this county.
Out of people who lived in different counties, 51% lived in Arkansas.
| Searcy County: | 90.3% |
| State average: | 87.0% |
Place of birth for U.S.-born residents:
- This state: 4,994
- Other state: 2,875
- Northeast: 300
- Midwest: 827
- South: 1,174
- West: 570

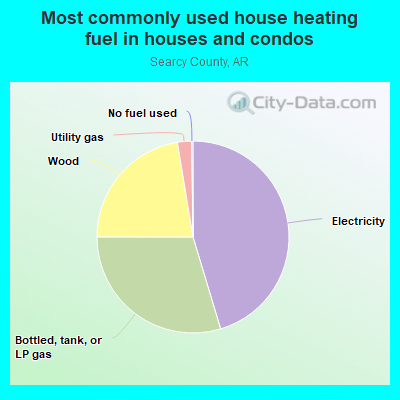
- 42.4%Electricity
- 31.4%Bottled, tank, or LP gas
- 24.1%Wood
- 1.9%Utility gas
- 0.2%No fuel used
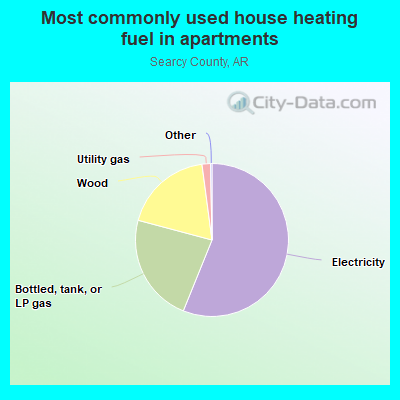
- 52.6%Electricity
- 27.1%Bottled, tank, or LP gas
- 18.6%Wood
- 1.4%Utility gas
- 0.4%No fuel used
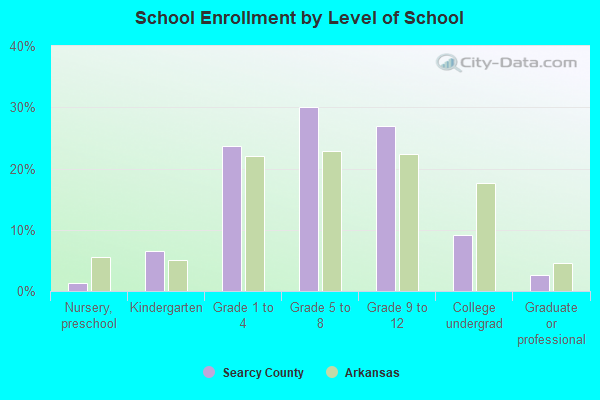
Private vs. public school enrollment:
| Here: | 8.6% |
| Arkansas: | 10.5% |
| Here: | 28.1% |
| Arkansas: | 8.7% |
| Here: | 25.9% |
| Arkansas: | 19.4% |

Searcy County government finances - Expenditure in 2018:
- Charges - Other: $154,000
Air Transportation: $10,000
Solid Waste Management: $9,000
- Construction - Air Transportation: $281,000
Parks and Recreation: $42,000
Water Utilities: $29,000
Regular Highways: $14,000
- Current Operations - Regular Highways: $1,484,000
Financial Administration: $646,000
Police Protection: $640,000
Solid Waste Management: $506,000
Libraries: $275,000
Air Transportation: $219,000
General - Other: $159,000
Central Staff Services: $129,000
Local Fire Protection: $74,000
Judicial and Legal Services: $50,000
Corrections - Other: $46,000
General Public Buildings: $43,000
Public Welfare - Other: $43,000
Parks and Recreation: $32,000
Correctional Institutions: $24,000
Health - Other: $20,000
- Federal Intergovernmental - Air Transportation: $357,000
Highways: $104,000
General Local Government Support: $98,000
Water Utilities: $22,000
- General - Interest on Debt: $0
- Intergovernmental to Local - Other - General - Other: $151,000
- Local Intergovernmental - Other: $50,000
- Long Term Debt - Beginning Outstanding - Unspecified Public Purpose: $3,000
Retired Unspecified Public Purpose: $3,000
- Miscellaneous - General Revenue - Other: $206,000
Fines and Forfeits: $189,000
Interest Earnings: $8,000
- Other Capital Outlay - Local Fire Protection: $66,000
Regular Highways: $51,000
Police Protection: $6,000
- Other Funds - Cash and Securities: $1,526,000
- State Intergovernmental - Highways: $1,090,000
General Local Government Support: $357,000
Other: $339,000
- Tax - Property: $1,147,000
General Sales and Gross Receipts: $681,000
Public Utilities Sales: $200,000
- Total Salaries and Wages: $432,000
Searcy County government finances - Revenue in 2018:
- Charges - Other: $154,000
Air Transportation: $10,000
Solid Waste Management: $9,000
- Construction - Air Transportation: $281,000
Parks and Recreation: $42,000
Water Utilities: $29,000
Regular Highways: $14,000
- Current Operations - Regular Highways: $1,484,000
Financial Administration: $646,000
Police Protection: $640,000
Solid Waste Management: $506,000
Libraries: $275,000
Air Transportation: $219,000
General - Other: $159,000
Central Staff Services: $129,000
Local Fire Protection: $74,000
Judicial and Legal Services: $50,000
Corrections - Other: $46,000
General Public Buildings: $43,000
Public Welfare - Other: $43,000
Parks and Recreation: $32,000
Correctional Institutions: $24,000
Health - Other: $20,000
- Federal Intergovernmental - Air Transportation: $357,000
Highways: $104,000
General Local Government Support: $98,000
Water Utilities: $22,000
- General - Interest on Debt: $0
- Intergovernmental to Local - Other - General - Other: $151,000
- Local Intergovernmental - Other: $50,000
- Long Term Debt - Beginning Outstanding - Unspecified Public Purpose: $3,000
Retired Unspecified Public Purpose: $3,000
- Miscellaneous - General Revenue - Other: $206,000
Fines and Forfeits: $189,000
Interest Earnings: $8,000
- Other Capital Outlay - Local Fire Protection: $66,000
Regular Highways: $51,000
Police Protection: $6,000
- Other Funds - Cash and Securities: $1,526,000
- State Intergovernmental - Highways: $1,090,000
General Local Government Support: $357,000
Other: $339,000
- Tax - Property: $1,147,000
General Sales and Gross Receipts: $681,000
Public Utilities Sales: $200,000
- Total Salaries and Wages: $432,000
Searcy County government finances - Debt in 2018:
- Charges - Other: $154,000
Air Transportation: $10,000
Solid Waste Management: $9,000
- Construction - Air Transportation: $281,000
Parks and Recreation: $42,000
Water Utilities: $29,000
Regular Highways: $14,000
- Current Operations - Regular Highways: $1,484,000
Financial Administration: $646,000
Police Protection: $640,000
Solid Waste Management: $506,000
Libraries: $275,000
Air Transportation: $219,000
General - Other: $159,000
Central Staff Services: $129,000
Local Fire Protection: $74,000
Judicial and Legal Services: $50,000
Corrections - Other: $46,000
General Public Buildings: $43,000
Public Welfare - Other: $43,000
Parks and Recreation: $32,000
Correctional Institutions: $24,000
Health - Other: $20,000
- Federal Intergovernmental - Air Transportation: $357,000
Highways: $104,000
General Local Government Support: $98,000
Water Utilities: $22,000
- General - Interest on Debt: $0
- Intergovernmental to Local - Other - General - Other: $151,000
- Local Intergovernmental - Other: $50,000
- Long Term Debt - Beginning Outstanding - Unspecified Public Purpose: $3,000
Retired Unspecified Public Purpose: $3,000
- Miscellaneous - General Revenue - Other: $206,000
Fines and Forfeits: $189,000
Interest Earnings: $8,000
- Other Capital Outlay - Local Fire Protection: $66,000
Regular Highways: $51,000
Police Protection: $6,000
- Other Funds - Cash and Securities: $1,526,000
- State Intergovernmental - Highways: $1,090,000
General Local Government Support: $357,000
Other: $339,000
- Tax - Property: $1,147,000
General Sales and Gross Receipts: $681,000
Public Utilities Sales: $200,000
- Total Salaries and Wages: $432,000
Searcy County government finances - Cash and Securities in 2018:
- Charges - Other: $154,000
Air Transportation: $10,000
Solid Waste Management: $9,000
- Construction - Air Transportation: $281,000
Parks and Recreation: $42,000
Water Utilities: $29,000
Regular Highways: $14,000
- Current Operations - Regular Highways: $1,484,000
Financial Administration: $646,000
Police Protection: $640,000
Solid Waste Management: $506,000
Libraries: $275,000
Air Transportation: $219,000
General - Other: $159,000
Central Staff Services: $129,000
Local Fire Protection: $74,000
Judicial and Legal Services: $50,000
Corrections - Other: $46,000
General Public Buildings: $43,000
Public Welfare - Other: $43,000
Parks and Recreation: $32,000
Correctional Institutions: $24,000
Health - Other: $20,000
- Federal Intergovernmental - Air Transportation: $357,000
Highways: $104,000
General Local Government Support: $98,000
Water Utilities: $22,000
- General - Interest on Debt: $0
- Intergovernmental to Local - Other - General - Other: $151,000
- Local Intergovernmental - Other: $50,000
- Long Term Debt - Beginning Outstanding - Unspecified Public Purpose: $3,000
Retired Unspecified Public Purpose: $3,000
- Miscellaneous - General Revenue - Other: $206,000
Fines and Forfeits: $189,000
Interest Earnings: $8,000
- Other Capital Outlay - Local Fire Protection: $66,000
Regular Highways: $51,000
Police Protection: $6,000
- Other Funds - Cash and Securities: $1,526,000
- State Intergovernmental - Highways: $1,090,000
General Local Government Support: $357,000
Other: $339,000
- Tax - Property: $1,147,000
General Sales and Gross Receipts: $681,000
Public Utilities Sales: $200,000
- Total Salaries and Wages: $432,000
Supplemental Security Income (SSI) in 2006:
- Total number of recipients: 449
- Number of aged recipients: 92
- Number of blind and disabled recipients: 357
- Number of recipients under 18: 32
- Number of recipients between 18 and 64: 263
- Number of recipients older than 64: 154
- Number of recipients also receiving OASDI: 261
- Amount of payments (thousands of dollars): 158
| Most common first names in Searcy County, AR among deceased individuals | ||
| Name | Count | Lived (average) |
|---|---|---|
| James | 74 | 75.3 years |
| William | 67 | 75.1 years |
| Mary | 58 | 78.8 years |
| John | 58 | 79.0 years |
| George | 33 | 77.1 years |
| Charles | 30 | 77.2 years |
| Thomas | 26 | 77.3 years |
| Roy | 24 | 77.2 years |
| Robert | 23 | 70.1 years |
| Myrtle | 17 | 81.3 years |
| Most common last names in Searcy County, AR among deceased individuals | ||
| Last name | Count | Lived (average) |
|---|---|---|
| Horton | 116 | 79.6 years |
| Smith | 44 | 75.6 years |
| Watts | 43 | 73.7 years |
| Treat | 42 | 77.8 years |
| Ragland | 41 | 78.5 years |
| Massey | 37 | 78.4 years |
| Morrison | 31 | 77.7 years |
| Taylor | 25 | 82.0 years |
| Harness | 25 | 73.8 years |
| Sutterfield | 25 | 75.9 years |
| Businesses in Searcy County, AR | ||||
| Name | Count | Name | Count | |
|---|---|---|---|---|
| H&R Block | 1 | Subway | 1 | |
| La-Z-Boy | 1 | True Value | 1 | |
| Pizza Hut | 1 | U-Haul | 1 | |
| RadioShack | 1 | UPS | 1 | |
| SONIC Drive-In | 1 | |||
Searcy County on our top lists:
- #17 on the list of "Top 101 counties with highest percentage of residents voting for 3rd party candidates in the 2012 Presidential Election"
- #42 on the list of "Top 101 counties with the smallest number of children under 18 without health insurance coverage in 2000"