Robertson County, Tennessee (TN)
County owner-occupied free and clear houses and condos in 2010: 5,102
County owner-occupied houses and condos in 2000: 15,229
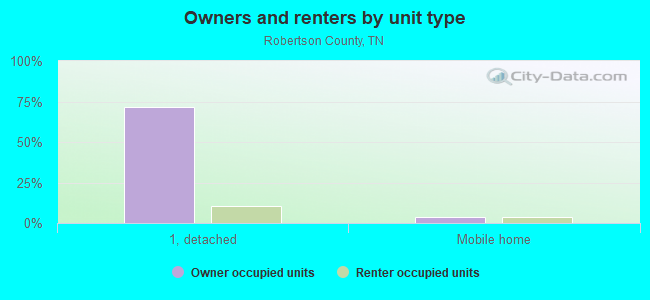
Renter-occupied apartments: 5,901 (it was 4,677 in 2000)
| % of renters here: | 23% |
| State: | 32% |
Land area: 476 sq. mi.
Water area: 0.2 sq. mi.
Population density: 158 people per square mile (average).
Industries providing employment: Educational, health and social services (20.3%), Manufacturing (13.9%), Retail trade (11.5%), Construction (10.9%), Professional, scientific, management, administrative, and waste management services (10.7%).
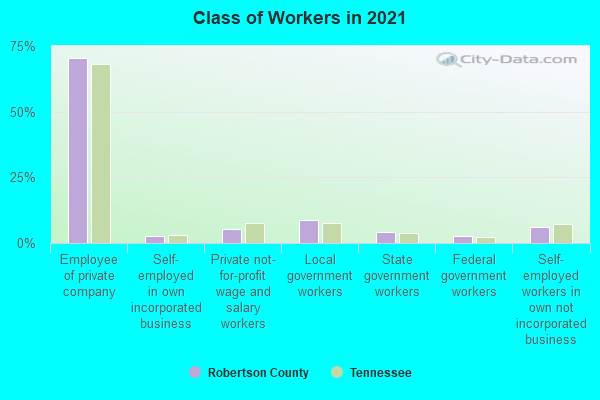
Type of workers:
- Private wage or salary: 80%
- Government: 13%
- Self-employed, not incorporated: 7%
- Unpaid family work: 0%
- OSM Map
- General Map
- Google Map
- MSN Map

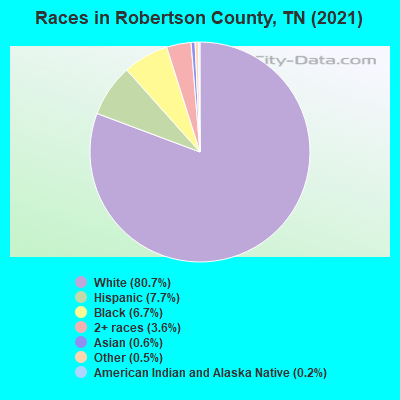
- 60,16780.4%White Non-Hispanic Alone
- 6,0458.1%Hispanic or Latino
- 5,0776.8%Black Non-Hispanic Alone
- 2,4703.3%Two or more races
- 5420.7%Asian alone
- 4790.6%Some other race alone
- 400.05%American Indian and Alaska Native alone
| Median resident age: | 38.5 years |
| Tennessee median age: | 39.2 years |
| Males: 37,439 | |
| Females: 38,031 |

 | Does this exist in TN anywhere- a little desperate for help (21 replies) |
| COVID-19 in Tennessee (237 replies) |
| Looking to Move Northern (country) Nashville (5 replies) |
| Looking for a small-town feel (40 replies) |
| Robertson County, Tennessee (4 replies) |
| Info on car registration/wheel tax in counties surrounding Nashville (8 replies) |
| Robertson County: | 2.0 people |
| Tennessee: | 2 people |
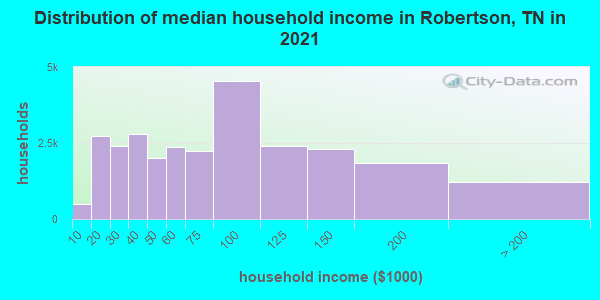
Estimated median household income in 2022: $79,171 ($43,174 in 1999)
| This county: | $79,171 |
| Tennessee: | $65,254 |
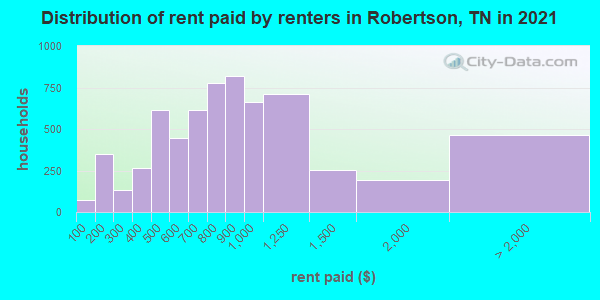
Median contract rent in 2022 for apartments: $897 (lower quartile is $671, upper quartile is $1,259)
| This county: | $897 |
| State: | $884 |
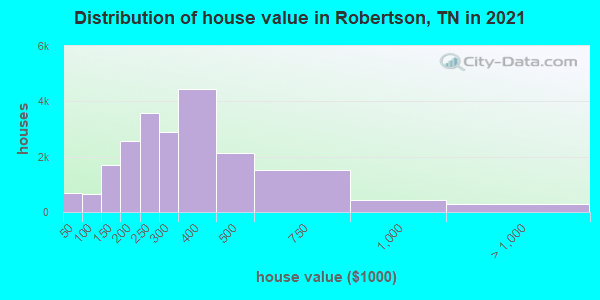
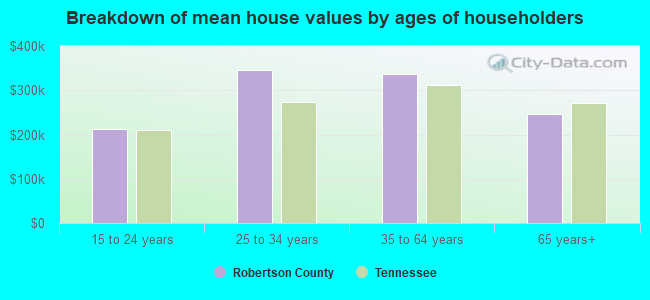
Estimated median house or condo value in 2022: $327,000 (it was $105,300 in 2000)
| Robertson: | $327,000 |
| Tennessee: | $284,800 |
Median monthly housing costs for homes and condos with a mortgage: $1,514
Median monthly housing costs for units without a mortgage: $467
Institutionalized population: 592
Crime in 2021 (reported by the sheriff's office or county police, not the county total):
- Murders: 0
- Rapes: 4
- Robberies: 5
- Assaults: 96
- Burglaries: 54
- Thefts: 132
- Auto thefts: 37
Crime in 2020 (reported by the sheriff's office or county police, not the county total):
- Murders: 1
- Rapes: 7
- Robberies: 2
- Assaults: 90
- Burglaries: 76
- Thefts: 146
- Auto thefts: 42
Health of residents in Robertson County based on CDC Behavioral Risk Factor Surveillance System Survey Questionnaires from 2013 to 2021:
General health status score of residents in this county from 1 (poor) to 5 (excellent) is 3.5. This is about average.69.9% of residents exercised in the past month. This is less than average.
42.1% of residents smoked 100+ cigarettes in their lives. This is about average.
48.0% of adult residents drank alcohol in the past 30 days. This is less than average.
65.5% of residents visited a dentist within the past year. This is less than average.
Average weight of males is 202 pounds. This is more than average.
Average weight of females is 168 pounds. This is more than average.
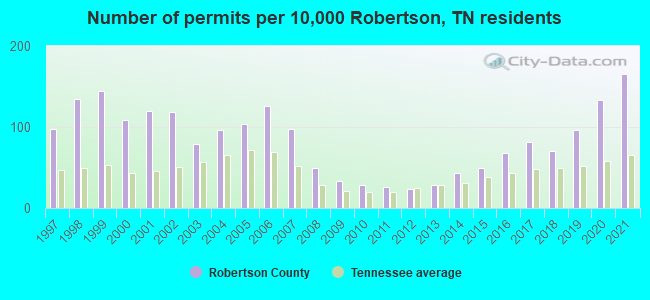
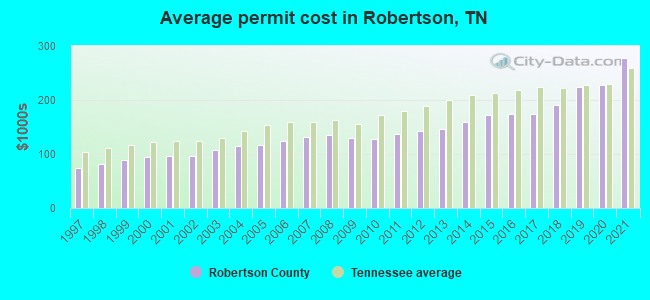
Single-family new house construction building permits:
- 2022: 829 buildings, average cost: $275,600
- 2021: 905 buildings, average cost: $278,200
- 2020: 726 buildings, average cost: $227,500
- 2019: 520 buildings, average cost: $224,300
- 2018: 383 buildings, average cost: $189,500
- 2017: 444 buildings, average cost: $175,300
- 2016: 370 buildings, average cost: $175,200
- 2015: 268 buildings, average cost: $172,100
- 2014: 233 buildings, average cost: $159,700
- 2013: 159 buildings, average cost: $147,200
- 2012: 131 buildings, average cost: $141,700
- 2011: 142 buildings, average cost: $136,800
- 2010: 159 buildings, average cost: $126,700
- 2009: 178 buildings, average cost: $129,600
- 2008: 269 buildings, average cost: $136,000
- 2007: 526 buildings, average cost: $132,000
- 2006: 685 buildings, average cost: $124,000
- 2005: 566 buildings, average cost: $116,700
- 2004: 525 buildings, average cost: $113,600
- 2003: 429 buildings, average cost: $108,100
- 2002: 641 buildings, average cost: $96,300
- 2001: 652 buildings, average cost: $96,500
- 2000: 596 buildings, average cost: $94,200
- 1999: 783 buildings, average cost: $88,900
- 1998: 733 buildings, average cost: $81,000
- 1997: 535 buildings, average cost: $74,800
Median real estate property taxes paid for housing units with mortgages in 2022: $1,451 (0.4%)
Median real estate property taxes paid for housing units with no mortgage in 2022: $1,624 (0.5%)
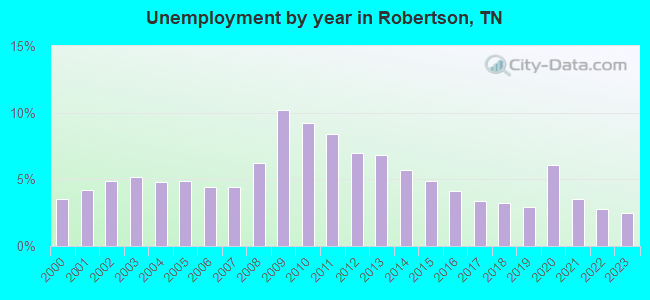
| Robertson County: | 7.2% |
| Tennessee: | 13.3% |
Median age of residents in 2022: 38.5 years old
(Males: 37.7 years old, Females: 39.7 years old)
(Median age for: White residents: 42.2 years old, Black residents: 30.6 years old, American Indian residents: 53.4 years old, Asian residents: 40.3 years old, Hispanic or Latino residents: 25.6 years old, Other race residents: 26.5 years old)
Area name: Nashville-Davidson--Murfreesboro, TN HUD Metro FMR Area
Fair market rent in 2006 for a 1-bedroom apartment in Robertson County is $579 a month.
Fair market rent for a 2-bedroom apartment is $666 a month.
Fair market rent for a 3-bedroom apartment is $864 a month.
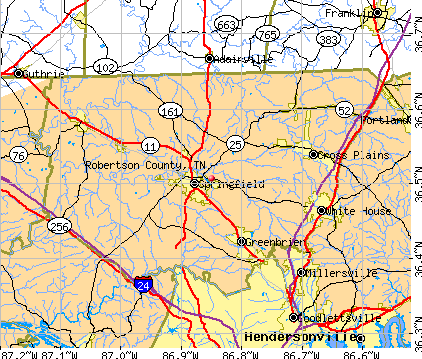
Cities in this county include: Springfield, Greenbrier, Coopertown, Barren Plains, Cross Plains, Ridgetop, Orlinda, Adams, Cedar Hill.
Notable locations in this county outside city limits:
Notable locations in Robertson County: Buck Lodge (A), Shady Cove Resort (B), Highway 109 North Industrial Area (C), Gallatin Steam Plant Reservation (D), Gallatin Landing (E), Sumner County Home (F), Red Chief Orchard (G), Liberty Community Hall (H), Gallatin Community Volunteer Fire Department (I), Number 1 Volunteer Fire Department (J), Oak Grove Community Fire Department (K), White House Community Volunteer Fire Department Station 51 Headquarters (L). Display/hide their locations on the map
Churches in Robertson County include: Forest Chapel (A), Martins Church (B), Little Bethel Church (C), Franklin Chapel (D), State Line Church (E), Station Camp Church (F), Garrett Creek Church (G), Rehoboth Church (H), Fountain Head Church of Christ (I). Display/hide their locations on the map
Cemeteries: Stratton Cemetery (1), Strother Cemetery (2), Horn-Hudson Cemetery (3), Howlis Cemetery (4), Upchurch Cemetery (5), Village Green Cemetery (6), Jones Cemetery (7). Display/hide their locations on the map
Lakes and reservoirs: Crutcher Lake (A), Phillip Bradshaw Lake (B), Willow Lake (C), Pine Lake (D), Five Coves Lake (E), Sumner Sportsman Club Lake (F), Portland City Lake (G), Meadowbrook Game Farm Lake (H). Display/hide their locations on the map
Streams, rivers, and creeks: Locke Branch (A), Liggett Branch (B), Lick Creek (C), Liberty Branch (D), Janey Branch (E), Indian Trail Creek (F), Hogan Branch (G), Hall Town Creek (H), Grace Creek (I). Display/hide their locations on the map
Parks in Robertson County include: Sumner County Park (1), Odoms Bend Access Area (2), Bulls Creek Access Area (3), Cages Bend Access Area (4), Gallatin Steam Plant Access Area (5), Cairo Access Area (6), Cages Bend Recreation Area (7), Bledsoe Creek Camping State Park (8). Display/hide their locations on the map
Neighboring counties: Benton County  , Kings County, California
  , Delaware County, Oklahoma , Cumberland County, Kentucky
  , Greene County , Montgomery County , Scott County, Virginia .
| Here: | 2.5% |
| Tennessee: | 3.0% |
Current college students: 1,227
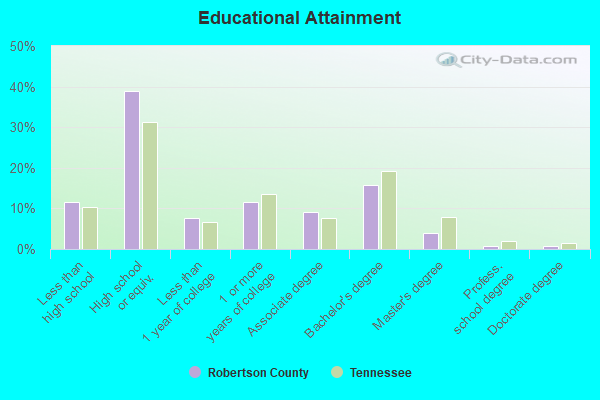
People 25 years of age or older with a high school degree or higher: 91.2%
People 25 years of age or older with a bachelor's degree or higher: 22.4%
Number of foreign born residents: 3,110 (26.0% naturalized citizens)
| Robertson County: | 4.1% |
| Whole state: | 5.6% |
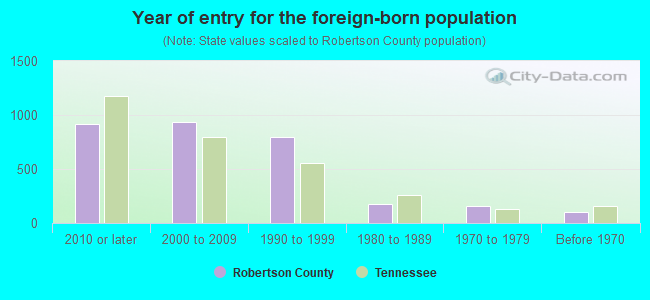
- Year of entry for the foreign-born population
- 1,0072010 or later
- 1,1752000 to 2009
- 7441990 to 1999
- 1741980 to 1989
- 1591970 to 1979
- 103Before 1970
Mean travel time to work (commute): minutes
Percentage of county residents living and working in this county: 99.2%
Housing units in structures:
- One, detached: 25,732
- One, attached: 167
- Two: 188
- 3 or 4: 650
- 5 to 9: 410
- 10 to 19: 433
- 20 to 49: 503
- 50 or more: 141
- Mobile homes: 1,626
Housing units in Robertson County with a mortgage: 15,192 (1,490 second mortgage, 0 home equity loan, 1,251 both second mortgage and home equity loan)
Houses without a mortgage: 485
| Here: | 3.0% with mortgage |
| State: | 97.8% with mortgage |
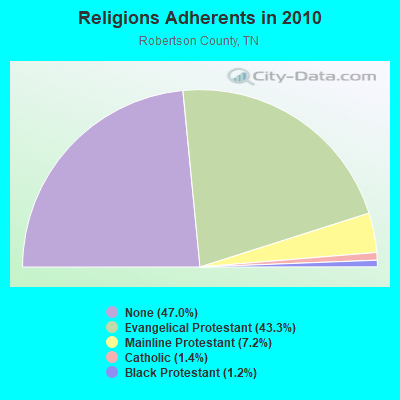
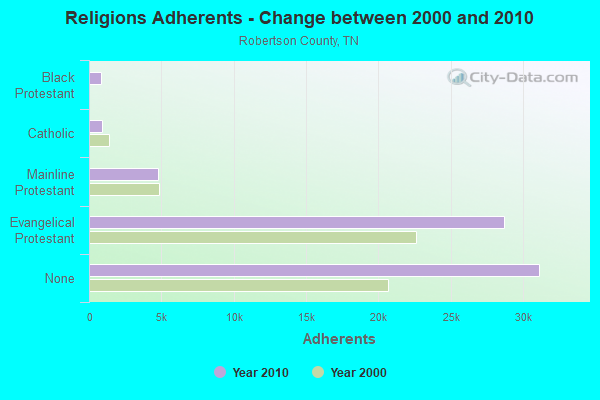
Religion statistics for Robertson County
| Religion | Adherents | Congregations |
|---|---|---|
| Evangelical Protestant | 28,690 | 92 |
| Mainline Protestant | 4,749 | 25 |
| Catholic | 900 | 1 |
| Black Protestant | 802 | 5 |
| Other | 1 | 1 |
| None | 31,141 | - |
Source: Clifford Grammich, Kirk Hadaway, Richard Houseal, Dale E.Jones, Alexei Krindatch, Richie Stanley and Richard H.Taylor. 2012. 2010 U.S.Religion Census: Religious Congregations & Membership Study. Association of Statisticians of American Religious Bodies. Jones, Dale E., et al. 2002. Congregations and Membership in the United States 2000. Nashville, TN: Glenmary Research Center.
Food Environment Statistics:
| Robertson County: | 1.74 / 10,000 pop. |
| State: | 1.99 / 10,000 pop. |
| Here: | 0.16 / 10,000 pop. |
| Tennessee: | 0.17 / 10,000 pop. |
| This county: | 0.63 / 10,000 pop. |
| Tennessee: | 0.65 / 10,000 pop. |
| Robertson County: | 4.75 / 10,000 pop. |
| Tennessee: | 5.16 / 10,000 pop. |
| This county: | 3.64 / 10,000 pop. |
| State: | 6.56 / 10,000 pop. |
| Robertson County: | 12.4% |
| Tennessee: | 11.4% |
| Robertson County: | 31.3% |
| State: | 30.2% |
| Here: | 17.4% |
| State: | 13.5% |
Agriculture in Robertson County:
Average size of farms: 144 acresAverage value of agricultural products sold per farm: $40,025
Average value of crops sold per acre for harvested cropland: $408.63
The value of nursery, greenhouse, floriculture, and sod as a percentage of the total market value of agricultural products sold: 9.13%
The value of livestock, poultry, and their products as a percentage of the total market value of agricultural products sold: 23.51%
Average total farm production expenses per farm: $30,339
Harvested cropland as a percentage of land in farms: 52.05%
Average market value of all machinery and equipment per farm: $55,587
The percentage of farms operated by a family or individual: 91.30%
Average age of principal farm operators: 55 years
Average number of cattle and calves per 100 acres of all land in farms: 18.14
Milk cows as a percentage of all cattle and calves: 5.89%
Corn for grain: 29510 harvested acres
All wheat for grain: 20529 harvested acres
Soybeans for beans: 37794 harvested acres
Vegetables: 393 harvested acres
Land in orchards: 103 acres
Tornado activity:
Robertson County historical area-adjusted tornado activity is significantly below Tennessee state average. It is 963435.0 times below overall U.S. average.Tornadoes in this county have caused 47 fatalities and 277 injuries recorded between 1950 and 2004.
On 2/5/2008, a category 3 (max. wind speeds 158-206 mph) tornado killed 22 people and injured 63 people and caused $28 million in damages.
Earthquake activity:
Robertson County-area historical earthquake activity is significantly above Tennessee state average. It is 201% greater than the overall U.S. average.On 4/18/2008 at 09:36:59, a magnitude 5.4 (5.1 MB, 4.8 MS, 5.4 MW, 5.2 MW, Class: Moderate, Intensity: VI - VII) earthquake occurred 146.1 miles away from Robertson County center
On 4/18/2008 at 09:36:59, a magnitude 5.2 (5.2 MW, Depth: 8.9 mi) earthquake occurred 146.1 miles away from the county center
On 6/18/2002 at 17:37:15, a magnitude 5.0 (4.3 MB, 4.6 MW, 5.0 LG) earthquake occurred 114.5 miles away from the county center
On 6/10/1987 at 23:48:54, a magnitude 5.1 (4.9 MB, 4.4 MS, 4.6 MS, 5.1 LG) earthquake occurred 169.9 miles away from the county center
On 9/26/1990 at 13:18:51, a magnitude 5.0 (4.7 MB, 4.8 LG, 5.0 LG, Depth: 7.7 mi) earthquake occurred 155.5 miles away from Robertson County center
On 7/27/1980 at 18:52:21, a magnitude 5.2 (5.1 MB, 4.7 MS, 5.0 UK, 5.2 UK) earthquake occurred 198.4 miles away from the county center
Magnitude types: regional Lg-wave magnitude (LG), body-wave magnitude (MB), surface-wave magnitude (MS), moment magnitude (MW)
Most recent natural disasters:
- Tennessee Covid-19 Pandemic, Incident Period: January 20, 2020, FEMA Id: 4514, Natural disaster type: Other
- Tennessee Severe Storms, Flooding, Landslides, And Mudslides, Incident Period: February 19, 2019 - March 30, 2019, FEMA Id: 4427, Natural disaster type: Storm, Mudslide, Landslide, Flood
- Tennessee Severe Storms, Flooding, Straight-Line Winds, and Tornadoes, Incident Period: April 30, 2010 to May 18, 2010, Major Disaster (Presidential) Declared DR-1909: May 04, 2010, FEMA Id: 1909, Natural disaster type: Storm, Tornado, Flood, Wind
- Tennessee Hurricane Katrina Evacuation, Incident Period: August 29, 2005 to October 01, 2005, Emergency Declared EM-3217: September 05, 2005, FEMA Id: 3217, Natural disaster type: Hurricane
- Tennessee Severe Storms, Tornadoes and Flooding, Incident Period: May 04, 2003 to May 30, 2003, Major Disaster (Presidential) Declared DR-1464: May 08, 2003, FEMA Id: 1464, Natural disaster type: Storm, Tornado, Flood
- Tennessee Severe Storms, Tornadoes and Flooding, Incident Period: April 16, 1998 to May 18, 1998, Major Disaster (Presidential) Declared DR-1215: April 20, 1998, FEMA Id: 1215, Natural disaster type: Storm, Tornado, Flood
- Tennessee Ice Storm, Severe Winter Storm, Flash Flooding, Incident Period: February 09, 1994 to February 11, 1994, Major Disaster (Presidential) Declared DR-1010: February 28, 1994, FEMA Id: 1010, Natural disaster type: Ice Storm, Winter Storm, Flash Flood
- Tennessee SEVERE STORMS, FLOODING, Incident Period: March 22, 1975, Major Disaster (Presidential) Declared DR-459: March 22, 1975, FEMA Id: 459, Natural disaster type: Storm, Flood
The number of natural disasters in Robertson County (8) is smaller than the US average (15).
Major Disasters (Presidential) Declared: 5
Emergencies Declared: 1
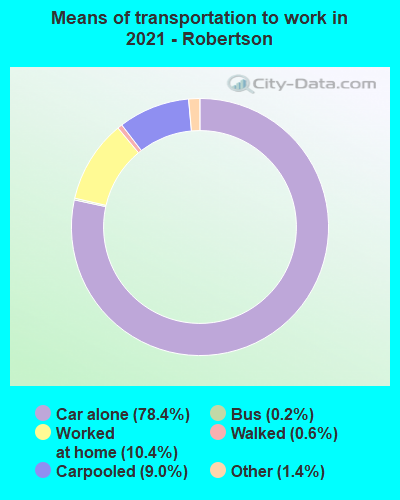
Means of transportation to work:
- Drove a car alone: 20,513 (72.8%)
- Carpooled: 2,571 (9.1%)
- Bus: 71 (0.3%)
- Taxicab, motorcycle, or other means: 465 (1.7%)
- Walked: 119 (0.4%)
- Worked at home: 4,786 (17.0%)
- Health care and social assistance (25%)
- Retail trade (11%)
- Educational services (9%)
- Finance and insurance (6%)
- Accommodation and food services (6%)
- Public administration (5%)
- Professional, scientific, and technical services (5%)
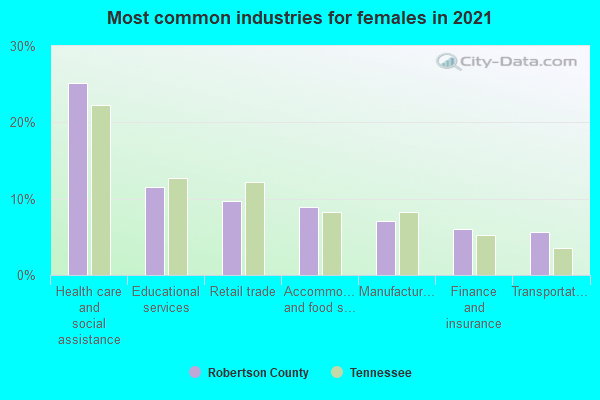
- Health care and social assistance (29%)
- Retail trade (12%)
- Educational services (10%)
- Finance and insurance (7%)
- Accommodation and food services (7%)
- Public administration (6%)
- Professional, scientific, and technical services (6%)
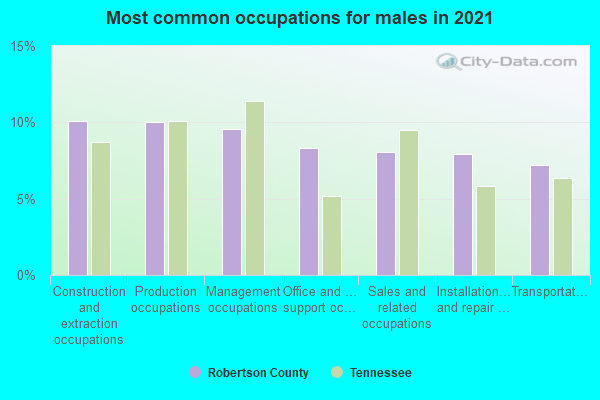
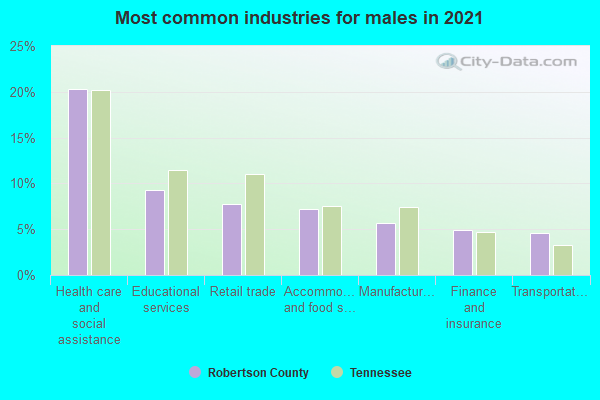
- Installation, maintenance, and repair occupations (16%)
- Construction and extraction occupations (14%)
- Management occupations (11%)
- Sales and related occupations (9%)
- Material moving occupations (8%)
- Production occupations (8%)
- Transportation occupations (5%)
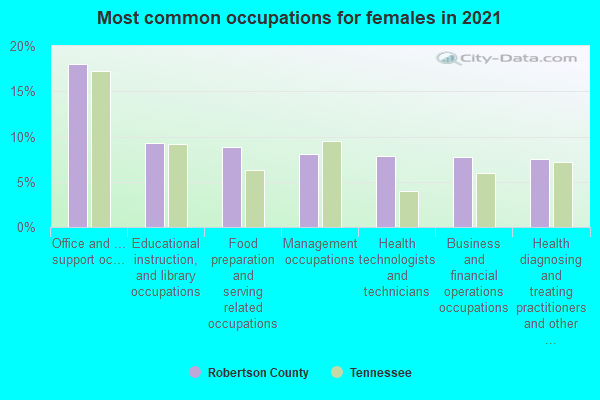
- Office and administrative support occupations (21%)
- Health diagnosing and treating practitioners and other technical occupations (13%)
- Management occupations (12%)
- Sales and related occupations (9%)
- Educational instruction, and library occupations (8%)
- Food preparation and serving related occupations (6%)
- Personal care and service occupations (5%)
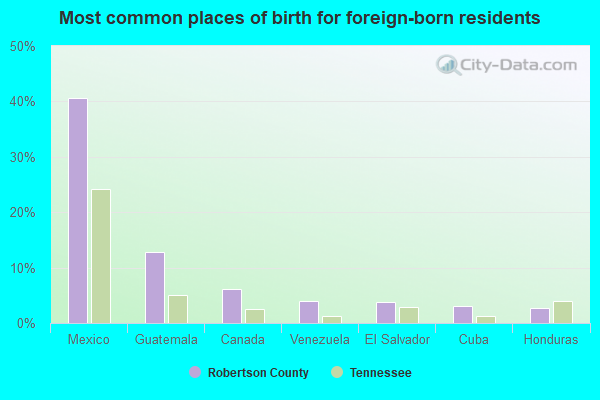
- Mexico (43%)
- Honduras (5%)
- El Salvador (5%)
- Canada (5%)
- Guatemala (4%)
- Venezuela (3%)
- Thailand (3%)
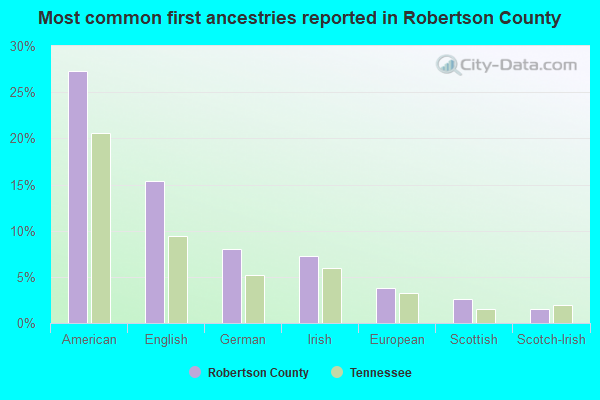
- American (30%)
- English (15%)
- Irish (7%)
- German (7%)
- European (4%)
- Scottish (3%)
- Scotch-Irish (1%)
People in group quarters in Robertson County, Tennessee in 2010:
- 313 people in nursing facilities/skilled-nursing facilities
- 279 people in local jails and other municipal confinement facilities
- 76 people in workers' group living quarters and job corps centers
- 20 people in group homes intended for adults
- 15 people in emergency and transitional shelters (with sleeping facilities) for people experiencing homelessness
People in group quarters in Robertson County, Tennessee in 2000:
- 290 people in nursing homes
- 171 people in local jails and other confinement facilities (including police lockups)
- 37 people in job corps and vocational training facilities
- 18 people in other noninstitutional group quarters
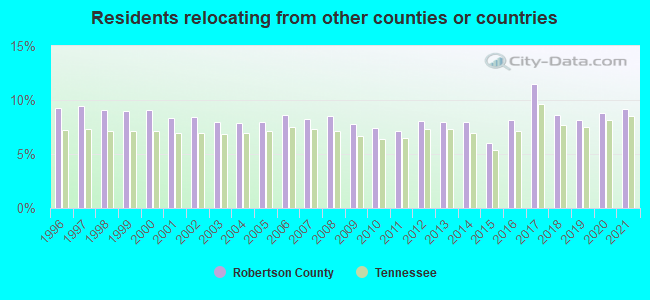
9.15% of this county's 2021 resident taxpayers lived in other counties in 2020 ($62,465 average adjusted gross income)
| Here: | 9.15% |
| Tennessee average: | 8.49% |
10 or fewer of this county's residents moved from foreign countries.
6.53% relocated from other counties in Tennessee ($39,279 average AGI)
2.61% relocated from other states ($23,186 average AGI)
Robertson County: 2.61% Tennessee average: 4.34%
Top counties from which taxpayers relocated into this county between 2020 and 2021:
| from Sumner County, TN | |
| from Davidson County, TN | |
| from Montgomery County, TN | |
| from Cheatham County, TN | |
| from Rutherford County, TN | |
| from Wilson County, TN | |
| from Williamson County, TN |
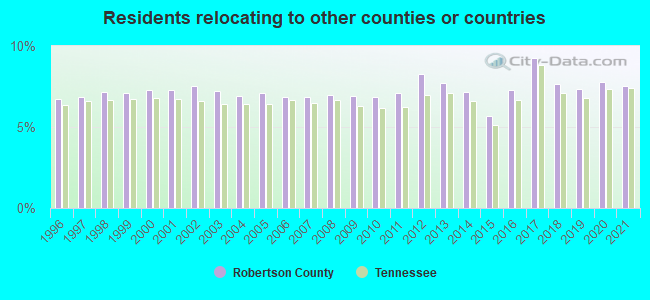
7.50% of this county's 2020 resident taxpayers moved to other counties in 2021 ($51,800 average adjusted gross income)
| Here: | 7.50% |
| Tennessee average: | 7.40% |
10 or fewer of this county's residents moved to foreign countries.
5.27% relocated to other counties in Tennessee ($38,714 average AGI)
2.23% relocated to other states ($13,086 average AGI)
Robertson County: 2.23% Tennessee average: 3.20%
Top counties to which taxpayers relocated from this county between 2020 and 2021:
| to Sumner County, TN | |
| to Davidson County, TN | |
| to Montgomery County, TN | |
| to Cheatham County, TN | |
| to Rutherford County, TN | |
| to Logan County, KY | |
| to Wilson County, TN |
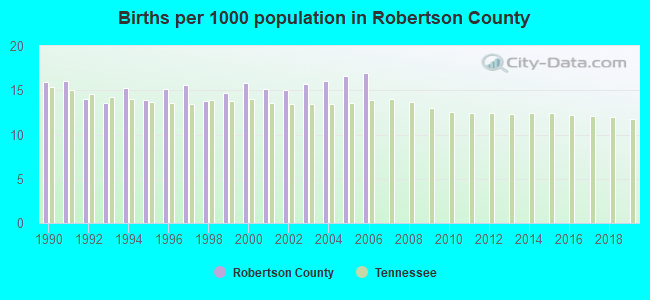
Births per 1000 population from 1990 to 1999: 14.8
Births per 1000 population from 2000 to 2006: 15.9
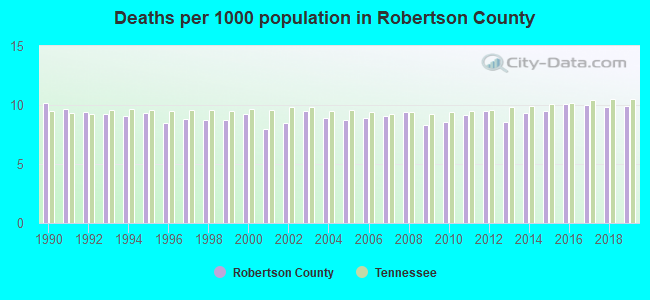
Deaths per 1000 population from 1990 to 1999: 9.2
Deaths per 1000 population from 2000 to 2009: 8.8
Deaths per 1000 population from 2010 to 2020: 9.7
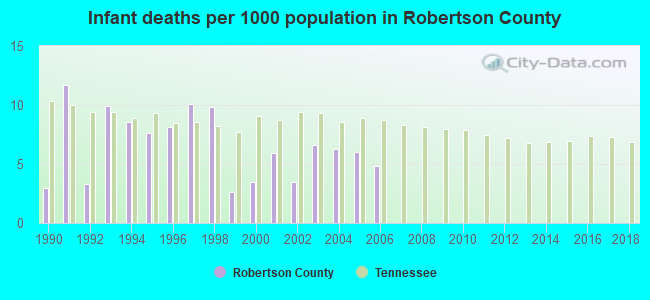
Infant deaths per 1000 live births from 1990 to 1999: 7.5
Infant deaths per 1000 live births from 2000 to 2006: 5.2
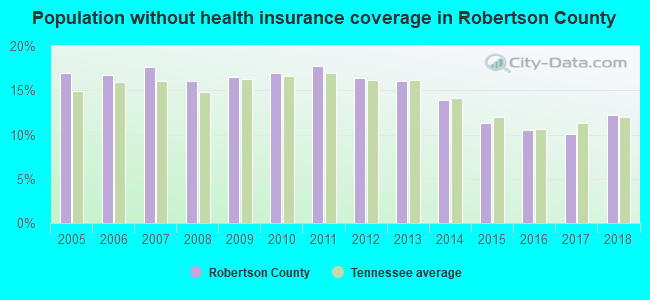
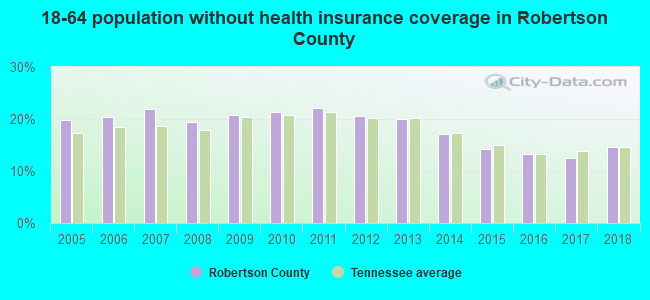
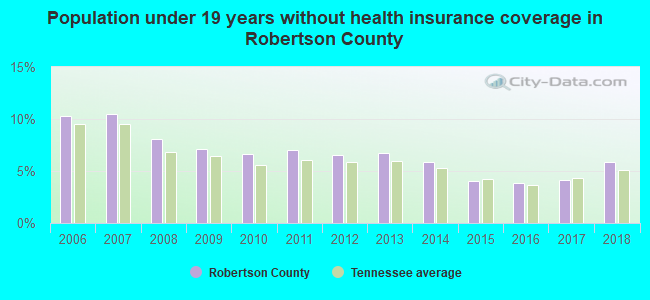
Persons under 19 years old without health insurance coverage in 2018: 5.9%
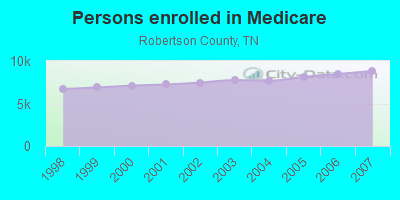
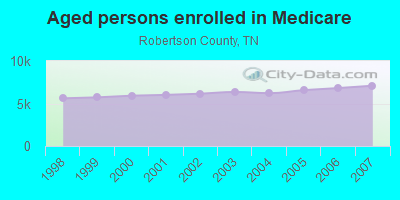
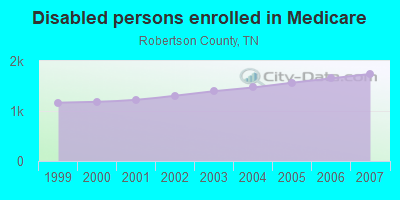
Persons enrolled in hospital insurance and/or supplemental medical insurance (Medicare) in July 1, 2007: 8,833 (7,092 aged, 1,741 disabled)
Children under 18 without health insurance coverage in 2007: 1,312 (7%)
Most common underlying causes of death in Robertson County, Tennessee in 1999 - 2019:
- Acute myocardial infarction, unspecified (945)
- Bronchus or lung, unspecified - Malignant neoplasms (903)
- Atherosclerotic heart disease (796)
- Atherosclerotic cardiovascular disease, so described (584)
- Chronic obstructive pulmonary disease, unspecified (558)
- Stroke, not specified as haemorrhage or infarction (407)
- Pneumonia, unspecified (311)
- Alzheimer disease, unspecified (278)
- Unspecified dementia (230)
- Senile degeneration of brain, not elsewhere classified (72)
Population without health insurance coverage in 2000: 11%
Children under 18 without health insurance coverage in 2000: 8%
Short term general hospital admissions per 100,000 population in 2004: 8,346
Short term general hospital beds per 100,000 population in 2004: 152
Emergency room visits per 100,000 population in 2004: 50,083
General practice office based MDs per 100,000 population in 2005: 1,626
Medical specialist MDs per 100,000 population in 2005: 966
Dentists per 100,000 population in 1998: 8
Total births per 100,000 population, July 2005 - July 2006 : 23
Total deaths per 100,000 population, July 2005 - July 2006: 50
Limited-service eating places per 100,000 population in 2005 : 5
Homicides per 1,000,000 population from 2000 to 2006: 81.3. This is more than state average.
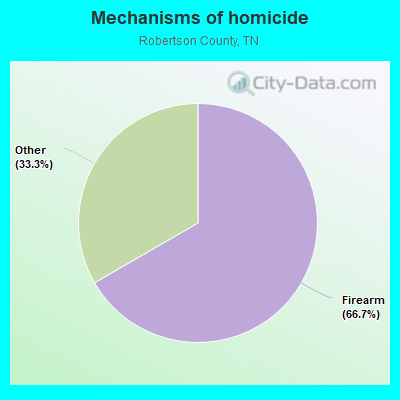
- Firearm - 54.2
- Other - 27.1
Suicides per 1,000,000 population from 2000 to 2006: 133.0. This is less than state average.
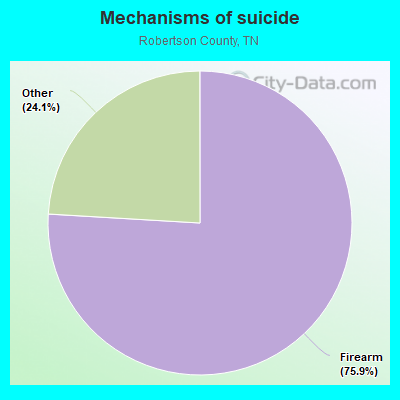
- Firearm - 101.0
- Other - 32.0
Household type by relationship:
Households: 75,470- Male householders: 13,738 (3,166 living alone), Female householders: 15,217 (3,082 living alone)
14,747 spouses (14,653 opposite-sex spouses), 1,841 unmarried partners, (1,792 opposite-sex unmarried partners), 20,717 children (19,517 natural, 519 adopted, 681 stepchildren), 2,735 grandchildren, 425 brothers or sisters, 1,333 parents, 0 foster children, 1,223 other relatives, 2,773 non-relatives
- In group quarters: 721
Size of family households: 8,409 2-persons, 5,438 3-persons, 3,975 4-persons, 1,455 5-persons, 679 6-persons, 245 7-or-more-persons.
Size of nonfamily households: 6,248 1-person, 1,542 2-persons, 964 3-persons.
11,329 married couples with children.
3,961 single-parent households (1,184 men, 2,777 women).
92.8% of residents of Robertson speak English at home.
6.0% of residents speak Spanish at home (57% speak English very well, 19% speak English well, 15% speak English not well, 9% don't speak English at all).
0.5% of residents speak other Indo-European language at home (96% speak English very well, 2% speak English well, 2% speak English not well).
0.3% of residents speak Asian or Pacific Island language at home (76% speak English very well, 9% speak English well, 15% speak English not well).
0.3% of residents speak other language at home (91% speak English very well, 9% speak English not well).
In fiscal year 2004:
Federal Government expenditure: $236,396,000 ($3,985 per capita)
Department of Defense expenditure: $9,339,000
Federal direct payments to individuals for retirement and disability: $124,432,000
Federal other direct payments to individuals: $56,075,000
Federal direct payments not to individuals: $3,303,000
Federal grants: $43,890,000
Federal procurement contracts: $1,732,000 ($21,000 Department of Defense)
Federal salaries and wages: $6,963,000 ($1,055,000 Department of Defense)
Federal Government direct loans: $1,725,000
Federal guaranteed/insured loans: $63,113,000
Federal Government insurance: $16,476,000
Population change from April 1, 2000 to July 1, 2005:
Births: 4,619| Here: | 77 per 1000 residents |
| State: | 69 per 1000 residents |
Deaths: 2,740
| Here: | 45 per 1000 residents |
| State: | 50 per 1000 residents |
Net international migration: +719
| Here: | +12 per 1000 residents |
| State: | +8 per 1000 residents |
Net internal migration: +3,426
| Here: | +57 per 1000 residents |
| State: | +18 per 1000 residents |
Total withdrawal of fresh water for public supply: 5.18 millions of gallons per day (all from surface)
| Here: | 6.3 |
| State: | 6.5 |
| Here: | 5.1 |
| State: | 4.4 |
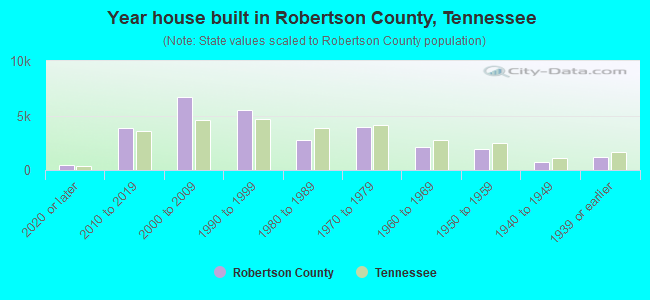
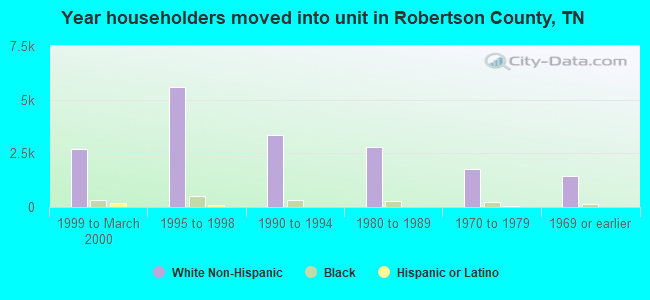
- Year house built in Robertson County, Tennessee
- 1,3632020 or later
- 3,7582010 to 2019
- 6,1822000 to 2009
- 4,7451990 to 1999
- 5,6511980 to 1989
- 2,4311970 to 1979
- 1,6161960 to 1969
- 1,4281950 to 1959
- 8361940 to 1949
- 1,8401939 or earlier
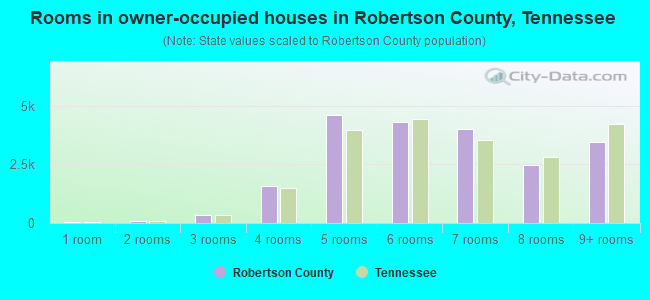
- Rooms in owner-occupied houses in Robertson County, Tennessee
- 381 room
- 02 rooms
- 4333 rooms
- 1,6384 rooms
- 4,8965 rooms
- 5,2796 rooms
- 3,6957 rooms
- 2,8448 rooms
- 3,7169+ rooms
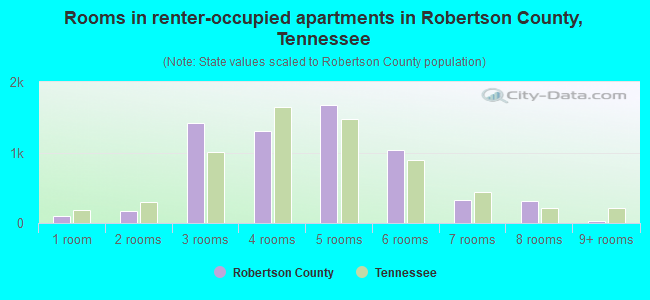
- Rooms in renter-occupied apartments in Robertson County, Tennessee
- 3421 room
- 2222 rooms
- 5163 rooms
- 1,0394 rooms
- 1,7365 rooms
- 1,8426 rooms
- 2847 rooms
- 2448 rooms
- 1919+ rooms
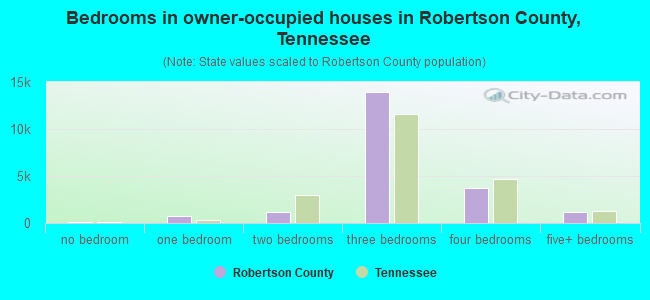
- Bedrooms in owner-occupied houses in Robertson County, Tennessee
- 38no bedroom
- 1731 bedroom
- 2,4292 bedrooms
- 15,4393 bedrooms
- 3,5814 bedrooms
- 8795+ bedrooms
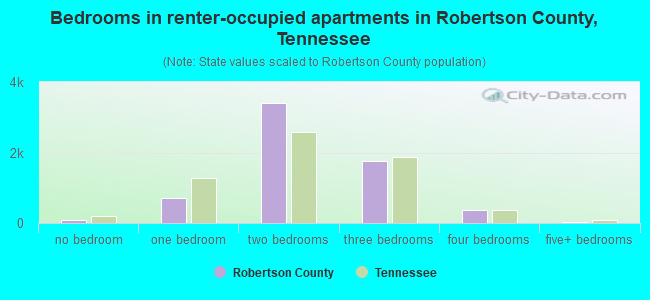
- Bedrooms in renter-occupied apartments in Robertson County, Tennessee
- 342no bedroom
- 5341 bedroom
- 1,6122 bedrooms
- 3,1623 bedrooms
- 7084 bedrooms
- 585+ bedrooms
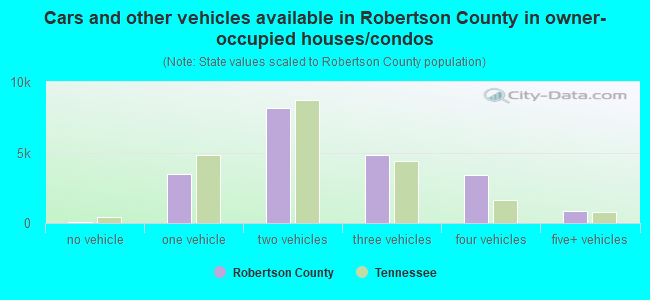
- Cars and other vehicles available in Robertson County in owner-occupied houses/condos
- 240no vehicle
- 4,5941 vehicle
- 9,3042 vehicles
- 5,4683 vehicles
- 1,9534 vehicles
- 9805+ vehicles
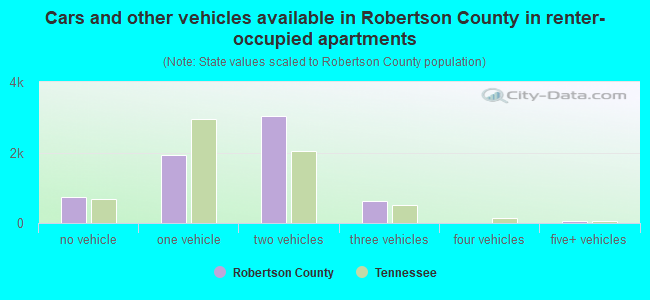
- Cars and other vehicles available in Robertson County in renter-occupied apartments
- 706no vehicle
- 1,7311 vehicle
- 2,5562 vehicles
- 1,1683 vehicles
- 154 vehicles
- 2405+ vehicles
91.5% of Robertson County residents lived in the same house 1 years ago.
Out of people who lived in different houses, 28% lived in this county.
Out of people who lived in different counties, 64% lived in Tennessee.
| Robertson County: | 91.5% |
| State average: | 87.0% |
Place of birth for U.S.-born residents:
- This state: 48,265
- Other state: 23,223
- Northeast: 3,088
- Midwest: 6,372
- South: 9,944
- West: 3,819
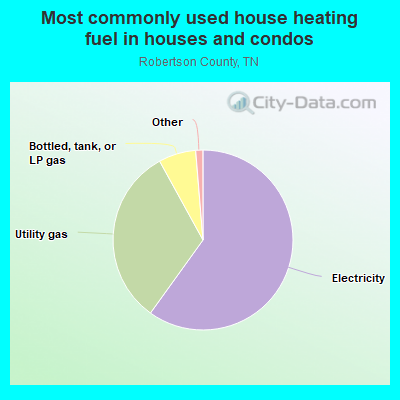
- 60.1%Electricity
- 32.6%Utility gas
- 6.3%Bottled, tank, or LP gas
- 0.5%Wood
- 0.3%Other fuel
- 0.2%No fuel used
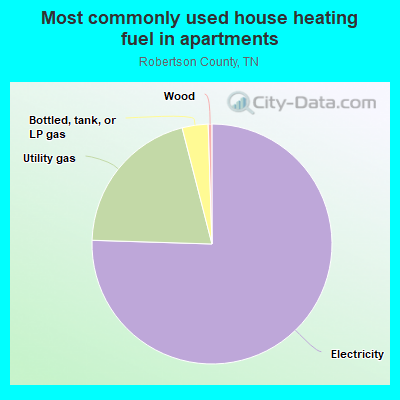
- 75.2%Electricity
- 19.6%Utility gas
- 2.7%Bottled, tank, or LP gas
- 1.7%Wood
- 0.8%No fuel used
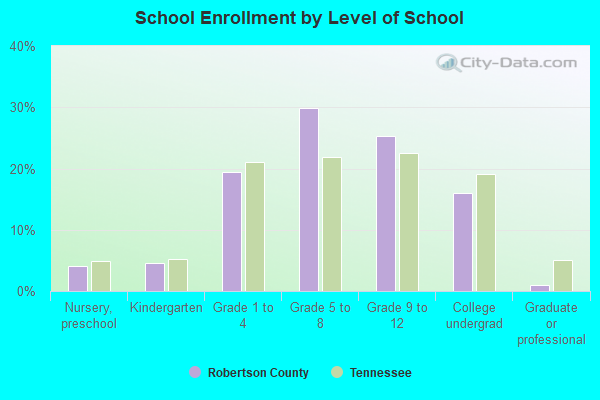
Private vs. public school enrollment:
| Here: | 21.2% |
| Tennessee: | 15.0% |
| Here: | 20.5% |
| Tennessee: | 16.2% |
| Here: | 19.3% |
| Tennessee: | 23.5% |
Robertson County government finances - Expenditure in 2018:
- Bond Funds - Cash and Securities: $15,688,000
Cash and Securities: $1,201,000
- Charges - Other: $9,107,000
Other: $8,823,000
Elementary and Secondary Education - Other: $6,066,000
Elementary and Secondary Education - Other: $5,217,000
Solid Waste Management: $2,293,000
Solid Waste Management: $451,000
Regular Highways: $71,000
Elementary and Secondary Education School Tuition and Transportation: $31,000
Elementary and Secondary Education School Tuition and Transportation: $26,000
- Construction - Regular Highways: $2,321,000
General - Other: $1,690,000
Regular Highways: $1,152,000
Health - Other: $747,000
General - Other: $150,000
Elementary and Secondary Education: $23,000
Elementary and Secondary Education: $23,000
- Current Operations - Elementary and Secondary Education: $110,816,000
Elementary and Secondary Education: $98,491,000
Police Protection: $12,845,000
Police Protection: $9,161,000
General - Other: $7,435,000
Health - Other: $6,644,000
Health - Other: $6,366,000
Regular Highways: $4,078,000
General - Other: $3,791,000
Regular Highways: $3,658,000
Solid Waste Management: $3,414,000
Judicial and Legal Services: $2,764,000
Financial Administration: $2,591,000
Judicial and Legal Services: $2,506,000
Central Staff Services: $2,375,000
General Public Buildings: $1,670,000
Solid Waste Management: $1,488,000
Financial Administration: $1,371,000
Central Staff Services: $1,359,000
General Public Buildings: $844,000
Local Fire Protection: $734,000
Natural Resources - Other: $202,000
Natural Resources - Other: $178,000
- Federal Intergovernmental - Other: $203,000
Health and Hospitals: $62,000
Education: $57,000
Education: $56,000
Other: $10,000
- General - Interest on Debt: $4,550,000
Interest on Debt: $1,535,000
- Intergovernmental to Local - Other - Elementary and Secondary Education: $4,641,000
Other - General - Other: $1,584,000
Other - Elementary and Secondary Education: $617,000
Other - Local Fire Protection: $122,000
- Local Intergovernmental - Education: $15,123,000
General Local Government Support: $2,797,000
Education: $1,134,000
Other: $906,000
- Long Term Debt - Outstanding Unspecified Public Purpose: $117,735,000
Beginning Outstanding - Unspecified Public Purpose: $114,475,000
Beginning Outstanding - Unspecified Public Purpose: $59,851,000
Outstanding Unspecified Public Purpose: $45,322,000
Retired Unspecified Public Purpose: $14,529,000
Issue, Unspecified Public Purpose: $13,915,000
Retired Unspecified Public Purpose: $10,655,000
- Miscellaneous - Interest Earnings: $1,075,000
Interest Earnings: $954,000
General Revenue - Other: $557,000
Fines and Forfeits: $448,000
Fines and Forfeits: $436,000
General Revenue - Other: $358,000
Donations From Private Sources: $138,000
Donations From Private Sources: $84,000
Sale of Property: $51,000
Sale of Property: $10,000
- Other Capital Outlay - Elementary and Secondary Education: $2,755,000
Elementary and Secondary Education: $2,522,000
General Public Building: $617,000
Police Protection: $60,000
Judicial and Legal Services: $18,000
Correctional Institutions: $17,000
Health - Other: $12,000
- Other Funds - Cash and Securities: $32,819,000
Cash and Securities: $14,352,000
- Sinking Funds - Cash and Securities: $10,535,000
Cash and Securities: $4,003,000
- State Intergovernmental - Education: $83,020,000
Education: $71,491,000
Other: $4,223,000
Highways: $3,532,000
Highways: $3,330,000
Public Welfare: $2,025,000
General Local Government Support: $570,000
Health and Hospitals: $485,000
Health and Hospitals: $308,000
General Local Government Support: $153,000
Other: $153,000
- Tax - Property: $49,467,000
Property: $37,948,000
General Sales and Gross Receipts: $15,709,000
General Sales and Gross Receipts: $14,373,000
Other Selective Sales: $7,859,000
Motor Vehicle License: $4,842,000
Other License: $1,636,000
Occupation and Business License - Other: $1,172,000
Occupation and Business License - Other: $856,000
Other Selective Sales: $354,000
Severance: $218,000
Alcoholic Beverage Sales: $144,000
Other License: $120,000
Public Utilities Sales: $96,000
Public Utility License: $70,000
Alcoholic Beverage Sales: $55,000
- Total Salaries and Wages: $60,225,000
: $55,998,000
Robertson County government finances - Revenue in 2018:
- Bond Funds - Cash and Securities: $15,688,000
Cash and Securities: $1,201,000
- Charges - Other: $9,107,000
Other: $8,823,000
Elementary and Secondary Education - Other: $6,066,000
Elementary and Secondary Education - Other: $5,217,000
Solid Waste Management: $2,293,000
Solid Waste Management: $451,000
Regular Highways: $71,000
Elementary and Secondary Education School Tuition and Transportation: $31,000
Elementary and Secondary Education School Tuition and Transportation: $26,000
- Construction - Regular Highways: $2,321,000
General - Other: $1,690,000
Regular Highways: $1,152,000
Health - Other: $747,000
General - Other: $150,000
Elementary and Secondary Education: $23,000
Elementary and Secondary Education: $23,000
- Current Operations - Elementary and Secondary Education: $110,816,000
Elementary and Secondary Education: $98,491,000
Police Protection: $12,845,000
Police Protection: $9,161,000
General - Other: $7,435,000
Health - Other: $6,644,000
Health - Other: $6,366,000
Regular Highways: $4,078,000
General - Other: $3,791,000
Regular Highways: $3,658,000
Solid Waste Management: $3,414,000
Judicial and Legal Services: $2,764,000
Financial Administration: $2,591,000
Judicial and Legal Services: $2,506,000
Central Staff Services: $2,375,000
General Public Buildings: $1,670,000
Solid Waste Management: $1,488,000
Financial Administration: $1,371,000
Central Staff Services: $1,359,000
General Public Buildings: $844,000
Local Fire Protection: $734,000
Natural Resources - Other: $202,000
Natural Resources - Other: $178,000
- Federal Intergovernmental - Other: $203,000
Health and Hospitals: $62,000
Education: $57,000
Education: $56,000
Other: $10,000
- General - Interest on Debt: $4,550,000
Interest on Debt: $1,535,000
- Intergovernmental to Local - Other - Elementary and Secondary Education: $4,641,000
Other - General - Other: $1,584,000
Other - Elementary and Secondary Education: $617,000
Other - Local Fire Protection: $122,000
- Local Intergovernmental - Education: $15,123,000
General Local Government Support: $2,797,000
Education: $1,134,000
Other: $906,000
- Long Term Debt - Outstanding Unspecified Public Purpose: $117,735,000
Beginning Outstanding - Unspecified Public Purpose: $114,475,000
Beginning Outstanding - Unspecified Public Purpose: $59,851,000
Outstanding Unspecified Public Purpose: $45,322,000
Retired Unspecified Public Purpose: $14,529,000
Issue, Unspecified Public Purpose: $13,915,000
Retired Unspecified Public Purpose: $10,655,000
- Miscellaneous - Interest Earnings: $1,075,000
Interest Earnings: $954,000
General Revenue - Other: $557,000
Fines and Forfeits: $448,000
Fines and Forfeits: $436,000
General Revenue - Other: $358,000
Donations From Private Sources: $138,000
Donations From Private Sources: $84,000
Sale of Property: $51,000
Sale of Property: $10,000
- Other Capital Outlay - Elementary and Secondary Education: $2,755,000
Elementary and Secondary Education: $2,522,000
General Public Building: $617,000
Police Protection: $60,000
Judicial and Legal Services: $18,000
Correctional Institutions: $17,000
Health - Other: $12,000
- Other Funds - Cash and Securities: $32,819,000
Cash and Securities: $14,352,000
- Sinking Funds - Cash and Securities: $10,535,000
Cash and Securities: $4,003,000
- State Intergovernmental - Education: $83,020,000
Education: $71,491,000
Other: $4,223,000
Highways: $3,532,000
Highways: $3,330,000
Public Welfare: $2,025,000
General Local Government Support: $570,000
Health and Hospitals: $485,000
Health and Hospitals: $308,000
General Local Government Support: $153,000
Other: $153,000
- Tax - Property: $49,467,000
Property: $37,948,000
General Sales and Gross Receipts: $15,709,000
General Sales and Gross Receipts: $14,373,000
Other Selective Sales: $7,859,000
Motor Vehicle License: $4,842,000
Other License: $1,636,000
Occupation and Business License - Other: $1,172,000
Occupation and Business License - Other: $856,000
Other Selective Sales: $354,000
Severance: $218,000
Alcoholic Beverage Sales: $144,000
Other License: $120,000
Public Utilities Sales: $96,000
Public Utility License: $70,000
Alcoholic Beverage Sales: $55,000
- Total Salaries and Wages: $60,225,000
: $55,998,000
Robertson County government finances - Debt in 2018:
- Bond Funds - Cash and Securities: $15,688,000
Cash and Securities: $1,201,000
- Charges - Other: $9,107,000
Other: $8,823,000
Elementary and Secondary Education - Other: $6,066,000
Elementary and Secondary Education - Other: $5,217,000
Solid Waste Management: $2,293,000
Solid Waste Management: $451,000
Regular Highways: $71,000
Elementary and Secondary Education School Tuition and Transportation: $31,000
Elementary and Secondary Education School Tuition and Transportation: $26,000
- Construction - Regular Highways: $2,321,000
General - Other: $1,690,000
Regular Highways: $1,152,000
Health - Other: $747,000
General - Other: $150,000
Elementary and Secondary Education: $23,000
Elementary and Secondary Education: $23,000
- Current Operations - Elementary and Secondary Education: $110,816,000
Elementary and Secondary Education: $98,491,000
Police Protection: $12,845,000
Police Protection: $9,161,000
General - Other: $7,435,000
Health - Other: $6,644,000
Health - Other: $6,366,000
Regular Highways: $4,078,000
General - Other: $3,791,000
Regular Highways: $3,658,000
Solid Waste Management: $3,414,000
Judicial and Legal Services: $2,764,000
Financial Administration: $2,591,000
Judicial and Legal Services: $2,506,000
Central Staff Services: $2,375,000
General Public Buildings: $1,670,000
Solid Waste Management: $1,488,000
Financial Administration: $1,371,000
Central Staff Services: $1,359,000
General Public Buildings: $844,000
Local Fire Protection: $734,000
Natural Resources - Other: $202,000
Natural Resources - Other: $178,000
- Federal Intergovernmental - Other: $203,000
Health and Hospitals: $62,000
Education: $57,000
Education: $56,000
Other: $10,000
- General - Interest on Debt: $4,550,000
Interest on Debt: $1,535,000
- Intergovernmental to Local - Other - Elementary and Secondary Education: $4,641,000
Other - General - Other: $1,584,000
Other - Elementary and Secondary Education: $617,000
Other - Local Fire Protection: $122,000
- Local Intergovernmental - Education: $15,123,000
General Local Government Support: $2,797,000
Education: $1,134,000
Other: $906,000
- Long Term Debt - Outstanding Unspecified Public Purpose: $117,735,000
Beginning Outstanding - Unspecified Public Purpose: $114,475,000
Beginning Outstanding - Unspecified Public Purpose: $59,851,000
Outstanding Unspecified Public Purpose: $45,322,000
Retired Unspecified Public Purpose: $14,529,000
Issue, Unspecified Public Purpose: $13,915,000
Retired Unspecified Public Purpose: $10,655,000
- Miscellaneous - Interest Earnings: $1,075,000
Interest Earnings: $954,000
General Revenue - Other: $557,000
Fines and Forfeits: $448,000
Fines and Forfeits: $436,000
General Revenue - Other: $358,000
Donations From Private Sources: $138,000
Donations From Private Sources: $84,000
Sale of Property: $51,000
Sale of Property: $10,000
- Other Capital Outlay - Elementary and Secondary Education: $2,755,000
Elementary and Secondary Education: $2,522,000
General Public Building: $617,000
Police Protection: $60,000
Judicial and Legal Services: $18,000
Correctional Institutions: $17,000
Health - Other: $12,000
- Other Funds - Cash and Securities: $32,819,000
Cash and Securities: $14,352,000
- Sinking Funds - Cash and Securities: $10,535,000
Cash and Securities: $4,003,000
- State Intergovernmental - Education: $83,020,000
Education: $71,491,000
Other: $4,223,000
Highways: $3,532,000
Highways: $3,330,000
Public Welfare: $2,025,000
General Local Government Support: $570,000
Health and Hospitals: $485,000
Health and Hospitals: $308,000
General Local Government Support: $153,000
Other: $153,000
- Tax - Property: $49,467,000
Property: $37,948,000
General Sales and Gross Receipts: $15,709,000
General Sales and Gross Receipts: $14,373,000
Other Selective Sales: $7,859,000
Motor Vehicle License: $4,842,000
Other License: $1,636,000
Occupation and Business License - Other: $1,172,000
Occupation and Business License - Other: $856,000
Other Selective Sales: $354,000
Severance: $218,000
Alcoholic Beverage Sales: $144,000
Other License: $120,000
Public Utilities Sales: $96,000
Public Utility License: $70,000
Alcoholic Beverage Sales: $55,000
- Total Salaries and Wages: $60,225,000
: $55,998,000
Robertson County government finances - Cash and Securities in 2018:
- Bond Funds - Cash and Securities: $15,688,000
Cash and Securities: $1,201,000
- Charges - Other: $9,107,000
Other: $8,823,000
Elementary and Secondary Education - Other: $6,066,000
Elementary and Secondary Education - Other: $5,217,000
Solid Waste Management: $2,293,000
Solid Waste Management: $451,000
Regular Highways: $71,000
Elementary and Secondary Education School Tuition and Transportation: $31,000
Elementary and Secondary Education School Tuition and Transportation: $26,000
- Construction - Regular Highways: $2,321,000
General - Other: $1,690,000
Regular Highways: $1,152,000
Health - Other: $747,000
General - Other: $150,000
Elementary and Secondary Education: $23,000
Elementary and Secondary Education: $23,000
- Current Operations - Elementary and Secondary Education: $110,816,000
Elementary and Secondary Education: $98,491,000
Police Protection: $12,845,000
Police Protection: $9,161,000
General - Other: $7,435,000
Health - Other: $6,644,000
Health - Other: $6,366,000
Regular Highways: $4,078,000
General - Other: $3,791,000
Regular Highways: $3,658,000
Solid Waste Management: $3,414,000
Judicial and Legal Services: $2,764,000
Financial Administration: $2,591,000
Judicial and Legal Services: $2,506,000
Central Staff Services: $2,375,000
General Public Buildings: $1,670,000
Solid Waste Management: $1,488,000
Financial Administration: $1,371,000
Central Staff Services: $1,359,000
General Public Buildings: $844,000
Local Fire Protection: $734,000
Natural Resources - Other: $202,000
Natural Resources - Other: $178,000
- Federal Intergovernmental - Other: $203,000
Health and Hospitals: $62,000
Education: $57,000
Education: $56,000
Other: $10,000
- General - Interest on Debt: $4,550,000
Interest on Debt: $1,535,000
- Intergovernmental to Local - Other - Elementary and Secondary Education: $4,641,000
Other - General - Other: $1,584,000
Other - Elementary and Secondary Education: $617,000
Other - Local Fire Protection: $122,000
- Local Intergovernmental - Education: $15,123,000
General Local Government Support: $2,797,000
Education: $1,134,000
Other: $906,000
- Long Term Debt - Outstanding Unspecified Public Purpose: $117,735,000
Beginning Outstanding - Unspecified Public Purpose: $114,475,000
Beginning Outstanding - Unspecified Public Purpose: $59,851,000
Outstanding Unspecified Public Purpose: $45,322,000
Retired Unspecified Public Purpose: $14,529,000
Issue, Unspecified Public Purpose: $13,915,000
Retired Unspecified Public Purpose: $10,655,000
- Miscellaneous - Interest Earnings: $1,075,000
Interest Earnings: $954,000
General Revenue - Other: $557,000
Fines and Forfeits: $448,000
Fines and Forfeits: $436,000
General Revenue - Other: $358,000
Donations From Private Sources: $138,000
Donations From Private Sources: $84,000
Sale of Property: $51,000
Sale of Property: $10,000
- Other Capital Outlay - Elementary and Secondary Education: $2,755,000
Elementary and Secondary Education: $2,522,000
General Public Building: $617,000
Police Protection: $60,000
Judicial and Legal Services: $18,000
Correctional Institutions: $17,000
Health - Other: $12,000
- Other Funds - Cash and Securities: $32,819,000
Cash and Securities: $14,352,000
- Sinking Funds - Cash and Securities: $10,535,000
Cash and Securities: $4,003,000
- State Intergovernmental - Education: $83,020,000
Education: $71,491,000
Other: $4,223,000
Highways: $3,532,000
Highways: $3,330,000
Public Welfare: $2,025,000
General Local Government Support: $570,000
Health and Hospitals: $485,000
Health and Hospitals: $308,000
General Local Government Support: $153,000
Other: $153,000
- Tax - Property: $49,467,000
Property: $37,948,000
General Sales and Gross Receipts: $15,709,000
General Sales and Gross Receipts: $14,373,000
Other Selective Sales: $7,859,000
Motor Vehicle License: $4,842,000
Other License: $1,636,000
Occupation and Business License - Other: $1,172,000
Occupation and Business License - Other: $856,000
Other Selective Sales: $354,000
Severance: $218,000
Alcoholic Beverage Sales: $144,000
Other License: $120,000
Public Utilities Sales: $96,000
Public Utility License: $70,000
Alcoholic Beverage Sales: $55,000
- Total Salaries and Wages: $60,225,000
: $55,998,000
Supplemental Security Income (SSI) in 2006:
- Total number of recipients: 1,144
- Number of aged recipients: 138
- Number of blind and disabled recipients: 1,006
- Number of recipients under 18: 168
- Number of recipients between 18 and 64: 702
- Number of recipients older than 64: 274
- Number of recipients also receiving OASDI: 458
- Amount of payments (thousands of dollars): 507
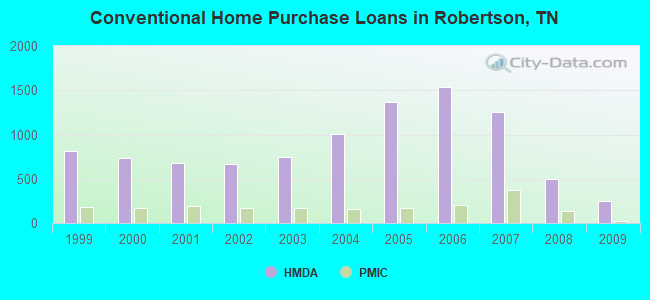
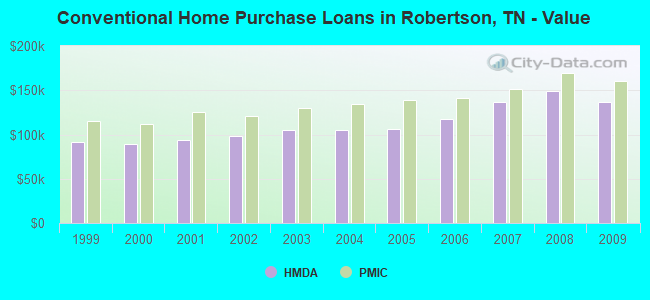
| Home Mortgage Disclosure Act Aggregated Statistics For Year 2009 (Based on 10 full tracts) | ||||||||||||||
| A) FHA, FSA/RHS & VA Home Purchase Loans | B) Conventional Home Purchase Loans | C) Refinancings | D) Home Improvement Loans | E) Loans on Dwellings For 5+ Families | F) Non-occupant Loans on < 5 Family Dwellings (A B C & D) | G) Loans On Manufactured Home Dwelling (A B C & D) | ||||||||
|---|---|---|---|---|---|---|---|---|---|---|---|---|---|---|
| Number | Average Value | Number | Average Value | Number | Average Value | Number | Average Value | Number | Average Value | Number | Average Value | Number | Average Value | |
| LOANS ORIGINATED | 404 | $150,047 | 249 | $136,494 | 1,580 | $157,003 | 71 | $53,549 | 1 | $255,000 | 186 | $143,210 | 78 | $76,859 |
| APPLICATIONS APPROVED, NOT ACCEPTED | 9 | $138,333 | 18 | $117,556 | 135 | $142,385 | 12 | $23,000 | 1 | $411,000 | 11 | $88,000 | 8 | $65,125 |
| APPLICATIONS DENIED | 61 | $145,754 | 55 | $127,164 | 548 | $155,323 | 88 | $30,773 | 1 | $10,777,000 | 25 | $143,760 | 29 | $86,138 |
| APPLICATIONS WITHDRAWN | 49 | $153,347 | 35 | $136,943 | 375 | $155,517 | 16 | $33,312 | 0 | $0 | 16 | $99,562 | 10 | $82,400 |
| FILES CLOSED FOR INCOMPLETENESS | 10 | $152,300 | 4 | $136,000 | 71 | $174,676 | 2 | $122,000 | 0 | $0 | 2 | $38,500 | 2 | $58,500 |
| Private Mortgage Insurance Companies Aggregated Statistics For Year 2009 (Based on 10 full tracts) | ||||
| A) Conventional Home Purchase Loans | B) Refinancings | |||
|---|---|---|---|---|
| Number | Average Value | Number | Average Value | |
| LOANS ORIGINATED | 27 | $160,630 | 70 | $186,557 |
| APPLICATIONS APPROVED, NOT ACCEPTED | 8 | $154,375 | 28 | $184,036 |
| APPLICATIONS DENIED | 7 | $219,857 | 14 | $206,786 |
| APPLICATIONS WITHDRAWN | 2 | $162,500 | 6 | $251,500 |
| FILES CLOSED FOR INCOMPLETENESS | 3 | $154,000 | 4 | $160,250 |
| Most common first names in Robertson County, TN among deceased individuals | ||
| Name | Count | Lived (average) |
|---|---|---|
| James | 465 | 72.3 years |
| William | 332 | 74.0 years |
| Mary | 316 | 77.9 years |
| John | 301 | 74.2 years |
| Robert | 260 | 72.5 years |
| Charles | 170 | 70.8 years |
| George | 154 | 75.2 years |
| Annie | 118 | 83.1 years |
| Thomas | 118 | 75.9 years |
| Joe | 105 | 72.0 years |
| Most common last names in Robertson County, TN among deceased individuals | ||
| Last name | Count | Lived (average) |
|---|---|---|
| Jones | 196 | 75.3 years |
| Smith | 173 | 73.4 years |
| Williams | 121 | 76.3 years |
| Johnson | 115 | 74.2 years |
| Wilson | 105 | 78.5 years |
| Dorris | 97 | 77.9 years |
| Brown | 97 | 74.6 years |
| Ellis | 89 | 75.8 years |
| Head | 71 | 78.5 years |
| Woodard | 69 | 74.9 years |
| Businesses in Robertson County, TN | ||||
| Name | Count | Name | Count | |
|---|---|---|---|---|
| ALDI | 1 | Holiday Inn | 1 | |
| AT&T | 1 | Jimmy John's | 1 | |
| Ace Hardware | 2 | KFC | 3 | |
| Advance Auto Parts | 2 | Kroger | 2 | |
| Applebee's | 1 | La-Z-Boy | 1 | |
| Arby's | 1 | Little Caesars Pizza | 2 | |
| AutoZone | 1 | Lowe's | 1 | |
| Best Western | 1 | MasterBrand Cabinets | 7 | |
| Burger King | 1 | McDonald's | 3 | |
| CVS | 1 | Nike | 2 | |
| Chevrolet | 1 | Papa John's Pizza | 1 | |
| Comfort Inn | 1 | Pizza Hut | 2 | |
| Cracker Barrel | 1 | Quality | 1 | |
| Cricket Wireless | 2 | RadioShack | 1 | |
| Curves | 2 | Rite Aid | 2 | |
| DHL | 1 | SONIC Drive-In | 4 | |
| Decora Cabinetry | 2 | Subway | 4 | |
| Domino's Pizza | 2 | Taco Bell | 3 | |
| Dunkin Donuts | 2 | U-Haul | 5 | |
| FedEx | 8 | UPS | 8 | |
| Ford | 1 | Waffle House | 1 | |
| GameStop | 1 | Walgreens | 2 | |
| H&R Block | 2 | Walmart | 2 | |
| Hardee's | 2 | Wendy's | 3 | |
| Hilton | 1 | YMCA | 1 | |