Morgan County, West Virginia (WV)
County owner-occupied free and clear houses and condos in 2010: 2,370
County owner-occupied houses and condos in 2000: 5,117
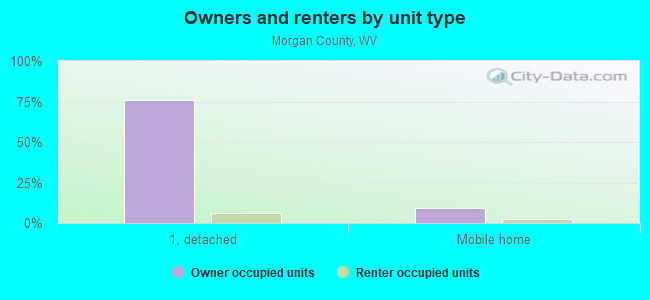
Renter-occupied apartments: 1,253 (it was 1,028 in 2000)
| % of renters here: | 17% |
| State: | 27% |
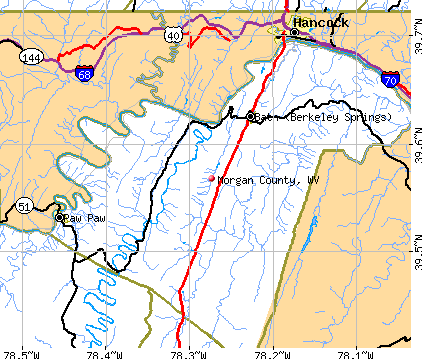
Land area: 229 sq. mi.
Water area: 0.7 sq. mi.
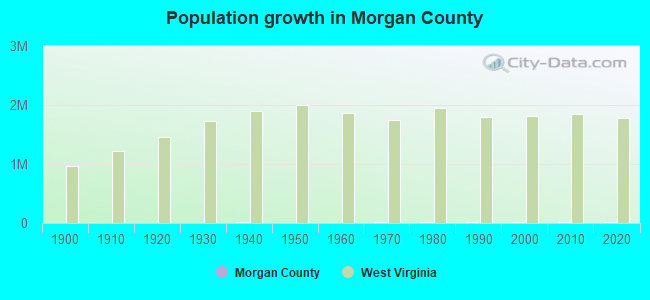
Population density: 75 people per square mile (average).
Industries providing employment: Educational, health and social services (21.4%), Construction (14.3%), Retail trade (13.0%).
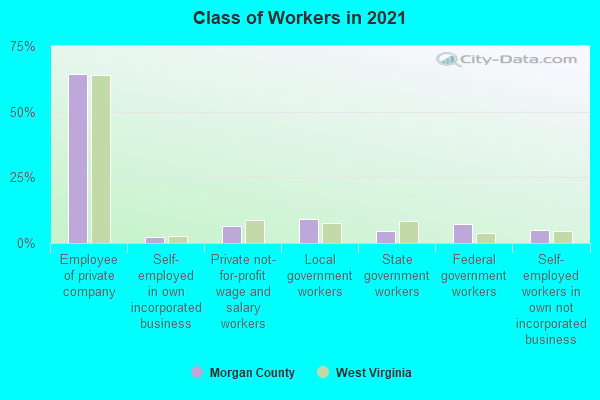
Type of workers:
- Private wage or salary: 76%
- Government: 19%
- Self-employed, not incorporated: 5%
- Unpaid family work: 0%
- OSM Map
- General Map
- Google Map
- MSN Map

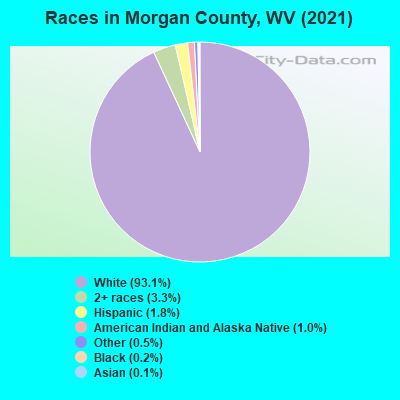
- 15,85892.8%White Non-Hispanic Alone
- 4792.8%Two or more races
- 3452.0%Hispanic or Latino
- 1550.9%American Indian and Alaska Native alone
- 1410.8%Some other race alone
- 840.5%Asian alone
- 260.2%Black Non-Hispanic Alone
| Median resident age: | 48.9 years |
| West Virginia median age: | 42.9 years |
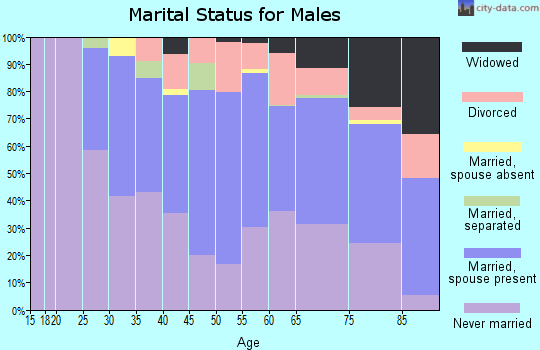
| Males: 8,658 | |
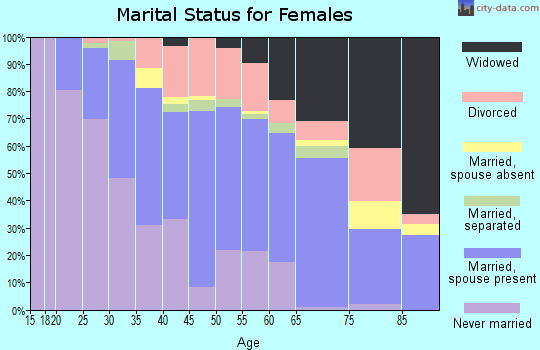
| Females: 8,407 |

 | Thinking about moving to Morgan County (36 replies) |
| Help me narrow it down? WV small town suggestions (8 replies) |
| WV comes in 4th place (37 replies) |
| Safe friendly area close to National Forest with less snow (48 replies) |
| Moving from VA to WV questions (31 replies) |
| Eastern Panhandle growth (38 replies) |
| Morgan County: | 2.0 people |
| West Virginia: | 2 people |
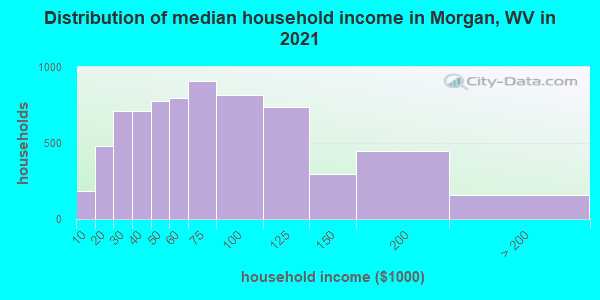
Estimated median household income in 2022: $60,039 ($35,016 in 1999)
| This county: | $60,039 |
| West Virginia: | $54,329 |
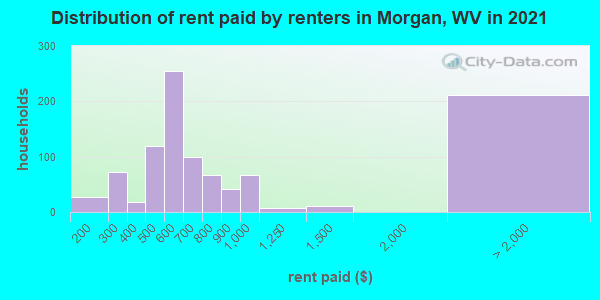
Median contract rent in 2022 for apartments: $591 (lower quartile is $498, upper quartile is $747)
| This county: | $591 |
| State: | $606 |
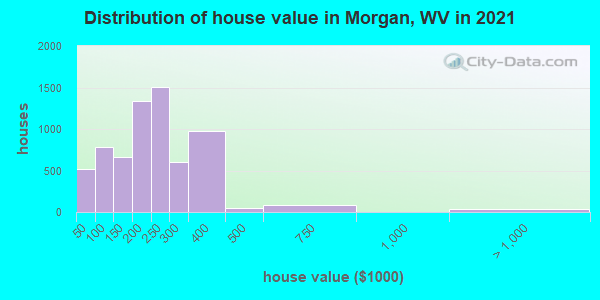
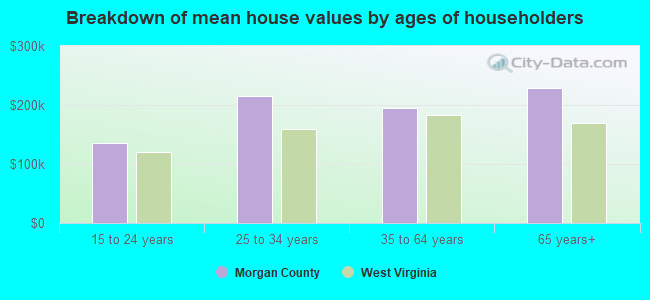
Estimated median house or condo value in 2022: $226,055 (it was $85,300 in 2000)
| Morgan: | $226,055 |
| West Virginia: | $155,100 |
Median monthly housing costs for homes and condos with a mortgage: $1,252
Median monthly housing costs for units without a mortgage: $333
Institutionalized population: 123
Crime in 2021 (reported by the sheriff's office or county police, not the county total):
- Murders: 0
- Rapes: 0
- Robberies: 0
- Assaults: 12
- Burglaries: 4
- Thefts: 19
- Auto thefts: 0
Crime in 2020 (reported by the sheriff's office or county police, not the county total):
- Murders: 0
- Rapes: 2
- Robberies: 1
- Assaults: 34
- Burglaries: 10
- Thefts: 19
- Auto thefts: 2
Health of residents in Morgan County based on CDC Behavioral Risk Factor Surveillance System Survey Questionnaires from 2013 to 2021:
General health status score of residents in this county from 1 (poor) to 5 (excellent) is 3.4. This is worse than average.68.5% of residents exercised in the past month. This is less than average.
46.9% of residents smoked 100+ cigarettes in their lives. This is about average.
42.5% of adult residents drank alcohol in the past 30 days. This is less than average.
65.4% of residents visited a dentist within the past year. This is less than average.
Average weight of males is 204 pounds. This is more than average.
Average weight of females is 168 pounds. This is more than average.
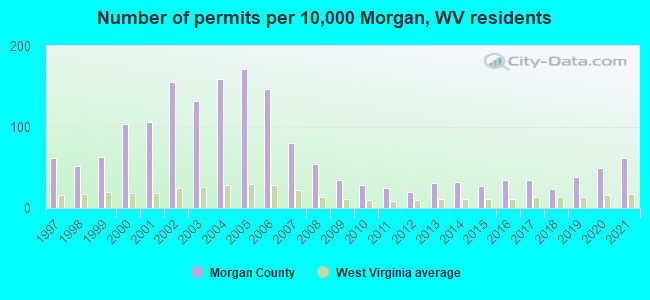
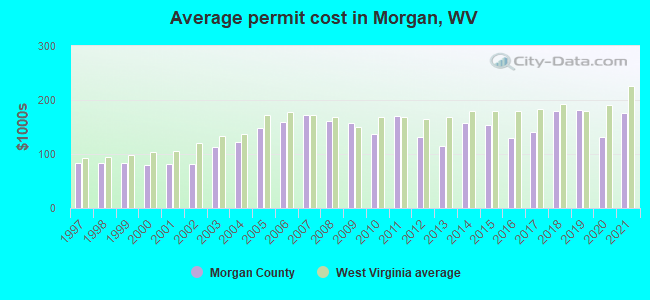
Single-family new house construction building permits:
- 2022: 112 buildings, average cost: $258,700
- 2021: 92 buildings, average cost: $175,900
- 2020: 75 buildings, average cost: $131,300
- 2019: 57 buildings, average cost: $181,900
- 2018: 36 buildings, average cost: $178,700
- 2017: 52 buildings, average cost: $140,700
- 2016: 53 buildings, average cost: $130,400
- 2015: 40 buildings, average cost: $154,200
- 2014: 48 buildings, average cost: $157,900
- 2013: 47 buildings, average cost: $113,500
- 2012: 30 buildings, average cost: $131,500
- 2011: 37 buildings, average cost: $170,600
- 2010: 43 buildings, average cost: $137,000
- 2009: 51 buildings, average cost: $156,700
- 2008: 80 buildings, average cost: $162,300
- 2007: 120 buildings, average cost: $171,500
- 2006: 220 buildings, average cost: $160,000
- 2005: 257 buildings, average cost: $149,300
- 2004: 238 buildings, average cost: $121,700
- 2003: 197 buildings, average cost: $113,300
- 2002: 231 buildings, average cost: $81,700
- 2001: 159 buildings, average cost: $82,100
- 2000: 155 buildings, average cost: $80,400
- 1999: 94 buildings, average cost: $84,100
- 1998: 77 buildings, average cost: $82,700
- 1997: 92 buildings, average cost: $83,000
Median real estate property taxes paid for housing units with mortgages in 2022: $1,194 (0.5%)
Median real estate property taxes paid for housing units with no mortgage in 2022: $919 (0.5%)
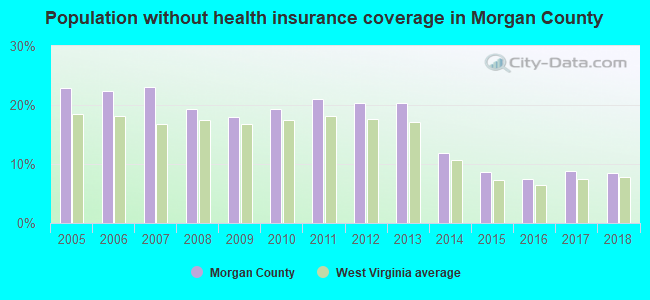
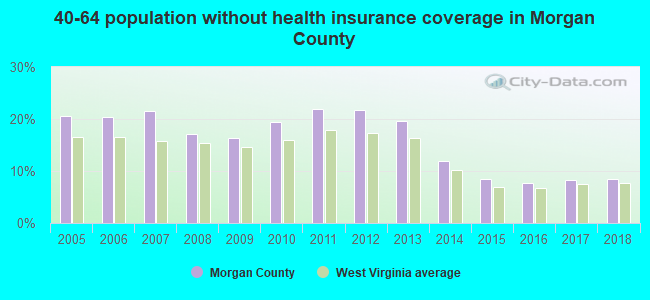
| Morgan County: | 11.3% |
| West Virginia: | 17.9% |
Median age of residents in 2022: 48.9 years old
(Males: 48.0 years old, Females: 49.6 years old)
(Median age for: White residents: 49.4 years old, Black residents: 55.8 years old, American Indian residents: 12.4 years old, Asian residents: 39.7 years old, Hispanic or Latino residents: 27.2 years old, Other race residents: 79.8 years old)
Area name: Hagerstown-Martinsburg, MD-WV MSA
Fair market rent in 2006 for a 1-bedroom apartment in Morgan County is $506 a month.
Fair market rent for a 2-bedroom apartment is $629 a month.
Fair market rent for a 3-bedroom apartment is $874 a month.
Cities in this county include: Bath (Berkeley Springs), Paw Paw, Great Cacapon.
Neighboring counties: New Castle County, Delaware  , Arapahoe County, Colorado
  , Bartholomew County, Indiana , Greene County, Ohio , Parke County, Indiana .
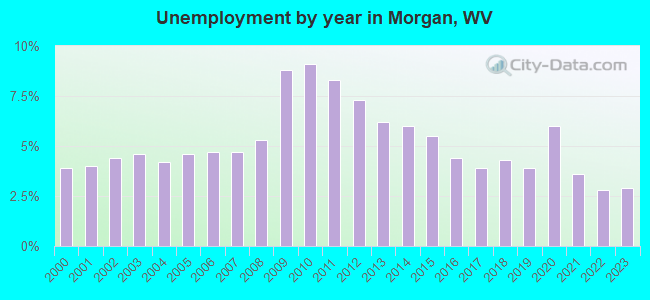
| Here: | 3.1% |
| West Virginia: | 4.0% |
Current college students: 238
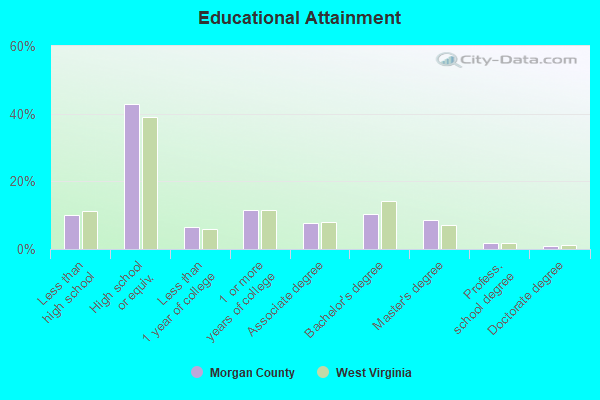
People 25 years of age or older with a high school degree or higher: 88.2%
People 25 years of age or older with a bachelor's degree or higher: 18.7%
Number of foreign born residents: 241 (61.8% naturalized citizens)
| Morgan County: | 1.4% |
| Whole state: | 1.8% |
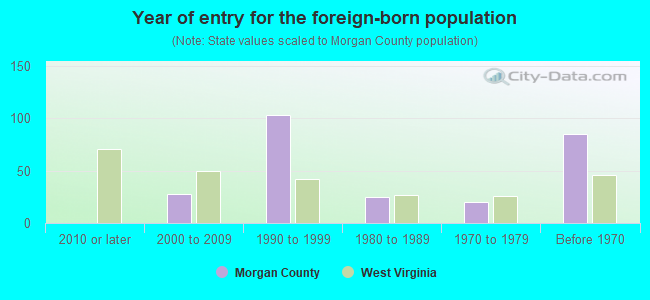
- Year of entry for the foreign-born population
- 52010 or later
- 402000 to 2009
- 721990 to 1999
- 251980 to 1989
- 201970 to 1979
- 85Before 1970
Mean travel time to work (commute): + minutes
Percentage of county residents living and working in this county: 57.3%
Housing units in structures:
- One, detached: 7,503
- One, attached: 55
- Two: 138
- 3 or 4: 83
- 5 to 9: 140
- 10 to 19: 22
- 20 or more: 3
- Mobile homes: 1,192
Housing units in Morgan County with a mortgage: 3,765 (402 second mortgage, 0 home equity loan, 371 both second mortgage and home equity loan)
Houses without a mortgage: 90
| Here: | 3.2% with mortgage |
| State: | 97.1% with mortgage |
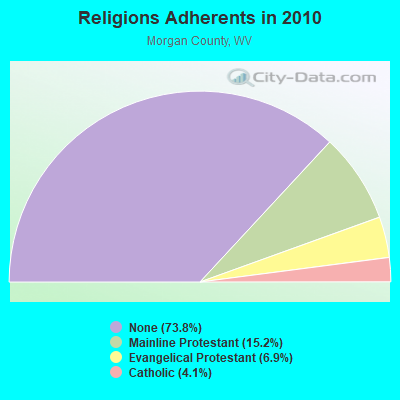
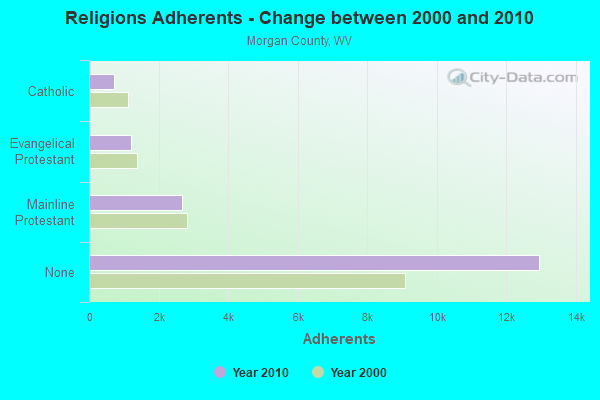
Religion statistics for Morgan County
| Religion | Adherents | Congregations |
|---|---|---|
| Mainline Protestant | 2,667 | 20 |
| Evangelical Protestant | 1,204 | 14 |
| Catholic | 715 | 1 |
| Other | 7 | 1 |
| None | 12,948 | - |
Source: Clifford Grammich, Kirk Hadaway, Richard Houseal, Dale E.Jones, Alexei Krindatch, Richie Stanley and Richard H.Taylor. 2012. 2010 U.S.Religion Census: Religious Congregations & Membership Study. Association of Statisticians of American Religious Bodies. Jones, Dale E., et al. 2002. Congregations and Membership in the United States 2000. Nashville, TN: Glenmary Research Center.
Food Environment Statistics:
| Morgan County: | 1.22 / 10,000 pop. |
| State: | 2.41 / 10,000 pop. |
| This county: | 1.22 / 10,000 pop. |
| West Virginia: | 1.09 / 10,000 pop. |
| Morgan County: | 3.06 / 10,000 pop. |
| West Virginia: | 5.38 / 10,000 pop. |
| This county: | 6.12 / 10,000 pop. |
| State: | 6.22 / 10,000 pop. |
| Morgan County: | 12.9% |
| West Virginia: | 12.2% |
| Morgan County: | 30.0% |
| State: | 31.1% |
| Here: | 12.8% |
| State: | 13.1% |
Agriculture in Morgan County:
Average size of farms: 129 acresAverage value of agricultural products sold per farm: $7,150
Average value of crops sold per acre for harvested cropland: $117.06
The value of nursery, greenhouse, floriculture, and sod as a percentage of the total market value of agricultural products sold: 1.12%
The value of livestock, poultry, and their products as a percentage of the total market value of agricultural products sold: 46.45%
Average total farm production expenses per farm: $11,041
Harvested cropland as a percentage of land in farms: 25.36%
Average market value of all machinery and equipment per farm: $21,924
The percentage of farms operated by a family or individual: 94.38%
Average age of principal farm operators: 58 years
Average number of cattle and calves per 100 acres of all land in farms: 9.03
Corn for grain: 164 harvested acres
All wheat for grain: 192 harvested acres
Land in orchards: 246 acres
Earthquake activity:
Morgan County-area historical earthquake activity is significantly above West Virginia state average. It is 52% smaller than the overall U.S. average.On 8/23/2011 at 17:51:04, a magnitude 5.8 (5.8 MW, Depth: 3.7 mi, Class: Moderate, Intensity: VI - VII) earthquake occurred 116.1 miles away from Morgan County center
On 9/25/1998 at 19:52:52, a magnitude 5.2 (4.8 MB, 4.3 MS, 5.2 LG, 4.5 MW, Depth: 3.1 mi) earthquake occurred 173.6 miles away from the county center
On 1/31/1986 at 16:46:43, a magnitude 5.0 (5.0 MB) earthquake occurred 206.8 miles away from the county center
On 1/16/1994 at 01:49:16, a magnitude 4.6 (4.6 MB, 4.6 LG, Depth: 3.1 mi, Class: Light, Intensity: IV - V) earthquake occurred 129.8 miles away from the county center
On 8/25/2011 at 05:07:52, a magnitude 4.5 (4.5 ML, Depth: 4.2 mi) earthquake occurred 113.3 miles away from Morgan County center
On 12/9/2003 at 20:59:18, a magnitude 4.5 (4.5 ML, Depth: 6.2 mi) earthquake occurred 124.4 miles away from the county center
Magnitude types: regional Lg-wave magnitude (LG), body-wave magnitude (MB), local magnitude (ML), surface-wave magnitude (MS), moment magnitude (MW)
Most recent natural disasters:
- West Virginia Covid-19 Pandemic, Incident Period: January 20, 2020, Major Disaster (Presidential) Declared DR-4517-WV: April 3, 2020, FEMA Id: 4517, Natural disaster type: Other
- West Virginia Severe Storms, Flooding, Landslides, And Mudslides, Incident Period: May 28, 2018 - June 3, 2018, FEMA Id: 4378, Natural disaster type: Storm, Mudslide, Landslide, Flood
- West Virginia Hurricane Sandy, Incident Period: October 29, 2012 to November 08, 2012, Emergency Declared EM-3358: October 29, 2012, FEMA Id: 3358, Natural disaster type: Hurricane
- West Virginia Severe Storms, Incident Period: June 29, 2012 to July 10, 2012, Emergency Declared EM-3345: June 30, 2012, FEMA Id: 3345, Natural disaster type: Storm
- West Virginia Severe Winter Storms and Snowstorms, Incident Period: February 05, 2010 to February 11, 2010, Major Disaster (Presidential) Declared DR-1903: April 23, 2010, FEMA Id: 1903, Natural disaster type: Snowstorm, Winter Storm
- West Virginia Hurricane Katrina Evacuation, Incident Period: August 29, 2005 to October 01, 2005, Emergency Declared EM-3221: September 05, 2005, FEMA Id: 3221, Natural disaster type: Hurricane
- West Virginia Severe Storms, Flooding and Landslides, Incident Period: September 16, 2004 to September 27, 2004, Major Disaster (Presidential) Declared DR-1558: September 20, 2004, FEMA Id: 1558, Natural disaster type: Storm, Landslide, Flood
- West Virginia Hurricane Isabel, Incident Period: September 18, 2003 to September 30, 2003, Major Disaster (Presidential) Declared DR-1496: September 23, 2003, FEMA Id: 1496, Natural disaster type: Hurricane
- West Virginia Hurricane Fran, Incident Period: September 05, 1996 to September 08, 1996, Major Disaster (Presidential) Declared DR-1137: September 11, 1996, FEMA Id: 1137, Natural disaster type: Hurricane
- West Virginia Flooding, Incident Period: January 19, 1996 to February 02, 1996, Major Disaster (Presidential) Declared DR-1096: January 25, 1996, FEMA Id: 1096, Natural disaster type: Flood
- 4 other natural disasters have been reported since 1953.
The number of natural disasters in Morgan County (14) is near the US average (15).
Major Disasters (Presidential) Declared: 9
Emergencies Declared: 4
Causes of natural disasters: Floods: 4, Hurricanes: 4, Storms: 4, Landslides: 2, Winter Storms: 2, Blizzard: 1, Mudslide: 1, Snowfall: 1, Snowstorm: 1, Tropical Storm: 1, Other: 1 (Note: some incidents may be assigned to more than one category).
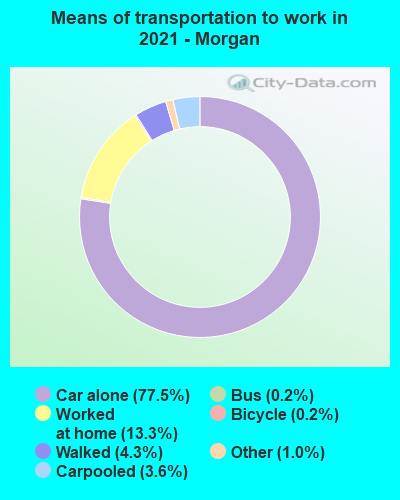
Means of transportation to work:
- Drove a car alone: 2,728 (75.7%)
- Carpooled: 200 (5.5%)
- Bus: 3 (0.1%)
- Taxicab, motorcycle, or other means: 29 (0.8%)
- Bicycle: 1 (0.0%)
- Walked: 74 (2.1%)
- Worked at home: 648 (18.0%)
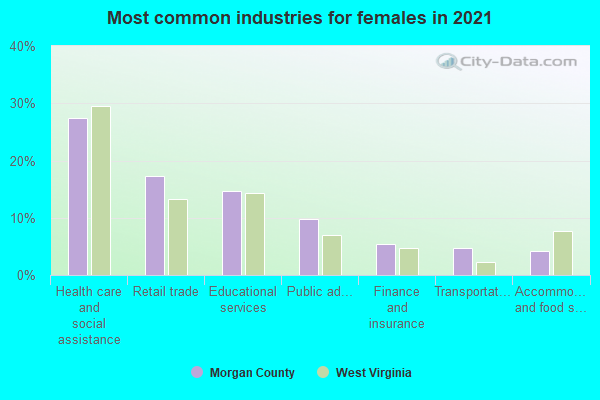
- Health care and social assistance (22%)
- Retail trade (13%)
- Educational services (12%)
- Public administration (8%)
- Accommodation and food services (4%)
- Other services, except public administration (4%)
- Professional, scientific, and technical services (4%)
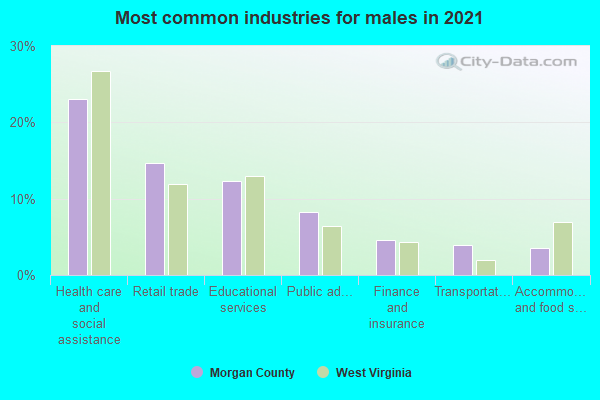
- Health care and social assistance (26%)
- Retail trade (16%)
- Educational services (14%)
- Public administration (9%)
- Accommodation and food services (5%)
- Other services, except public administration (5%)
- Professional, scientific, and technical services (4%)
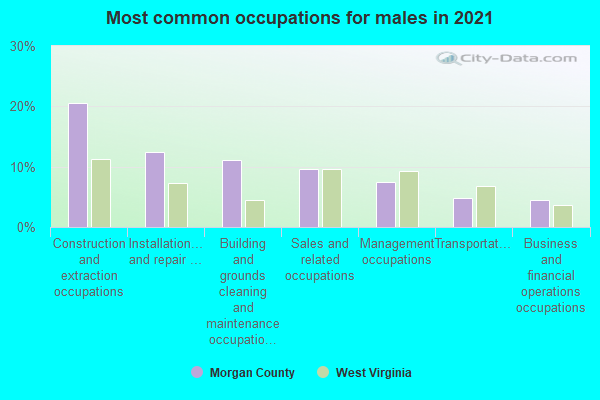
- Construction and extraction occupations (19%)
- Building and grounds cleaning and maintenance occupations (10%)
- Installation, maintenance, and repair occupations (9%)
- Sales and related occupations (9%)
- Material moving occupations (6%)
- Management occupations (6%)
- Production occupations (6%)
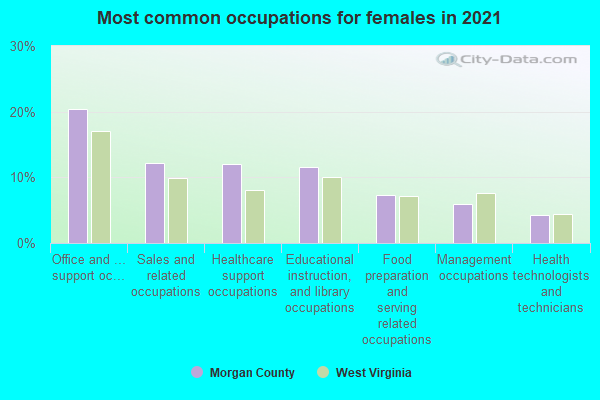
- Office and administrative support occupations (21%)
- Sales and related occupations (12%)
- Educational instruction, and library occupations (11%)
- Healthcare support occupations (9%)
- Food preparation and serving related occupations (8%)
- Management occupations (7%)
- Health technologists and technicians (5%)
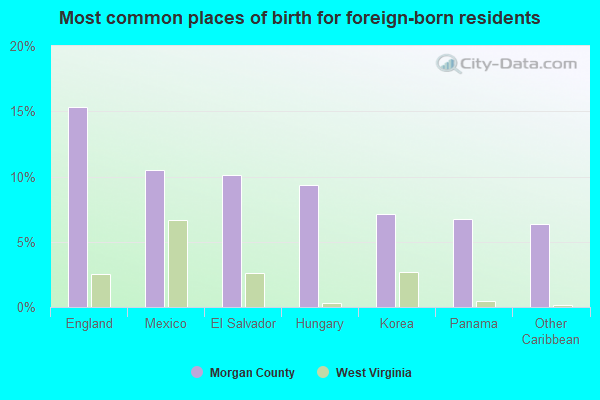
- England (11%)
- Mexico (11%)
- Korea (11%)
- El Salvador (10%)
- Trinidad and Tobago (8%)
- Other Caribbean (8%)
- Panama (6%)
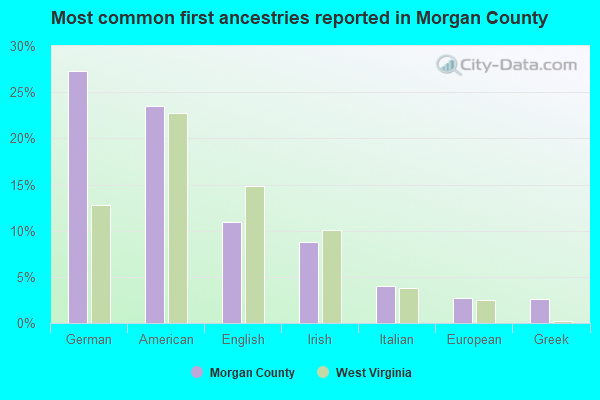
- American (27%)
- German (22%)
- English (13%)
- Irish (9%)
- Italian (4%)
- European (2%)
- Greek (2%)
163 people in nursing homes
8 people in other noninstitutional group quarters
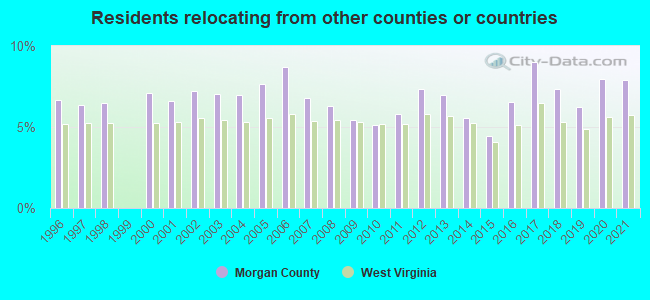
7.87% of this county's 2021 resident taxpayers lived in other counties in 2020 ($64,138 average adjusted gross income)
| Here: | 7.87% |
| West Virginia average: | 5.74% |
10 or fewer of this county's residents moved from foreign countries.
2.50% relocated from other counties in West Virginia ($14,896 average AGI)
5.37% relocated from other states ($49,242 average AGI)
Morgan County: 5.37% West Virginia average: 3.02%
Top counties from which taxpayers relocated into this county between 2020 and 2021:
| from Berkeley County, WV | |
| from Washington County, MD | |
| from Frederick County, VA |
6.04% of this county's 2020 resident taxpayers moved to other counties in 2021 ($43,623 average adjusted gross income)
| Here: | 6.04% |
| West Virginia average: | 5.65% |
10 or fewer of this county's residents moved to foreign countries.
2.74% relocated to other counties in West Virginia ($17,718 average AGI)
3.30% relocated to other states ($25,905 average AGI)
Morgan County: 3.30% West Virginia average: 2.93%

Top counties to which taxpayers relocated from this county between 2020 and 2021:
| to Berkeley County, WV | |
| to Washington County, MD | |
| to Hampshire County, WV |
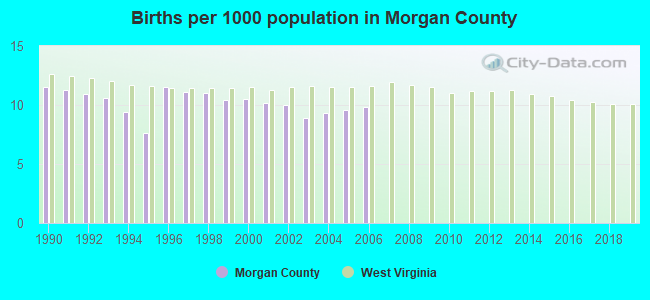
Births per 1000 population from 1990 to 1999: 10.5
Births per 1000 population from 2000 to 2006: 9.8
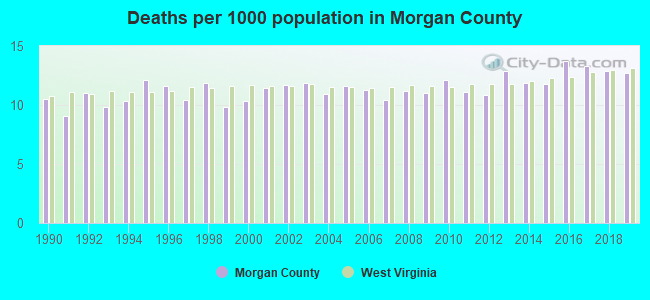
Deaths per 1000 population from 1990 to 1999: 10.7
Deaths per 1000 population from 2000 to 2009: 11.2
Deaths per 1000 population from 2010 to 2020: 12.5
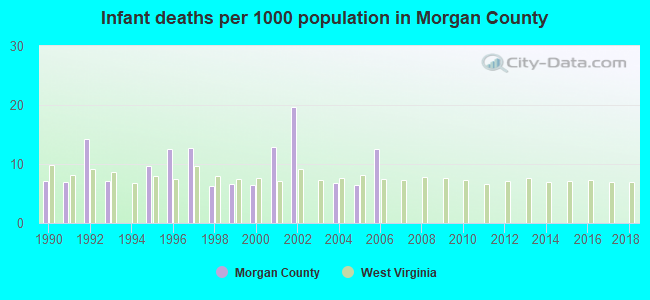
Infant deaths per 1000 live births from 1990 to 1999: 8.3
Infant deaths per 1000 live births from 2000 to 2006: 9.3
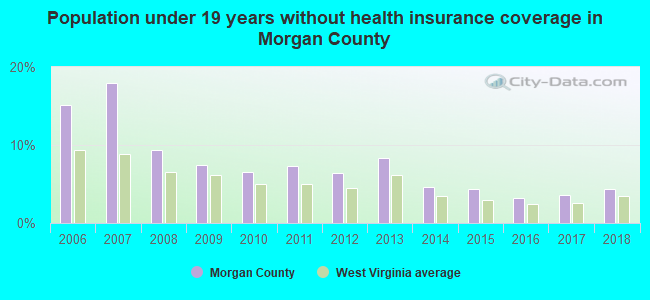
Persons under 19 years old without health insurance coverage in 2018: 4.3%
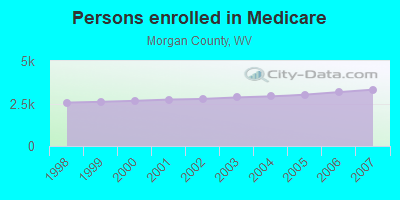
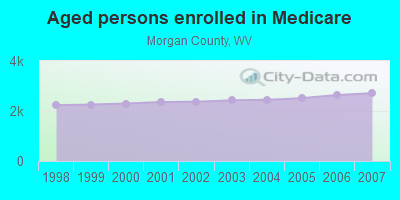
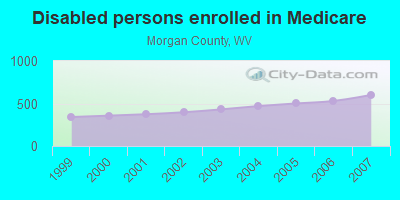
Persons enrolled in hospital insurance and/or supplemental medical insurance (Medicare) in July 1, 2007: 3,314 (2,713 aged, 601 disabled)
Children under 18 without health insurance coverage in 2007: 623 (17%)
Most common underlying causes of death in Morgan County, West Virginia in 1999 - 2019:
- Bronchus or lung, unspecified - Malignant neoplasms (338)
- Atherosclerotic heart disease (194)
- Acute myocardial infarction, unspecified (169)
- Alzheimer disease, unspecified (77)
- Chronic obstructive pulmonary disease, unspecified (56)
- Unspecified dementia (21)
- Congestive heart failure (20)
Population without health insurance coverage in 2000: 10%
Children under 18 without health insurance coverage in 2000: 6%
Short term general hospital admissions per 100,000 population in 2004: 4,010
Short term general hospital beds per 100,000 population in 2004: 259
Emergency room visits per 100,000 population in 2004: 34,029
General practice office based MDs per 100,000 population in 2005: 1,042
Medical specialist MDs per 100,000 population in 2005: 1,286
Total births per 100,000 population, July 2005 - July 2006 : 22
Total deaths per 100,000 population, July 2005 - July 2006: 37
Limited-service eating places per 100,000 population in 2005 : 12
Household type by relationship:
Households: 17,065- Male householders: 3,711 (906 living alone), Female householders: 3,536 (1,049 living alone)
3,719 spouses (3,707 opposite-sex spouses), 577 unmarried partners, (574 opposite-sex unmarried partners), 4,057 children (3,667 natural, 126 adopted, 254 stepchildren), 373 grandchildren, 152 brothers or sisters, 138 parents, 29 foster children, 355 other relatives, 318 non-relatives
- In group quarters: 140
Size of family households: 2,746 2-persons, 816 3-persons, 741 4-persons, 470 5-persons, 114 6-persons, 25 7-or-more-persons.
Size of nonfamily households: 1,956 1-person, 351 2-persons, 20 3-persons.
1,750 married couples with children.
795 single-parent households (341 men, 454 women).
97.9% of residents of Morgan speak English at home.
0.9% of residents speak Spanish at home (76% speak English very well, 18% speak English well, 6% speak English not well).
0.8% of residents speak other Indo-European language at home (88% speak English very well, 12% speak English well).
0.2% of residents speak Asian or Pacific Island language at home (52% speak English very well, 48% speak English not well).
In fiscal year 2004:
Federal Government expenditure: $90,733,000 ($5,739 per capita)
Department of Defense expenditure: $15,378,000
Federal direct payments to individuals for retirement and disability: $52,490,000
Federal other direct payments to individuals: $14,892,000
Federal direct payments not to individuals: $106,000
Federal grants: $9,125,000
Federal procurement contracts: $12,539,000 ($12,095,000 Department of Defense)
Federal salaries and wages: $1,582,000 ($0,000 Department of Defense)
Federal Government direct loans: $12,000
Federal guaranteed/insured loans: $7,097,000
Federal Government insurance: $16,767,000
Population change from April 1, 2000 to July 1, 2005:
Births: 787| Here: | 49 per 1000 residents |
| State: | 60 per 1000 residents |
Deaths: 911
| Here: | 57 per 1000 residents |
| State: | 61 per 1000 residents |
Net international migration: +49
| Here: | +3 per 1000 residents |
| State: | +2 per 1000 residents |
Net internal migration: +1,179
| Here: | +74 per 1000 residents |
| State: | +6 per 1000 residents |
Total withdrawal of fresh water for public supply: 0.73 millions of gallons per day (95% from ground, 5% from surface)
| Here: | 6.3 |
| State: | 6.5 |
| Here: | 4.2 |
| State: | 4.7 |
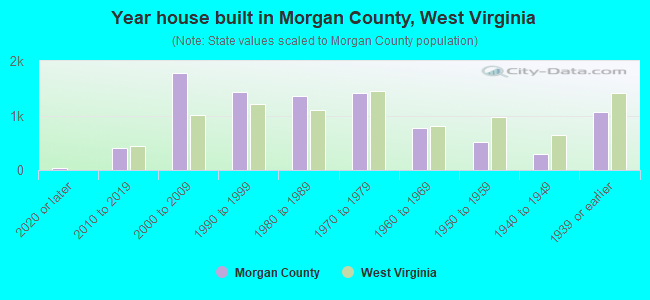
- Year house built in Morgan County, West Virginia
- 562020 or later
- 6202010 to 2019
- 1,6412000 to 2009
- 1,3341990 to 1999
- 1,5391980 to 1989
- 1,3431970 to 1979
- 8861960 to 1969
- 4311950 to 1959
- 2651940 to 1949
- 1,0851939 or earlier
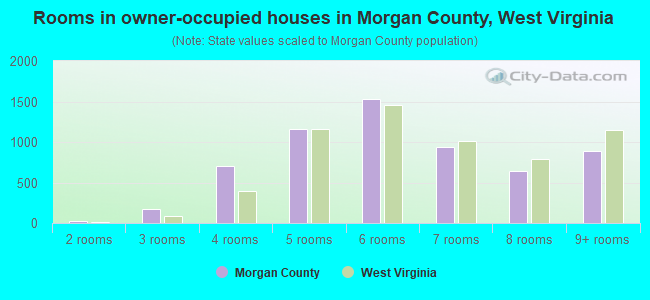
- Rooms in owner-occupied houses in Morgan County, West Virginia
- 91 room
- 02 rooms
- 2683 rooms
- 8714 rooms
- 9505 rooms
- 1,3876 rooms
- 1,0007 rooms
- 6558 rooms
- 1,0389+ rooms
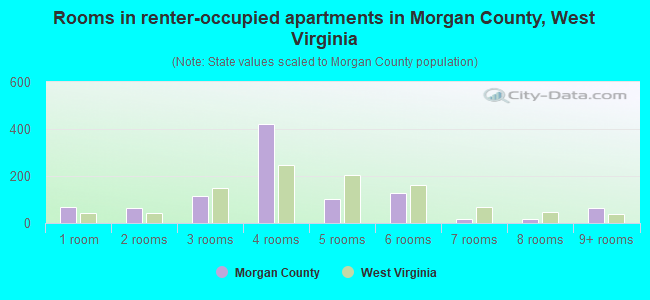
- Rooms in renter-occupied apartments in Morgan County, West Virginia
- 421 room
- 852 rooms
- 873 rooms
- 4444 rooms
- 1195 rooms
- 1526 rooms
- 557 rooms
- 558 rooms
- 819+ rooms
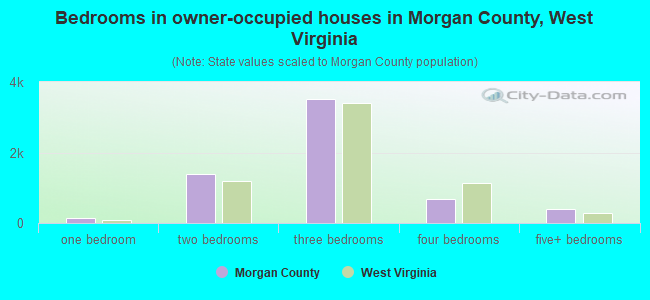
- Bedrooms in owner-occupied houses in Morgan County, West Virginia
- 10no bedroom
- 1691 bedroom
- 1,3522 bedrooms
- 3,3683 bedrooms
- 8474 bedrooms
- 3885+ bedrooms
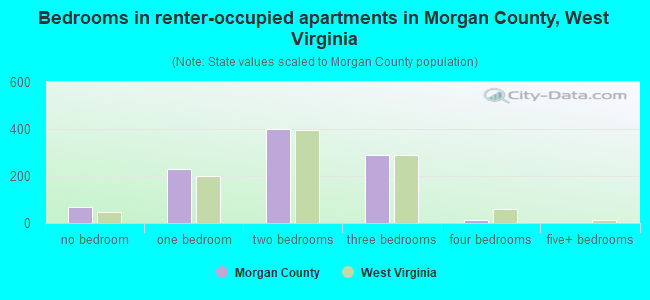
- Bedrooms in renter-occupied apartments in Morgan County, West Virginia
- 43no bedroom
- 2531 bedroom
- 3582 bedrooms
- 4433 bedrooms
- 274 bedrooms
- 25+ bedrooms
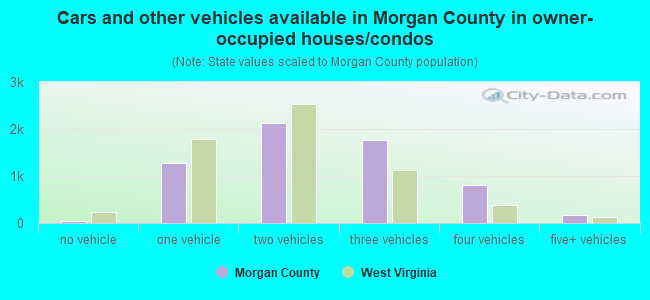
- Cars and other vehicles available in Morgan County in owner-occupied houses/condos
- 122no vehicle
- 1,3941 vehicle
- 2,1372 vehicles
- 1,5383 vehicles
- 7244 vehicles
- 1565+ vehicles
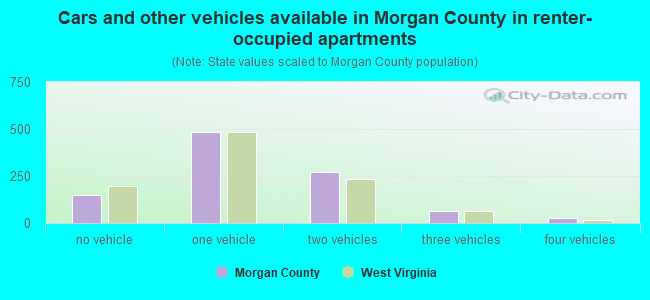
- Cars and other vehicles available in Morgan County in renter-occupied apartments
- 181no vehicle
- 5051 vehicle
- 3032 vehicles
- 1053 vehicles
- 314 vehicles
- 05+ vehicles
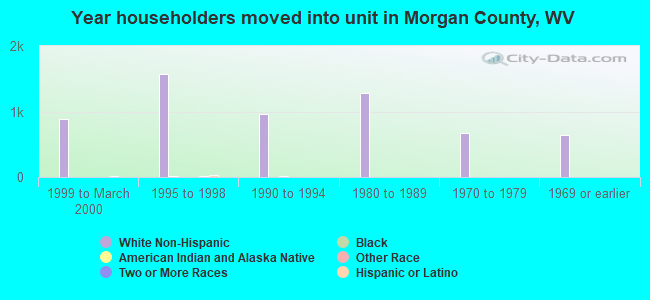
92.5% of Morgan County residents lived in the same house 1 years ago.
Out of people who lived in different houses, 30% lived in this county.
Out of people who lived in different counties, 20% lived in West Virginia.
| Morgan County: | 92.5% |
| State average: | 89.6% |
Place of birth for U.S.-born residents:
- This state: 5,750
- Other state: 11,209
- Northeast: 2,385
- Midwest: 733
- South: 7,388
- West: 717
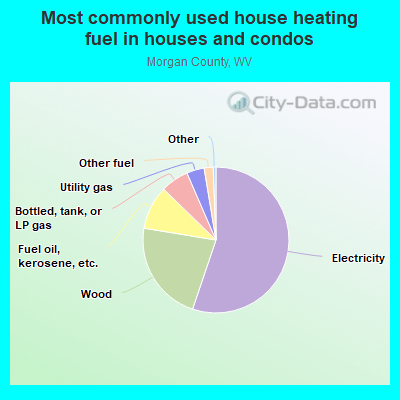
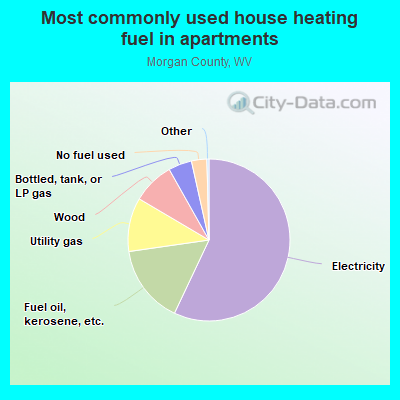
- 58.8%Electricity
- 21.2%Wood
- 9.3%Fuel oil, kerosene, etc.
- 4.9%Bottled, tank, or LP gas
- 3.0%Utility gas
- 1.8%Other fuel
- 0.6%No fuel used
- 0.4%Coal or coke
- 56.5%Electricity
- 18.8%Fuel oil, kerosene, etc.
- 9.9%Wood
- 8.2%Utility gas
- 4.0%Bottled, tank, or LP gas
- 2.5%No fuel used
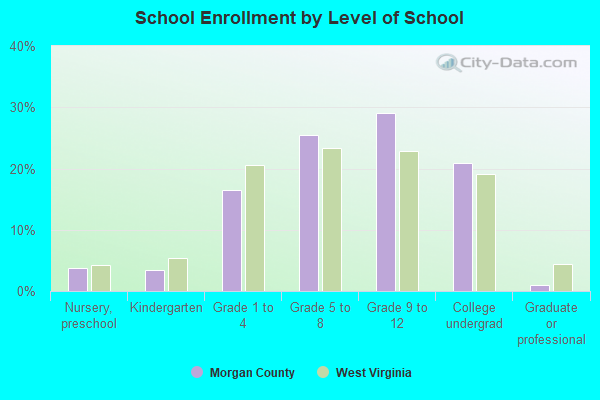
Private vs. public school enrollment:
| Here: | 13.2% |
| West Virginia: | 12.2% |
| Here: | 8.7% |
| West Virginia: | 8.8% |
| Here: | 40.5% |
| West Virginia: | 17.3% |
Morgan County government finances - Expenditure in 2018:
- Charges - Other: $3,323,000
Other: $2,908,000
- Construction - General - Other: $1,186,000
General - Other: $50,000
- Current Operations - Central Staff Services: $4,777,000
Police Protection: $4,379,000
Police Protection: $2,895,000
Central Staff Services: $2,094,000
Financial Administration: $1,190,000
Financial Administration: $1,145,000
General Public Buildings: $756,000
Judicial and Legal Services: $539,000
Local Fire Protection: $536,000
Parks and Recreation: $315,000
Health - Other: $285,000
Parks and Recreation: $181,000
Solid Waste Management: $40,000
Solid Waste Management: $35,000
- Federal Intergovernmental - Other: $204,000
- General - Interest on Debt: $146,000
- Long Term Debt - Beginning Outstanding - Unspecified Public Purpose: $5,489,000
Outstanding Unspecified Public Purpose: $5,274,000
Beginning Outstanding - Unspecified Public Purpose: $3,645,000
Outstanding Unspecified Public Purpose: $3,178,000
Retired Unspecified Public Purpose: $1,000,000
Issue, Unspecified Public Purpose: $785,000
Retired Unspecified Public Purpose: $467,000
- Miscellaneous - General Revenue - Other: $431,000
Fines and Forfeits: $267,000
Fines and Forfeits: $238,000
General Revenue - Other: $100,000
Donations From Private Sources: $95,000
Interest Earnings: $7,000
Interest Earnings: $4,000
- Other Funds - Cash and Securities: $3,533,000
Cash and Securities: $3,299,000
- State Intergovernmental - Other: $222,000
Health and Hospitals: $183,000
Health and Hospitals: $182,000
General Local Government Support: $90,000
- Tax - Property: $4,053,000
Property: $3,939,000
Other Selective Sales: $912,000
Other Selective Sales: $761,000
Alcoholic Beverage Sales: $54,000
Other License: $45,000
Other License: $35,000
Alcoholic Beverage Sales: $15,000
- Total Salaries and Wages: $2,700,000
Morgan County government finances - Revenue in 2018:
- Charges - Other: $3,323,000
Other: $2,908,000
- Construction - General - Other: $1,186,000
General - Other: $50,000
- Current Operations - Central Staff Services: $4,777,000
Police Protection: $4,379,000
Police Protection: $2,895,000
Central Staff Services: $2,094,000
Financial Administration: $1,190,000
Financial Administration: $1,145,000
General Public Buildings: $756,000
Judicial and Legal Services: $539,000
Local Fire Protection: $536,000
Parks and Recreation: $315,000
Health - Other: $285,000
Parks and Recreation: $181,000
Solid Waste Management: $40,000
Solid Waste Management: $35,000
- Federal Intergovernmental - Other: $204,000
- General - Interest on Debt: $146,000
- Long Term Debt - Beginning Outstanding - Unspecified Public Purpose: $5,489,000
Outstanding Unspecified Public Purpose: $5,274,000
Beginning Outstanding - Unspecified Public Purpose: $3,645,000
Outstanding Unspecified Public Purpose: $3,178,000
Retired Unspecified Public Purpose: $1,000,000
Issue, Unspecified Public Purpose: $785,000
Retired Unspecified Public Purpose: $467,000
- Miscellaneous - General Revenue - Other: $431,000
Fines and Forfeits: $267,000
Fines and Forfeits: $238,000
General Revenue - Other: $100,000
Donations From Private Sources: $95,000
Interest Earnings: $7,000
Interest Earnings: $4,000
- Other Funds - Cash and Securities: $3,533,000
Cash and Securities: $3,299,000
- State Intergovernmental - Other: $222,000
Health and Hospitals: $183,000
Health and Hospitals: $182,000
General Local Government Support: $90,000
- Tax - Property: $4,053,000
Property: $3,939,000
Other Selective Sales: $912,000
Other Selective Sales: $761,000
Alcoholic Beverage Sales: $54,000
Other License: $45,000
Other License: $35,000
Alcoholic Beverage Sales: $15,000
- Total Salaries and Wages: $2,700,000
Morgan County government finances - Debt in 2018:
- Charges - Other: $3,323,000
Other: $2,908,000
- Construction - General - Other: $1,186,000
General - Other: $50,000
- Current Operations - Central Staff Services: $4,777,000
Police Protection: $4,379,000
Police Protection: $2,895,000
Central Staff Services: $2,094,000
Financial Administration: $1,190,000
Financial Administration: $1,145,000
General Public Buildings: $756,000
Judicial and Legal Services: $539,000
Local Fire Protection: $536,000
Parks and Recreation: $315,000
Health - Other: $285,000
Parks and Recreation: $181,000
Solid Waste Management: $40,000
Solid Waste Management: $35,000
- Federal Intergovernmental - Other: $204,000
- General - Interest on Debt: $146,000
- Long Term Debt - Beginning Outstanding - Unspecified Public Purpose: $5,489,000
Outstanding Unspecified Public Purpose: $5,274,000
Beginning Outstanding - Unspecified Public Purpose: $3,645,000
Outstanding Unspecified Public Purpose: $3,178,000
Retired Unspecified Public Purpose: $1,000,000
Issue, Unspecified Public Purpose: $785,000
Retired Unspecified Public Purpose: $467,000
- Miscellaneous - General Revenue - Other: $431,000
Fines and Forfeits: $267,000
Fines and Forfeits: $238,000
General Revenue - Other: $100,000
Donations From Private Sources: $95,000
Interest Earnings: $7,000
Interest Earnings: $4,000
- Other Funds - Cash and Securities: $3,533,000
Cash and Securities: $3,299,000
- State Intergovernmental - Other: $222,000
Health and Hospitals: $183,000
Health and Hospitals: $182,000
General Local Government Support: $90,000
- Tax - Property: $4,053,000
Property: $3,939,000
Other Selective Sales: $912,000
Other Selective Sales: $761,000
Alcoholic Beverage Sales: $54,000
Other License: $45,000
Other License: $35,000
Alcoholic Beverage Sales: $15,000
- Total Salaries and Wages: $2,700,000
Morgan County government finances - Cash and Securities in 2018:
- Charges - Other: $3,323,000
Other: $2,908,000
- Construction - General - Other: $1,186,000
General - Other: $50,000
- Current Operations - Central Staff Services: $4,777,000
Police Protection: $4,379,000
Police Protection: $2,895,000
Central Staff Services: $2,094,000
Financial Administration: $1,190,000
Financial Administration: $1,145,000
General Public Buildings: $756,000
Judicial and Legal Services: $539,000
Local Fire Protection: $536,000
Parks and Recreation: $315,000
Health - Other: $285,000
Parks and Recreation: $181,000
Solid Waste Management: $40,000
Solid Waste Management: $35,000
- Federal Intergovernmental - Other: $204,000
- General - Interest on Debt: $146,000
- Long Term Debt - Beginning Outstanding - Unspecified Public Purpose: $5,489,000
Outstanding Unspecified Public Purpose: $5,274,000
Beginning Outstanding - Unspecified Public Purpose: $3,645,000
Outstanding Unspecified Public Purpose: $3,178,000
Retired Unspecified Public Purpose: $1,000,000
Issue, Unspecified Public Purpose: $785,000
Retired Unspecified Public Purpose: $467,000
- Miscellaneous - General Revenue - Other: $431,000
Fines and Forfeits: $267,000
Fines and Forfeits: $238,000
General Revenue - Other: $100,000
Donations From Private Sources: $95,000
Interest Earnings: $7,000
Interest Earnings: $4,000
- Other Funds - Cash and Securities: $3,533,000
Cash and Securities: $3,299,000
- State Intergovernmental - Other: $222,000
Health and Hospitals: $183,000
Health and Hospitals: $182,000
General Local Government Support: $90,000
- Tax - Property: $4,053,000
Property: $3,939,000
Other Selective Sales: $912,000
Other Selective Sales: $761,000
Alcoholic Beverage Sales: $54,000
Other License: $45,000
Other License: $35,000
Alcoholic Beverage Sales: $15,000
- Total Salaries and Wages: $2,700,000
Supplemental Security Income (SSI) in 2006:
- Total number of recipients: 303
- Number of aged recipients: 34
- Number of blind and disabled recipients: 269
- Number of recipients under 18: 45
- Number of recipients between 18 and 64: 193
- Number of recipients older than 64: 65
- Number of recipients also receiving OASDI: 118
- Amount of payments (thousands of dollars): 129
| Most common first names in Morgan County, WV among deceased individuals | ||
| Name | Count | Lived (average) |
|---|---|---|
| Charles | 21 | 70.1 years |
| Mary | 20 | 78.1 years |
| James | 16 | 67.0 years |
| John | 16 | 74.4 years |
| Robert | 15 | 68.7 years |
| Edward | 10 | 76.5 years |
| William | 9 | 64.2 years |
| Margaret | 8 | 76.3 years |
| Harry | 7 | 71.9 years |
| Clarence | 6 | 74.7 years |
| Most common last names in Morgan County, WV among deceased individuals | ||
| Last name | Count | Lived (average) |
|---|---|---|
| Kidwell | 20 | 74.6 years |
| Miller | 17 | 71.9 years |
| Moreland | 16 | 76.3 years |
| Smith | 10 | 72.3 years |
| Robertson | 9 | 76.4 years |
| Whitacre | 9 | 77.0 years |
| Crouse | 8 | 79.0 years |
| Kerns | 8 | 70.7 years |
| Eaton | 7 | 76.5 years |
| Spencer | 7 | 73.2 years |
| Businesses in Morgan County, WV | ||||
| Name | Count | Name | Count | |
|---|---|---|---|---|
| 7-Eleven | 1 | MasterBrand Cabinets | 2 | |
| Ace Hardware | 1 | McDonald's | 1 | |
| Advance Auto Parts | 1 | Rite Aid | 1 | |
| Best Western | 1 | Sprint Nextel | 1 | |
| Dairy Queen | 1 | Subway | 1 | |
| GNC | 1 | U-Haul | 2 | |
| H&R Block | 1 | UPS | 1 | |
| La-Z-Boy | 1 | |||
Morgan County on our top lists:
- #25 on the list of "Top 101 counties with the lowest surface withdrawal of fresh water for public supply"