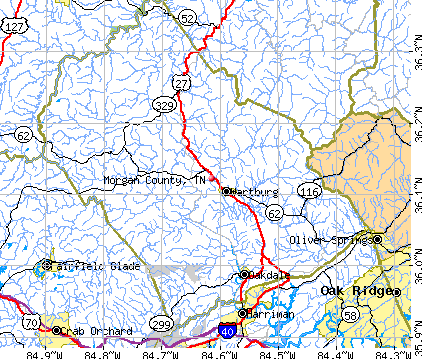
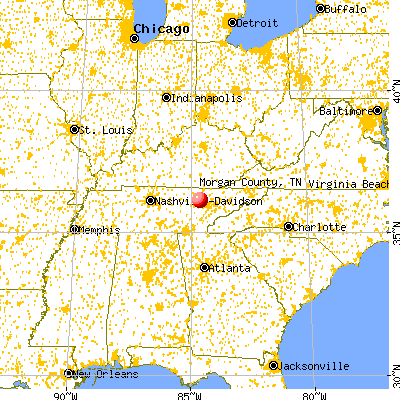
Morgan County, Tennessee (TN)
County owner-occupied free and clear houses and condos in 2010: 2,872
County owner-occupied houses and condos in 2000: 5,791
Renter-occupied apartments: 1,661 (it was 1,199 in 2000)
| % of renters here: | 17% |
| State: | 32% |
Land area: 522 sq. mi.
Water area: 0.4 sq. mi.
Population density: 41 people per square mile (average).
Industries providing employment: Educational, health and social services (21.2%), Construction (11.6%), Manufacturing (11.1%), Professional, scientific, management, administrative, and waste management services (10.6%), Retail trade (10.0%).
Type of workers:
- Private wage or salary: 71%
- Government: 22%
- Self-employed, not incorporated: 6%
- Unpaid family work: 0%
- OSM Map
- General Map
- Google Map
- MSN Map

- 19,28289.8%White Non-Hispanic Alone
- 9784.6%Black Non-Hispanic Alone
- 7593.5%Two or more races
- 3721.7%Hispanic or Latino
- 420.2%American Indian and Alaska Native alone
- 370.2%Asian alone
- 120.06%Native Hawaiian and Other
Pacific Islander alone

| Median resident age: | 41.9 years |
| Tennessee median age: | 39.2 years |
| Males: 11,789 | |
| Females: 9,724 |

 | Septic tank in Morgan County (8 replies) |
| COVID-19 in Tennessee (237 replies) |
| Snow Plowing Needed,Morgan County,TN (1 reply) |
| Input from locals request (6 replies) |
| Tennessee Population Estimates 2016 (28 replies) |
| Hill\Mountian Folks (62 replies) |
| Morgan County: | 2.0 people |
| Tennessee: | 2 people |
Estimated median household income in 2022: $52,960 ($27,712 in 1999)
| This county: | $52,960 |
| Tennessee: | $65,254 |
Median contract rent in 2022 for apartments: $569 (lower quartile is $458, upper quartile is $678)
| This county: | $569 |
| State: | $884 |
Estimated median house or condo value in 2022: $163,199 (it was $56,000 in 2000)
| Morgan: | $163,199 |
| Tennessee: | $284,800 |
Median monthly housing costs for homes and condos with a mortgage: $1,139
Median monthly housing costs for units without a mortgage: $384
Institutionalized population: 2,518
Crime in 2021 (reported by the sheriff's office or county police, not the county total):
- Murders: 1
- Rapes: 0
- Robberies: 0
- Assaults: 45
- Burglaries: 21
- Thefts: 138
- Auto thefts: 37
Crime in 2020 (reported by the sheriff's office or county police, not the county total):
- Murders: 1
- Rapes: 1
- Robberies: 0
- Assaults: 62
- Burglaries: 62
- Thefts: 105
- Auto thefts: 43
Single-family new house construction building permits:
- 2022: 0 buildings
- 2021: 0 buildings
- 2020: 0 buildings
- 2019: 0 buildings
- 2018: 0 buildings
- 2017: 0 buildings
- 2016: 0 buildings
- 2015: 0 buildings
- 2014: 0 buildings
- 2013: 1 building, cost: $192,600
- 2012: 0 buildings
- 2011: 2 buildings, average cost: $101,500
- 2010: 2 buildings, average cost: $89,000
- 2009: 0 buildings
- 2008: 0 buildings
- 2007: 0 buildings
- 2006: 0 buildings
- 2005: 1 building, cost: $149,000
- 2004: 0 buildings
- 2003: 0 buildings
- 2002: 19 buildings, average cost: $53,300
- 2001: 0 buildings
- 2000: 1 building, cost: $55,000
- 1999: 1 building, cost: $100,000
- 1998: 0 buildings
- 1997: 0 buildings


Median real estate property taxes paid for housing units with mortgages in 2022: $909 (0.5%)
Median real estate property taxes paid for housing units with no mortgage in 2022: $786 (0.5%)


| Morgan County: | 19.9% |
| Tennessee: | 13.3% |
Median age of residents in 2022: 41.9 years old
(Males: 40.1 years old, Females: 45.0 years old)
(Median age for: White residents: 43.4 years old, Black residents: 37.1 years old, American Indian residents: 44.1 years old, Asian residents: 23.2 years old, Hispanic or Latino residents: 28.7 years old, Other race residents: 31.1 years old)
Fair market rent in 2006 for a 1-bedroom apartment in Morgan County is $380 a month.
Fair market rent for a 2-bedroom apartment is $460 a month.
Fair market rent for a 3-bedroom apartment is $575 a month.
Cities in this county include: Coalfield, Lancing, Wartburg, Petros, Sunbright, Oakdale.
Notable locations in this county outside city limits:
Notable locations in Morgan County: Whiteoak Boat Dock (A), Cane Creek Dock (B), Southernaire Resort (C), Southernaire Dock (D), Houston County Fire Department Tennessee Ridge Station (E), Tennessee Department of Agriculture Division of Forestry Erin Fire Tower (F), Houston County Fire Department Erin Station (G). Display/hide their locations on the map
Churches in Morgan County include: Mount Sinai Church (A), Lockart Chapel (B), Steels Chapel (C), Dortch Chapel (D), Lewis Branch Church (E), Salmon Branch Church (F), Spring Hill Church (G), New Hope Church (H), Griffin Chapel (I). Display/hide their locations on the map
Cemeteries: Sykes Cemetery (1), Vanhook Cemetery (2), Jones Cemetery (3), Keel Cemetery (4), Moore Cemetery (5), Shelton Cemetery (6), Knight Cemetery (7). Display/hide their locations on the map
Streams, rivers, and creeks: Long Branch (A), Lewis Branch (B), Leatherwood Creek (C), Jordan Branch (D), Whiteoak Creek (E), Indian Branch (F), Hurricane Creek (G), Half Branch (H), Frank Branch (I). Display/hide their locations on the map
Neighboring counties: Hamblen County  , Houston County
  , Payne County, Oklahoma , Danville city, Virginia , Galax city, Virginia .
| Here: | 3.5% |
| Tennessee: | 3.0% |


Current college students: 556
People 25 years of age or older with a high school degree or higher: 81.4%
People 25 years of age or older with a bachelor's degree or higher: 12.5%
Number of foreign born residents: 134 (29.2% naturalized citizens)
| Morgan County: | 0.6% |
| Whole state: | 5.6% |

- Year of entry for the foreign-born population
- 222010 or later
- 432000 to 2009
- 361990 to 1999
- 131980 to 1989
- 331970 to 1979
- 28Before 1970
Mean travel time to work (commute): minutes
Percentage of county residents living and working in this county: 98.1%
Housing units in structures:
- One, detached: 6,223
- One, attached: 13
- Two: 49
- 3 or 4: 54
- 5 to 9: 123
- 10 to 19: 19
- 50 or more: 2
- Mobile homes: 2,209
- Boats, RVs, vans, etc.: 17
Housing units in Morgan County with a mortgage: 2,735 (262 second mortgage, 23 home equity loan, 115 both second mortgage and home equity loan)
Houses without a mortgage: 35
| Here: | 5.4% with mortgage |
| State: | 97.8% with mortgage |
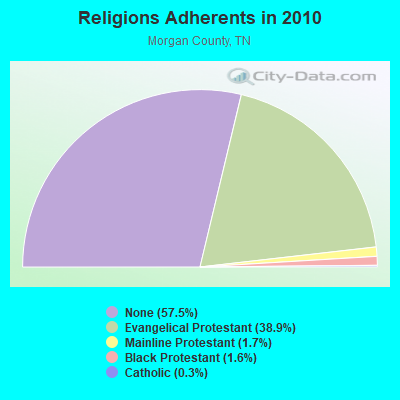
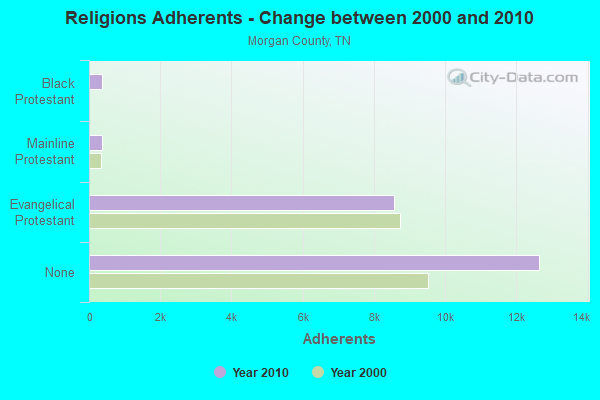
Religion statistics for Morgan County
| Religion | Adherents | Congregations |
|---|---|---|
| Evangelical Protestant | 8,556 | 32 |
| Mainline Protestant | 369 | 8 |
| Black Protestant | 357 | 2 |
| Catholic | 56 | 1 |
| Other | 1 | 1 |
| None | 12,648 | - |
Source: Clifford Grammich, Kirk Hadaway, Richard Houseal, Dale E.Jones, Alexei Krindatch, Richie Stanley and Richard H.Taylor. 2012. 2010 U.S.Religion Census: Religious Congregations & Membership Study. Association of Statisticians of American Religious Bodies. Jones, Dale E., et al. 2002. Congregations and Membership in the United States 2000. Nashville, TN: Glenmary Research Center.
Food Environment Statistics:
| Morgan County: | 2.46 / 10,000 pop. |
| State: | 1.99 / 10,000 pop. |
| This county: | 0.98 / 10,000 pop. |
| Tennessee: | 0.65 / 10,000 pop. |
| Morgan County: | 5.41 / 10,000 pop. |
| Tennessee: | 5.16 / 10,000 pop. |
| This county: | 1.97 / 10,000 pop. |
| State: | 6.56 / 10,000 pop. |
| Morgan County: | 11.3% |
| Tennessee: | 11.4% |
| Morgan County: | 29.2% |
| State: | 30.2% |
| Here: | 14.0% |
| State: | 13.5% |
Agriculture in Morgan County:
Average size of farms: 140 acresAverage value of agricultural products sold per farm: $25,193
Average value of crops sold per acre for harvested cropland: $72.65
The value of nursery, greenhouse, floriculture, and sod as a percentage of the total market value of agricultural products sold: 1.59%
The value of livestock, poultry, and their products as a percentage of the total market value of agricultural products sold: 90.80%
Average total farm production expenses per farm: $23,177
Harvested cropland as a percentage of land in farms: 22.71%
Irrigated harvested cropland as a percentage of land in farms: 0.07%
Average market value of all machinery and equipment per farm: $66,303
The percentage of farms operated by a family or individual: 92.56%
Average age of principal farm operators: 52 years
Average number of cattle and calves per 100 acres of all land in farms: 17.82
Milk cows as a percentage of all cattle and calves: 2.67%
Corn for grain: 166 harvested acres
Soybeans for beans: 74 harvested acres
Vegetables: 134 harvested acres
Land in orchards: 20 acres
Tornado activity:
Morgan County historical area-adjusted tornado activity is significantly below Tennessee state average. It is 7390920.1 times below overall U.S. average.Earthquake activity:
Morgan County-area historical earthquake activity is significantly above Tennessee state average. It is 101% greater than the overall U.S. average.On 7/27/1980 at 18:52:21, a magnitude 5.2 (5.1 MB, 4.7 MS, 5.0 UK, 5.2 UK, Class: Moderate, Intensity: VI - VII) earthquake occurred 148.8 miles away from Morgan County center
On 11/30/1973 at 07:48:41, a magnitude 4.7 (4.7 MB, 4.6 ML, Class: Light, Intensity: IV - V) earthquake occurred 42.8 miles away from the county center
On 4/29/2003 at 08:59:39, a magnitude 4.9 (4.4 MB, 4.6 MW, 4.9 LG) earthquake occurred 126.2 miles away from the county center
On 12/12/2018 at 09:14:43, a magnitude 4.4 (4.4 MW, Depth: 4.9 mi) earthquake occurred 35.8 miles away from the county center
On 4/18/2008 at 09:36:59, a magnitude 5.4 (5.1 MB, 4.8 MS, 5.4 MW, 5.2 MW) earthquake occurred 241.6 miles away from Morgan County center
On 8/9/2020 at 12:07:37, a magnitude 5.1 (5.1 MW, Depth: 4.7 mi) earthquake occurred 197.8 miles away from the county center
Magnitude types: regional Lg-wave magnitude (LG), body-wave magnitude (MB), local magnitude (ML), surface-wave magnitude (MS), moment magnitude (MW)
Most recent natural disasters:
- Tennessee Covid-19 Pandemic, Incident Period: January 20, 2020, FEMA Id: 4514, Natural disaster type: Other
- Tennessee Severe Storms, Flooding, Landslides, And Mudslides, Incident Period: February 19, 2019 - March 30, 2019, FEMA Id: 4427, Natural disaster type: Storm, Mudslide, Landslide, Flood
- Tennessee Severe Storms, Straight-line Winds, And Flooding, Incident Period: May 27, 2017 - May 28, 2017, FEMA Id: 4320, Natural disaster type: Storm, Flood, Wind
- Tennessee Severe Winter Storm and Flooding, Incident Period: February 15, 2015 to February 23, 2015, Major Disaster (Presidential) Declared DR-4211: April 02, 2015, FEMA Id: 4211, Natural disaster type: Winter Storm, Flood
- Tennessee Severe Storms, Tornadoes, and Flooding, Incident Period: February 28, 2011 to March 01, 2011, Major Disaster (Presidential) Declared DR-1965: March 31, 2011, FEMA Id: 1965, Natural disaster type: Storm, Tornado, Flood
- Tennessee Hurricane Katrina Evacuation, Incident Period: August 29, 2005 to October 01, 2005, Emergency Declared EM-3217: September 05, 2005, FEMA Id: 3217, Natural disaster type: Hurricane
- Tennessee Severe Storms, Tornadoes and Flooding, Incident Period: May 04, 2003 to May 30, 2003, Major Disaster (Presidential) Declared DR-1464: May 08, 2003, FEMA Id: 1464, Natural disaster type: Storm, Tornado, Flood
- Tennessee Severe Storms, Tornadoes and Flooding, Incident Period: November 09, 2002 to November 12, 2002, Major Disaster (Presidential) Declared DR-1441: November 13, 2002, FEMA Id: 1441, Natural disaster type: Storm, Tornado, Flood
- Tennessee Winter Storm, Incident Period: December 23, 1998 to December 29, 1998, Major Disaster (Presidential) Declared DR-1260: January 15, 1999, FEMA Id: 1260, Natural disaster type: Winter Storm
- Tennessee Severe Storms, Tornadoes and Flooding, Incident Period: April 16, 1998 to May 18, 1998, Major Disaster (Presidential) Declared DR-1215: April 20, 1998, FEMA Id: 1215, Natural disaster type: Storm, Tornado, Flood
- 6 other natural disasters have been reported since 1953.
The number of natural disasters in Morgan County (16) is near the US average (15).
Major Disasters (Presidential) Declared: 11
Emergencies Declared: 2
Causes of natural disasters: Floods: 11, Storms: 10, Tornadoes: 4, Winter Storms: 4, Flash Flood: 1, Hurricane: 1, Ice Storm: 1, Landslide: 1, Mudslide: 1, Snowfall: 1, Wind: 1, Other: 1 (Note: some incidents may be assigned to more than one category).

Means of transportation to work:
- Drove a car alone: 3,505 (76.9%)
- Carpooled: 483 (10.6%)
- Walked: 59 (1.3%)
- Worked at home: 463 (10.2%)


- Health care and social assistance (18%)
- Retail trade (10%)
- Accommodation and food services (9%)
- Educational services (8%)
- Finance and insurance (5%)
- Professional, scientific, and technical services (5%)
- Public administration (5%)

- Health care and social assistance (25%)
- Retail trade (14%)
- Accommodation and food services (12%)
- Educational services (11%)
- Finance and insurance (7%)
- Professional, scientific, and technical services (7%)
- Public administration (7%)

- Construction and extraction occupations (15%)
- Production occupations (13%)
- Installation, maintenance, and repair occupations (11%)
- Management occupations (10%)
- Law enforcement workers including supervisors (7%)
- Material moving occupations (6%)
- Transportation occupations (6%)

- Office and administrative support occupations (19%)
- Sales and related occupations (10%)
- Health diagnosing and treating practitioners and other technical occupations (9%)
- Educational instruction, and library occupations (9%)
- Business and financial operations occupations (8%)
- Health technologists and technicians (8%)
- Management occupations (8%)

- Mexico (43%)
- England (19%)
- Canada (10%)
- United Kingdom, excluding England and Scotland (9%)
- Brazil (6%)
- Japan (4%)
- Dominican Republic (1%)

- English (22%)
- American (19%)
- Irish (14%)
- German (11%)
- Scotch-Irish (6%)
- Pennsylvania German (3%)
- Scottish (2%)


People in group quarters in Morgan County, Tennessee in 2010:
- 2,345 people in state prisons
- 105 people in nursing facilities/skilled-nursing facilities
- 49 people in correctional residential facilities
- 11 people in group homes for juveniles (non-correctional)
- 9 people in workers' group living quarters and job corps centers
- 8 people in residential treatment centers for juveniles (non-correctional)
People in group quarters in Morgan County, Tennessee in 2000:
- 1,536 people in state prisons
- 114 people in nursing homes
- 53 people in training schools for juvenile delinquents
- 13 people in homes for abused, dependent, and neglected children
- 7 people in local jails and other confinement facilities (including police lockups)
10.33% of this county's 2021 resident taxpayers lived in other counties in 2020 ($39,968 average adjusted gross income)
| Here: | 10.33% |
| Tennessee average: | 8.49% |
10 or fewer of this county's residents moved from foreign countries.
7.01% relocated from other counties in Tennessee ($23,838 average AGI)
3.32% relocated from other states ($16,130 average AGI)
Morgan County: 3.32% Tennessee average: 4.34%

Top counties from which taxpayers relocated into this county between 2020 and 2021:
| from Roane County, TN | |
| from Anderson County, TN | |
| from Knox County, TN | |
| from Blount County, TN |
6.90% of this county's 2020 resident taxpayers moved to other counties in 2021 ($40,923 average adjusted gross income)
| Here: | 6.90% |
| Tennessee average: | 7.40% |
10 or fewer of this county's residents moved to foreign countries.
5.73% relocated to other counties in Tennessee ($33,556 average AGI)
1.18% relocated to other states ($7,370 average AGI)
Morgan County: 1.18% Tennessee average: 3.20%

Top counties to which taxpayers relocated from this county between 2020 and 2021:
| to Roane County, TN | |
| to Anderson County, TN | |
| to Knox County, TN | |
| to Cumberland County, TN | |
| to Scott County, TN |
Births per 1000 population from 1990 to 1999: 12.1
Births per 1000 population from 2000 to 2006: 11.1

Deaths per 1000 population from 1990 to 1999: 9.4
Deaths per 1000 population from 2000 to 2009: 9.5
Deaths per 1000 population from 2010 to 2020: 11.2

Infant deaths per 1000 live births from 1990 to 1999: 10.2
Infant deaths per 1000 live births from 2000 to 2006: 7.8

Persons under 19 years old without health insurance coverage in 2018: 5.8%


Persons enrolled in hospital insurance and/or supplemental medical insurance (Medicare) in July 1, 2007: 4,071 (2,773 aged, 1,298 disabled)
Children under 18 without health insurance coverage in 2007: 425 (10%)


Most common underlying causes of death in Morgan County, Tennessee in 1999 - 2019:
- Acute myocardial infarction, unspecified (383)
- Bronchus or lung, unspecified - Malignant neoplasms (355)
- Chronic obstructive pulmonary disease, unspecified (244)
- Atherosclerotic heart disease (181)
- Alzheimer disease, unspecified (136)
- Unspecified dementia (37)
- Atherosclerotic cardiovascular disease, so described (10)
Population without health insurance coverage in 2000: 13%
Children under 18 without health insurance coverage in 2000: 7%
Medical specialist MDs per 100,000 population in 2005: 992
Total births per 100,000 population, July 2005 - July 2006 : 16
Total deaths per 100,000 population, July 2005 - July 2006: 25
Crimes per 100,000 population in 1996: 1
Suicides per 1,000,000 population from 2000 to 2006: 159.0. This is more than state average.
Household type by relationship:
Households: 21,513- Male householders: 3,511 (858 living alone), Female householders: 3,929 (1,112 living alone)
3,945 spouses (3,935 opposite-sex spouses), 436 unmarried partners, (436 opposite-sex unmarried partners), 4,927 children (4,384 natural, 298 adopted, 247 stepchildren), 1,085 grandchildren, 119 brothers or sisters, 202 parents, 58 foster children, 373 other relatives, 583 non-relatives
- In group quarters: 2,172
Size of family households: 2,532 2-persons, 1,144 3-persons, 805 4-persons, 444 5-persons, 121 6-persons, 118 7-or-more-persons.
Size of nonfamily households: 1,973 1-person, 222 2-persons, 14 3-persons, 58 4-persons, 6 5-persons.
1,929 married couples with children.
1,039 single-parent households (400 men, 639 women).
95.9% of residents of Morgan speak English at home.
1.9% of residents speak Spanish at home (88% speak English very well, 9% speak English well, 3% speak English not well).
1.8% of residents speak other Indo-European language at home (97% speak English very well, 3% speak English well).
0.2% of residents speak other language at home (100% speak English very well).
In fiscal year 2004:
Federal Government expenditure: $103,710,000 ($5,152 per capita)
Department of Defense expenditure: $1,641,000
Federal direct payments to individuals for retirement and disability: $44,630,000
Federal other direct payments to individuals: $24,192,000
Federal direct payments not to individuals: $288,000
Federal grants: $31,074,000
Federal procurement contracts: $1,086,000 ($153,000 Department of Defense)
Federal salaries and wages: $2,439,000 ($0,000 Department of Defense)
Federal Government direct loans: $105,000
Federal guaranteed/insured loans: $2,184,000
Federal Government insurance: $509,000
Population change from April 1, 2000 to July 1, 2005:
Births: 1,143| Here: | 57 per 1000 residents |
| State: | 69 per 1000 residents |
Deaths: 959
| Here: | 48 per 1000 residents |
| State: | 50 per 1000 residents |
Net international migration: 0
| Here: | 0 per 1000 residents |
| State: | +8 per 1000 residents |
Net internal migration: +242
| Here: | +12 per 1000 residents |
| State: | +18 per 1000 residents |

Total withdrawal of fresh water for public supply: 1.05 millions of gallons per day (all from surface)
| Here: | 6.0 |
| State: | 6.5 |
| Here: | 5.2 |
| State: | 4.4 |

- Year house built in Morgan County, Tennessee
- 502020 or later
- 1,0832010 to 2019
- 1,1152000 to 2009
- 1,4841990 to 1999
- 1,3231980 to 1989
- 1,2891970 to 1979
- 5921960 to 1969
- 7301950 to 1959
- 2991940 to 1949
- 6311939 or earlier

- Rooms in owner-occupied houses in Morgan County, Tennessee
- 01 room
- 162 rooms
- 1863 rooms
- 5234 rooms
- 1,5355 rooms
- 1,5326 rooms
- 7267 rooms
- 7548 rooms
- 7979+ rooms

- Rooms in renter-occupied apartments in Morgan County, Tennessee
- 31 room
- 232 rooms
- 1233 rooms
- 2994 rooms
- 3035 rooms
- 2866 rooms
- 1967 rooms
- 428 rooms
- 839+ rooms

- Bedrooms in owner-occupied houses in Morgan County, Tennessee
- 0no bedroom
- 1521 bedroom
- 1,2612 bedrooms
- 3,4793 bedrooms
- 8594 bedrooms
- 3095+ bedrooms

- Bedrooms in renter-occupied apartments in Morgan County, Tennessee
- 3no bedroom
- 751 bedroom
- 4252 bedrooms
- 7263 bedrooms
- 964 bedrooms
- 215+ bedrooms

- Cars and other vehicles available in Morgan County in owner-occupied houses/condos
- 179no vehicle
- 1,2121 vehicle
- 2,0112 vehicles
- 1,7103 vehicles
- 5274 vehicles
- 4245+ vehicles

- Cars and other vehicles available in Morgan County in renter-occupied apartments
- 136no vehicle
- 6311 vehicle
- 2992 vehicles
- 1743 vehicles
- 844 vehicles
- 635+ vehicles
90.6% of Morgan County residents lived in the same house 1 years ago.
Out of people who lived in different houses, 31% lived in this county.
Out of people who lived in different counties, 80% lived in Tennessee.
| Morgan County: | 90.6% |
| State average: | 87.0% |
Place of birth for U.S.-born residents:
- This state: 15,223
- Other state: 5,931
- Northeast: 863
- Midwest: 1,886
- South: 2,549
- West: 627


- 46.8%Utility gas
- 39.9%Electricity
- 7.4%Bottled, tank, or LP gas
- 5.0%Wood
- 0.4%Other fuel
- 0.3%No fuel used
- 0.2%Fuel oil, kerosene, etc.

- 58.2%Electricity
- 28.2%Utility gas
- 7.1%Wood
- 5.2%Bottled, tank, or LP gas
- 0.8%Other fuel
- 0.5%No fuel used
Private vs. public school enrollment:
| Here: | 9.9% |
| Tennessee: | 15.0% |
| Here: | 15.6% |
| Tennessee: | 16.2% |
| Here: | 8.9% |
| Tennessee: | 23.5% |


Morgan County government finances - Expenditure in 2020:
- Assistance and Subsidies - Public Welfare, Federal Categorical Assistance Programs: $91,000
Public Welfare, Federal Categorical Assistance Programs: $91,000
- Bond Funds - Cash and Securities: $344,000
Cash and Securities: $218,000
- Charges - Other: $2,436,000
Other: $1,895,000
Elementary and Secondary Education - Other: $1,319,000
Elementary and Secondary Education - Other: $1,307,000
Solid Waste Management: $348,000
Solid Waste Management: $271,000
Elementary and Secondary Education School Lunch: $161,000
Elementary and Secondary Education School Lunch: $106,000
Miscellaneous Commercial Activities: $86,000
Miscellaneous Commercial Activities: $67,000
Elementary and Secondary Education School Tuition and Transportation: $9,000
Elementary and Secondary Education School Tuition and Transportation: $8,000
- Current Operations - Elementary and Secondary Education: $28,949,000
Elementary and Secondary Education: $27,816,000
Central Staff Services: $3,117,000
Central Staff Services: $2,950,000
Regular Highways: $2,824,000
Regular Highways: $2,673,000
Police Protection: $2,080,000
Health - Other: $2,079,000
Police Protection: $1,968,000
Health - Other: $1,967,000
General - Other: $1,884,000
General - Other: $1,783,000
Correctional Institutions: $1,535,000
Correctional Institutions: $1,453,000
Solid Waste Management: $1,186,000
Solid Waste Management: $1,122,000
Financial Administration: $844,000
Judicial and Legal Services: $834,000
Financial Administration: $799,000
Judicial and Legal Services: $789,000
Parks and Recreation: $479,000
General Public Buildings: $454,000
General Public Buildings: $429,000
Local Fire Protection: $140,000
Local Fire Protection: $132,000
Natural Resources - Other: $110,000
Natural Resources - Other: $104,000
Libraries: $86,000
Libraries: $82,000
- General - Interest on Debt: $705,000
Interest on Debt: $257,000
- Local Intergovernmental - Public Welfare: $1,458,000
Public Welfare: $1,434,000
Education: $13,000
Education: $13,000
- Long Term Debt - Outstanding Unspecified Public Purpose: $17,844,000
Beginning Outstanding - Unspecified Public Purpose: $17,625,000
Issue, Unspecified Public Purpose: $11,645,000
Retired Unspecified Public Purpose: $11,426,000
Retired Unspecified Public Purpose: $6,418,000
Beginning Outstanding - Unspecified Public Purpose: $6,418,000
- Miscellaneous - General Revenue - Other: $992,000
Fines and Forfeits: $841,000
Fines and Forfeits: $649,000
General Revenue - Other: $551,000
Interest Earnings: $71,000
Donations From Private Sources: $13,000
Interest Earnings: $8,000
- Other Capital Outlay - Elementary and Secondary Education: $812,000
Elementary and Secondary Education: $765,000
- Other Funds - Cash and Securities: $21,479,000
Cash and Securities: $13,614,000
- Short Term Debt Outstanding - Beginning: $303,000
End of Fiscal Year: $128,000
- Sinking Funds - Cash and Securities: $3,664,000
Cash and Securities: $2,322,000
- State Intergovernmental - Public Welfare: $29,044,000
Public Welfare: $26,340,000
Education: $25,560,000
Education: $24,987,000
Highways: $2,853,000
Highways: $2,588,000
- Tax - Property: $10,269,000
Property: $8,982,000
General Sales and Gross Receipts: $1,242,000
General Sales and Gross Receipts: $1,087,000
Alcoholic Beverage Sales: $177,000
Alcoholic Beverage Sales: $155,000
Severance: $38,000
Other License: $1,000
Other License: $1,000
- Total Salaries and Wages: $28,673,000
: $27,538,000
Morgan County government finances - Revenue in 2020:
- Assistance and Subsidies - Public Welfare, Federal Categorical Assistance Programs: $91,000
Public Welfare, Federal Categorical Assistance Programs: $91,000
- Bond Funds - Cash and Securities: $344,000
Cash and Securities: $218,000
- Charges - Other: $2,436,000
Other: $1,895,000
Elementary and Secondary Education - Other: $1,319,000
Elementary and Secondary Education - Other: $1,307,000
Solid Waste Management: $348,000
Solid Waste Management: $271,000
Elementary and Secondary Education School Lunch: $161,000
Elementary and Secondary Education School Lunch: $106,000
Miscellaneous Commercial Activities: $86,000
Miscellaneous Commercial Activities: $67,000
Elementary and Secondary Education School Tuition and Transportation: $9,000
Elementary and Secondary Education School Tuition and Transportation: $8,000
- Current Operations - Elementary and Secondary Education: $28,949,000
Elementary and Secondary Education: $27,816,000
Central Staff Services: $3,117,000
Central Staff Services: $2,950,000
Regular Highways: $2,824,000
Regular Highways: $2,673,000
Police Protection: $2,080,000
Health - Other: $2,079,000
Police Protection: $1,968,000
Health - Other: $1,967,000
General - Other: $1,884,000
General - Other: $1,783,000
Correctional Institutions: $1,535,000
Correctional Institutions: $1,453,000
Solid Waste Management: $1,186,000
Solid Waste Management: $1,122,000
Financial Administration: $844,000
Judicial and Legal Services: $834,000
Financial Administration: $799,000
Judicial and Legal Services: $789,000
Parks and Recreation: $479,000
General Public Buildings: $454,000
General Public Buildings: $429,000
Local Fire Protection: $140,000
Local Fire Protection: $132,000
Natural Resources - Other: $110,000
Natural Resources - Other: $104,000
Libraries: $86,000
Libraries: $82,000
- General - Interest on Debt: $705,000
Interest on Debt: $257,000
- Local Intergovernmental - Public Welfare: $1,458,000
Public Welfare: $1,434,000
Education: $13,000
Education: $13,000
- Long Term Debt - Outstanding Unspecified Public Purpose: $17,844,000
Beginning Outstanding - Unspecified Public Purpose: $17,625,000
Issue, Unspecified Public Purpose: $11,645,000
Retired Unspecified Public Purpose: $11,426,000
Retired Unspecified Public Purpose: $6,418,000
Beginning Outstanding - Unspecified Public Purpose: $6,418,000
- Miscellaneous - General Revenue - Other: $992,000
Fines and Forfeits: $841,000
Fines and Forfeits: $649,000
General Revenue - Other: $551,000
Interest Earnings: $71,000
Donations From Private Sources: $13,000
Interest Earnings: $8,000
- Other Capital Outlay - Elementary and Secondary Education: $812,000
Elementary and Secondary Education: $765,000
- Other Funds - Cash and Securities: $21,479,000
Cash and Securities: $13,614,000
- Short Term Debt Outstanding - Beginning: $303,000
End of Fiscal Year: $128,000
- Sinking Funds - Cash and Securities: $3,664,000
Cash and Securities: $2,322,000
- State Intergovernmental - Public Welfare: $29,044,000
Public Welfare: $26,340,000
Education: $25,560,000
Education: $24,987,000
Highways: $2,853,000
Highways: $2,588,000
- Tax - Property: $10,269,000
Property: $8,982,000
General Sales and Gross Receipts: $1,242,000
General Sales and Gross Receipts: $1,087,000
Alcoholic Beverage Sales: $177,000
Alcoholic Beverage Sales: $155,000
Severance: $38,000
Other License: $1,000
Other License: $1,000
- Total Salaries and Wages: $28,673,000
: $27,538,000
Morgan County government finances - Debt in 2020:
- Assistance and Subsidies - Public Welfare, Federal Categorical Assistance Programs: $91,000
Public Welfare, Federal Categorical Assistance Programs: $91,000
- Bond Funds - Cash and Securities: $344,000
Cash and Securities: $218,000
- Charges - Other: $2,436,000
Other: $1,895,000
Elementary and Secondary Education - Other: $1,319,000
Elementary and Secondary Education - Other: $1,307,000
Solid Waste Management: $348,000
Solid Waste Management: $271,000
Elementary and Secondary Education School Lunch: $161,000
Elementary and Secondary Education School Lunch: $106,000
Miscellaneous Commercial Activities: $86,000
Miscellaneous Commercial Activities: $67,000
Elementary and Secondary Education School Tuition and Transportation: $9,000
Elementary and Secondary Education School Tuition and Transportation: $8,000
- Current Operations - Elementary and Secondary Education: $28,949,000
Elementary and Secondary Education: $27,816,000
Central Staff Services: $3,117,000
Central Staff Services: $2,950,000
Regular Highways: $2,824,000
Regular Highways: $2,673,000
Police Protection: $2,080,000
Health - Other: $2,079,000
Police Protection: $1,968,000
Health - Other: $1,967,000
General - Other: $1,884,000
General - Other: $1,783,000
Correctional Institutions: $1,535,000
Correctional Institutions: $1,453,000
Solid Waste Management: $1,186,000
Solid Waste Management: $1,122,000
Financial Administration: $844,000
Judicial and Legal Services: $834,000
Financial Administration: $799,000
Judicial and Legal Services: $789,000
Parks and Recreation: $479,000
General Public Buildings: $454,000
General Public Buildings: $429,000
Local Fire Protection: $140,000
Local Fire Protection: $132,000
Natural Resources - Other: $110,000
Natural Resources - Other: $104,000
Libraries: $86,000
Libraries: $82,000
- General - Interest on Debt: $705,000
Interest on Debt: $257,000
- Local Intergovernmental - Public Welfare: $1,458,000
Public Welfare: $1,434,000
Education: $13,000
Education: $13,000
- Long Term Debt - Outstanding Unspecified Public Purpose: $17,844,000
Beginning Outstanding - Unspecified Public Purpose: $17,625,000
Issue, Unspecified Public Purpose: $11,645,000
Retired Unspecified Public Purpose: $11,426,000
Retired Unspecified Public Purpose: $6,418,000
Beginning Outstanding - Unspecified Public Purpose: $6,418,000
- Miscellaneous - General Revenue - Other: $992,000
Fines and Forfeits: $841,000
Fines and Forfeits: $649,000
General Revenue - Other: $551,000
Interest Earnings: $71,000
Donations From Private Sources: $13,000
Interest Earnings: $8,000
- Other Capital Outlay - Elementary and Secondary Education: $812,000
Elementary and Secondary Education: $765,000
- Other Funds - Cash and Securities: $21,479,000
Cash and Securities: $13,614,000
- Short Term Debt Outstanding - Beginning: $303,000
End of Fiscal Year: $128,000
- Sinking Funds - Cash and Securities: $3,664,000
Cash and Securities: $2,322,000
- State Intergovernmental - Public Welfare: $29,044,000
Public Welfare: $26,340,000
Education: $25,560,000
Education: $24,987,000
Highways: $2,853,000
Highways: $2,588,000
- Tax - Property: $10,269,000
Property: $8,982,000
General Sales and Gross Receipts: $1,242,000
General Sales and Gross Receipts: $1,087,000
Alcoholic Beverage Sales: $177,000
Alcoholic Beverage Sales: $155,000
Severance: $38,000
Other License: $1,000
Other License: $1,000
- Total Salaries and Wages: $28,673,000
: $27,538,000
Morgan County government finances - Cash and Securities in 2020:
- Assistance and Subsidies - Public Welfare, Federal Categorical Assistance Programs: $91,000
Public Welfare, Federal Categorical Assistance Programs: $91,000
- Bond Funds - Cash and Securities: $344,000
Cash and Securities: $218,000
- Charges - Other: $2,436,000
Other: $1,895,000
Elementary and Secondary Education - Other: $1,319,000
Elementary and Secondary Education - Other: $1,307,000
Solid Waste Management: $348,000
Solid Waste Management: $271,000
Elementary and Secondary Education School Lunch: $161,000
Elementary and Secondary Education School Lunch: $106,000
Miscellaneous Commercial Activities: $86,000
Miscellaneous Commercial Activities: $67,000
Elementary and Secondary Education School Tuition and Transportation: $9,000
Elementary and Secondary Education School Tuition and Transportation: $8,000
- Current Operations - Elementary and Secondary Education: $28,949,000
Elementary and Secondary Education: $27,816,000
Central Staff Services: $3,117,000
Central Staff Services: $2,950,000
Regular Highways: $2,824,000
Regular Highways: $2,673,000
Police Protection: $2,080,000
Health - Other: $2,079,000
Police Protection: $1,968,000
Health - Other: $1,967,000
General - Other: $1,884,000
General - Other: $1,783,000
Correctional Institutions: $1,535,000
Correctional Institutions: $1,453,000
Solid Waste Management: $1,186,000
Solid Waste Management: $1,122,000
Financial Administration: $844,000
Judicial and Legal Services: $834,000
Financial Administration: $799,000
Judicial and Legal Services: $789,000
Parks and Recreation: $479,000
General Public Buildings: $454,000
General Public Buildings: $429,000
Local Fire Protection: $140,000
Local Fire Protection: $132,000
Natural Resources - Other: $110,000
Natural Resources - Other: $104,000
Libraries: $86,000
Libraries: $82,000
- General - Interest on Debt: $705,000
Interest on Debt: $257,000
- Local Intergovernmental - Public Welfare: $1,458,000
Public Welfare: $1,434,000
Education: $13,000
Education: $13,000
- Long Term Debt - Outstanding Unspecified Public Purpose: $17,844,000
Beginning Outstanding - Unspecified Public Purpose: $17,625,000
Issue, Unspecified Public Purpose: $11,645,000
Retired Unspecified Public Purpose: $11,426,000
Retired Unspecified Public Purpose: $6,418,000
Beginning Outstanding - Unspecified Public Purpose: $6,418,000
- Miscellaneous - General Revenue - Other: $992,000
Fines and Forfeits: $841,000
Fines and Forfeits: $649,000
General Revenue - Other: $551,000
Interest Earnings: $71,000
Donations From Private Sources: $13,000
Interest Earnings: $8,000
- Other Capital Outlay - Elementary and Secondary Education: $812,000
Elementary and Secondary Education: $765,000
- Other Funds - Cash and Securities: $21,479,000
Cash and Securities: $13,614,000
- Short Term Debt Outstanding - Beginning: $303,000
End of Fiscal Year: $128,000
- Sinking Funds - Cash and Securities: $3,664,000
Cash and Securities: $2,322,000
- State Intergovernmental - Public Welfare: $29,044,000
Public Welfare: $26,340,000
Education: $25,560,000
Education: $24,987,000
Highways: $2,853,000
Highways: $2,588,000
- Tax - Property: $10,269,000
Property: $8,982,000
General Sales and Gross Receipts: $1,242,000
General Sales and Gross Receipts: $1,087,000
Alcoholic Beverage Sales: $177,000
Alcoholic Beverage Sales: $155,000
Severance: $38,000
Other License: $1,000
Other License: $1,000
- Total Salaries and Wages: $28,673,000
: $27,538,000
Supplemental Security Income (SSI) in 2006:
- Total number of recipients: 839
- Number of aged recipients: 66
- Number of blind and disabled recipients: 773
- Number of recipients under 18: 72
- Number of recipients between 18 and 64: 580
- Number of recipients older than 64: 187
- Number of recipients also receiving OASDI: 333
- Amount of payments (thousands of dollars): 339
| Most common first names in Morgan County, TN among deceased individuals | ||
| Name | Count | Lived (average) |
|---|---|---|
| James | 60 | 71.0 years |
| John | 59 | 73.2 years |
| William | 53 | 73.7 years |
| Charles | 35 | 71.8 years |
| Mary | 35 | 78.1 years |
| Robert | 34 | 68.5 years |
| Anna | 19 | 77.8 years |
| Ruby | 17 | 77.3 years |
| Roy | 17 | 71.0 years |
| George | 17 | 75.1 years |
| Most common last names in Morgan County, TN among deceased individuals | ||
| Last name | Count | Lived (average) |
|---|---|---|
| Jones | 61 | 76.4 years |
| Hamby | 41 | 74.4 years |
| Davis | 35 | 77.8 years |
| Brown | 29 | 70.5 years |
| Phillips | 25 | 75.0 years |
| Young | 25 | 78.4 years |
| Wilson | 24 | 74.0 years |
| Armes | 23 | 72.3 years |
| Redmon | 22 | 76.8 years |
| Bingham | 22 | 73.4 years |
| Businesses in Morgan County, TN | ||||
| Name | Count | Name | Count | |
|---|---|---|---|---|
| Advance Auto Parts | 1 | Rite Aid | 1 | |
| Ford | 1 | SONIC Drive-In | 1 | |
| GNC | 1 | Subway | 1 | |
| H&R Block | 1 | U.S. Cellular | 1 | |
| Hardee's | 1 | |||
Morgan County on our top lists:
- #82 on the list of "Top 101 counties with the smallest number of people without health insurance coverage in 2000"