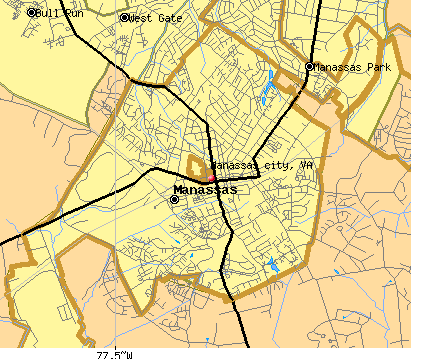
Manassas city, Virginia (VA)
County owner-occupied free and clear houses and condos in 2010: 1,005
County owner-occupied houses and condos in 2000: 8,203
Renter-occupied apartments: 4,484 (it was 3,554 in 2000)
| % of renters here: | 30% |
| State: | 33% |
Land area: 10 sq. mi.
Water area: 0.0 sq. mi.
Population density: 4320 people per square mile (very high).
Industries providing employment: Professional, scientific, management, administrative, and waste management services (19.9%), Educational, health and social services (19.0%), Construction (13.4%).
Type of workers:
- Private wage or salary: 76%
- Government: 20%
- Self-employed, not incorporated: 4%
- Unpaid family work: 0%
- OSM Map
- General Map
- Google Map
- MSN Map

- 17,30539.7%Hispanic or Latino
- 15,86636.4%White Non-Hispanic Alone
- 5,52812.7%Black Non-Hispanic Alone
- 2,6066.0%Asian alone
- 1,9734.5%Two or more races
- 2720.6%Some other race alone
- 460.1%American Indian and Alaska Native alone
- 140.03%Native Hawaiian and Other
Pacific Islander alone

| Median resident age: | 35.4 years |
| Virginia median age: | 39.0 years |
| Males: 21,786 | |
| Females: 21,126 |

 | Is This An Accurate Map of Virginia's Regions? (53 replies) |
| Where is Northern Virginia? (25 replies) |
| Thoughts on Manassas Park, VA (Near Golf Course) (3 replies) |
| Quick: Teach in Manassas or Woodbridge (Prince William) (18 replies) |
| Prince William County vs. Fairfax County for Relocation (31 replies) |
| Moving to Manassas (14 replies) |
| Manassas city: | 3.0 people |
| Virginia: | 3 people |
Estimated median household income in 2022: $108,815 ($60,409 in 1999)
| This county: | $108,815 |
| Virginia: | $85,873 |
Median contract rent in 2022 for apartments: $1,645 (lower quartile is $1,322, upper quartile is $1,934)
| This county: | $1645 |
| State: | $1270 |
Estimated median house or condo value in 2022: $423,924 (it was $148,600 in 2000)
| Manassas city: | $423,924 |
| Virginia: | $365,700 |
Mean price in 2022:
Median monthly housing costs for homes and condos with a mortgage: $2,198Detached houses: $547,516
Here: $547,516 State: $472,865 Townhouses or other attached units: $741,626
Here: $741,626 State: $457,437 In 2-unit structures: $234,558
Here: $234,558 State: $396,289 In 3-to-4-unit structures: $186,980
Here: $186,980 State: $252,346 In 5-or-more-unit structures: $215,066
Here: $215,066 State: $382,551 Mobile homes: $18,509
Here: $18,509 State: $100,736
Median monthly housing costs for units without a mortgage: $758
Institutionalized population: 0
Median real estate property taxes paid for housing units with mortgages in 2022: $4,424 (1.1%)
Median real estate property taxes paid for housing units with no mortgage in 2022: $5,282 (1.2%)


| Manassas city: | 5.0% |
| Virginia: | 10.6% |
Median age of residents in 2022: 35.4 years old
(Males: 34.6 years old, Females: 36.4 years old)
(Median age for: White residents: 43.8 years old, Black residents: 37.0 years old, American Indian residents: 42.0 years old, Asian residents: 42.5 years old, Hispanic or Latino residents: 27.4 years old, Other race residents: 23.6 years old)
Area name: Washington-Arlington-Alexandria, DC-VA-MD HUD Metro FMR Area
Fair market rent in 2006 for a 1-bedroom apartment in Manassas city is $1080 a month.
Fair market rent for a 2-bedroom apartment is $1225 a month.
Fair market rent for a 3-bedroom apartment is $1580 a month.
| Here: | 2.3% |
| Virginia: | 2.7% |

Current college students: 1,916
People 25 years of age or older with a high school degree or higher: 85.8%
People 25 years of age or older with a bachelor's degree or higher: 34.5%
Number of foreign born residents: 12,714 (45.1% naturalized citizens)
| Manassas city: | 29.6% |
| Whole state: | 12.7% |

- Year of entry for the foreign-born population
- 4,9012010 or later
- 3,3832000 to 2009
- 2,2071990 to 1999
- 1,5181980 to 1989
- 4631970 to 1979
- 349Before 1970
Mean travel time to work (commute): ! minutes
Percentage of county residents living and working in this county: 95.0%
Housing units in structures:
- One, detached: 6,306
- One, attached: 4,856
- Two: 87
- 3 or 4: 204
- 5 to 9: 632
- 10 to 19: 1,294
- 20 to 49: 438
- 50 or more: 607
- Mobile homes: 137
Housing units in Manassas city with a mortgage: 8,598 (638 second mortgage, 141 home equity loan, 422 both second mortgage and home equity loan)
Houses without a mortgage: 253
| Here: | 3.1% with mortgage |
| State: | 97.2% with mortgage |
Food Environment Statistics:
| Manassas city: | 3.96 / 10,000 pop. |
| State: | 2.03 / 10,000 pop. |
| This county: | 2.26 / 10,000 pop. |
| Virginia: | 1.43 / 10,000 pop. |
| Manassas city: | 4.81 / 10,000 pop. |
| Virginia: | 4.03 / 10,000 pop. |
| This county: | 11.31 / 10,000 pop. |
| State: | 7.65 / 10,000 pop. |
| Manassas city: | 10.2% |
| Virginia: | 9.3% |
| Manassas city: | 26.2% |
| State: | 26.7% |
Earthquake activity:
Manassas city-area historical earthquake activity is significantly above Virginia state average. It is 54% smaller than the overall U.S. average.On 8/23/2011 at 17:51:04, a magnitude 5.8 (5.8 MW, Depth: 3.7 mi, Class: Moderate, Intensity: VI - VII) earthquake occurred 63.3 miles away from Manassas city center
On 8/25/2011 at 05:07:52, a magnitude 4.5 (4.5 ML, Depth: 4.2 mi, Class: Light, Intensity: IV - V) earthquake occurred 61.7 miles away from the county center
On 12/9/2003 at 20:59:18, a magnitude 4.5 (4.5 ML, Depth: 6.2 mi) earthquake occurred 75.6 miles away from the county center
On 12/9/2003 at 20:59:14, a magnitude 4.5 (4.5 MB, 4.5 LG) earthquake occurred 83.8 miles away from the county center
On 9/25/1998 at 19:52:52, a magnitude 5.2 (4.8 MB, 4.3 MS, 5.2 LG, 4.5 MW, Depth: 3.1 mi) earthquake occurred 244.4 miles away from Manassas city center
On 1/16/1994 at 01:49:16, a magnitude 4.6 (4.6 MB, 4.6 LG, Depth: 3.1 mi) earthquake occurred 133.5 miles away from the county center
Magnitude types: regional Lg-wave magnitude (LG), body-wave magnitude (MB), local magnitude (ML), surface-wave magnitude (MS), moment magnitude (MW)

Means of transportation to work:
- Drove a car alone: 17,629 (71.0%)
- Carpooled: 2,740 (11.0%)
- Bus: 42 (0.2%)
- Subway or elevated rail: 38 (0.2%)
- Long-distance train or commuter rail: 12 (0.0%)
- Taxicab, motorcycle, or other means: 397 (1.6%)
- Bicycle: 122 (0.5%)
- Walked: 516 (2.1%)
- Worked at home: 3,054 (12.3%)


- Health care and social assistance (16%)
- Educational services (10%)
- Professional, scientific, and technical services (8%)
- Public administration (6%)
- Retail trade (6%)
- Other services, except public administration (6%)
- Accommodation and food services (6%)

- Health care and social assistance (20%)
- Educational services (12%)
- Professional, scientific, and technical services (10%)
- Public administration (8%)
- Retail trade (8%)
- Other services, except public administration (8%)
- Accommodation and food services (7%)

- Construction and extraction occupations (17%)
- Management occupations (13%)
- Computer and mathematical occupations (10%)
- Sales and related occupations (6%)
- Office and administrative support occupations (6%)
- Transportation occupations (6%)
- Business and financial operations occupations (5%)

- Office and administrative support occupations (17%)
- Educational instruction, and library occupations (11%)
- Management occupations (10%)
- Business and financial operations occupations (9%)
- Sales and related occupations (6%)
- Food preparation and serving related occupations (6%)
- Health diagnosing and treating practitioners and other technical occupations (6%)

- El Salvador (28%)
- Mexico (19%)
- Honduras (9%)
- Philippines (4%)
- Ghana (3%)
- Peru (3%)
- Guatemala (3%)

- American (5%)
- English (5%)
- German (4%)
- Irish (3%)
- African (3%)
- Italian (1%)
- European (1%)


People in group quarters in Manassas city, Virginia in 2010:
- 35 people in emergency and transitional shelters (with sleeping facilities) for people experiencing homelessness
- 7 people in group homes intended for adults
- 4 people in other noninstitutional facilities
People in group quarters in Manassas city, Virginia in 2000:
- 519 people in local jails and other confinement facilities (including police lockups)
- 228 people in nursing homes
- 86 people in other noninstitutional group quarters
- 28 people in other nonhousehold living situations
13.64% of this county's 2021 resident taxpayers lived in other counties in 2020 ($55,961 average adjusted gross income)
| Here: | 13.64% |
| Virginia average: | 10.16% |
10 or fewer of this county's residents moved from foreign countries.
10.91% relocated from other counties in Virginia ($45,009 average AGI)
2.72% relocated from other states ($10,952 average AGI)
Manassas city: 2.72% Virginia average: 3.91%

Top counties from which taxpayers relocated into this county between 2020 and 2021:
| from Prince William County, VA | |
| from Fairfax County, VA | |
| from Manassas Park city, VA | |
| from Loudoun County, VA | |
| from Fauquier County, VA | |
| from Prince George's County, MD | |
| from Arlington County, VA |
13.92% of this county's 2020 resident taxpayers moved to other counties in 2021 ($66,757 average adjusted gross income)
| Here: | 13.92% |
| Virginia average: | 10.20% |
10 or fewer of this county's residents moved to foreign countries.
10.93% relocated to other counties in Virginia ($51,968 average AGI)
2.99% relocated to other states ($14,788 average AGI)
Manassas city: 2.99% Virginia average: 3.98%

Top counties to which taxpayers relocated from this county between 2020 and 2021:
| to Prince William County, VA | |
| to Fairfax County, VA | |
| to Manassas Park city, VA | |
| to Fauquier County, VA | |
| to Loudoun County, VA | |
| to Stafford County, VA | |
| to Culpeper County, VA |
Births per 1000 population from 1990 to 1999: 20.1
Births per 1000 population from 2000 to 2006: 19.9

Deaths per 1000 population from 1990 to 1999: 4.9
Deaths per 1000 population from 2000 to 2009: 5.2
Deaths per 1000 population from 2010 to 2020: 5.6

Infant deaths per 1000 live births from 1990 to 1999: 7.5
Infant deaths per 1000 live births from 2000 to 2006: 7.1

Persons under 19 years old without health insurance coverage in 2018: 7.6%


Persons enrolled in hospital insurance and/or supplemental medical insurance (Medicare) in July 1, 2007: 3,120 (2,676 aged, 444 disabled)
Children under 18 without health insurance coverage in 2007: 1,397 (13%)


Most common underlying causes of death in Manassas city, Virginia in 1999 - 2019:
- Bronchus or lung, unspecified - Malignant neoplasms (189)
- Atherosclerotic heart disease (170)
- Unspecified dementia (67)
- Acute myocardial infarction, unspecified (66)
- Chronic obstructive pulmonary disease, unspecified (35)
- Pneumonia, unspecified (33)
- Alzheimer disease, unspecified (25)
- Stroke, not specified as haemorrhage or infarction (25)
Population without health insurance coverage in 2000: 13%
Children under 18 without health insurance coverage in 2000: 14%
Short term general hospital admissions per 100,000 population in 2004: 26,287
Short term general hospital beds per 100,000 population in 2004: 433
Emergency room visits per 100,000 population in 2004: 129,233
General practice office based MDs per 100,000 population in 2005: 1,839
Medical specialist MDs per 100,000 population in 2005: 570
Dentists per 100,000 population in 1998: 5
Total births per 100,000 population, July 2005 - July 2006 : 54
Total deaths per 100,000 population, July 2005 - July 2006: 157
Limited-service eating places per 100,000 population in 2005 : 21
Beer, wine & liquor stores per 100,000 population in 2005: 1
Household type by relationship:
Households: 42,912- Male householders: 7,710 (1,560 living alone), Female householders: 6,503 (2,011 living alone)
7,414 spouses (7,395 opposite-sex spouses), 1,494 unmarried partners, (1,432 opposite-sex unmarried partners), 14,018 children (13,033 natural, 153 adopted, 842 stepchildren), 763 grandchildren, 640 brothers or sisters, 1,154 parents, 0 foster children, 1,934 other relatives, 1,110 non-relatives
- In group quarters: 78
Size of family households: 3,001 2-persons, 2,248 3-persons, 2,134 4-persons, 979 5-persons, 833 6-persons, 746 7-or-more-persons.
Size of nonfamily households: 3,571 1-person, 662 2-persons, 86 3-persons, 11 4-persons.
7,317 married couples with children.
2,344 single-parent households (698 men, 1,646 women).
57.3% of residents of Manassas city speak English at home.
33.2% of residents speak Spanish at home (44% speak English very well, 20% speak English well, 21% speak English not well, 15% don't speak English at all).
3.6% of residents speak other Indo-European language at home (65% speak English very well, 31% speak English well, 4% speak English not well).
3.7% of residents speak Asian or Pacific Island language at home (55% speak English very well, 25% speak English well, 9% speak English not well, 12% don't speak English at all).
1.7% of residents speak other language at home (74% speak English very well, 19% speak English well, 7% speak English not well).
In fiscal year 2004:
Federal Government expenditure: $1,063,788,000 ($28,281 per capita)
Department of Defense expenditure: $730,504,000
Federal direct payments to individuals for retirement and disability: $164,704,000
Federal other direct payments to individuals: $31,615,000
Federal direct payments not to individuals: $25,000
Federal grants: $51,954,000
Federal procurement contracts: $766,104,000 ($657,653,000 Department of Defense)
Federal salaries and wages: $49,386,000 ($12,839,000 Department of Defense)
Federal Government direct loans: $439,000
Federal guaranteed/insured loans: $85,447,000
Federal Government insurance: $12,361,000
Population change from April 1, 2000 to July 1, 2005:
Births: 3,697| Here: | 98 per 1000 residents |
| State: | 70 per 1000 residents |
Deaths: 1,027
| Here: | 27 per 1000 residents |
| State: | 40 per 1000 residents |
Net international migration: +1,210
| Here: | +32 per 1000 residents |
| State: | +18 per 1000 residents |
Net internal migration: -1,351
| Here: | |
| State: |

Total withdrawal of fresh water for public supply: 0.00 millions of gallons per day (all from surface)
| Here: | 7.2 |
| State: | 7.0 |
| Here: | 4.3 |
| State: | 4.3 |

- Year house built in Manassas city, Virginia
- 1162020 or later
- 1,3342010 to 2019
- 1,3802000 to 2009
- 2,2771990 to 1999
- 4,5731980 to 1989
- 1,9611970 to 1979
- 1,6691960 to 1969
- 4701950 to 1959
- 1071940 to 1949
- 4591939 or earlier

- Rooms in owner-occupied houses in Manassas city, Virginia
- 331 room
- 72 rooms
- 2683 rooms
- 8024 rooms
- 1,3635 rooms
- 1,5816 rooms
- 1,8987 rooms
- 1,6948 rooms
- 2,9579+ rooms

- Rooms in renter-occupied apartments in Manassas city, Virginia
- 2201 room
- 2382 rooms
- 6503 rooms
- 8604 rooms
- 6255 rooms
- 4956 rooms
- 2177 rooms
- 1338 rooms
- 2149+ rooms

- Bedrooms in owner-occupied houses in Manassas city, Virginia
- 37no bedroom
- 1581 bedroom
- 1,3122 bedrooms
- 4,0983 bedrooms
- 3,7204 bedrooms
- 1,2735+ bedrooms

- Bedrooms in renter-occupied apartments in Manassas city, Virginia
- 231no bedroom
- 9551 bedroom
- 1,0772 bedrooms
- 1,0213 bedrooms
- 2624 bedrooms
- 1175+ bedrooms

- Cars and other vehicles available in Manassas city in owner-occupied houses/condos
- 178no vehicle
- 2,4051 vehicle
- 4,7072 vehicles
- 2,0213 vehicles
- 8944 vehicles
- 3955+ vehicles

- Cars and other vehicles available in Manassas city in renter-occupied apartments
- 351no vehicle
- 1,6941 vehicle
- 1,0432 vehicles
- 4363 vehicles
- 704 vehicles
- 395+ vehicles
85.0% of Manassas city residents lived in the same house 1 years ago.
Out of people who lived in different houses, 19% lived in this county.
Out of people who lived in different counties, 87% lived in Virginia.
| Manassas city: | 85.0% |
| State average: | 86.6% |
Place of birth for U.S.-born residents:
- This state: 16,976
- Other state: 12,033
- Northeast: 3,550
- Midwest: 1,919
- South: 4,873
- West: 1,700


- 50.1%Electricity
- 48.4%Utility gas
- 0.6%Bottled, tank, or LP gas
- 0.6%Fuel oil, kerosene, etc.
- 0.2%Other fuel
- 0.1%Wood

- 54.1%Electricity
- 42.0%Utility gas
- 2.0%Bottled, tank, or LP gas
- 1.0%Other fuel
- 0.7%Fuel oil, kerosene, etc.
- 0.2%No fuel used
Private vs. public school enrollment:
| Here: | 15.4% |
| Virginia: | 13.2% |
| Here: | 11.0% |
| Virginia: | 10.2% |
| Here: | 26.2% |
| Virginia: | 18.7% |


| Home Mortgage Disclosure Act Aggregated Statistics For Year 2009 (Based on 4 full tracts) | ||||||||||||||
| A) FHA, FSA/RHS & VA Home Purchase Loans | B) Conventional Home Purchase Loans | C) Refinancings | D) Home Improvement Loans | E) Loans on Dwellings For 5+ Families | F) Non-occupant Loans on < 5 Family Dwellings (A B C & D) | G) Loans On Manufactured Home Dwelling (A B C & D) | ||||||||
|---|---|---|---|---|---|---|---|---|---|---|---|---|---|---|
| Number | Average Value | Number | Average Value | Number | Average Value | Number | Average Value | Number | Average Value | Number | Average Value | Number | Average Value | |
| LOANS ORIGINATED | 416 | $180,389 | 217 | $133,078 | 419 | $206,995 | 23 | $67,652 | 1 | $600,000 | 121 | $103,529 | 0 | $0 |
| APPLICATIONS APPROVED, NOT ACCEPTED | 21 | $174,571 | 19 | $118,421 | 35 | $228,600 | 1 | $2,000 | 0 | $0 | 7 | $94,714 | 0 | $0 |
| APPLICATIONS DENIED | 68 | $168,912 | 47 | $110,553 | 243 | $236,531 | 32 | $43,594 | 0 | $0 | 36 | $133,000 | 2 | $37,500 |
| APPLICATIONS WITHDRAWN | 54 | $171,056 | 29 | $130,207 | 151 | $231,000 | 6 | $32,167 | 0 | $0 | 17 | $121,706 | 0 | $0 |
| FILES CLOSED FOR INCOMPLETENESS | 12 | $159,833 | 13 | $151,846 | 25 | $226,040 | 1 | $63,000 | 0 | $0 | 7 | $99,143 | 0 | $0 |
Detailed HMDA statistics for the following Tracts: 9101.00 , 9102.00, 9103.00, 9104.00
| Private Mortgage Insurance Companies Aggregated Statistics For Year 2009 (Based on 4 full tracts) | ||||||
| A) Conventional Home Purchase Loans | B) Refinancings | C) Non-occupant Loans on < 5 Family Dwellings (A & B) | ||||
|---|---|---|---|---|---|---|
| Number | Average Value | Number | Average Value | Number | Average Value | |
| LOANS ORIGINATED | 32 | $192,719 | 6 | $237,667 | 0 | $0 |
| APPLICATIONS APPROVED, NOT ACCEPTED | 7 | $158,000 | 5 | $298,400 | 0 | $0 |
| APPLICATIONS DENIED | 5 | $188,600 | 2 | $202,000 | 1 | $342,000 |
| APPLICATIONS WITHDRAWN | 3 | $194,333 | 1 | $373,000 | 0 | $0 |
| FILES CLOSED FOR INCOMPLETENESS | 2 | $137,500 | 1 | $128,000 | 1 | $180,000 |
Detailed PMIC statistics for the following Tracts: 9101.00 , 9102.00, 9103.00, 9104.00


| Most common first names in Manassas city, VA among deceased individuals | ||
| Name | Count | Lived (average) |
|---|---|---|
| Mary | 139 | 80.8 years |
| James | 113 | 72.4 years |
| William | 110 | 74.9 years |
| John | 93 | 75.0 years |
| Robert | 86 | 73.1 years |
| Dorothy | 79 | 81.4 years |
| Margaret | 71 | 81.1 years |
| Charles | 67 | 73.4 years |
| Helen | 62 | 83.8 years |
| Joseph | 59 | 75.0 years |
| Most common last names in Manassas city, VA among deceased individuals | ||
| Last name | Count | Lived (average) |
|---|---|---|
| Smith | 69 | 75.1 years |
| Brown | 32 | 75.5 years |
| Davis | 28 | 74.7 years |
| Jones | 27 | 75.7 years |
| Miller | 27 | 75.1 years |
| Johnson | 26 | 72.7 years |
| Taylor | 25 | 78.4 years |
| Moore | 22 | 73.9 years |
| Harris | 21 | 66.4 years |
| Payne | 21 | 79.2 years |
Manassas city on our top lists:
- #23 on the list of "Top 101 counties with the highest percentage of residents relocating from other counties between 2010 and 2011"
- #29 on the list of "Top 101 counties with the highest percentage of residents relocating to other counties in 2011"
- #76 on the list of "Top 101 counties with the lowest number of deaths per 1000 residents 2007-2013"