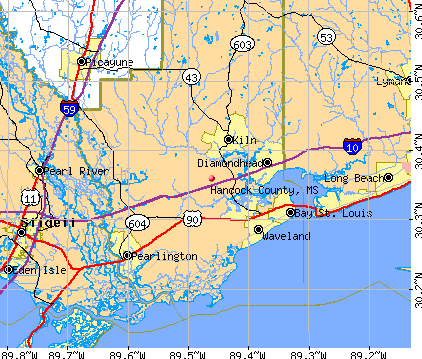
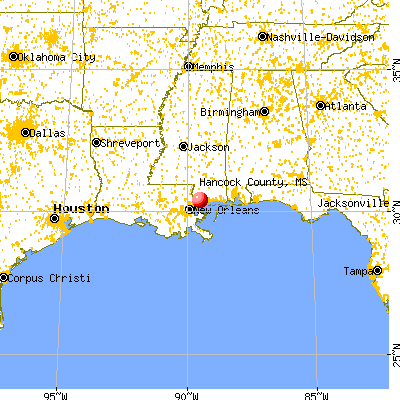
Hancock County, Mississippi (MS)
County owner-occupied free and clear houses and condos in 2010: 6,120
County owner-occupied houses and condos in 2000: 13,457
Renter-occupied apartments: 4,020 (it was 3,440 in 2000)
| % of renters here: | 20% |
| State: | 30% |
Land area: 477 sq. mi.
Water area: 75.6 sq. mi.
Population density: 96 people per square mile (average).
Industries providing employment: Educational, health and social services (20.8%), Construction (11.8%), Arts, entertainment, recreation, accommodation and food services (11.1%).
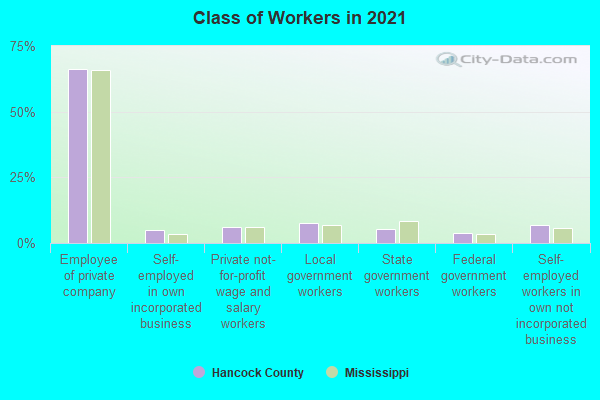
Type of workers:
- Private wage or salary: 76%
- Government: 17%
- Self-employed, not incorporated: 7%
- Unpaid family work: 0%
- OSM Map
- General Map
- Google Map
- MSN Map

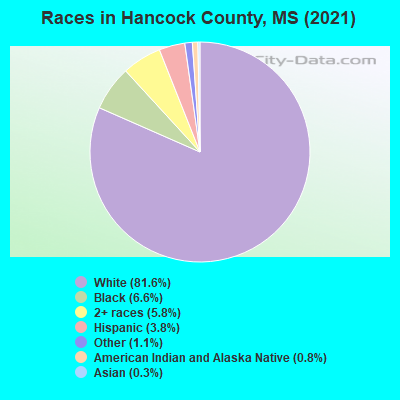
- 38,15182.6%White Non-Hispanic Alone
- 3,0786.7%Black Non-Hispanic Alone
- 2,2995.0%Two or more races
- 1,7983.9%Hispanic or Latino
- 3430.7%American Indian and Alaska Native alone
- 3400.7%Some other race alone
- 1940.4%Asian alone
| Median resident age: | 46.4 years |
| Mississippi median age: | 38.9 years |
| Males: 22,202 | |
| Females: 23,515 |

 | Ocean Aero moving HQ from CA to Gulfport..... (10 replies) |
| Low crime rural towns in southern Mississippi with internet? (7 replies) |
| Moving to mississippi 2017 (63 replies) |
| Maybe thinking of moving to Mississippi. (26 replies) |
| Stennis Space Center (12 replies) |
| Potentially Moving to MS From NY- Young/Single/Male with Teaching Degree (37 replies) |
| Hancock County: | 2.0 people |
| Mississippi: | 3 people |
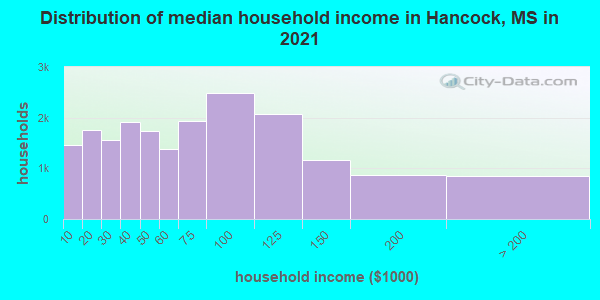
Estimated median household income in 2022: $63,303 ($35,202 in 1999)
| This county: | $63,303 |
| Mississippi: | $52,719 |
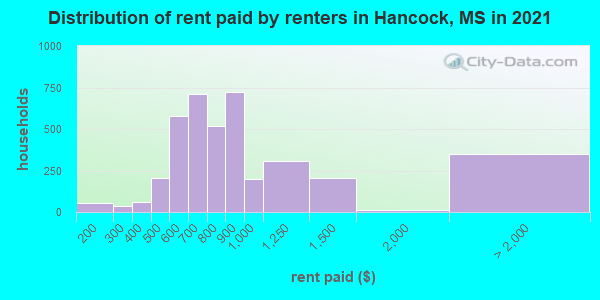
Median contract rent in 2022 for apartments: $734 (lower quartile is $592, upper quartile is $991)
| This county: | $734 |
| State: | $656 |
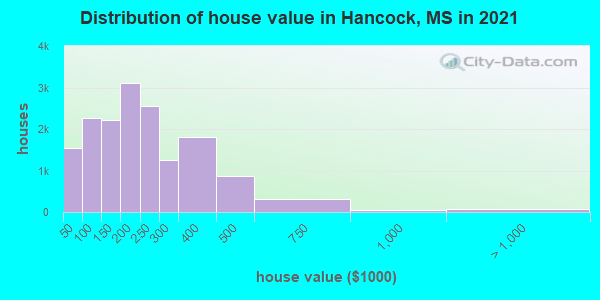
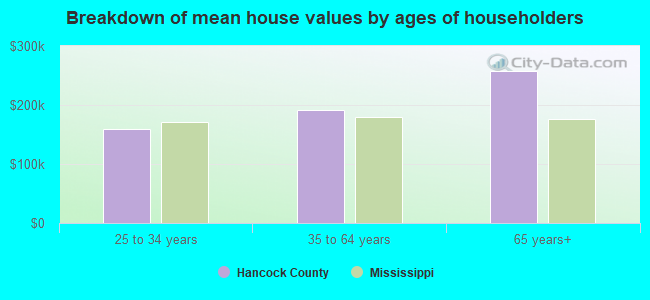
Estimated median house or condo value in 2022: $212,434 (it was $82,100 in 2000)
| Hancock: | $212,434 |
| Mississippi: | $162,500 |
Median monthly housing costs for homes and condos with a mortgage: $1,449
Median monthly housing costs for units without a mortgage: $440
Institutionalized population: 192
Crime in 2021 (reported by the sheriff's office or county police, not the county total):
- Murders: 3
- Rapes: 6
- Robberies: 4
- Assaults: 12
- Burglaries: 92
- Thefts: 309
- Auto thefts: 65
Crime in 2020 (reported by the sheriff's office or county police, not the county total):
- Murders: 0
- Rapes: 3
- Robberies: 3
- Assaults: 13
- Burglaries: 61
- Thefts: 185
- Auto thefts: 33
Health of residents in Hancock County based on CDC Behavioral Risk Factor Surveillance System Survey Questionnaires from 2013 to 2021:
General health status score of residents in this county from 1 (poor) to 5 (excellent) is 3.3. This is worse than average.64.2% of residents exercised in the past month. This is less than average.
47.6% of residents smoked 100+ cigarettes in their lives. This is about average.
40.8% of adult residents drank alcohol in the past 30 days. This is less than average.
61.2% of residents visited a dentist within the past year. This is less than average.
Average weight of males is 203 pounds. This is more than average.
Average weight of females is 168 pounds. This is more than average.
Health of residents in Hancock County based on CDC Behavioral Risk Factor Surveillance System Survey Questionnaires from 2003 to 2012:
General health status score of residents in this county from 1 (poor) to 5 (excellent) is 3.3. This is worse than average.68.8% of residents exercised in the past month. This is less than average.
56.2% of residents smoked 100+ cigarettes in their lives. This is more than average.
100.0% of adult residents drank alcohol in the past 30 days. This is more than average.
Average weight of males is 201 pounds. This is more than average.
Average weight of females is 166 pounds. This is about average.
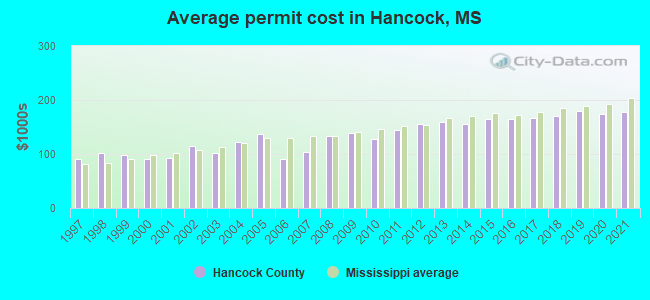
Single-family new house construction building permits:
- 2022: 174 buildings, average cost: $164,400
- 2021: 651 buildings, average cost: $177,000
- 2020: 584 buildings, average cost: $173,500
- 2019: 518 buildings, average cost: $178,900
- 2018: 456 buildings, average cost: $170,200
- 2017: 434 buildings, average cost: $167,000
- 2016: 342 buildings, average cost: $165,400
- 2015: 384 buildings, average cost: $163,900
- 2014: 315 buildings, average cost: $155,300
- 2013: 297 buildings, average cost: $158,600
- 2012: 290 buildings, average cost: $156,100
- 2011: 276 buildings, average cost: $144,100
- 2010: 327 buildings, average cost: $126,500
- 2009: 451 buildings, average cost: $139,400
- 2008: 820 buildings, average cost: $133,300
- 2007: 912 buildings, average cost: $103,200
- 2006: 1261 buildings, average cost: $89,600
- 2005: 412 buildings, average cost: $137,000
- 2004: 567 buildings, average cost: $121,700
- 2003: 165 buildings, average cost: $101,200
- 2002: 426 buildings, average cost: $114,500
- 2001: 426 buildings, average cost: $92,000
- 2000: 492 buildings, average cost: $90,100
- 1999: 94 buildings, average cost: $99,100
- 1998: 83 buildings, average cost: $102,000
- 1997: 80 buildings, average cost: $90,100
Median real estate property taxes paid for housing units with mortgages in 2022: $1,837 (0.8%)
Median real estate property taxes paid for housing units with no mortgage in 2022: $1,250 (0.7%)
| Hancock County: | 13.7% |
| Mississippi: | 19.1% |
Median age of residents in 2022: 46.4 years old
(Males: 45.3 years old, Females: 47.2 years old)
(Median age for: White residents: 46.8 years old, Black residents: 40.8 years old, American Indian residents: 37.7 years old, Asian residents: 64.4 years old, Hispanic or Latino residents: 37.1 years old, Other race residents: 48.7 years old)
Area name: Gulfport-Biloxi, MS MSA
Fair market rent in 2006 for a 1-bedroom apartment in Hancock County is $526 a month.
Fair market rent for a 2-bedroom apartment is $615 a month.
Fair market rent for a 3-bedroom apartment is $801 a month.
Cities in this county include: Bay St. Louis, Waveland, Diamondhead, Shoreline Park, Kiln, Pearlington.
2023 air pollution in Hancock County:
Ozone (1-hour): 0.033 ppm (standard limit: 0.12 ppm). Near U.S. average.
Particulate Matter (PM2.5) Annual: 8.9 µg/m3(standard limit: 15.0 µg/m3). Near U.S. average.
Neighboring counties: Acadia Parish, Louisiana  , Beauregard Parish, Louisiana , Burnet County, Texas , Liberty County, Florida
  , Terrell County, Texas .
| Here: | 2.7% |
| Mississippi: | 2.6% |
Current college students: 1,463
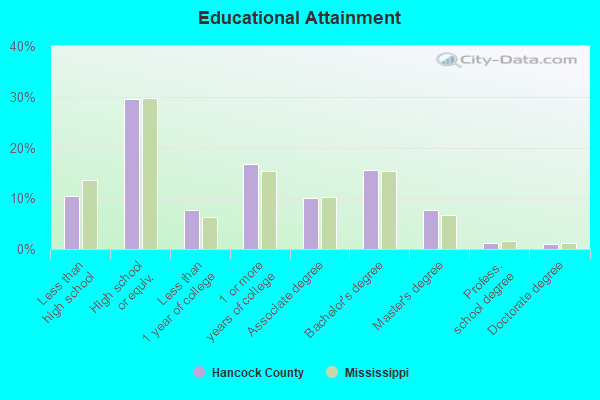
People 25 years of age or older with a high school degree or higher: 90.4%
People 25 years of age or older with a bachelor's degree or higher: 24.4%
Number of foreign born residents: 946 (61.8% naturalized citizens)
| Hancock County: | 2.1% |
| Whole state: | 2.2% |
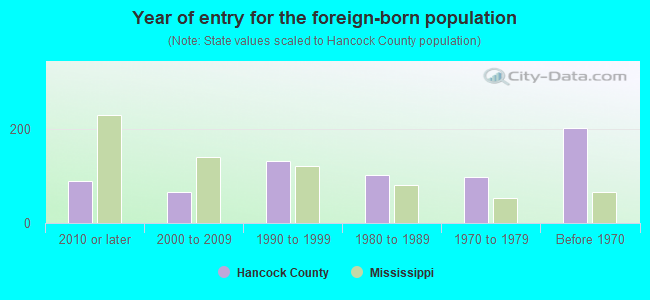
- Year of entry for the foreign-born population
- 1402010 or later
- 1692000 to 2009
- 1941990 to 1999
- 1031980 to 1989
- 971970 to 1979
- 203Before 1970
Mean travel time to work (commute): minutes
Percentage of county residents living and working in this county: 85.9%
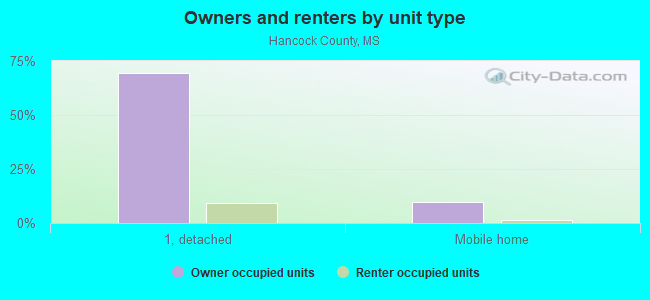
Housing units in structures:
- One, detached: 18,090
- One, attached: 247
- Two: 347
- 3 or 4: 384
- 5 to 9: 349
- 10 to 19: 466
- 20 to 49: 241
- 50 or more: 412
- Mobile homes: 2,651
- Boats, RVs, vans, etc.: 83
Housing units in Hancock County with a mortgage: 8,373 (857 second mortgage, 6 home equity loan, 639 both second mortgage and home equity loan)
Houses without a mortgage: 102
| Here: | 7.3% with mortgage |
| State: | 97.5% with mortgage |
Religion statistics for Hancock County
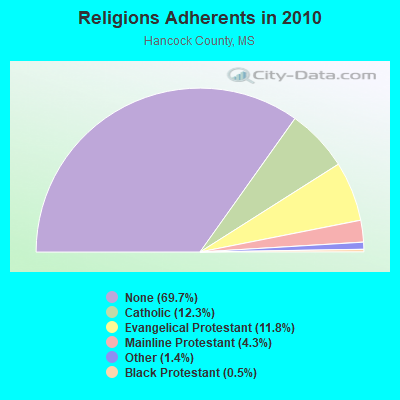
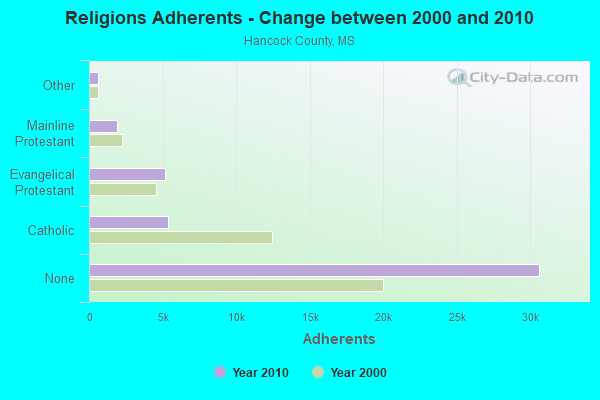
| Religion | Adherents | Congregations |
|---|---|---|
| Catholic | 5,392 | 6 |
| Evangelical Protestant | 5,182 | 30 |
| Mainline Protestant | 1,904 | 12 |
| Other | 611 | 2 |
| Black Protestant | 213 | 2 |
| None | 30,627 | - |
Source: Clifford Grammich, Kirk Hadaway, Richard Houseal, Dale E.Jones, Alexei Krindatch, Richie Stanley and Richard H.Taylor. 2012. 2010 U.S.Religion Census: Religious Congregations & Membership Study. Association of Statisticians of American Religious Bodies. Jones, Dale E., et al. 2002. Congregations and Membership in the United States 2000. Nashville, TN: Glenmary Research Center.
Food Environment Statistics:
| Hancock County: | 0.25 / 10,000 pop. |
| State: | 2.08 / 10,000 pop. |
| Here: | 0.25 / 10,000 pop. |
| Mississippi: | 0.24 / 10,000 pop. |
| This county: | 0.25 / 10,000 pop. |
| Mississippi: | 0.80 / 10,000 pop. |
| Hancock County: | 5.54 / 10,000 pop. |
| Mississippi: | 6.36 / 10,000 pop. |
| This county: | 8.30 / 10,000 pop. |
| State: | 5.03 / 10,000 pop. |
| Hancock County: | 12.0% |
| Mississippi: | 12.3% |
| Hancock County: | 30.6% |
| State: | 33.1% |
| Here: | 13.3% |
| State: | 14.4% |
Agriculture in Hancock County:
Average size of farms: 127 acresAverage value of agricultural products sold per farm: $8,488
Average value of crops sold per acre for harvested cropland: $179.00
The value of nursery, greenhouse, floriculture, and sod as a percentage of the total market value of agricultural products sold: 12.88%
The value of livestock, poultry, and their products as a percentage of the total market value of agricultural products sold: 72.98%
Average total farm production expenses per farm: $9,014
Harvested cropland as a percentage of land in farms: 10.12%
Average market value of all machinery and equipment per farm: $20,376
The percentage of farms operated by a family or individual: 94.63%
Average age of principal farm operators: 56 years
Average number of cattle and calves per 100 acres of all land in farms: 16.80
Milk cows as a percentage of all cattle and calves: 7.35%
Corn for grain: 38 harvested acres
Vegetables: 29 harvested acres
Land in orchards: 150 acres
Earthquake activity:
Hancock County-area historical earthquake activity is significantly above Mississippi state average. It is 54% smaller than the overall U.S. average.On 9/10/2006 at 14:56:08, a magnitude 5.9 (5.9 MB, 5.5 MS, 5.8 MW, Class: Moderate, Intensity: VI - VII) earthquake occurred 332.4 miles away from Hancock County center
On 10/24/1997 at 08:35:17, a magnitude 4.9 (4.8 MB, 4.2 MS, 4.9 LG, Depth: 6.2 mi, Class: Light, Intensity: IV - V) earthquake occurred 140.6 miles away from the county center
On 5/6/2018 at 16:47:09, a magnitude 4.6 (4.6 MB, Depth: 6.2 mi) earthquake occurred 178.4 miles away from the county center
On 1/18/1999 at 07:00:53, a magnitude 4.8 (4.8 MB, 4.0 LG, Depth: 0.6 mi) earthquake occurred 247.4 miles away from the county center
On 11/7/2004 at 11:20:21, a magnitude 4.3 (4.3 MW, Depth: 3.1 mi) earthquake occurred 182.3 miles away from Hancock County center
On 6/30/1994 at 01:08:24, a magnitude 4.2 (4.2 MB, Depth: 6.2 mi) earthquake occurred 174.7 miles away from the county center
Magnitude types: regional Lg-wave magnitude (LG), body-wave magnitude (MB), surface-wave magnitude (MS), moment magnitude (MW)
Most recent natural disasters:
- Mississippi Hurricane Zeta, Incident Period: October 28, 2020 - October 29, 2020, Major Disaster (Presidential) Declared DR-4576-MS: December 31, 2020, FEMA Id: 4576, Natural disaster type: Hurricane
- Mississippi Covid-19 Pandemic, Incident Period: January 20, 2020, FEMA Id: 4528, Natural disaster type: Other
- Mississippi Hurricane Nate, Incident Period: October 6, 2017 - October 10, 2017, FEMA Id: 4350, Natural disaster type: Hurricane
- Mississippi Tropical Storm Isaac, Incident Period: August 26, 2012 to September 11, 2012, Emergency Declared EM-3348: August 28, 2012, FEMA Id: 3348, Natural disaster type: Tropical Storm
- Mississippi Hurricane Isaac, Incident Period: August 26, 2012 to September 11, 2012, Major Disaster (Presidential) Declared DR-4081: August 29, 2012, FEMA Id: 4081, Natural disaster type: Hurricane
- Mississippi Hurricane Gustav, Incident Period: August 28, 2008 to September 08, 2008, Major Disaster (Presidential) Declared DR-1794: September 22, 2008, FEMA Id: 1794, Natural disaster type: Hurricane
- Mississippi Hurricane Gustav, Incident Period: August 28, 2008 to September 08, 2008, Emergency Declared EM-3291: August 30, 2008, FEMA Id: 3291, Natural disaster type: Hurricane
- Mississippi Hurricane Katrina, Incident Period: August 29, 2005 to October 14, 2005, Major Disaster (Presidential) Declared DR-1604: August 29, 2005, FEMA Id: 1604, Natural disaster type: Hurricane
- Mississippi Hurricane Katrina, Incident Period: August 27, 2005 to October 14, 2005, Emergency Declared EM-3213: August 28, 2005, FEMA Id: 3213, Natural disaster type: Hurricane
- Mississippi Hurricane Dennis, Incident Period: July 10, 2005 to July 15, 2005, Major Disaster (Presidential) Declared DR-1594: July 10, 2005, FEMA Id: 1594, Natural disaster type: Hurricane
- 11 other natural disasters have been reported since 1953.
The number of natural disasters in Hancock County (21) is greater than the US average (15).
Major Disasters (Presidential) Declared: 14
Emergencies Declared: 5
Causes of natural disasters: Hurricanes: 12, Floods: 4, Storms: 3, Tornadoes: 3, Tropical Storms: 3, Drought: 1, Freeze: 1, Heavy Rain: 1, Other: 1 (Note: some incidents may be assigned to more than one category).
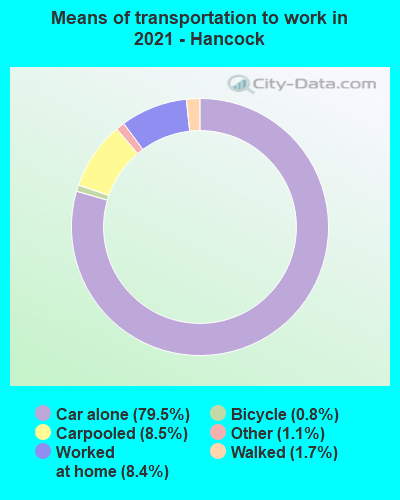
Means of transportation to work:
- Drove a car alone: 14,579 (76.6%)
- Carpooled: 1,622 (8.5%)
- Taxicab, motorcycle, or other means: 123 (0.6%)
- Bicycle: 44 (0.2%)
- Walked: 308 (1.6%)
- Worked at home: 2,656 (13.9%)

- Health care and social assistance (23%)
- Retail trade (14%)
- Educational services (13%)
- Accommodation and food services (9%)
- Professional, scientific, and technical services (8%)
- Finance and insurance (8%)
- Other services, except public administration (6%)
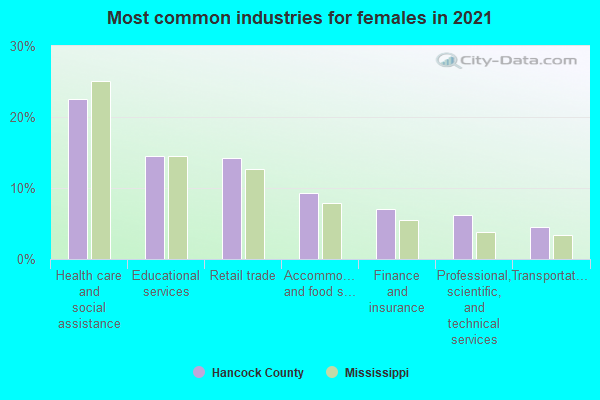
- Health care and social assistance (22%)
- Retail trade (13%)
- Educational services (12%)
- Accommodation and food services (8%)
- Professional, scientific, and technical services (8%)
- Finance and insurance (7%)
- Other services, except public administration (5%)

- Management occupations (16%)
- Installation, maintenance, and repair occupations (13%)
- Construction and extraction occupations (12%)
- Sales and related occupations (10%)
- Production occupations (9%)
- Transportation occupations (7%)
- Food preparation and serving related occupations (6%)
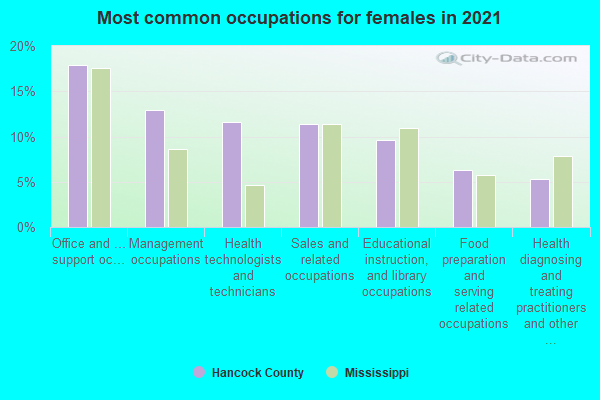
- Office and administrative support occupations (19%)
- Management occupations (13%)
- Sales and related occupations (12%)
- Health technologists and technicians (11%)
- Educational instruction, and library occupations (6%)
- Food preparation and serving related occupations (6%)
- Health diagnosing and treating practitioners and other technical occupations (5%)

- Mexico (13%)
- Taiwan (10%)
- Germany (9%)
- India (9%)
- Greece (7%)
- England (6%)
- Canada (6%)
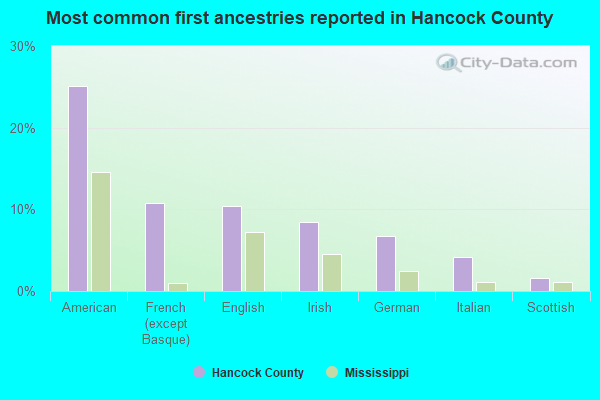
- American (26%)
- English (11%)
- French (except Basque) (10%)
- Irish (8%)
- German (7%)
- Italian (4%)
- French Canadian (2%)
People in group quarters in Hancock County, Mississippi in 2010:
- 208 people in other noninstitutional facilities
- 192 people in nursing facilities/skilled-nursing facilities
- 85 people in college/university student housing
- 54 people in group homes intended for adults
- 8 people in workers' group living quarters and job corps centers
People in group quarters in Hancock County, Mississippi in 2000:
- 213 people in nursing homes
- 133 people in local jails and other confinement facilities (including police lockups)
- 27 people in other group homes
- 26 people in religious group quarters
- 17 people in military barracks, etc.
- 17 people in homes for the mentally retarded
- 9 people in homes for the mentally ill
- 7 people in unknown juvenile institutions
- 2 people in other workers' dormitories
9.44% of this county's 2021 resident taxpayers lived in other counties in 2020 ($56,880 average adjusted gross income)
| Here: | 9.44% |
| Mississippi average: | 6.85% |
10 or fewer of this county's residents moved from foreign countries.
4.18% relocated from other counties in Mississippi ($20,761 average AGI)
5.26% relocated from other states ($36,119 average AGI)
Hancock County: 5.26% Mississippi average: 2.80%
Top counties from which taxpayers relocated into this county between 2020 and 2021:
| from Harrison County, MS | |
| from Pearl River County, MS | |
| from St. Tammany Parish, LA | |
| from Jefferson Parish, LA | |
| from Orleans Parish, LA | |
| from Jackson County, MS | |
| from Forrest County, MS |
8.54% of this county's 2020 resident taxpayers moved to other counties in 2021 ($45,245 average adjusted gross income)
| Here: | 8.54% |
| Mississippi average: | 7.03% |
10 or fewer of this county's residents moved to foreign countries.
4.32% relocated to other counties in Mississippi ($22,265 average AGI)
4.23% relocated to other states ($22,980 average AGI)
Hancock County: 4.23% Mississippi average: 2.99%

Top counties to which taxpayers relocated from this county between 2020 and 2021:
| to Harrison County, MS | |
| to Pearl River County, MS | |
| to St. Tammany Parish, LA | |
| to Jackson County, MS | |
| to Orleans Parish, LA | |
| to Jefferson Parish, LA |
Births per 1000 population from 1990 to 1999: 12.8
Births per 1000 population from 2000 to 2006: 11.9

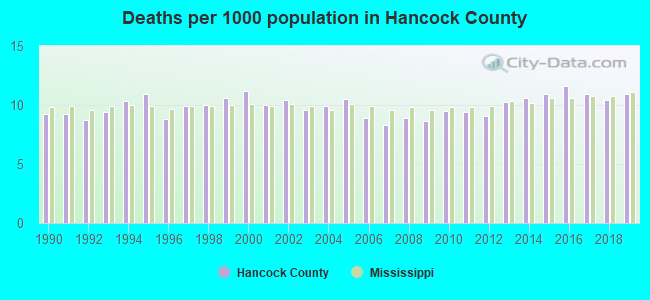
Deaths per 1000 population from 1990 to 1999: 9.7
Deaths per 1000 population from 2000 to 2009: 9.6
Deaths per 1000 population from 2010 to 2020: 10.6
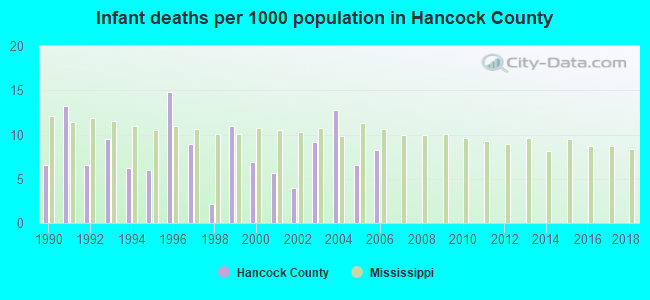
Infant deaths per 1000 live births from 1990 to 1999: 8.5
Infant deaths per 1000 live births from 2000 to 2006: 7.6
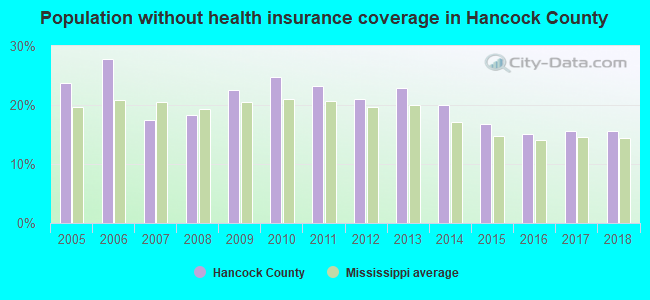
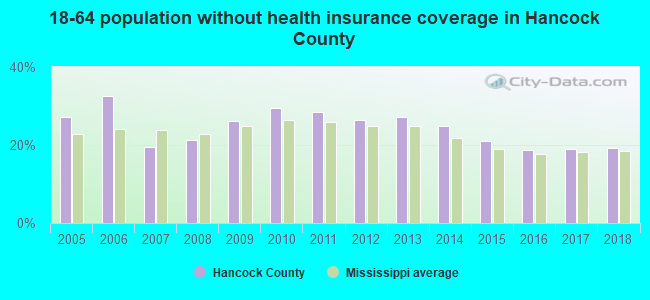
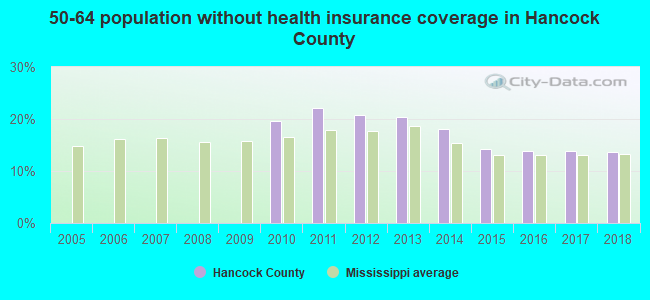
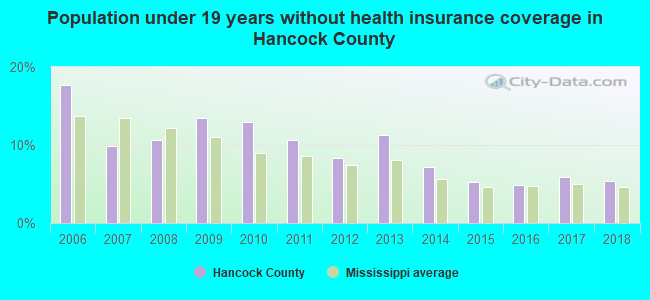
Persons under 19 years old without health insurance coverage in 2018: 5.4%

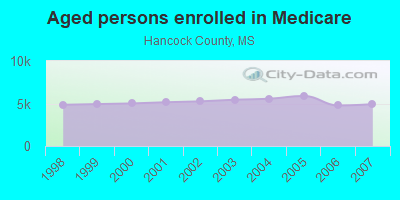
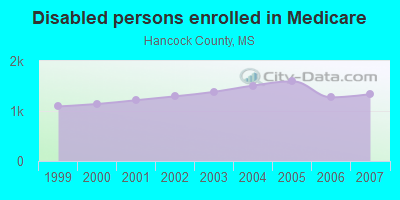
Persons enrolled in hospital insurance and/or supplemental medical insurance (Medicare) in July 1, 2007: 6,257 (4,920 aged, 1,337 disabled)
Children under 18 without health insurance coverage in 2007: 1,243 (12%)

Most common underlying causes of death in Hancock County, Mississippi in 1999 - 2019:
- Bronchus or lung, unspecified - Malignant neoplasms (697)
- Atherosclerotic heart disease (642)
- Chronic obstructive pulmonary disease, unspecified (637)
- Acute myocardial infarction, unspecified (570)
- Congestive heart failure (553)
- Alzheimer disease, unspecified (202)
- Stroke, not specified as haemorrhage or infarction (200)
- Unspecified dementia (152)
- Accidental poisoning by and exposure to other and unspecified drugs, medicaments and biological substances (118)
- Septicaemia, unspecified (94)
Population without health insurance coverage in 2000: 16%
Children under 18 without health insurance coverage in 2000: 13%
Short term general hospital admissions per 100,000 population in 2004: 9,557
Short term general hospital beds per 100,000 population in 2004: 226
Emergency room visits per 100,000 population in 2004: 57,318
General practice office based MDs per 100,000 population in 2005: 1,257
Medical specialist MDs per 100,000 population in 2005: 1,165
Dentists per 100,000 population in 1998: 15
Total births per 100,000 population, July 2005 - July 2006 : 20
Total deaths per 100,000 population, July 2005 - July 2006: 54
Limited-service eating places per 100,000 population in 2005 : 19
Homicides per 1,000,000 population from 2000 to 2006: 75.2. This is less than state average.
Suicides per 1,000,000 population from 2000 to 2006: 189.5. This is more than state average.
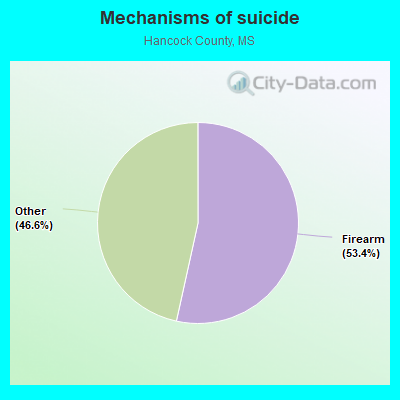
- Firearm - 101.3
- Other - 88.2
Household type by relationship:
Households: 45,717- Male householders: 9,236 (2,204 living alone), Female householders: 10,613 (3,327 living alone)
10,033 spouses (9,938 opposite-sex spouses), 1,189 unmarried partners, (1,128 opposite-sex unmarried partners), 10,464 children (8,602 natural, 661 adopted, 1,186 stepchildren), 1,937 grandchildren, 295 brothers or sisters, 391 parents, 106 foster children, 880 other relatives, 438 non-relatives
- In group quarters: 263
Size of family households: 6,407 2-persons, 3,197 3-persons, 2,249 4-persons, 1,028 5-persons, 291 6-persons, 282 7-or-more-persons.
Size of nonfamily households: 5,525 1-person, 776 2-persons, 78 3-persons.
4,410 married couples with children.
2,287 single-parent households (153 men, 2,134 women).
96.7% of residents of Hancock speak English at home.
1.7% of residents speak Spanish at home (91% speak English very well, 2% speak English well, 3% speak English not well, 5% don't speak English at all).
1.3% of residents speak other Indo-European language at home (72% speak English very well, 26% speak English well, 2% speak English not well).
0.4% of residents speak Asian or Pacific Island language at home (96% speak English very well, 3% speak English well, 2% speak English not well).
0.2% of residents speak other language at home (77% speak English very well, 23% speak English well).
In fiscal year 2004:
Federal Government expenditure: $535,325,000 ($11,654 per capita)
Department of Defense expenditure: $130,018,000
Federal direct payments to individuals for retirement and disability: $131,103,000
Federal other direct payments to individuals: $52,883,000
Federal direct payments not to individuals: $400,000
Federal grants: $28,589,000
Federal procurement contracts: $207,540,000 ($41,692,000 Department of Defense)
Federal salaries and wages: $114,810,000 ($75,190,000 Department of Defense)
Federal Government direct loans: $974,000
Federal guaranteed/insured loans: $15,451,000
Federal Government insurance: $661,596,000
Population change from April 1, 2000 to July 1, 2005:
Births: 2,831| Here: | 61 per 1000 residents |
| State: | 78 per 1000 residents |
Deaths: 2,302
| Here: | 49 per 1000 residents |
| State: | 51 per 1000 residents |
Net international migration: +92
| Here: | +2 per 1000 residents |
| State: | +4 per 1000 residents |
Net internal migration: +3,185
| Here: | |
| State: |
Total withdrawal of fresh water for public supply: 2.26 millions of gallons per day (all from ground)
| Here: | 6.1 |
| State: | 6.3 |
| Here: | 4.8 |
| State: | 4.8 |
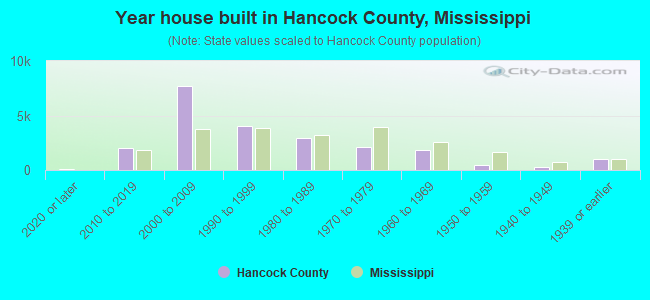
- Year house built in Hancock County, Mississippi
- 2302020 or later
- 2,9962010 to 2019
- 7,2762000 to 2009
- 3,5801990 to 1999
- 2,7501980 to 1989
- 2,5381970 to 1979
- 2,0621960 to 1969
- 4181950 to 1959
- 3691940 to 1949
- 8591939 or earlier
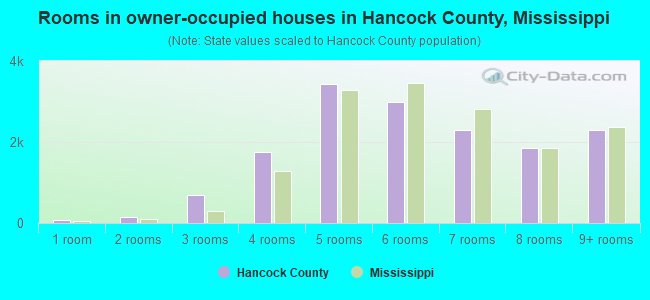
- Rooms in owner-occupied houses in Hancock County, Mississippi
- 871 room
- 1192 rooms
- 9293 rooms
- 2,1434 rooms
- 3,1065 rooms
- 3,1616 rooms
- 2,1647 rooms
- 2,1668 rooms
- 2,4219+ rooms
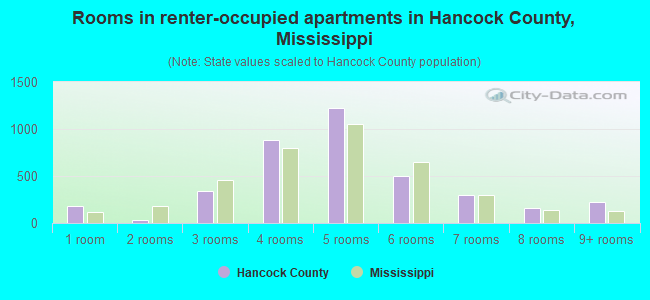
- Rooms in renter-occupied apartments in Hancock County, Mississippi
- 591 room
- 1132 rooms
- 5133 rooms
- 9904 rooms
- 9265 rooms
- 7006 rooms
- 2277 rooms
- 998 rooms
- 789+ rooms
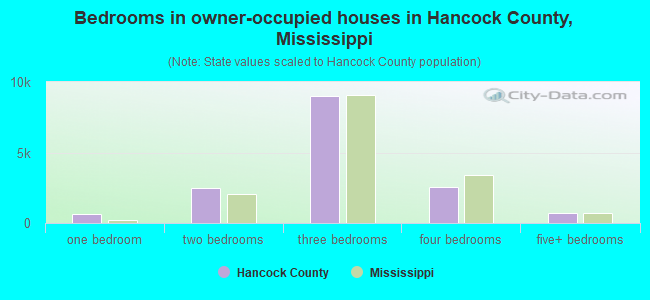
- Bedrooms in owner-occupied houses in Hancock County, Mississippi
- 98no bedroom
- 6321 bedroom
- 2,2692 bedrooms
- 9,5743 bedrooms
- 2,7274 bedrooms
- 8095+ bedrooms
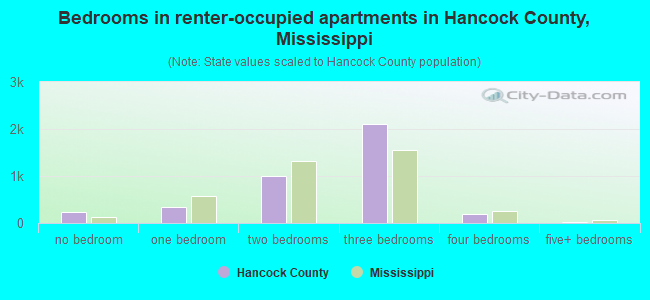
- Bedrooms in renter-occupied apartments in Hancock County, Mississippi
- 62no bedroom
- 4061 bedroom
- 9792 bedrooms
- 2,1123 bedrooms
- 2074 bedrooms
- 65+ bedrooms
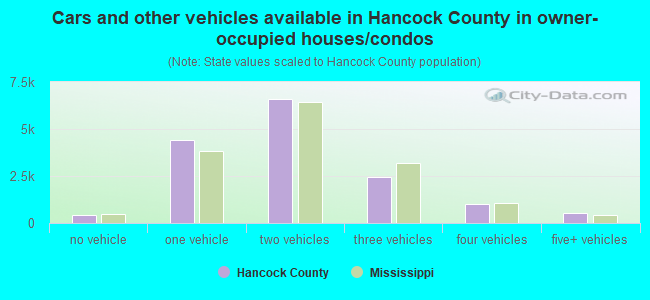
- Cars and other vehicles available in Hancock County in owner-occupied houses/condos
- 346no vehicle
- 4,7381 vehicle
- 6,7112 vehicles
- 2,7263 vehicles
- 1,0124 vehicles
- 6695+ vehicles
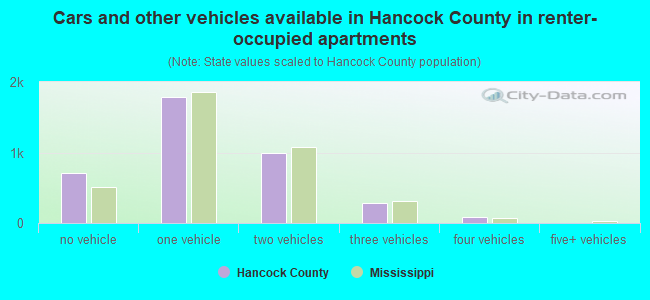
- Cars and other vehicles available in Hancock County in renter-occupied apartments
- 393no vehicle
- 1,7871 vehicle
- 1,3242 vehicles
- 1743 vehicles
- 464 vehicles
- 05+ vehicles
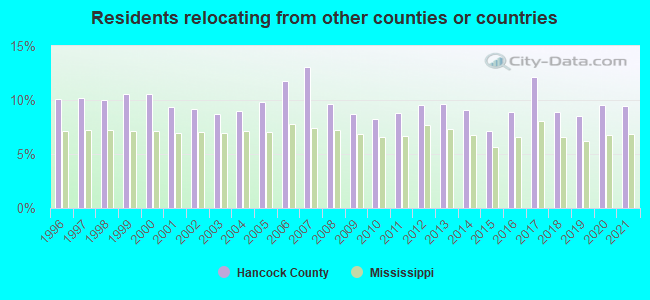
84.9% of Hancock County residents lived in the same house 1 years ago.
Out of people who lived in different houses, 32% lived in this county.
Out of people who lived in different counties, 46% lived in Mississippi.
| Hancock County: | 84.9% |
| State average: | 88.9% |
Place of birth for U.S.-born residents:
- This state: 21,312
- Other state: 23,557
- Northeast: 1,368
- Midwest: 2,808
- South: 17,067
- West: 2,338
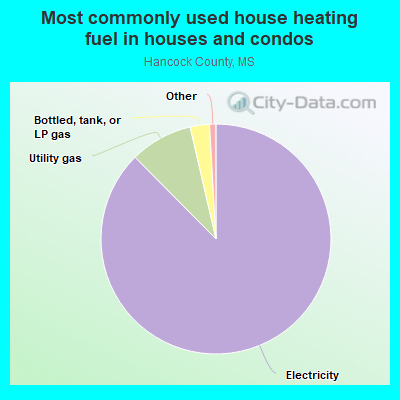
- 87.6%Electricity
- 8.4%Utility gas
- 2.8%Bottled, tank, or LP gas
- 0.9%No fuel used
- 0.3%Wood
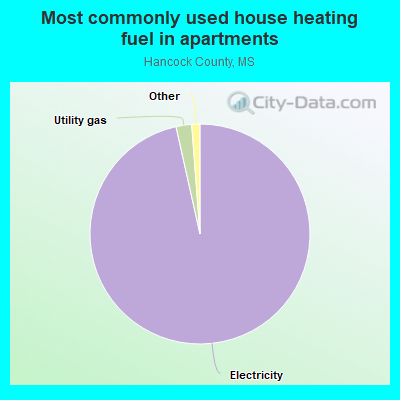
- 92.4%Electricity
- 3.2%Utility gas
- 2.2%No fuel used
- 1.9%Bottled, tank, or LP gas
- 0.3%Wood
Private vs. public school enrollment:
| Here: | 20.0% |
| Mississippi: | 16.1% |
| Here: | 21.9% |
| Mississippi: | 14.6% |
| Here: | 6.0% |
| Mississippi: | 12.8% |

Hancock County government finances - Expenditure in 2020:
- Bond Funds - Cash and Securities: $11,619,000
- Charges - Hospital Public: $32,003,000
Miscellaneous Commercial Activities: $6,483,000
Miscellaneous Commercial Activities: $6,350,000
Other: $2,259,000
Sewerage: $2,253,000
Air Transportation: $2,082,000
Other: $2,025,000
Air Transportation: $1,889,000
Sea and Inland Port Facilities: $1,540,000
Sea and Inland Port Facilities: $1,378,000
Solid Waste Management: $674,000
Solid Waste Management: $648,000
Parks and Recreation: $495,000
Parks and Recreation: $406,000
- Construction - General - Other: $5,799,000
Parks and Recreation: $3,688,000
Regular Highways: $3,337,000
Parks and Recreation: $1,915,000
Air Transportation: $1,520,000
Miscellaneous Commercial Activities - Other: $1,431,000
Air Transportation: $1,220,000
Miscellaneous Commercial Activities - Other: $1,090,000
General - Other: $765,000
Sea and Inland Port Facilities: $549,000
Sewerage: $502,000
Regular Highways: $458,000
Sea and Inland Port Facilities: $309,000
- Current Operations - Hospitals: $31,936,000
General - Other: $6,358,000
General - Other: $6,171,000
Correctional Institutions: $6,011,000
Police Protection: $5,610,000
Correctional Institutions: $5,158,000
Police Protection: $4,814,000
Regular Highways: $3,145,000
Judicial and Legal Services: $2,777,000
Judicial and Legal Services: $2,642,000
Financial Administration: $2,510,000
Regular Highways: $2,474,000
Central Staff Services: $2,329,000
Financial Administration: $2,301,000
Central Staff Services: $2,216,000
Air Transportation: $1,892,000
Miscellaneous Commercial Activities - Other: $1,664,000
Local Fire Protection: $1,603,000
Health - Other: $1,544,000
Health - Other: $1,456,000
General Public Buildings: $1,433,000
Miscellaneous Commercial Activities - Other: $1,402,000
Local Fire Protection: $1,375,000
General Public Buildings: $1,364,000
Solid Waste Management: $1,296,000
Air Transportation: $1,169,000
Sewerage: $1,108,000
Parks and Recreation: $988,000
Solid Waste Management: $979,000
Sea and Inland Port Facilities: $943,000
Sea and Inland Port Facilities: $942,000
Parks and Recreation: $846,000
Natural Resources - Other: $177,000
Natural Resources - Other: $175,000
Public Welfare - Other: $170,000
Public Welfare - Other: $164,000
Water Utilities: $142,000
Protective Inspection and Regulation - Other: $134,000
Protective Inspection and Regulation - Other: $115,000
- Federal Intergovernmental - Air Transportation: $1,906,000
Air Transportation: $360,000
- General - Interest on Debt: $1,039,000
Interest on Debt: $496,000
- Intergovernmental to Local - Other - Libraries: $1,377,000
Other - Libraries: $1,279,000
Other - Solid Waste Management: $1,260,000
Other - Other Higher Education: $1,088,000
Other - Other Higher Education: $1,024,000
Other - Solid Waste Management: $969,000
Other - Sewerage: $541,000
Other - Health - Other: $222,000
Other - Health - Other: $90,000
Other - General - Other: $25,000
Other - Central Staff Services: $20,000
Other - Central Staff Services: $9,000
- Local Intergovernmental - Health and Hospitals: $130,000
Other: $94,000
Health and Hospitals: $7,000
- Long Term Debt - Outstanding Unspecified Public Purpose: $25,660,000
Outstanding Unspecified Public Purpose: $24,112,000
Beginning Outstanding - Unspecified Public Purpose: $24,071,000
Issue, Unspecified Public Purpose: $13,000,000
Beginning Outstanding - Unspecified Public Purpose: $12,457,000
Issue, Unspecified Public Purpose: $3,061,000
Retired Unspecified Public Purpose: $1,472,000
Retired Unspecified Public Purpose: $1,345,000
- Miscellaneous - General Revenue - Other: $5,462,000
General Revenue - Other: $5,102,000
Interest Earnings: $917,000
Interest Earnings: $811,000
Sale of Property: $715,000
Fines and Forfeits: $686,000
Fines and Forfeits: $672,000
Sale of Property: $45,000
Donations From Private Sources: $37,000
- Other Capital Outlay - Miscellaneous Commercial Activities - Other: $2,406,000
Sea and Inland Port Facilities: $1,855,000
Miscellaneous Commercial Activities - Other: $1,779,000
Air Transportation: $1,728,000
Air Transportation: $1,411,000
Sea and Inland Port Facilities: $453,000
Parks and Recreation: $318,000
Sewerage: $182,000
Hospitals: $87,000
General - Other: $36,000
General - Other: $34,000
- Other Funds - Cash and Securities: $54,415,000
Cash and Securities: $53,265,000
- Revenue - Water Utilities: $671,000
- Short Term Debt Outstanding - End of Fiscal Year: $171,000
- Sinking Funds - Cash and Securities: $2,212,000
Cash and Securities: $596,000
- State Intergovernmental - Other: $10,057,000
Other: $4,917,000
Highways: $2,174,000
General Local Government Support: $1,382,000
General Local Government Support: $1,150,000
Highways: $458,000
Health and Hospitals: $261,000
Health and Hospitals: $188,000
Sewerage: $2,000
- Tax - Property: $25,896,000
Property: $24,927,000
Other License: $1,032,000
Other License: $931,000
Other Selective Sales: $245,000
Other Selective Sales: $233,000
- Total Salaries and Wages: $18,255,000
- Water Utilities - Interest on Debt: $61,000
Hancock County government finances - Revenue in 2020:
- Bond Funds - Cash and Securities: $11,619,000
- Charges - Hospital Public: $32,003,000
Miscellaneous Commercial Activities: $6,483,000
Miscellaneous Commercial Activities: $6,350,000
Other: $2,259,000
Sewerage: $2,253,000
Air Transportation: $2,082,000
Other: $2,025,000
Air Transportation: $1,889,000
Sea and Inland Port Facilities: $1,540,000
Sea and Inland Port Facilities: $1,378,000
Solid Waste Management: $674,000
Solid Waste Management: $648,000
Parks and Recreation: $495,000
Parks and Recreation: $406,000
- Construction - General - Other: $5,799,000
Parks and Recreation: $3,688,000
Regular Highways: $3,337,000
Parks and Recreation: $1,915,000
Air Transportation: $1,520,000
Miscellaneous Commercial Activities - Other: $1,431,000
Air Transportation: $1,220,000
Miscellaneous Commercial Activities - Other: $1,090,000
General - Other: $765,000
Sea and Inland Port Facilities: $549,000
Sewerage: $502,000
Regular Highways: $458,000
Sea and Inland Port Facilities: $309,000
- Current Operations - Hospitals: $31,936,000
General - Other: $6,358,000
General - Other: $6,171,000
Correctional Institutions: $6,011,000
Police Protection: $5,610,000
Correctional Institutions: $5,158,000
Police Protection: $4,814,000
Regular Highways: $3,145,000
Judicial and Legal Services: $2,777,000
Judicial and Legal Services: $2,642,000
Financial Administration: $2,510,000
Regular Highways: $2,474,000
Central Staff Services: $2,329,000
Financial Administration: $2,301,000
Central Staff Services: $2,216,000
Air Transportation: $1,892,000
Miscellaneous Commercial Activities - Other: $1,664,000
Local Fire Protection: $1,603,000
Health - Other: $1,544,000
Health - Other: $1,456,000
General Public Buildings: $1,433,000
Miscellaneous Commercial Activities - Other: $1,402,000
Local Fire Protection: $1,375,000
General Public Buildings: $1,364,000
Solid Waste Management: $1,296,000
Air Transportation: $1,169,000
Sewerage: $1,108,000
Parks and Recreation: $988,000
Solid Waste Management: $979,000
Sea and Inland Port Facilities: $943,000
Sea and Inland Port Facilities: $942,000
Parks and Recreation: $846,000
Natural Resources - Other: $177,000
Natural Resources - Other: $175,000
Public Welfare - Other: $170,000
Public Welfare - Other: $164,000
Water Utilities: $142,000
Protective Inspection and Regulation - Other: $134,000
Protective Inspection and Regulation - Other: $115,000
- Federal Intergovernmental - Air Transportation: $1,906,000
Air Transportation: $360,000
- General - Interest on Debt: $1,039,000
Interest on Debt: $496,000
- Intergovernmental to Local - Other - Libraries: $1,377,000
Other - Libraries: $1,279,000
Other - Solid Waste Management: $1,260,000
Other - Other Higher Education: $1,088,000
Other - Other Higher Education: $1,024,000
Other - Solid Waste Management: $969,000
Other - Sewerage: $541,000
Other - Health - Other: $222,000
Other - Health - Other: $90,000
Other - General - Other: $25,000
Other - Central Staff Services: $20,000
Other - Central Staff Services: $9,000
- Local Intergovernmental - Health and Hospitals: $130,000
Other: $94,000
Health and Hospitals: $7,000
- Long Term Debt - Outstanding Unspecified Public Purpose: $25,660,000
Outstanding Unspecified Public Purpose: $24,112,000
Beginning Outstanding - Unspecified Public Purpose: $24,071,000
Issue, Unspecified Public Purpose: $13,000,000
Beginning Outstanding - Unspecified Public Purpose: $12,457,000
Issue, Unspecified Public Purpose: $3,061,000
Retired Unspecified Public Purpose: $1,472,000
Retired Unspecified Public Purpose: $1,345,000
- Miscellaneous - General Revenue - Other: $5,462,000
General Revenue - Other: $5,102,000
Interest Earnings: $917,000
Interest Earnings: $811,000
Sale of Property: $715,000
Fines and Forfeits: $686,000
Fines and Forfeits: $672,000
Sale of Property: $45,000
Donations From Private Sources: $37,000
- Other Capital Outlay - Miscellaneous Commercial Activities - Other: $2,406,000
Sea and Inland Port Facilities: $1,855,000
Miscellaneous Commercial Activities - Other: $1,779,000
Air Transportation: $1,728,000
Air Transportation: $1,411,000
Sea and Inland Port Facilities: $453,000
Parks and Recreation: $318,000
Sewerage: $182,000
Hospitals: $87,000
General - Other: $36,000
General - Other: $34,000
- Other Funds - Cash and Securities: $54,415,000
Cash and Securities: $53,265,000
- Revenue - Water Utilities: $671,000
- Short Term Debt Outstanding - End of Fiscal Year: $171,000
- Sinking Funds - Cash and Securities: $2,212,000
Cash and Securities: $596,000
- State Intergovernmental - Other: $10,057,000
Other: $4,917,000
Highways: $2,174,000
General Local Government Support: $1,382,000
General Local Government Support: $1,150,000
Highways: $458,000
Health and Hospitals: $261,000
Health and Hospitals: $188,000
Sewerage: $2,000
- Tax - Property: $25,896,000
Property: $24,927,000
Other License: $1,032,000
Other License: $931,000
Other Selective Sales: $245,000
Other Selective Sales: $233,000
- Total Salaries and Wages: $18,255,000
- Water Utilities - Interest on Debt: $61,000
Hancock County government finances - Debt in 2020:
- Bond Funds - Cash and Securities: $11,619,000
- Charges - Hospital Public: $32,003,000
Miscellaneous Commercial Activities: $6,483,000
Miscellaneous Commercial Activities: $6,350,000
Other: $2,259,000
Sewerage: $2,253,000
Air Transportation: $2,082,000
Other: $2,025,000
Air Transportation: $1,889,000
Sea and Inland Port Facilities: $1,540,000
Sea and Inland Port Facilities: $1,378,000
Solid Waste Management: $674,000
Solid Waste Management: $648,000
Parks and Recreation: $495,000
Parks and Recreation: $406,000
- Construction - General - Other: $5,799,000
Parks and Recreation: $3,688,000
Regular Highways: $3,337,000
Parks and Recreation: $1,915,000
Air Transportation: $1,520,000
Miscellaneous Commercial Activities - Other: $1,431,000
Air Transportation: $1,220,000
Miscellaneous Commercial Activities - Other: $1,090,000
General - Other: $765,000
Sea and Inland Port Facilities: $549,000
Sewerage: $502,000
Regular Highways: $458,000
Sea and Inland Port Facilities: $309,000
- Current Operations - Hospitals: $31,936,000
General - Other: $6,358,000
General - Other: $6,171,000
Correctional Institutions: $6,011,000
Police Protection: $5,610,000
Correctional Institutions: $5,158,000
Police Protection: $4,814,000
Regular Highways: $3,145,000
Judicial and Legal Services: $2,777,000
Judicial and Legal Services: $2,642,000
Financial Administration: $2,510,000
Regular Highways: $2,474,000
Central Staff Services: $2,329,000
Financial Administration: $2,301,000
Central Staff Services: $2,216,000
Air Transportation: $1,892,000
Miscellaneous Commercial Activities - Other: $1,664,000
Local Fire Protection: $1,603,000
Health - Other: $1,544,000
Health - Other: $1,456,000
General Public Buildings: $1,433,000
Miscellaneous Commercial Activities - Other: $1,402,000
Local Fire Protection: $1,375,000
General Public Buildings: $1,364,000
Solid Waste Management: $1,296,000
Air Transportation: $1,169,000
Sewerage: $1,108,000
Parks and Recreation: $988,000
Solid Waste Management: $979,000
Sea and Inland Port Facilities: $943,000
Sea and Inland Port Facilities: $942,000
Parks and Recreation: $846,000
Natural Resources - Other: $177,000
Natural Resources - Other: $175,000
Public Welfare - Other: $170,000
Public Welfare - Other: $164,000
Water Utilities: $142,000
Protective Inspection and Regulation - Other: $134,000
Protective Inspection and Regulation - Other: $115,000
- Federal Intergovernmental - Air Transportation: $1,906,000
Air Transportation: $360,000
- General - Interest on Debt: $1,039,000
Interest on Debt: $496,000
- Intergovernmental to Local - Other - Libraries: $1,377,000
Other - Libraries: $1,279,000
Other - Solid Waste Management: $1,260,000
Other - Other Higher Education: $1,088,000
Other - Other Higher Education: $1,024,000
Other - Solid Waste Management: $969,000
Other - Sewerage: $541,000
Other - Health - Other: $222,000
Other - Health - Other: $90,000
Other - General - Other: $25,000
Other - Central Staff Services: $20,000
Other - Central Staff Services: $9,000
- Local Intergovernmental - Health and Hospitals: $130,000
Other: $94,000
Health and Hospitals: $7,000
- Long Term Debt - Outstanding Unspecified Public Purpose: $25,660,000
Outstanding Unspecified Public Purpose: $24,112,000
Beginning Outstanding - Unspecified Public Purpose: $24,071,000
Issue, Unspecified Public Purpose: $13,000,000
Beginning Outstanding - Unspecified Public Purpose: $12,457,000
Issue, Unspecified Public Purpose: $3,061,000
Retired Unspecified Public Purpose: $1,472,000
Retired Unspecified Public Purpose: $1,345,000
- Miscellaneous - General Revenue - Other: $5,462,000
General Revenue - Other: $5,102,000
Interest Earnings: $917,000
Interest Earnings: $811,000
Sale of Property: $715,000
Fines and Forfeits: $686,000
Fines and Forfeits: $672,000
Sale of Property: $45,000
Donations From Private Sources: $37,000
- Other Capital Outlay - Miscellaneous Commercial Activities - Other: $2,406,000
Sea and Inland Port Facilities: $1,855,000
Miscellaneous Commercial Activities - Other: $1,779,000
Air Transportation: $1,728,000
Air Transportation: $1,411,000
Sea and Inland Port Facilities: $453,000
Parks and Recreation: $318,000
Sewerage: $182,000
Hospitals: $87,000
General - Other: $36,000
General - Other: $34,000
- Other Funds - Cash and Securities: $54,415,000
Cash and Securities: $53,265,000
- Revenue - Water Utilities: $671,000
- Short Term Debt Outstanding - End of Fiscal Year: $171,000
- Sinking Funds - Cash and Securities: $2,212,000
Cash and Securities: $596,000
- State Intergovernmental - Other: $10,057,000
Other: $4,917,000
Highways: $2,174,000
General Local Government Support: $1,382,000
General Local Government Support: $1,150,000
Highways: $458,000
Health and Hospitals: $261,000
Health and Hospitals: $188,000
Sewerage: $2,000
- Tax - Property: $25,896,000
Property: $24,927,000
Other License: $1,032,000
Other License: $931,000
Other Selective Sales: $245,000
Other Selective Sales: $233,000
- Total Salaries and Wages: $18,255,000
- Water Utilities - Interest on Debt: $61,000
Hancock County government finances - Cash and Securities in 2020:
- Bond Funds - Cash and Securities: $11,619,000
- Charges - Hospital Public: $32,003,000
Miscellaneous Commercial Activities: $6,483,000
Miscellaneous Commercial Activities: $6,350,000
Other: $2,259,000
Sewerage: $2,253,000
Air Transportation: $2,082,000
Other: $2,025,000
Air Transportation: $1,889,000
Sea and Inland Port Facilities: $1,540,000
Sea and Inland Port Facilities: $1,378,000
Solid Waste Management: $674,000
Solid Waste Management: $648,000
Parks and Recreation: $495,000
Parks and Recreation: $406,000
- Construction - General - Other: $5,799,000
Parks and Recreation: $3,688,000
Regular Highways: $3,337,000
Parks and Recreation: $1,915,000
Air Transportation: $1,520,000
Miscellaneous Commercial Activities - Other: $1,431,000
Air Transportation: $1,220,000
Miscellaneous Commercial Activities - Other: $1,090,000
General - Other: $765,000
Sea and Inland Port Facilities: $549,000
Sewerage: $502,000
Regular Highways: $458,000
Sea and Inland Port Facilities: $309,000
- Current Operations - Hospitals: $31,936,000
General - Other: $6,358,000
General - Other: $6,171,000
Correctional Institutions: $6,011,000
Police Protection: $5,610,000
Correctional Institutions: $5,158,000
Police Protection: $4,814,000
Regular Highways: $3,145,000
Judicial and Legal Services: $2,777,000
Judicial and Legal Services: $2,642,000
Financial Administration: $2,510,000
Regular Highways: $2,474,000
Central Staff Services: $2,329,000
Financial Administration: $2,301,000
Central Staff Services: $2,216,000
Air Transportation: $1,892,000
Miscellaneous Commercial Activities - Other: $1,664,000
Local Fire Protection: $1,603,000
Health - Other: $1,544,000
Health - Other: $1,456,000
General Public Buildings: $1,433,000
Miscellaneous Commercial Activities - Other: $1,402,000
Local Fire Protection: $1,375,000
General Public Buildings: $1,364,000
Solid Waste Management: $1,296,000
Air Transportation: $1,169,000
Sewerage: $1,108,000
Parks and Recreation: $988,000
Solid Waste Management: $979,000
Sea and Inland Port Facilities: $943,000
Sea and Inland Port Facilities: $942,000
Parks and Recreation: $846,000
Natural Resources - Other: $177,000
Natural Resources - Other: $175,000
Public Welfare - Other: $170,000
Public Welfare - Other: $164,000
Water Utilities: $142,000
Protective Inspection and Regulation - Other: $134,000
Protective Inspection and Regulation - Other: $115,000
- Federal Intergovernmental - Air Transportation: $1,906,000
Air Transportation: $360,000
- General - Interest on Debt: $1,039,000
Interest on Debt: $496,000
- Intergovernmental to Local - Other - Libraries: $1,377,000
Other - Libraries: $1,279,000
Other - Solid Waste Management: $1,260,000
Other - Other Higher Education: $1,088,000
Other - Other Higher Education: $1,024,000
Other - Solid Waste Management: $969,000
Other - Sewerage: $541,000
Other - Health - Other: $222,000
Other - Health - Other: $90,000
Other - General - Other: $25,000
Other - Central Staff Services: $20,000
Other - Central Staff Services: $9,000
- Local Intergovernmental - Health and Hospitals: $130,000
Other: $94,000
Health and Hospitals: $7,000
- Long Term Debt - Outstanding Unspecified Public Purpose: $25,660,000
Outstanding Unspecified Public Purpose: $24,112,000
Beginning Outstanding - Unspecified Public Purpose: $24,071,000
Issue, Unspecified Public Purpose: $13,000,000
Beginning Outstanding - Unspecified Public Purpose: $12,457,000
Issue, Unspecified Public Purpose: $3,061,000
Retired Unspecified Public Purpose: $1,472,000
Retired Unspecified Public Purpose: $1,345,000
- Miscellaneous - General Revenue - Other: $5,462,000
General Revenue - Other: $5,102,000
Interest Earnings: $917,000
Interest Earnings: $811,000
Sale of Property: $715,000
Fines and Forfeits: $686,000
Fines and Forfeits: $672,000
Sale of Property: $45,000
Donations From Private Sources: $37,000
- Other Capital Outlay - Miscellaneous Commercial Activities - Other: $2,406,000
Sea and Inland Port Facilities: $1,855,000
Miscellaneous Commercial Activities - Other: $1,779,000
Air Transportation: $1,728,000
Air Transportation: $1,411,000
Sea and Inland Port Facilities: $453,000
Parks and Recreation: $318,000
Sewerage: $182,000
Hospitals: $87,000
General - Other: $36,000
General - Other: $34,000
- Other Funds - Cash and Securities: $54,415,000
Cash and Securities: $53,265,000
- Revenue - Water Utilities: $671,000
- Short Term Debt Outstanding - End of Fiscal Year: $171,000
- Sinking Funds - Cash and Securities: $2,212,000
Cash and Securities: $596,000
- State Intergovernmental - Other: $10,057,000
Other: $4,917,000
Highways: $2,174,000
General Local Government Support: $1,382,000
General Local Government Support: $1,150,000
Highways: $458,000
Health and Hospitals: $261,000
Health and Hospitals: $188,000
Sewerage: $2,000
- Tax - Property: $25,896,000
Property: $24,927,000
Other License: $1,032,000
Other License: $931,000
Other Selective Sales: $245,000
Other Selective Sales: $233,000
- Total Salaries and Wages: $18,255,000
- Water Utilities - Interest on Debt: $61,000
Supplemental Security Income (SSI) in 2006:
- Total number of recipients: 978
- Number of aged recipients: 82
- Number of blind and disabled recipients: 896
- Number of recipients under 18: 135
- Number of recipients between 18 and 64: 659
- Number of recipients older than 64: 184
- Number of recipients also receiving OASDI: 379
- Amount of payments (thousands of dollars): 402
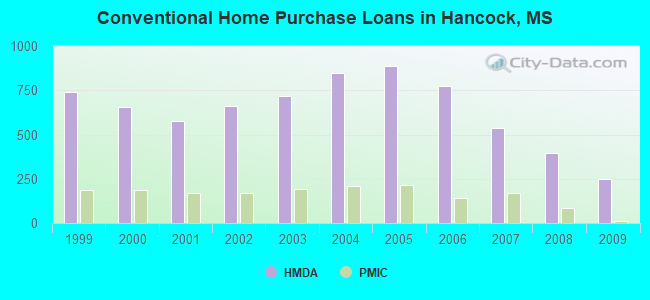
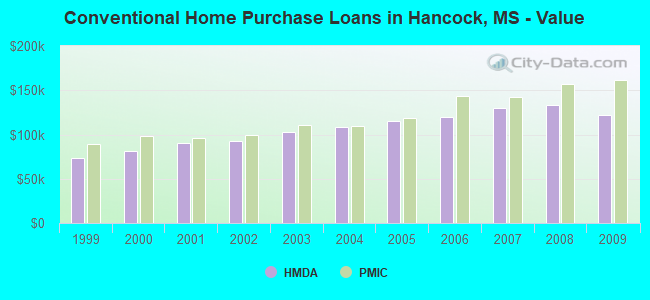
| Home Mortgage Disclosure Act Aggregated Statistics For Year 2009 (Based on 6 full tracts) | ||||||||||||||
| A) FHA, FSA/RHS & VA Home Purchase Loans | B) Conventional Home Purchase Loans | C) Refinancings | D) Home Improvement Loans | E) Loans on Dwellings For 5+ Families | F) Non-occupant Loans on < 5 Family Dwellings (A B C & D) | G) Loans On Manufactured Home Dwelling (A B C & D) | ||||||||
|---|---|---|---|---|---|---|---|---|---|---|---|---|---|---|
| Number | Average Value | Number | Average Value | Number | Average Value | Number | Average Value | Number | Average Value | Number | Average Value | Number | Average Value | |
| LOANS ORIGINATED | 114 | $139,658 | 249 | $122,008 | 622 | $154,241 | 154 | $40,727 | 1 | $3,750,000 | 205 | $154,420 | 41 | $40,488 |
| APPLICATIONS APPROVED, NOT ACCEPTED | 7 | $124,286 | 31 | $130,839 | 73 | $131,562 | 14 | $75,143 | 0 | $0 | 27 | $132,074 | 8 | $52,375 |
| APPLICATIONS DENIED | 44 | $132,568 | 109 | $98,037 | 359 | $139,964 | 98 | $35,929 | 0 | $0 | 93 | $115,699 | 54 | $49,556 |
| APPLICATIONS WITHDRAWN | 26 | $117,385 | 44 | $115,182 | 191 | $144,696 | 24 | $42,958 | 0 | $0 | 33 | $126,788 | 9 | $66,111 |
| FILES CLOSED FOR INCOMPLETENESS | 13 | $131,308 | 17 | $126,353 | 61 | $144,148 | 3 | $136,667 | 0 | $0 | 5 | $129,000 | 5 | $73,800 |
| Private Mortgage Insurance Companies Aggregated Statistics For Year 2009 (Based on 5 full tracts) | ||||||
| A) Conventional Home Purchase Loans | B) Refinancings | C) Non-occupant Loans on < 5 Family Dwellings (A & B) | ||||
|---|---|---|---|---|---|---|
| Number | Average Value | Number | Average Value | Number | Average Value | |
| LOANS ORIGINATED | 14 | $161,929 | 23 | $172,304 | 5 | $134,600 |
| APPLICATIONS APPROVED, NOT ACCEPTED | 8 | $176,750 | 13 | $207,308 | 12 | $188,417 |
| APPLICATIONS DENIED | 3 | $217,667 | 6 | $189,333 | 1 | $270,000 |
| APPLICATIONS WITHDRAWN | 1 | $289,000 | 1 | $270,000 | 1 | $270,000 |
| FILES CLOSED FOR INCOMPLETENESS | 3 | $195,667 | 3 | $194,333 | 2 | $168,500 |
| Most common first names in Hancock County, MS among deceased individuals | ||
| Name | Count | Lived (average) |
|---|---|---|
| John | 252 | 72.8 years |
| William | 189 | 71.7 years |
| Mary | 168 | 76.1 years |
| Joseph | 159 | 73.0 years |
| James | 158 | 70.1 years |
| Robert | 147 | 69.0 years |
| Charles | 118 | 71.6 years |
| Thomas | 94 | 72.1 years |
| Edward | 89 | 74.3 years |
| George | 86 | 72.1 years |
| Most common last names in Hancock County, MS among deceased individuals | ||
| Last name | Count | Lived (average) |
|---|---|---|
| Ladner | 128 | 72.7 years |
| Smith | 100 | 73.7 years |
| Necaise | 67 | 70.0 years |
| Favre | 58 | 73.9 years |
| Williams | 55 | 73.8 years |
| Cuevas | 55 | 70.5 years |
| Johnson | 54 | 74.7 years |
| Bourgeois | 50 | 74.3 years |
| Davis | 40 | 75.8 years |
| Moran | 38 | 72.5 years |
| Businesses in Hancock County, MS | ||||
| Name | Count | Name | Count | |
|---|---|---|---|---|
| AT&T | 2 | Lowe's | 1 | |
| Ace Hardware | 1 | MasterBrand Cabinets | 4 | |
| Advance Auto Parts | 1 | McDonald's | 2 | |
| AutoZone | 1 | Pizza Hut | 1 | |
| Burger King | 2 | Popeyes | 1 | |
| Circle K | 1 | RadioShack | 1 | |
| Dairy Queen | 1 | Rite Aid | 1 | |
| Domino's Pizza | 1 | SONIC Drive-In | 1 | |
| Econo Lodge | 1 | Sears | 1 | |
| FedEx | 4 | T-Mobile | 2 | |
| Ford | 1 | Taco Bell | 1 | |
| GNC | 1 | U-Haul | 4 | |
| GameStop | 1 | UPS | 2 | |
| H&R Block | 2 | Waffle House | 3 | |
| KFC | 1 | Walgreens | 1 | |
| Kmart | 1 | Walmart | 1 | |
| Knights Inn | 1 | |||
Hancock County on our top lists:
- #5 on the list of "Top 101 counties with the highest percentage of residents that smoked 100+ cigarettes in their lives"
- #19 on the list of "Top 101 counties with the highest percentage of residents that drank alcohol in the past 30 days"
- #43 on the list of "Top 101 counties with the worst general health status score of residents (1-5), 3 years of data"
- #55 on the list of "Top 101 counties with the lowest percentage of residents that exercised in the past month"
- #83 on the list of "Top 101 counties with the highest average weight of females"