Grant County, Arkansas (AR)
County owner-occupied free and clear houses and condos in 2010: 2,221
County owner-occupied houses and condos in 2000: 5,005
Renter-occupied apartments: 1,549 (it was 1,236 in 2000)
| % of renters here: | 20% |
| State: | 33% |
Land area: 632 sq. mi.
Water area: 1.2 sq. mi.
Population density: 29 people per square mile (low).
Industries providing employment: Educational, health and social services (23.0%), Manufacturing (15.7%), Retail trade (10.0%).
Type of workers:
- Private wage or salary: 72%
- Government: 23%
- Self-employed, not incorporated: 5%
- Unpaid family work: 0%
- OSM Map
- General Map
- Google Map
- MSN Map

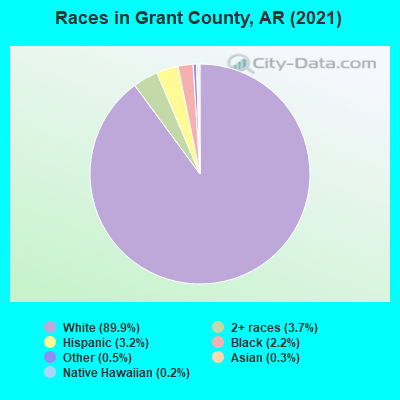
- 16,05489.7%White Non-Hispanic Alone
- 6063.4%Hispanic or Latino
- 5643.2%Two or more races
- 4442.5%Black Non-Hispanic Alone
- 1120.6%Some other race alone
- 650.4%Asian alone
- 280.2%Native Hawaiian and Other
Pacific Islander alone - 190.1%American Indian and Alaska Native alone
| Median resident age: | 40.7 years |
| Arkansas median age: | 38.9 years |
| Males: 9,158 | |
| Females: 9,025 |

 | Potential Move to Little Rock - Schools and Neighborhoods (18 replies) |
| My First Weekend in Little Rock (31 replies) |
| Grant County: | 2.0 people |
| Arkansas: | 2 people |
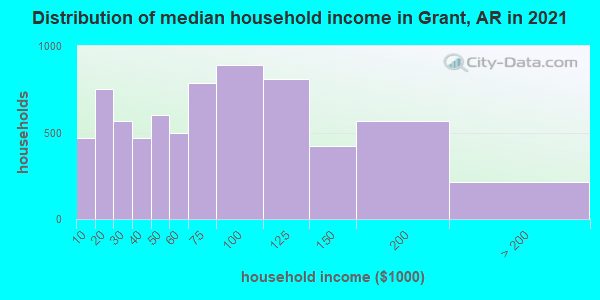
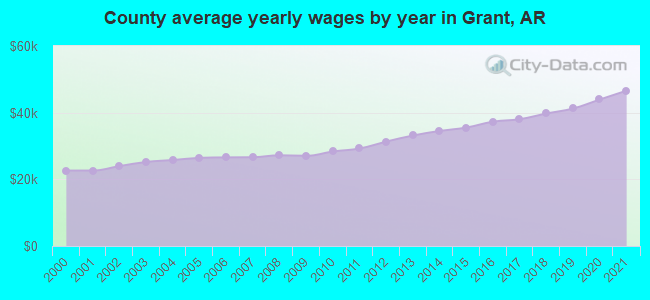
Estimated median household income in 2022: $67,498 ($37,182 in 1999)
| This county: | $67,498 |
| Arkansas: | $55,432 |
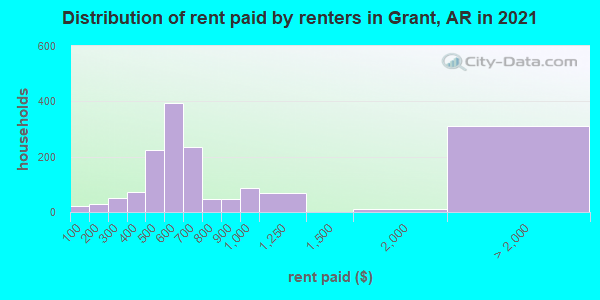
Median contract rent in 2022 for apartments: $575 (lower quartile is $475, upper quartile is $731)
| This county: | $575 |
| State: | $654 |
Estimated median house or condo value in 2022: $156,550 (it was $60,800 in 2000)
| Grant: | $156,550 |
| Arkansas: | $179,800 |
Mean price in 2022:
Median monthly housing costs for homes and condos with a mortgage: $1,308Detached houses: $203,986
Here: $203,986 State: $243,881 Townhouses or other attached units: $210,122
Here: $210,122 State: $244,376 Mobile homes: $79,429
Here: $79,429 State: $79,566 Occupied boats, RVs, vans, etc.: $377,833
Here: $377,833 State: $127,304
Median monthly housing costs for units without a mortgage: $381
Institutionalized population: 143
Crime in 2021 (reported by the sheriff's office or county police, not the county total):
- Murders: 0
- Rapes: 1
- Robberies: 0
- Assaults: 33
- Burglaries: 49
- Thefts: 107
- Auto thefts: 23
Crime in 2020 (reported by the sheriff's office or county police, not the county total):
- Murders: 0
- Rapes: 5
- Robberies: 2
- Assaults: 12
- Burglaries: 37
- Thefts: 164
- Auto thefts: 11
Health of residents in Grant County based on CDC Behavioral Risk Factor Surveillance System Survey Questionnaires from 2013 to 2021:
General health status score of residents in this county from 1 (poor) to 5 (excellent) is 3.3. This is significantly worse than average.66.1% of residents exercised in the past month. This is less than average.
44.3% of residents smoked 100+ cigarettes in their lives. This is about average.
41.7% of adult residents drank alcohol in the past 30 days. This is less than average.
68.0% of residents visited a dentist within the past year. This is about average.
Average weight of males is 201 pounds. This is more than average.
Average weight of females is 167 pounds. This is more than average.
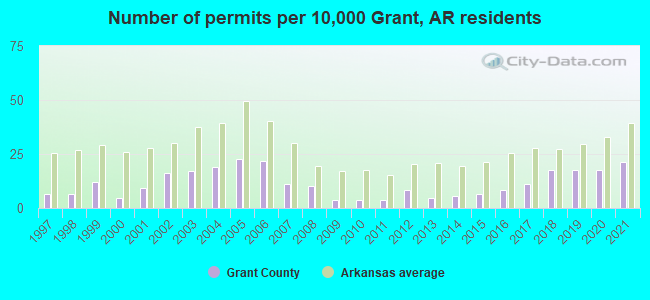
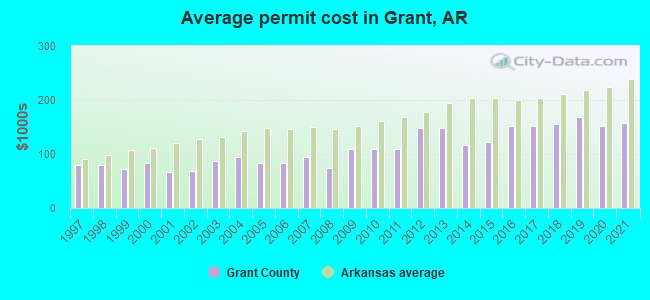
Single-family new house construction building permits:
- 2022: 30 buildings, average cost: $155,300
- 2021: 35 buildings, average cost: $156,500
- 2020: 29 buildings, average cost: $151,900
- 2019: 29 buildings, average cost: $167,900
- 2018: 29 buildings, average cost: $155,800
- 2017: 18 buildings, average cost: $150,600
- 2016: 14 buildings, average cost: $152,000
- 2015: 11 buildings, average cost: $121,700
- 2014: 9 buildings, average cost: $115,800
- 2013: 8 buildings, average cost: $147,900
- 2012: 14 buildings, average cost: $148,100
- 2011: 6 buildings, average cost: $109,800
- 2010: 6 buildings, average cost: $109,800
- 2009: 6 buildings, average cost: $109,800
- 2008: 17 buildings, average cost: $73,500
- 2007: 18 buildings, average cost: $95,300
- 2006: 36 buildings, average cost: $84,300
- 2005: 37 buildings, average cost: $84,300
- 2004: 31 buildings, average cost: $95,400
- 2003: 28 buildings, average cost: $86,700
- 2002: 27 buildings, average cost: $68,600
- 2001: 15 buildings, average cost: $66,900
- 2000: 8 buildings, average cost: $82,900
- 1999: 20 buildings, average cost: $73,400
- 1998: 11 buildings, average cost: $78,900
- 1997: 11 buildings, average cost: $78,900
Median real estate property taxes paid for housing units with mortgages in 2022: $1,006 (0.5%)
Median real estate property taxes paid for housing units with no mortgage in 2022: $548 (0.5%)

| Grant County: | 14.0% |
| Arkansas: | 16.8% |
Median age of residents in 2022: 40.7 years old
(Males: 38.7 years old, Females: 43.6 years old)
(Median age for: White residents: 42.6 years old, Black residents: 45.2 years old, American Indian residents: 68.0 years old, Asian residents: 34.0 years old, Hispanic or Latino residents: 25.5 years old, Other race residents: 29.7 years old)
Fair market rent in 2006 for a 1-bedroom apartment in Grant County is $382 a month.
Fair market rent for a 2-bedroom apartment is $466 a month.
Fair market rent for a 3-bedroom apartment is $675 a month.
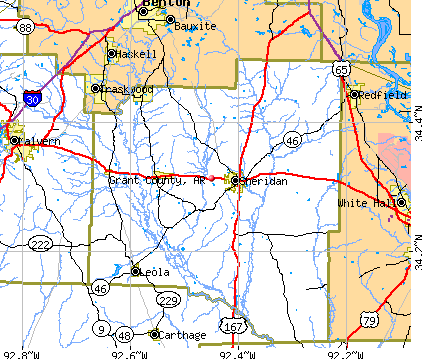
Cities in this county include: Sheridan, Leola, Tull, Prattsville, Poyen.
Notable locations in this county outside city limits:
Notable locations in Grant County: Adamsburg Landing (A), Camp Ta-Lo-Ha (B), Cedar Hill (C), Greenleaf Landing (D), Plainview Gate (E), National Center for Toxicological Research (F), Tucker Prison Farm (G), Woodlawn Country Club (H), Dexter Gate (I), Warbritton Gate (J), Stark Gate (K), Pine Bluff Disposal Landfill (L), Southeast Volunteer Fire Department (M), Tucker State Prison (N), Tucker Volunteer Fire Station (O), White Bluff Power Plant (P), Pine Bluff Arsenal (Q), Wright - Pastoria Volunteer Fire Department (R), Hardin Fire Department (S), Highway 15 Volunteer Fire Department (T). Display/hide their locations on the map
Churches in Grant County include: Travelers Rest Church (A), Union Church (B), Wabbaseka Church (C), Watkins Chapel (D), Wattensaw Church (E), Wheeler Chapel (F), Whiteville Church (G), Antioch Church (H), Barnes Chapel (I). Display/hide their locations on the map
Cemeteries: Smith Cemetery (1), Tucker Cemetery (2), Langford Cemetery (3), Atkins Cemetery (4), Lee Cemetery (5), Blackman Cemetery (6), Blackwell Cemetery (7). Display/hide their locations on the map
Lakes, reservoirs, and swamps: Dudley Lake (A), Dilly Pond (B), Brushy Lake (C), Brean Lake (D), Mud Lake (E), Felix Pond (F), Big Grassy Brake (G), Willow Lake (H). Display/hide their locations on the map
Streams, rivers, and creeks: Mile Branch (A), Love Creek (B), Long Pond Creek (C), Little Cypress Bayou (D), Little Bayou Meto (E), Lipscomb Branch (F), Ledbetter Creek (G), Kings Bayou (H), Jackson Creek (I). Display/hide their locations on the map
Parks in Grant County include: Lock and Dam Number 5 Public Use Area (1), Sheppard Island Public Use Area (2), Rising Star Public Use Area (3), Trulock Public Use Area (4), Tar Camp Public Use Area (5), Lock (6), Little Bayou Meto Park (7), Bayou Meto Public Use Area (8). Display/hide their locations on the map
Neighboring counties: Fairfield County, South Carolina  , Harmon County, Oklahoma
  , Lancaster County, South Carolina , Love County, Oklahoma , Fulton County, Georgia , Hart County, Georgia .
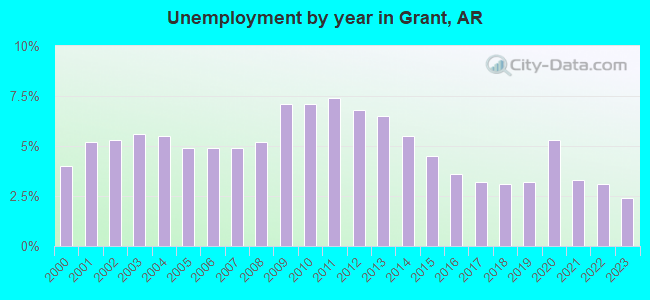
| Here: | 2.9% |
| Arkansas: | 3.4% |
Current college students: 539
People 25 years of age or older with a high school degree or higher: 92.6%
People 25 years of age or older with a bachelor's degree or higher: 18.8%
Number of foreign born residents: 310 (25.0% naturalized citizens)
| Grant County: | 1.7% |
| Whole state: | 5.1% |
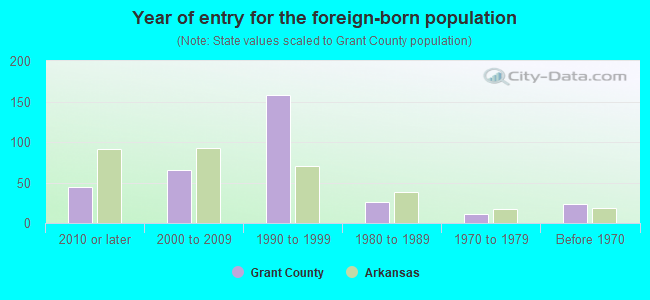
- Year of entry for the foreign-born population
- 472010 or later
- 432000 to 2009
- 1531990 to 1999
- 261980 to 1989
- 111970 to 1979
- 23Before 1970
Mean travel time to work (commute): minutes
Percentage of county residents living and working in this county: 100.1%
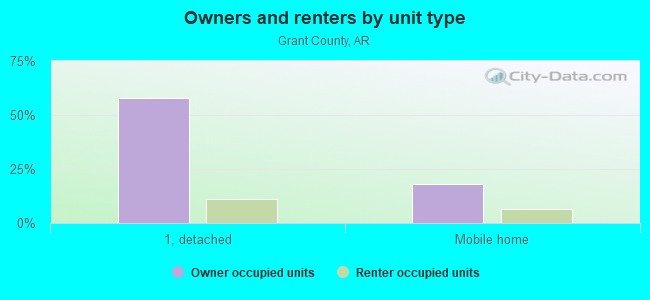
Housing units in structures:
- One, detached: 5,348
- One, attached: 71
- Two: 108
- 3 or 4: 32
- 5 to 9: 17
- 10 to 19: 76
- 20 to 49: 98
- 50 or more: 129
- Mobile homes: 2,031
- Boats, RVs, vans, etc.: 121
Housing units in Grant County with a mortgage: 2,779 (172 second mortgage, 0 home equity loan, 119 both second mortgage and home equity loan)
Houses without a mortgage: 44
| Here: | 4.3% with mortgage |
| State: | 98.4% with mortgage |
Religion statistics for Grant County
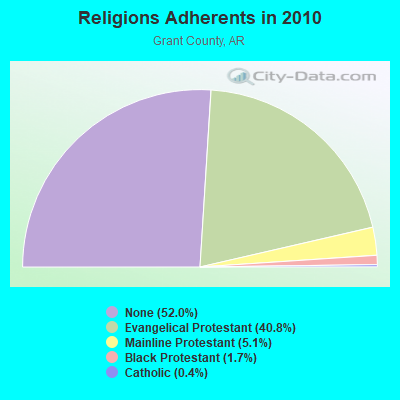
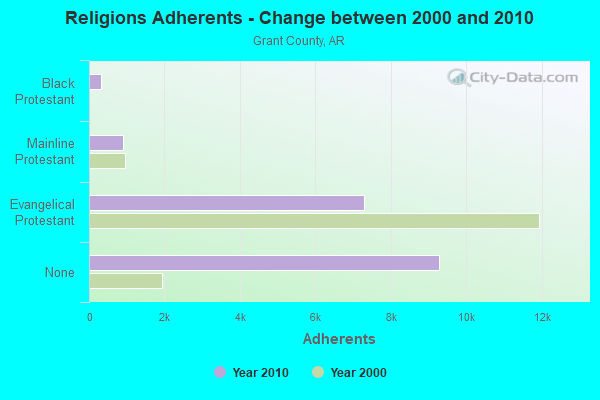
| Religion | Adherents | Congregations |
|---|---|---|
| Evangelical Protestant | 7,283 | 38 |
| Mainline Protestant | 904 | 8 |
| Black Protestant | 307 | 2 |
| Catholic | 68 | 1 |
| Other | - | 1 |
| None | 9,291 | - |
Source: Clifford Grammich, Kirk Hadaway, Richard Houseal, Dale E.Jones, Alexei Krindatch, Richie Stanley and Richard H.Taylor. 2012. 2010 U.S.Religion Census: Religious Congregations & Membership Study. Association of Statisticians of American Religious Bodies. Jones, Dale E., et al. 2002. Congregations and Membership in the United States 2000. Nashville, TN: Glenmary Research Center.
Food Environment Statistics:
| Grant County: | 2.29 / 10,000 pop. |
| State: | 2.02 / 10,000 pop. |
| This county: | 0.57 / 10,000 pop. |
| Arkansas: | 0.59 / 10,000 pop. |
| Grant County: | 5.73 / 10,000 pop. |
| Arkansas: | 4.94 / 10,000 pop. |
| This county: | 4.01 / 10,000 pop. |
| State: | 6.66 / 10,000 pop. |
| Grant County: | 9.3% |
| Arkansas: | 9.8% |
| Grant County: | 30.5% |
| State: | 29.1% |
| Here: | 10.0% |
| State: | 13.6% |
Agriculture in Grant County:
Average size of farms: 147 acresAverage value of agricultural products sold per farm: $24,180
Average value of crops sold per acre for harvested cropland: $109.36
The value of livestock, poultry, and their products as a percentage of the total market value of agricultural products sold: 82.01%
Average total farm production expenses per farm: $18,236
Harvested cropland as a percentage of land in farms: 27.13%
Average market value of all machinery and equipment per farm: $28,799
The percentage of farms operated by a family or individual: 95.62%
Average age of principal farm operators: 55 years
Average number of cattle and calves per 100 acres of all land in farms: 27.03
Vegetables: 195 harvested acres
Tornado activity:
Grant County historical area-adjusted tornado activity is significantly below Arkansas state average. It is 2411209.1 times below overall U.S. average.Tornadoes in this county have caused one fatality and 11 injuries recorded between 1950 and 2004.
On 4/21/1955, a category 2 (max. wind speeds 113-157 mph) tornado killed one person and injured 2 people and caused between $5000 and $50,000 in damages.
Earthquake activity:
Grant County-area historical earthquake activity is significantly above Arkansas state average. It is 453% greater than the overall U.S. average.On 11/6/2011 at 03:53:10, a magnitude 5.7 (5.7 MW, Depth: 3.2 mi, Class: Moderate, Intensity: VI - VII) earthquake occurred 258.8 miles away from Grant County center
On 1/21/1982 at 00:33:54, a magnitude 4.7 (4.5 MB, 4.7 LG, 4.5 LG, Class: Light, Intensity: IV - V) earthquake occurred 61.0 miles away from the county center
On 5/4/2001 at 06:42:12, a magnitude 4.7 (4.2 MB, 4.7 LG, 4.5 LG) earthquake occurred 63.5 miles away from the county center
On 2/28/2011 at 05:00:50, a magnitude 4.7 (4.7 MW, Depth: 2.0 mi) earthquake occurred 66.5 miles away from the county center
On 9/3/2016 at 12:02:44, a magnitude 5.8 (5.8 MW, Depth: 3.5 mi) earthquake occurred 291.8 miles away from Grant County center
On 3/25/1976 at 00:41:20, a magnitude 5.0 (4.9 MB, 5.0 LG) earthquake occurred 151.3 miles away from the county center
Magnitude types: regional Lg-wave magnitude (LG), body-wave magnitude (MB), moment magnitude (MW)
Most recent natural disasters:
- Arkansas Severe Storms And Straight-line Winds, Incident Period: April 12, 2020, Major Disaster (Presidential) Declared DR-4556-AR: July 10, 2020, FEMA Id: 4556, Natural disaster type: Storm, Wind
- Arkansas Covid-19 Pandemic, Incident Period: January 20, 2020, FEMA Id: 4518, Natural disaster type: Other
- Arkansas Severe Winter Storm, Incident Period: December 25, 2012 to December 26, 2012, Major Disaster (Presidential) Declared DR-4100: January 29, 2013, FEMA Id: 4100, Natural disaster type: Winter Storm
- Arkansas Severe Storms and Flooding, Incident Period: December 23, 2009 to January 02, 2010, Major Disaster (Presidential) Declared DR-1872: February 04, 2010, FEMA Id: 1872, Natural disaster type: Storm, Flood
- Arkansas Severe Storms, Tornadoes, and Flooding, Incident Period: October 29, 2009 to November 08, 2009, Major Disaster (Presidential) Declared DR-1861: December 03, 2009, FEMA Id: 1861, Natural disaster type: Storm, Tornado, Flood
- Arkansas Severe Storms and Flooding associated with Hurricane Gustav, Incident Period: September 02, 2008 to September 08, 2008, Major Disaster (Presidential) Declared DR-1793: September 18, 2008, FEMA Id: 1793, Natural disaster type: Storm, Hurricane, Flood
- Arkansas Severe Storms, Flooding, and Tornadoes, Incident Period: May 02, 2008 to May 12, 2008, Major Disaster (Presidential) Declared DR-1758: May 20, 2008, FEMA Id: 1758, Natural disaster type: Storm, Tornado, Flood
- Arkansas Hurricane Katrina, Incident Period: August 29, 2005 to October 01, 2005, Emergency Declared EM-3215: September 02, 2005, FEMA Id: 3215, Natural disaster type: Hurricane
- Arkansas Severe Winter Storm, Incident Period: December 12, 2000 to January 08, 2001, Major Disaster (Presidential) Declared DR-1354: December 29, 2000, FEMA Id: 1354, Natural disaster type: Winter Storm
- Arkansas Severe Winter Storm, Incident Period: December 12, 2000 to January 08, 2001, Emergency Declared EM-3159: December 28, 2000, FEMA Id: 3159, Natural disaster type: Winter Storm
- 3 other natural disasters have been reported since 1953.
The number of natural disasters in Grant County (13) is near the US average (15).
Major Disasters (Presidential) Declared: 10
Emergencies Declared: 2
Causes of natural disasters: Storms: 8, Floods: 7, Tornadoes: 4, Winter Storms: 3, Hurricanes: 2, Winds: 2, Other: 1 (Note: some incidents may be assigned to more than one category).
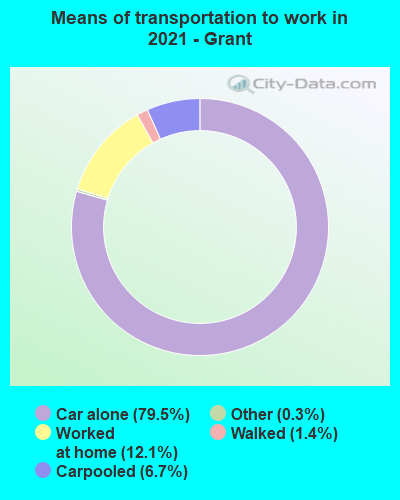
Means of transportation to work:
- Drove a car alone: 3,836 (73.2%)
- Carpooled: 435 (8.3%)
- Taxicab, motorcycle, or other means: 33 (0.6%)
- Walked: 96 (1.8%)
- Worked at home: 958 (18.3%)

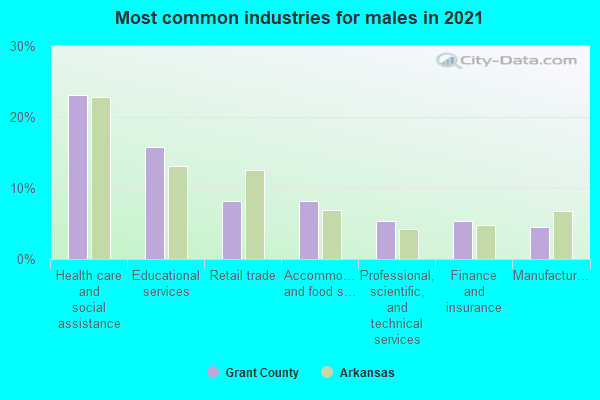
- Health care and social assistance (23%)
- Educational services (15%)
- Retail trade (8%)
- Manufacturing (7%)
- Professional, scientific, and technical services (6%)
- Accommodation and food services (5%)
- Finance and insurance (5%)
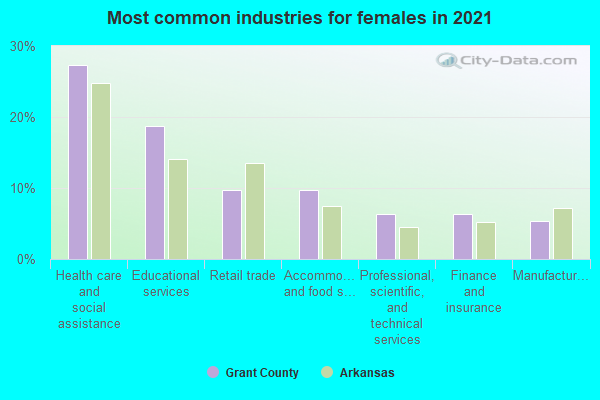
- Health care and social assistance (28%)
- Educational services (18%)
- Retail trade (10%)
- Manufacturing (9%)
- Professional, scientific, and technical services (8%)
- Accommodation and food services (7%)
- Finance and insurance (6%)
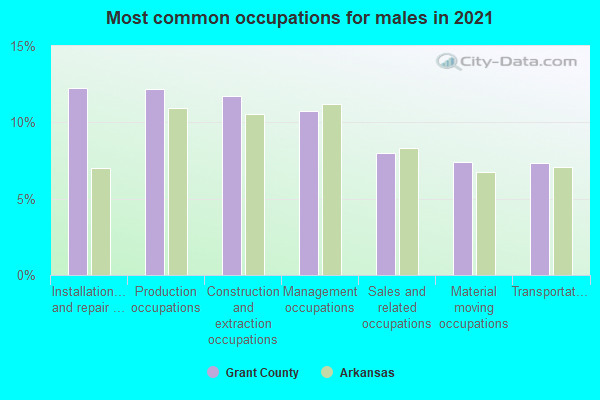
- Production occupations (12%)
- Installation, maintenance, and repair occupations (12%)
- Management occupations (11%)
- Construction and extraction occupations (10%)
- Sales and related occupations (9%)
- Material moving occupations (8%)
- Transportation occupations (7%)
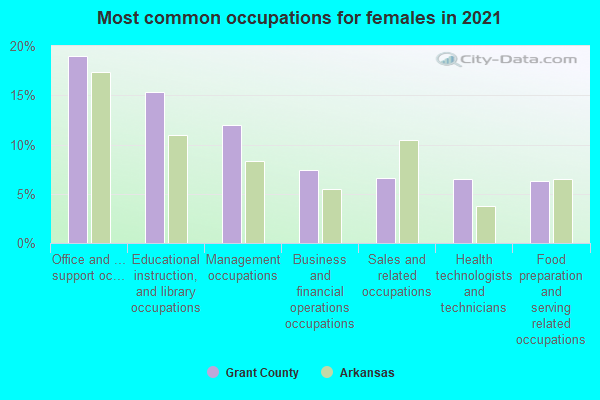
- Office and administrative support occupations (20%)
- Educational instruction, and library occupations (14%)
- Management occupations (9%)
- Business and financial operations occupations (8%)
- Sales and related occupations (7%)
- Health technologists and technicians (7%)
- Food preparation and serving related occupations (5%)
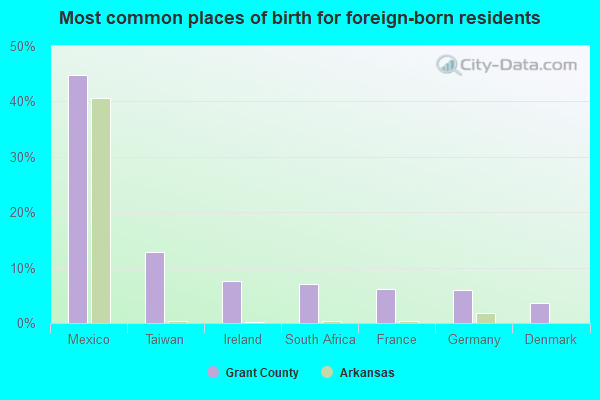
- Mexico (39%)
- Taiwan (18%)
- Ireland (10%)
- South Africa (7%)
- Denmark (5%)
- Germany (5%)
- France (4%)

- English (41%)
- American (28%)
- Irish (5%)
- German (4%)
- European (2%)
- African (1%)
- Scottish (1%)

63 people in local jails and other municipal confinement facilities
People in group quarters in Grant County, Arkansas in 2000:
- 96 people in nursing homes
- 69 people in local jails and other confinement facilities (including police lockups)
- 16 people in other noninstitutional group quarters
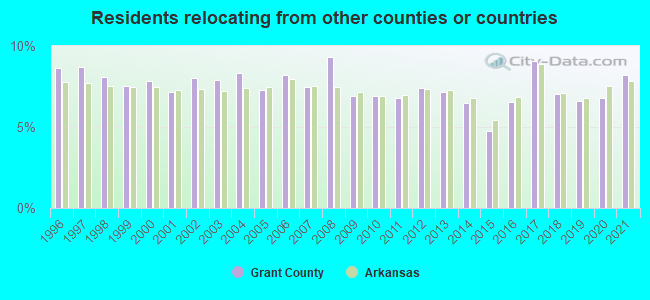
8.19% of this county's 2021 resident taxpayers lived in other counties in 2020 ($49,979 average adjusted gross income)
| Here: | 8.19% |
| Arkansas average: | 7.82% |
10 or fewer of this county's residents moved from foreign countries.
6.79% relocated from other counties in Arkansas ($41,294 average AGI)
1.40% relocated from other states ($8,685 average AGI)
Grant County: 1.40% Arkansas average: 3.41%
Top counties from which taxpayers relocated into this county between 2020 and 2021:
| from Saline County, AR | |
| from Jefferson County, AR | |
| from Pulaski County, AR | |
| from Hot Spring County, AR |
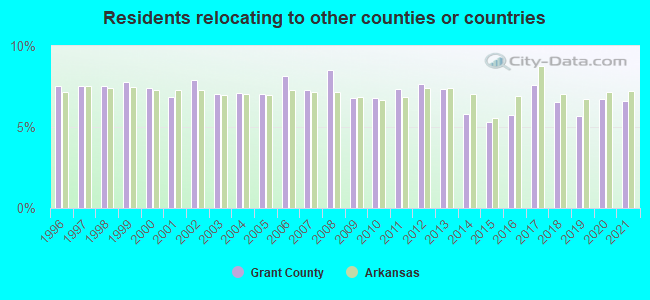
6.62% of this county's 2020 resident taxpayers moved to other counties in 2021 ($46,930 average adjusted gross income)
| Here: | 6.62% |
| Arkansas average: | 7.23% |
10 or fewer of this county's residents moved to foreign countries.
5.96% relocated to other counties in Arkansas ($42,157 average AGI)
0.66% relocated to other states ($4,771 average AGI)
Grant County: 0.66% Arkansas average: 2.79%
Top counties to which taxpayers relocated from this county between 2020 and 2021:
| to Saline County, AR | |
| to Pulaski County, AR | |
| to Jefferson County, AR | |
| to Hot Spring County, AR |
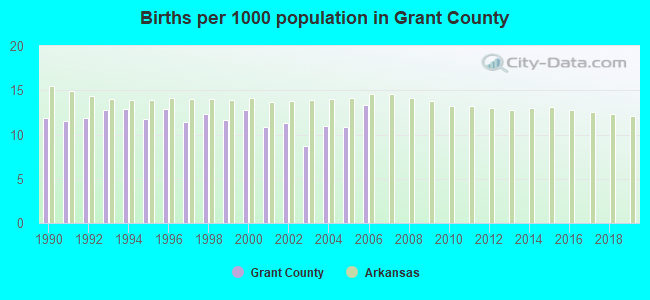
Births per 1000 population from 1990 to 1999: 12.1
Births per 1000 population from 2000 to 2006: 11.3
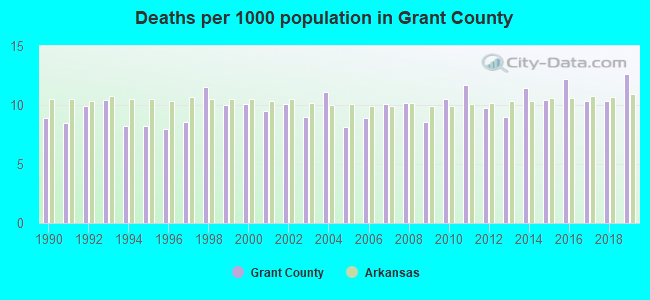
Deaths per 1000 population from 1990 to 1999: 9.2
Deaths per 1000 population from 2000 to 2009: 9.6
Deaths per 1000 population from 2010 to 2020: 10.9
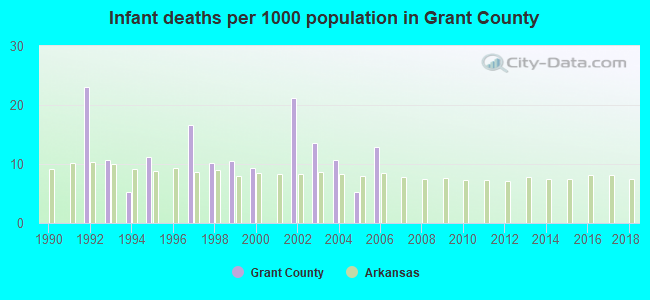
Infant deaths per 1000 live births from 1990 to 1999: 8.7
Infant deaths per 1000 live births from 2000 to 2006: 10.4
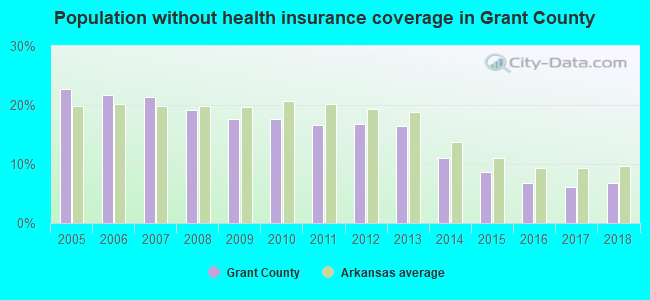
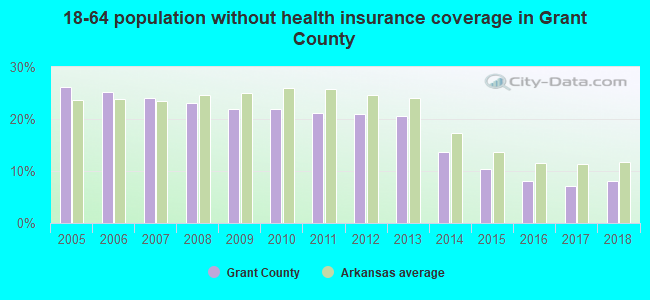
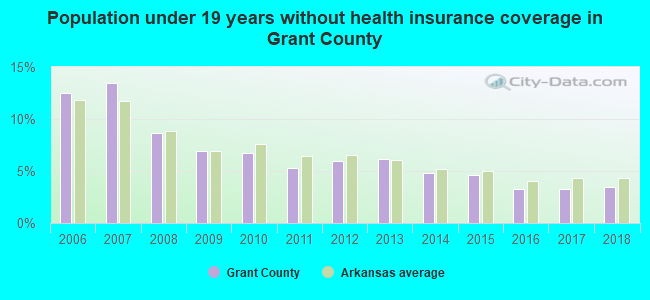
Persons under 19 years old without health insurance coverage in 2018: 3.5%
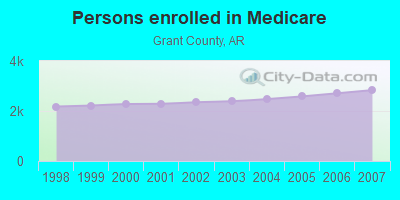
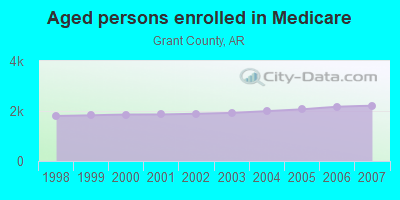
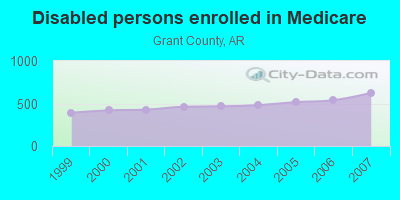
Persons enrolled in hospital insurance and/or supplemental medical insurance (Medicare) in July 1, 2007: 2,835 (2,210 aged, 625 disabled)
Children under 18 without health insurance coverage in 2007: 548 (13%)
Most common underlying causes of death in Grant County, Arkansas in 1999 - 2019:
- Acute myocardial infarction, unspecified (278)
- Bronchus or lung, unspecified - Malignant neoplasms (275)
- Chronic obstructive pulmonary disease, unspecified (140)
- Atherosclerotic heart disease (71)
- Other ill-defined and unspecified causes of mortality (48)
- Stroke, not specified as haemorrhage or infarction (46)
- Alzheimer disease, unspecified (24)
- Congestive heart failure (23)
- Unspecified dementia (22)
Population without health insurance coverage in 2000: 12%
Children under 18 without health insurance coverage in 2000: 9%
Household type by relationship:
Households: 18,183- Male householders: 3,933 (1,058 living alone), Female householders: 3,176 (962 living alone)
3,767 spouses (3,755 opposite-sex spouses), 183 unmarried partners, (166 opposite-sex unmarried partners), 5,426 children (4,970 natural, 48 adopted, 417 stepchildren), 531 grandchildren, 102 brothers or sisters, 204 parents, 0 foster children, 346 other relatives, 361 non-relatives
- In group quarters: 164
Size of family households: 2,317 2-persons, 1,298 3-persons, 876 4-persons, 233 5-persons, 186 6-persons, 21 7-or-more-persons.
Size of nonfamily households: 2,017 1-person, 132 2-persons, 17 3-persons.
2,376 married couples with children.
979 single-parent households (204 men, 775 women).
97.1% of residents of Grant speak English at home.
2.6% of residents speak Spanish at home (93% speak English very well, 4% speak English well, 3% speak English not well).
0.2% of residents speak other Indo-European language at home (100% speak English very well).
0.1% of residents speak Asian or Pacific Island language at home (100% speak English very well).
In fiscal year 2004:
Federal Government expenditure: $101,203,000 ($5,870 per capita)
Department of Defense expenditure: $5,891,000
Federal direct payments to individuals for retirement and disability: $42,315,000
Federal other direct payments to individuals: $14,796,000
Federal direct payments not to individuals: $5,000
Federal grants: $37,490,000
Federal procurement contracts: $698,000 ($26,000 Department of Defense)
Federal salaries and wages: $5,898,000 ($3,762,000 Department of Defense)
Federal Government direct loans: $864,000
Federal guaranteed/insured loans: $5,441,000
Federal Government insurance: $2,770,000
Population change from April 1, 2000 to July 1, 2005:
Births: 892| Here: | 51 per 1000 residents |
| State: | 72 per 1000 residents |
Deaths: 816
| Here: | 47 per 1000 residents |
| State: | 53 per 1000 residents |
Net international migration: +10
| Here: | +1 per 1000 residents |
| State: | +8 per 1000 residents |
Net internal migration: +822
| Here: | +47 per 1000 residents |
| State: | +13 per 1000 residents |

Total withdrawal of fresh water for public supply: 1.20 millions of gallons per day (all from ground)
| Here: | 6.1 |
| State: | 6.1 |
| Here: | 4.6 |
| State: | 4.3 |

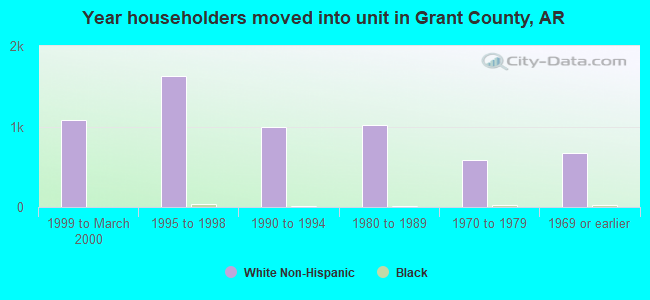
- Year house built in Grant County, Arkansas
- 262020 or later
- 1,3372010 to 2019
- 1,1842000 to 2009
- 1,4541990 to 1999
- 1,5081980 to 1989
- 1,2731970 to 1979
- 5681960 to 1969
- 2361950 to 1959
- 1031940 to 1949
- 2681939 or earlier
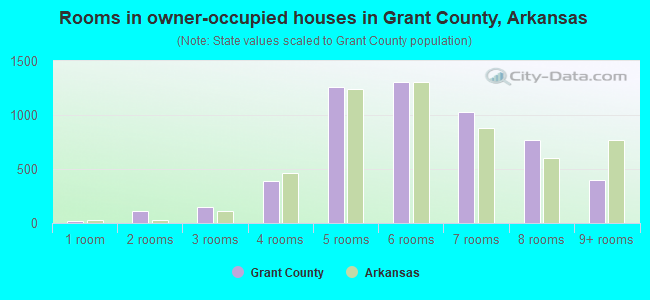
- Rooms in owner-occupied houses in Grant County, Arkansas
- 171 room
- 1002 rooms
- 1443 rooms
- 5244 rooms
- 1,3585 rooms
- 1,3536 rooms
- 1,0467 rooms
- 8018 rooms
- 4039+ rooms
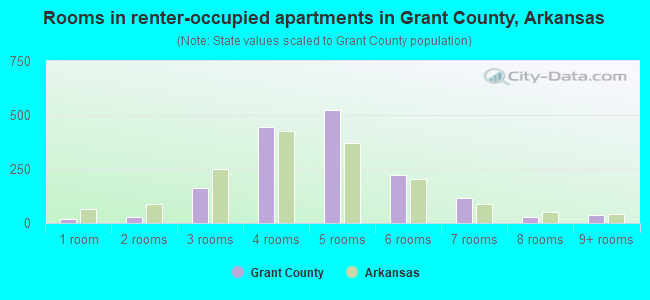
- Rooms in renter-occupied apartments in Grant County, Arkansas
- 211 room
- 192 rooms
- 1423 rooms
- 4574 rooms
- 4385 rooms
- 1316 rooms
- 1237 rooms
- 128 rooms
- 319+ rooms

- Bedrooms in owner-occupied houses in Grant County, Arkansas
- 18no bedroom
- 1761 bedroom
- 8502 bedrooms
- 3,7743 bedrooms
- 7764 bedrooms
- 1405+ bedrooms
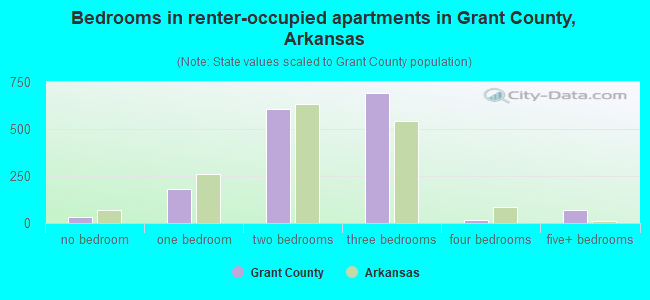
- Bedrooms in renter-occupied apartments in Grant County, Arkansas
- 40no bedroom
- 2201 bedroom
- 5282 bedrooms
- 4813 bedrooms
- 424 bedrooms
- 685+ bedrooms
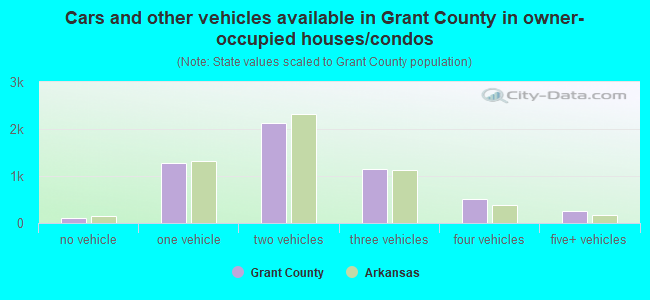
- Cars and other vehicles available in Grant County in owner-occupied houses/condos
- 88no vehicle
- 1,2441 vehicle
- 2,5522 vehicles
- 1,1873 vehicles
- 3814 vehicles
- 2845+ vehicles
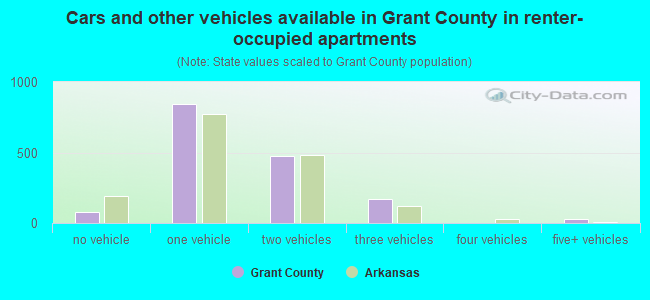
- Cars and other vehicles available in Grant County in renter-occupied apartments
- 95no vehicle
- 7801 vehicle
- 3602 vehicles
- 1293 vehicles
- 114 vehicles
- 45+ vehicles
89.0% of Grant County residents lived in the same house 1 years ago.
Out of people who lived in different houses, 32% lived in this county.
Out of people who lived in different counties, 83% lived in Arkansas.
| Grant County: | 89.0% |
| State average: | 87.0% |
Place of birth for U.S.-born residents:
- This state: 13,482
- Other state: 4,145
- Northeast: 192
- Midwest: 1,062
- South: 2,187
- West: 700
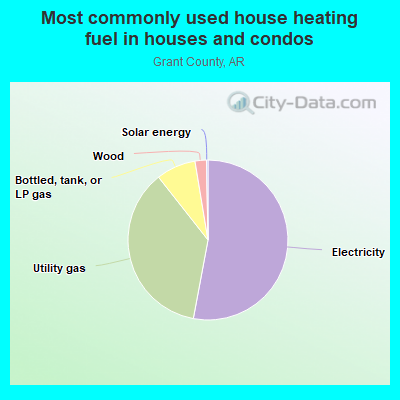
- 51.8%Electricity
- 36.0%Utility gas
- 8.2%Bottled, tank, or LP gas
- 3.6%Wood
- 0.2%Solar energy
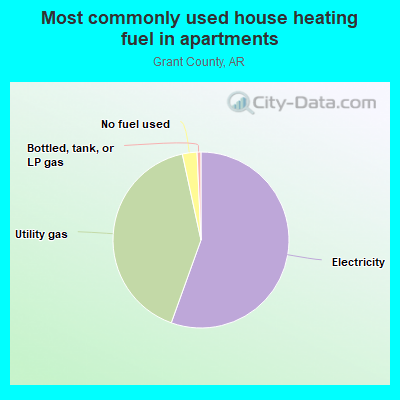
- 51.3%Electricity
- 45.0%Utility gas
- 2.4%No fuel used
- 0.7%Bottled, tank, or LP gas
- 0.6%Wood
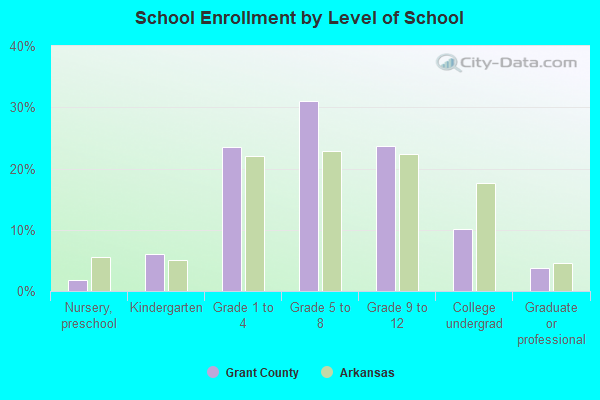
Private vs. public school enrollment:
| Here: | 9.3% |
| Arkansas: | 10.5% |
| Here: | 7.6% |
| Arkansas: | 8.7% |
| Here: | 24.9% |
| Arkansas: | 19.4% |


Grant County government finances - Expenditure in 2017:
- Charges - Other: $448,000
Solid Waste Management: $388,000
- Current Operations - Regular Highways: $2,200,000
Police Protection: $1,667,000
Financial Administration: $699,000
General - Other: $681,000
Central Staff Services: $450,000
Solid Waste Management: $390,000
Judicial and Legal Services: $301,000
Health - Other: $198,000
Parks and Recreation: $197,000
Correctional Institutions: $157,000
General Public Buildings: $82,000
Public Welfare - Other: $61,000
Air Transportation: $3,000
- Federal Intergovernmental - General Local Government Support: $18,000
Highways: $6,000
Other: $1,000
- General - Interest on Debt: $1,000
- Long Term Debt - Beginning Outstanding - Unspecified Public Purpose: $37,000
Outstanding Unspecified Public Purpose: $22,000
Retired Unspecified Public Purpose: $15,000
- Miscellaneous - General Revenue - Other: $897,000
Fines and Forfeits: $472,000
Donations From Private Sources: $44,000
Interest Earnings: $18,000
Rents: $2,000
- Other Funds - Cash and Securities: $5,646,000
- State Intergovernmental - Highways: $1,355,000
General Local Government Support: $687,000
Other: $73,000
- Tax - General Sales and Gross Receipts: $2,139,000
Property: $1,529,000
Grant County government finances - Revenue in 2017:
- Charges - Other: $448,000
Solid Waste Management: $388,000
- Current Operations - Regular Highways: $2,200,000
Police Protection: $1,667,000
Financial Administration: $699,000
General - Other: $681,000
Central Staff Services: $450,000
Solid Waste Management: $390,000
Judicial and Legal Services: $301,000
Health - Other: $198,000
Parks and Recreation: $197,000
Correctional Institutions: $157,000
General Public Buildings: $82,000
Public Welfare - Other: $61,000
Air Transportation: $3,000
- Federal Intergovernmental - General Local Government Support: $18,000
Highways: $6,000
Other: $1,000
- General - Interest on Debt: $1,000
- Long Term Debt - Beginning Outstanding - Unspecified Public Purpose: $37,000
Outstanding Unspecified Public Purpose: $22,000
Retired Unspecified Public Purpose: $15,000
- Miscellaneous - General Revenue - Other: $897,000
Fines and Forfeits: $472,000
Donations From Private Sources: $44,000
Interest Earnings: $18,000
Rents: $2,000
- Other Funds - Cash and Securities: $5,646,000
- State Intergovernmental - Highways: $1,355,000
General Local Government Support: $687,000
Other: $73,000
- Tax - General Sales and Gross Receipts: $2,139,000
Property: $1,529,000
Grant County government finances - Debt in 2017:
- Charges - Other: $448,000
Solid Waste Management: $388,000
- Current Operations - Regular Highways: $2,200,000
Police Protection: $1,667,000
Financial Administration: $699,000
General - Other: $681,000
Central Staff Services: $450,000
Solid Waste Management: $390,000
Judicial and Legal Services: $301,000
Health - Other: $198,000
Parks and Recreation: $197,000
Correctional Institutions: $157,000
General Public Buildings: $82,000
Public Welfare - Other: $61,000
Air Transportation: $3,000
- Federal Intergovernmental - General Local Government Support: $18,000
Highways: $6,000
Other: $1,000
- General - Interest on Debt: $1,000
- Long Term Debt - Beginning Outstanding - Unspecified Public Purpose: $37,000
Outstanding Unspecified Public Purpose: $22,000
Retired Unspecified Public Purpose: $15,000
- Miscellaneous - General Revenue - Other: $897,000
Fines and Forfeits: $472,000
Donations From Private Sources: $44,000
Interest Earnings: $18,000
Rents: $2,000
- Other Funds - Cash and Securities: $5,646,000
- State Intergovernmental - Highways: $1,355,000
General Local Government Support: $687,000
Other: $73,000
- Tax - General Sales and Gross Receipts: $2,139,000
Property: $1,529,000
Grant County government finances - Cash and Securities in 2017:
- Charges - Other: $448,000
Solid Waste Management: $388,000
- Current Operations - Regular Highways: $2,200,000
Police Protection: $1,667,000
Financial Administration: $699,000
General - Other: $681,000
Central Staff Services: $450,000
Solid Waste Management: $390,000
Judicial and Legal Services: $301,000
Health - Other: $198,000
Parks and Recreation: $197,000
Correctional Institutions: $157,000
General Public Buildings: $82,000
Public Welfare - Other: $61,000
Air Transportation: $3,000
- Federal Intergovernmental - General Local Government Support: $18,000
Highways: $6,000
Other: $1,000
- General - Interest on Debt: $1,000
- Long Term Debt - Beginning Outstanding - Unspecified Public Purpose: $37,000
Outstanding Unspecified Public Purpose: $22,000
Retired Unspecified Public Purpose: $15,000
- Miscellaneous - General Revenue - Other: $897,000
Fines and Forfeits: $472,000
Donations From Private Sources: $44,000
Interest Earnings: $18,000
Rents: $2,000
- Other Funds - Cash and Securities: $5,646,000
- State Intergovernmental - Highways: $1,355,000
General Local Government Support: $687,000
Other: $73,000
- Tax - General Sales and Gross Receipts: $2,139,000
Property: $1,529,000
Supplemental Security Income (SSI) in 2006:
- Total number of recipients: 342
- Number of aged recipients: 32
- Number of blind and disabled recipients: 310
- Number of recipients under 18: 73
- Number of recipients between 18 and 64: 197
- Number of recipients older than 64: 72
- Number of recipients also receiving OASDI: 132
- Amount of payments (thousands of dollars): 144
| Most common first names in Grant County, AR among deceased individuals | ||
| Name | Count | Lived (average) |
|---|---|---|
| James | 451 | 72.1 years |
| William | 349 | 74.9 years |
| John | 347 | 74.1 years |
| Mary | 279 | 78.3 years |
| Robert | 202 | 71.8 years |
| Charles | 161 | 72.8 years |
| George | 161 | 75.7 years |
| Thomas | 98 | 75.4 years |
| Joe | 94 | 74.8 years |
| Ruby | 93 | 78.0 years |
| Most common last names in Grant County, AR among deceased individuals | ||
| Last name | Count | Lived (average) |
|---|---|---|
| Smith | 213 | 75.4 years |
| Williams | 147 | 77.2 years |
| Wilson | 113 | 75.4 years |
| Johnson | 111 | 75.5 years |
| Davis | 111 | 75.2 years |
| Jones | 105 | 76.0 years |
| Brown | 100 | 72.1 years |
| Moore | 89 | 76.9 years |
| Taylor | 76 | 75.2 years |
| White | 69 | 74.9 years |
| Businesses in Grant County, AR | ||||
| Name | Count | Name | Count | |
|---|---|---|---|---|
| AT&T | 3 | Little Caesars Pizza | 1 | |
| Advance Auto Parts | 1 | MasterBrand Cabinets | 3 | |
| Applebee's | 1 | Maurices | 1 | |
| Arby's | 1 | McDonald's | 3 | |
| AutoZone | 1 | New Balance | 3 | |
| Baskin-Robbins | 3 | Nike | 3 | |
| Burger King | 2 | Office Depot | 1 | |
| Chevrolet | 1 | Payless | 1 | |
| Cricket Wireless | 1 | Pizza Hut | 1 | |
| Days Inn | 1 | Popeyes | 1 | |
| FedEx | 4 | RadioShack | 2 | |
| Ford | 1 | SONIC Drive-In | 4 | |
| GNC | 1 | Sears | 1 | |
| H&R Block | 2 | Starbucks | 1 | |
| Hardee's | 1 | Subway | 3 | |
| Home Depot | 1 | T-Mobile | 1 | |
| IHOP | 1 | Taco Bell | 1 | |
| JCPenney | 1 | U-Haul | 2 | |
| Jones New York | 1 | UPS | 6 | |
| KFC | 1 | Verizon Wireless | 1 | |
| Kroger | 1 | Walgreens | 1 | |
| La-Z-Boy | 1 | Walmart | 2 | |
| Lane Furniture | 2 | Wendy's | 1 | |