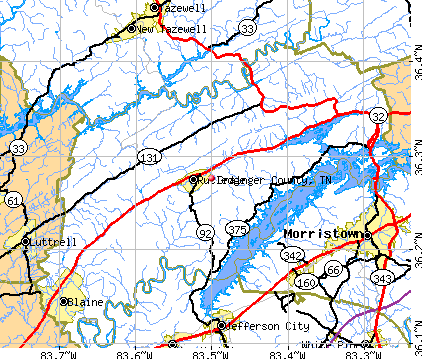
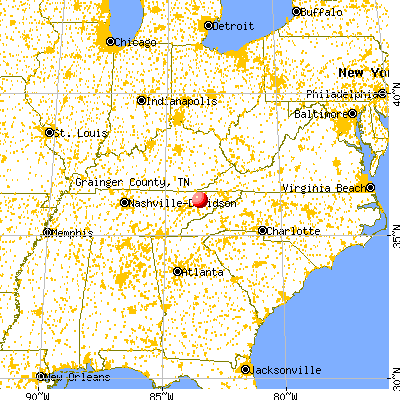
Grainger County, Tennessee (TN)
County owner-occupied free and clear houses and condos in 2010: 3,703
County owner-occupied houses and condos in 2000: 6,917
Renter-occupied apartments: 1,727 (it was 1,353 in 2000)
| % of renters here: | 16% |
| State: | 32% |
Land area: 280 sq. mi.
Water area: 22.1 sq. mi.
Population density: 86 people per square mile (average).
Industries providing employment: Educational, health and social services (21.0%), Manufacturing (19.9%), Retail trade (12.2%).
Type of workers:
- Private wage or salary: 78%
- Government: 12%
- Self-employed, not incorporated: 11%
- Unpaid family work: 0%
- OSM Map
- General Map
- Google Map
- MSN Map

- 22,19792.2%White Non-Hispanic Alone
- 9243.8%Hispanic or Latino
- 5482.3%Two or more races
- 2130.9%Black Non-Hispanic Alone
- 1070.4%Native Hawaiian and Other
Pacific Islander alone - 320.1%American Indian and Alaska Native alone
- 220.09%Asian alone
- 220.09%Some other race alone

| Median resident age: | 46.0 years |
| Tennessee median age: | 39.2 years |
| Males: 12,176 | |
| Females: 11,907 |

 | COVID-19 in Tennessee (237 replies) |
| Gigabit internet coming to Cookeville (40 replies) |
| Fruits and vegetables in Tennessee (7 replies) |
| Another Post Asking for Location Info! (6 replies) |
| Tennessee Population Estimates 2016 (28 replies) |
| Granger / Hawkins County Info needed? (25 replies) |
| Grainger County: | 2.0 people |
| Tennessee: | 2 people |
Estimated median household income in 2022: $47,994 ($27,997 in 1999)
| This county: | $47,994 |
| Tennessee: | $65,254 |
Median contract rent in 2022 for apartments: $515 (lower quartile is $344, upper quartile is $784)
| This county: | $515 |
| State: | $884 |
Estimated median house or condo value in 2022: $185,531 (it was $65,200 in 2000)
| Grainger: | $185,531 |
| Tennessee: | $284,800 |
Mean price in 2022:
Median monthly housing costs for homes and condos with a mortgage: $1,150Detached houses: $298,546
Here: $298,546 State: $374,382 Townhouses or other attached units: $172,174
Here: $172,174 State: $354,101 Mobile homes: $84,814
Here: $84,814 State: $101,421 Occupied boats, RVs, vans, etc.: $54,184
Here: $54,184 State: $142,822
Median monthly housing costs for units without a mortgage: $329
Institutionalized population: 149
Crime in 2021 (reported by the sheriff's office or county police, not the county total):
- Murders: 2
- Rapes: 3
- Robberies: 0
- Assaults: 18
- Burglaries: 33
- Thefts: 102
- Auto thefts: 47
Crime in 2020 (reported by the sheriff's office or county police, not the county total):
- Murders: 0
- Rapes: 0
- Robberies: 1
- Assaults: 62
- Burglaries: 32
- Thefts: 119
- Auto thefts: 32
Single-family new house construction building permits:
- 2022: 69 buildings, average cost: $180,600
- 2021: 82 buildings, average cost: $180,500
- 2020: 66 buildings, average cost: $175,900
- 2019: 57 buildings, average cost: $229,100
- 2018: 58 buildings, average cost: $183,200
- 2017: 47 buildings, average cost: $177,000
- 2016: 41 buildings, average cost: $177,200
- 2015: 37 buildings, average cost: $177,300
- 2014: 2 buildings, average cost: $215,600
- 2013: 1 building, cost: $205,200
- 2012: 0 buildings
- 2011: 0 buildings
- 2010: 2 buildings, average cost: $180,100
- 2009: 2 buildings, average cost: $180,100
- 2008: 6 buildings, average cost: $176,400
- 2007: 5 buildings, average cost: $167,600
- 2006: 4 buildings, average cost: $157,000
- 2005: 3 buildings, average cost: $136,700
- 2004: 3 buildings, average cost: $136,700
- 2003: 0 buildings
- 2002: 0 buildings
- 2001: 0 buildings
- 2000: 0 buildings
- 1999: 0 buildings
- 1998: 0 buildings
- 1997: 0 buildings


Median real estate property taxes paid for housing units with mortgages in 2022: $961 (0.4%)
Median real estate property taxes paid for housing units with no mortgage in 2022: $632 (0.4%)


| Grainger County: | 16.7% |
| Tennessee: | 13.3% |
Median age of residents in 2022: 46.0 years old
(Males: 44.1 years old, Females: 47.1 years old)
(Median age for: White residents: 47.2 years old, Black residents: 29.0 years old, American Indian residents: 52.0 years old, Asian residents: 78.2 years old, Hispanic or Latino residents: 28.0 years old, Other race residents: 39.0 years old)
Area name: Morristown, TN MSA
Fair market rent in 2006 for a 1-bedroom apartment in Grainger County is $394 a month.
Fair market rent for a 2-bedroom apartment is $473 a month.
Fair market rent for a 3-bedroom apartment is $620 a month.
Cities in this county include: Bean Station, Washburn, Blaine, Thorn Hill, Rutledge.
Notable locations in this county outside city limits:
Notable locations in Grainger County: Highrock Camp (A), Fox Cabin (B), Doak Cabin (C), Clear Creek Mill (D), Courtland Place (E), Cross Anchor (F), Paint Creek Campground (G), Jockey (H), Wadders Picnic Area (I), Overlook Picnic Area (J), Moses Turn Picnic Area (K), Love Road Picnic Area (L), Dudley Falls Picnic Area (M), Horse Creek Picnic Area (N), Nolichucky Golf Club (O), Link HIlls Country Club (P), Greene County Industrial Park (Q), Rader and Rader Dairy Farm (R), Twin Creek Golf Course (S), Greensville Water Supply (T). Display/hide their locations on the map
Churches in Grainger County include: Fairview Church (A), Sinai Church (B), Sinking Springs Church (C), Providence Church (D), Quaker Knobs Church (E), Doty Chapel (F), Speedwell Church (G), Stone Dam Church (H), Liberty Church (I). Display/hide their locations on the map
Cemeteries: Susong Cemetery (1), Pleasant Vale Cumberland Presbyterian Cemetery (2), Kesterson Cemetery (3), Mount Olive Cemetery (4), Beersheba Cemetery (5), Rehobeth Cemetery (6), Mount Tabor Cemetery (7). Display/hide their locations on the map
Lakes and reservoirs: Birdwell Pond (A), Easterly Pond (B), Ricker Pond (C), Kidwell Pond (D), Combs Pond (E), Scruggs Pond (F), Burkey Pond (G), Hogan Pond (H). Display/hide their locations on the map
Streams, rivers, and creeks: Long Fork (A), Lollar Branch (B), Lick Slough (C), Lick Branch (D), Kite Creek (E), Kidwell Branch (F), Kelly Branch (G), Cobble Branch (H), Slate Creek (I). Display/hide their locations on the map
Parks in Grainger County include: Paint Creek Recreation Area (1), Andrew Johnson Wildlife Management Area (2), Old Forge Recreation Area (3). Display/hide their locations on the map
Neighboring counties: Cheatham County  , Chowan County, North Carolina
  , Izard County, Arkansas , Knox County
  , Martin County, North Carolina , Rogers County, Oklahoma .
| Here: | 3.2% |
| Tennessee: | 3.0% |


Current college students: 523
People 25 years of age or older with a high school degree or higher: 81.0%
People 25 years of age or older with a bachelor's degree or higher: 14.1%
Number of foreign born residents: 722 (36.4% naturalized citizens)
| Grainger County: | 3.0% |
| Whole state: | 5.6% |

- Year of entry for the foreign-born population
- 602010 or later
- 2892000 to 2009
- 2431990 to 1999
- 161980 to 1989
- 61970 to 1979
- 46Before 1970
Mean travel time to work (commute): minutes
Percentage of county residents living and working in this county: 97.1%
Housing units in structures:
- One, detached: 7,538
- One, attached: 49
- Two: 20
- 3 or 4: 171
- 5 to 9: 130
- 10 to 19: 197
- 20 to 49: 18
- 50 or more: 28
- Mobile homes: 3,564
- Boats, RVs, vans, etc.: 168
Housing units in Grainger County with a mortgage: 2,933 (131 second mortgage, 0 home equity loan, 104 both second mortgage and home equity loan)
Houses without a mortgage: 47
| Here: | 4.1% with mortgage |
| State: | 97.8% with mortgage |
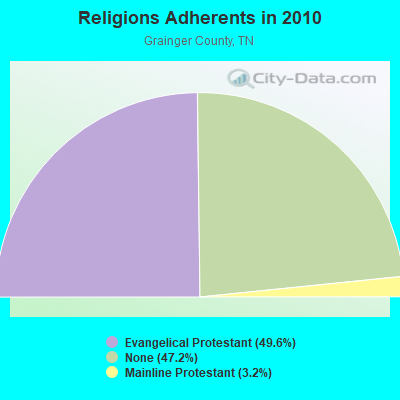
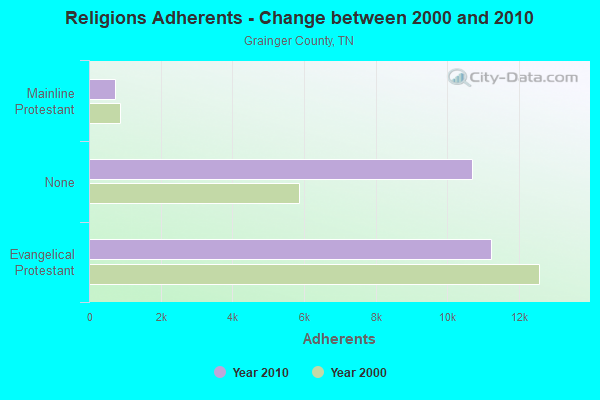
Religion statistics for Grainger County
| Religion | Adherents | Congregations |
|---|---|---|
| Evangelical Protestant | 11,233 | 48 |
| Mainline Protestant | 728 | 10 |
| Other | 5 | 1 |
| Catholic | - | 1 |
| None | 10,691 | - |
Source: Clifford Grammich, Kirk Hadaway, Richard Houseal, Dale E.Jones, Alexei Krindatch, Richie Stanley and Richard H.Taylor. 2012. 2010 U.S.Religion Census: Religious Congregations & Membership Study. Association of Statisticians of American Religious Bodies. Jones, Dale E., et al. 2002. Congregations and Membership in the United States 2000. Nashville, TN: Glenmary Research Center.
Food Environment Statistics:
| Grainger County: | 2.22 / 10,000 pop. |
| State: | 1.99 / 10,000 pop. |
| Grainger County: | 5.77 / 10,000 pop. |
| Tennessee: | 5.16 / 10,000 pop. |
| This county: | 1.78 / 10,000 pop. |
| State: | 6.56 / 10,000 pop. |
| Grainger County: | 11.5% |
| Tennessee: | 11.4% |
| Grainger County: | 28.4% |
| State: | 30.2% |
| Here: | 15.0% |
| State: | 13.5% |
Agriculture in Grainger County:
Average size of farms: 85 acresAverage value of agricultural products sold per farm: $13,308
Average value of crops sold per acre for harvested cropland: $421.81
The value of nursery, greenhouse, floriculture, and sod as a percentage of the total market value of agricultural products sold: 11.89%
The value of livestock, poultry, and their products as a percentage of the total market value of agricultural products sold: 44.00%
Average total farm production expenses per farm: $10,494
Harvested cropland as a percentage of land in farms: 20.76%
Irrigated harvested cropland as a percentage of land in farms: 2.54%
Average market value of all machinery and equipment per farm: $31,899
The percentage of farms operated by a family or individual: 94.90%
Average age of principal farm operators: 55 years
Average number of cattle and calves per 100 acres of all land in farms: 23.72
Milk cows as a percentage of all cattle and calves: 3.60%
Corn for grain: 398 harvested acres
All wheat for grain: 72 harvested acres
Vegetables: 556 harvested acres
Land in orchards: 39 acres
Tornado activity:
Grainger County historical area-adjusted tornado activity is significantly below Tennessee state average. It is 3744124.8 times below overall U.S. average.Tornadoes in this county have caused one fatality and 6 injuries recorded between 1950 and 2004.
On 3/12/1967, a category 2 (max. wind speeds 113-157 mph) tornado killed one person and injured 5 people and caused between $50,000 and $500,000 in damages.
Earthquake activity:
Grainger County-area historical earthquake activity is significantly above Tennessee state average. It is 61% greater than the overall U.S. average.On 7/27/1980 at 18:52:21, a magnitude 5.2 (5.1 MB, 4.7 MS, 5.0 UK, 5.2 UK, Class: Moderate, Intensity: VI - VII) earthquake occurred 135.7 miles away from Grainger County center
On 11/30/1973 at 07:48:41, a magnitude 4.7 (4.7 MB, 4.6 ML, Class: Light, Intensity: IV - V) earthquake occurred 41.8 miles away from the county center
On 8/9/2020 at 12:07:37, a magnitude 5.1 (5.1 MW, Depth: 4.7 mi) earthquake occurred 134.8 miles away from the county center
On 8/23/2011 at 17:51:04, a magnitude 5.8 (5.8 MW, Depth: 3.7 mi) earthquake occurred 327.1 miles away from the county center
On 4/29/2003 at 08:59:39, a magnitude 4.9 (4.4 MB, 4.6 MW, 4.9 LG) earthquake occurred 171.9 miles away from Grainger County center
On 8/2/1974 at 08:52:09, a magnitude 4.9 (4.3 MB, 4.9 LG) earthquake occurred 175.8 miles away from the county center
Magnitude types: regional Lg-wave magnitude (LG), body-wave magnitude (MB), local magnitude (ML), surface-wave magnitude (MS), moment magnitude (MW)
Most recent natural disasters:
- Tennessee Covid-19 Pandemic, Incident Period: January 20, 2020, FEMA Id: 4514, Natural disaster type: Other
- Tennessee Severe Storms, Flooding, Landslides, And Mudslides, Incident Period: February 19, 2019 - March 30, 2019, FEMA Id: 4427, Natural disaster type: Storm, Mudslide, Landslide, Flood
- Tennessee Severe Winter Storm and Flooding, Incident Period: February 15, 2015 to February 23, 2015, Major Disaster (Presidential) Declared DR-4211: April 02, 2015, FEMA Id: 4211, Natural disaster type: Winter Storm, Flood
- Tennessee Severe Storms, Straight-line Winds, Tornadoes, and Flooding, Incident Period: June 18, 2011 to June 24, 2011, Major Disaster (Presidential) Declared DR-4005: July 20, 2011, FEMA Id: 4005, Natural disaster type: Storm, Tornado, Flood, Wind
- Tennessee Severe Storms, Tornadoes, and Flooding, Incident Period: February 28, 2011 to March 01, 2011, Major Disaster (Presidential) Declared DR-1965: March 31, 2011, FEMA Id: 1965, Natural disaster type: Storm, Tornado, Flood
- Tennessee Hurricane Katrina Evacuation, Incident Period: August 29, 2005 to October 01, 2005, Emergency Declared EM-3217: September 05, 2005, FEMA Id: 3217, Natural disaster type: Hurricane
- Tennessee Severe Storms and Flooding, Incident Period: February 14, 2003 to February 26, 2003, Major Disaster (Presidential) Declared DR-1456: March 20, 2003, FEMA Id: 1456, Natural disaster type: Storm, Flood
- Tennessee Storms and Flooding, Incident Period: January 23, 2002 to March 20, 2002, Major Disaster (Presidential) Declared DR-1408: April 05, 2002, FEMA Id: 1408, Natural disaster type: Storm, Flood
- Tennessee Greenville Fire Complex, Incident Period: October 30, 2000, Fire Management Assistance Declared: November 03, 2000, FEMA Id: 2348, Natural disaster type: Fire
- Tennessee Severe Storms, Tornadoes and Flooding, Incident Period: April 16, 1998 to May 18, 1998, Major Disaster (Presidential) Declared DR-1215: April 20, 1998, FEMA Id: 1215, Natural disaster type: Storm, Tornado, Flood
- 4 other natural disasters have been reported since 1953.
The number of natural disasters in Grainger County (14) is near the US average (15).
Major Disasters (Presidential) Declared: 9
Emergencies Declared: 2
Causes of natural disasters: Floods: 9, Storms: 7, Tornadoes: 3, Heavy Rains: 2, Winter Storms: 2, Fire: 1, Flash Flood: 1, Hurricane: 1, Landslide: 1, Mudslide: 1, Snowfall: 1, Wind: 1, Other: 1 (Note: some incidents may be assigned to more than one category).

Means of transportation to work:
- Drove a car alone: 2,690 (65.7%)
- Carpooled: 495 (12.1%)
- Taxicab, motorcycle, or other means: 35 (0.9%)
- Walked: 22 (0.5%)
- Worked at home: 993 (24.3%)


- Health care and social assistance (24%)
- Manufacturing (12%)
- Educational services (11%)
- Retail trade (10%)
- Finance and insurance (6%)
- Accommodation and food services (4%)
- Public administration (4%)

- Health care and social assistance (27%)
- Manufacturing (13%)
- Educational services (13%)
- Retail trade (11%)
- Finance and insurance (7%)
- Accommodation and food services (5%)
- Public administration (5%)

- Production occupations (21%)
- Construction and extraction occupations (16%)
- Management occupations (9%)
- Transportation occupations (9%)
- Sales and related occupations (7%)
- Installation, maintenance, and repair occupations (7%)
- Material moving occupations (6%)

- Office and administrative support occupations (17%)
- Production occupations (11%)
- Educational instruction, and library occupations (9%)
- Healthcare support occupations (9%)
- Management occupations (9%)
- Sales and related occupations (8%)
- Health technologists and technicians (6%)

- Mexico (55%)
- Canada (7%)
- Taiwan (6%)
- England (3%)
- United Kingdom, excluding England and Scotland (3%)
- Switzerland (3%)
- Brazil (2%)

- American (37%)
- English (15%)
- Irish (9%)
- German (6%)
- Scottish (2%)
- Italian (2%)
- Scotch-Irish (2%)


People in group quarters in Grainger County, Tennessee in 2010:
- 124 people in nursing facilities/skilled-nursing facilities
- 25 people in group homes for juveniles (non-correctional)
- 2 people in workers' group living quarters and job corps centers
People in group quarters in Grainger County, Tennessee in 2000:
- 127 people in nursing homes
- 27 people in local jails and other confinement facilities (including police lockups)
- 24 people in other noninstitutional group quarters
10.11% of this county's 2021 resident taxpayers lived in other counties in 2020 ($54,610 average adjusted gross income)
| Here: | 10.11% |
| Tennessee average: | 8.49% |
10 or fewer of this county's residents moved from foreign countries.
6.08% relocated from other counties in Tennessee ($25,732 average AGI)
4.03% relocated from other states ($28,877 average AGI)
Grainger County: 4.03% Tennessee average: 4.34%

Top counties from which taxpayers relocated into this county between 2020 and 2021:
| from Knox County, TN | |
| from Hamblen County, TN | |
| from Jefferson County, TN | |
| from Hawkins County, TN | |
| from Union County, TN | |
| from Sevier County, TN |
7.13% of this county's 2020 resident taxpayers moved to other counties in 2021 ($41,274 average adjusted gross income)
| Here: | 7.13% |
| Tennessee average: | 7.40% |
10 or fewer of this county's residents moved to foreign countries.
5.74% relocated to other counties in Tennessee ($32,689 average AGI)
1.39% relocated to other states ($8,583 average AGI)
Grainger County: 1.39% Tennessee average: 3.20%

Top counties to which taxpayers relocated from this county between 2020 and 2021:
| to Knox County, TN | |
| to Hamblen County, TN | |
| to Jefferson County, TN | |
| to Hawkins County, TN | |
| to Union County, TN |
Births per 1000 population from 1990 to 1999: 12.5
Births per 1000 population from 2000 to 2006: 12.1

Deaths per 1000 population from 1990 to 1999: 10.3
Deaths per 1000 population from 2000 to 2009: 10.4
Deaths per 1000 population from 2010 to 2020: 12.7

Infant deaths per 1000 live births from 1990 to 1999: 7.0
Infant deaths per 1000 live births from 2000 to 2006: 7.4

Persons under 19 years old without health insurance coverage in 2018: 6.0%


Persons enrolled in hospital insurance and/or supplemental medical insurance (Medicare) in July 1, 2007: 4,394 (3,133 aged, 1,261 disabled)
Children under 18 without health insurance coverage in 2007: 573 (11%)


Most common underlying causes of death in Grainger County, Tennessee in 1999 - 2019:
- Bronchus or lung, unspecified - Malignant neoplasms (457)
- Acute myocardial infarction, unspecified (391)
- Atherosclerotic heart disease (302)
- Chronic obstructive pulmonary disease, unspecified (260)
- Alzheimer disease, unspecified (101)
- Stroke, not specified as haemorrhage or infarction (91)
- Unspecified dementia (87)
- Other ill-defined and unspecified causes of mortality (71)
- Pneumonia, unspecified (22)
- Colon, unspecified - Malignant neoplasms (20)
Population without health insurance coverage in 2000: 14%
Children under 18 without health insurance coverage in 2000: 8%
Medical specialist MDs per 100,000 population in 2005: 1,095
Total births per 100,000 population, July 2005 - July 2006 : 10
Total deaths per 100,000 population, July 2005 - July 2006: 31
Crimes per 100,000 population in 1996: 1
Suicides per 1,000,000 population from 2000 to 2006: 159.8. This is more than state average.
Household type by relationship:
Households: 24,083- Male householders: 4,939 (1,555 living alone), Female householders: 4,901 (1,333 living alone)
5,092 spouses (5,068 opposite-sex spouses), 504 unmarried partners, (460 opposite-sex unmarried partners), 6,214 children (5,531 natural, 340 adopted, 344 stepchildren), 647 grandchildren, 305 brothers or sisters, 483 parents, 0 foster children, 296 other relatives, 556 non-relatives
- In group quarters: 143
Size of family households: 3,327 2-persons, 1,617 3-persons, 1,135 4-persons, 382 5-persons, 54 6-persons, 99 7-or-more-persons.
Size of nonfamily households: 2,879 1-person, 306 2-persons, 20 4-persons, 11 5-persons.
2,843 married couples with children.
909 single-parent households (253 men, 656 women).
96.6% of residents of Grainger speak English at home.
3.4% of residents speak Spanish at home (58% speak English very well, 23% speak English not well, 19% don't speak English at all).
0.1% of residents speak other Indo-European language at home (100% speak English very well).
In fiscal year 2004:
Federal Government expenditure: $137,748,000 ($6,282 per capita)
Department of Defense expenditure: $2,778,000
Federal direct payments to individuals for retirement and disability: $58,250,000
Federal other direct payments to individuals: $28,657,000
Federal direct payments not to individuals: $334,000
Federal grants: $45,964,000
Federal procurement contracts: $1,278,000 ($630,000 Department of Defense)
Federal salaries and wages: $3,265,000 ($0,000 Department of Defense)
Federal Government direct loans: $207,000
Federal guaranteed/insured loans: $3,133,000
Federal Government insurance: $715,000
Population change from April 1, 2000 to July 1, 2005:
Births: 1,398| Here: | 63 per 1000 residents |
| State: | 69 per 1000 residents |
Deaths: 1,127
| Here: | 51 per 1000 residents |
| State: | 50 per 1000 residents |
Net international migration: +79
| Here: | +4 per 1000 residents |
| State: | +8 per 1000 residents |
Net internal migration: +1,305
| Here: | +59 per 1000 residents |
| State: | +18 per 1000 residents |

Total withdrawal of fresh water for public supply: 0.03 millions of gallons per day (all from ground)
| Here: | 5.8 |
| State: | 6.5 |
| Here: | 4.6 |
| State: | 4.4 |

- Year house built in Grainger County, Tennessee
- 1102020 or later
- 1,2182010 to 2019
- 1,8922000 to 2009
- 2,7611990 to 1999
- 1,7501980 to 1989
- 1,4031970 to 1979
- 7821960 to 1969
- 5641950 to 1959
- 3371940 to 1949
- 8341939 or earlier

- Rooms in owner-occupied houses in Grainger County, Tennessee
- 251 room
- 182 rooms
- 2883 rooms
- 1,1334 rooms
- 1,7685 rooms
- 1,8386 rooms
- 1,0187 rooms
- 6408 rooms
- 8899+ rooms

- Rooms in renter-occupied apartments in Grainger County, Tennessee
- 31 room
- 482 rooms
- 3433 rooms
- 6534 rooms
- 3945 rooms
- 3536 rooms
- 1347 rooms
- 2418 rooms
- 809+ rooms

- Bedrooms in owner-occupied houses in Grainger County, Tennessee
- 39no bedroom
- 2651 bedroom
- 1,5772 bedrooms
- 4,3313 bedrooms
- 1,1644 bedrooms
- 1945+ bedrooms

- Bedrooms in renter-occupied apartments in Grainger County, Tennessee
- 3no bedroom
- 3851 bedroom
- 8372 bedrooms
- 7813 bedrooms
- 2324 bedrooms
- 65+ bedrooms

- Cars and other vehicles available in Grainger County in owner-occupied houses/condos
- 351no vehicle
- 1,6801 vehicle
- 2,5132 vehicles
- 1,8203 vehicles
- 7274 vehicles
- 4885+ vehicles

- Cars and other vehicles available in Grainger County in renter-occupied apartments
- 277no vehicle
- 7081 vehicle
- 9282 vehicles
- 1783 vehicles
- 1554 vehicles
- 45+ vehicles
92.0% of Grainger County residents lived in the same house 1 years ago.
Out of people who lived in different houses, 21% lived in this county.
Out of people who lived in different counties, 69% lived in Tennessee.
| Grainger County: | 92.0% |
| State average: | 87.0% |
Place of birth for U.S.-born residents:
- This state: 15,675
- Other state: 7,378
- Northeast: 642
- Midwest: 1,469
- South: 4,541
- West: 711


- 83.1%Electricity
- 7.1%Bottled, tank, or LP gas
- 7.0%Wood
- 1.4%Utility gas
- 0.6%Coal or coke
- 0.5%Fuel oil, kerosene, etc.
- 0.2%No fuel used

- 86.0%Electricity
- 6.4%Bottled, tank, or LP gas
- 4.6%Wood
- 2.6%Utility gas
- 0.5%No fuel used
Private vs. public school enrollment:
| Here: | 11.4% |
| Tennessee: | 15.0% |
| Here: | 6.8% |
| Tennessee: | 16.2% |
| Here: | 7.9% |
| Tennessee: | 23.5% |


Grainger County government finances - Expenditure in 2017:
- Charges - Elementary and Secondary Education - Other: $1,557,000
Elementary and Secondary Education School Lunch: $447,000
Other: $34,000
Sewerage: $17,000
Parks and Recreation: $17,000
- Construction - Elementary and Secondary Education: $414,000
- Current Operations - Elementary and Secondary Education: $30,102,000
Health - Other: $1,904,000
Police Protection: $1,746,000
Correctional Institutions: $1,271,000
Judicial and Legal Services: $1,254,000
Solid Waste Management: $846,000
Central Staff Services: $778,000
Financial Administration: $620,000
General Public Buildings: $404,000
General - Other: $287,000
Libraries: $163,000
Natural Resources - Other: $146,000
Parks and Recreation: $122,000
Sewerage: $65,000
Protective Inspection and Regulation - Other: $48,000
Local Fire Protection: $22,000
- Federal Intergovernmental - Education: $74,000
- General - Interest on Debt: $96,000
- Intergovernmental to Local - Other - Elementary and Secondary Education: $6,000
- Local Intergovernmental - Education: $2,000
- Long Term Debt - Outstanding Unspecified Public Purpose: $2,410,000
Beginning Outstanding - Unspecified Public Purpose: $2,410,000
- Miscellaneous - General Revenue - Other: $793,000
Rents: $28,000
Fines and Forfeits: $19,000
Donations From Private Sources: $12,000
Interest Earnings: $1,000
- Other Capital Outlay - Elementary and Secondary Education: $1,067,000
- Other Funds - Cash and Securities: $4,044,000
- Short Term Debt Outstanding - Beginning: $400,000
- State Intergovernmental - Education: $27,214,000
Highways: $2,139,000
Health and Hospitals: $32,000
Sewerage: $30,000
Housing and Community Development: $11,000
- Tax - Property: $8,523,000
General Sales and Gross Receipts: $1,727,000
Alcoholic Beverage License: $91,000
Alcoholic Beverage Sales: $83,000
Severance: $73,000
Public Utilities Sales: $21,000
- Total Salaries and Wages: $17,346,000
Grainger County government finances - Revenue in 2017:
- Charges - Elementary and Secondary Education - Other: $1,557,000
Elementary and Secondary Education School Lunch: $447,000
Other: $34,000
Sewerage: $17,000
Parks and Recreation: $17,000
- Construction - Elementary and Secondary Education: $414,000
- Current Operations - Elementary and Secondary Education: $30,102,000
Health - Other: $1,904,000
Police Protection: $1,746,000
Correctional Institutions: $1,271,000
Judicial and Legal Services: $1,254,000
Solid Waste Management: $846,000
Central Staff Services: $778,000
Financial Administration: $620,000
General Public Buildings: $404,000
General - Other: $287,000
Libraries: $163,000
Natural Resources - Other: $146,000
Parks and Recreation: $122,000
Sewerage: $65,000
Protective Inspection and Regulation - Other: $48,000
Local Fire Protection: $22,000
- Federal Intergovernmental - Education: $74,000
- General - Interest on Debt: $96,000
- Intergovernmental to Local - Other - Elementary and Secondary Education: $6,000
- Local Intergovernmental - Education: $2,000
- Long Term Debt - Outstanding Unspecified Public Purpose: $2,410,000
Beginning Outstanding - Unspecified Public Purpose: $2,410,000
- Miscellaneous - General Revenue - Other: $793,000
Rents: $28,000
Fines and Forfeits: $19,000
Donations From Private Sources: $12,000
Interest Earnings: $1,000
- Other Capital Outlay - Elementary and Secondary Education: $1,067,000
- Other Funds - Cash and Securities: $4,044,000
- Short Term Debt Outstanding - Beginning: $400,000
- State Intergovernmental - Education: $27,214,000
Highways: $2,139,000
Health and Hospitals: $32,000
Sewerage: $30,000
Housing and Community Development: $11,000
- Tax - Property: $8,523,000
General Sales and Gross Receipts: $1,727,000
Alcoholic Beverage License: $91,000
Alcoholic Beverage Sales: $83,000
Severance: $73,000
Public Utilities Sales: $21,000
- Total Salaries and Wages: $17,346,000
Grainger County government finances - Debt in 2017:
- Charges - Elementary and Secondary Education - Other: $1,557,000
Elementary and Secondary Education School Lunch: $447,000
Other: $34,000
Sewerage: $17,000
Parks and Recreation: $17,000
- Construction - Elementary and Secondary Education: $414,000
- Current Operations - Elementary and Secondary Education: $30,102,000
Health - Other: $1,904,000
Police Protection: $1,746,000
Correctional Institutions: $1,271,000
Judicial and Legal Services: $1,254,000
Solid Waste Management: $846,000
Central Staff Services: $778,000
Financial Administration: $620,000
General Public Buildings: $404,000
General - Other: $287,000
Libraries: $163,000
Natural Resources - Other: $146,000
Parks and Recreation: $122,000
Sewerage: $65,000
Protective Inspection and Regulation - Other: $48,000
Local Fire Protection: $22,000
- Federal Intergovernmental - Education: $74,000
- General - Interest on Debt: $96,000
- Intergovernmental to Local - Other - Elementary and Secondary Education: $6,000
- Local Intergovernmental - Education: $2,000
- Long Term Debt - Outstanding Unspecified Public Purpose: $2,410,000
Beginning Outstanding - Unspecified Public Purpose: $2,410,000
- Miscellaneous - General Revenue - Other: $793,000
Rents: $28,000
Fines and Forfeits: $19,000
Donations From Private Sources: $12,000
Interest Earnings: $1,000
- Other Capital Outlay - Elementary and Secondary Education: $1,067,000
- Other Funds - Cash and Securities: $4,044,000
- Short Term Debt Outstanding - Beginning: $400,000
- State Intergovernmental - Education: $27,214,000
Highways: $2,139,000
Health and Hospitals: $32,000
Sewerage: $30,000
Housing and Community Development: $11,000
- Tax - Property: $8,523,000
General Sales and Gross Receipts: $1,727,000
Alcoholic Beverage License: $91,000
Alcoholic Beverage Sales: $83,000
Severance: $73,000
Public Utilities Sales: $21,000
- Total Salaries and Wages: $17,346,000
Grainger County government finances - Cash and Securities in 2017:
- Charges - Elementary and Secondary Education - Other: $1,557,000
Elementary and Secondary Education School Lunch: $447,000
Other: $34,000
Sewerage: $17,000
Parks and Recreation: $17,000
- Construction - Elementary and Secondary Education: $414,000
- Current Operations - Elementary and Secondary Education: $30,102,000
Health - Other: $1,904,000
Police Protection: $1,746,000
Correctional Institutions: $1,271,000
Judicial and Legal Services: $1,254,000
Solid Waste Management: $846,000
Central Staff Services: $778,000
Financial Administration: $620,000
General Public Buildings: $404,000
General - Other: $287,000
Libraries: $163,000
Natural Resources - Other: $146,000
Parks and Recreation: $122,000
Sewerage: $65,000
Protective Inspection and Regulation - Other: $48,000
Local Fire Protection: $22,000
- Federal Intergovernmental - Education: $74,000
- General - Interest on Debt: $96,000
- Intergovernmental to Local - Other - Elementary and Secondary Education: $6,000
- Local Intergovernmental - Education: $2,000
- Long Term Debt - Outstanding Unspecified Public Purpose: $2,410,000
Beginning Outstanding - Unspecified Public Purpose: $2,410,000
- Miscellaneous - General Revenue - Other: $793,000
Rents: $28,000
Fines and Forfeits: $19,000
Donations From Private Sources: $12,000
Interest Earnings: $1,000
- Other Capital Outlay - Elementary and Secondary Education: $1,067,000
- Other Funds - Cash and Securities: $4,044,000
- Short Term Debt Outstanding - Beginning: $400,000
- State Intergovernmental - Education: $27,214,000
Highways: $2,139,000
Health and Hospitals: $32,000
Sewerage: $30,000
Housing and Community Development: $11,000
- Tax - Property: $8,523,000
General Sales and Gross Receipts: $1,727,000
Alcoholic Beverage License: $91,000
Alcoholic Beverage Sales: $83,000
Severance: $73,000
Public Utilities Sales: $21,000
- Total Salaries and Wages: $17,346,000
Supplemental Security Income (SSI) in 2006:
- Total number of recipients: 952
- Number of aged recipients: 106
- Number of blind and disabled recipients: 846
- Number of recipients under 18: 75
- Number of recipients between 18 and 64: 617
- Number of recipients older than 64: 260
- Number of recipients also receiving OASDI: 411
- Amount of payments (thousands of dollars): 419
| Most common first names in Grainger County, TN among deceased individuals | ||
| Name | Count | Lived (average) |
|---|---|---|
| James | 124 | 72.6 years |
| John | 80 | 76.0 years |
| Mary | 76 | 77.5 years |
| William | 72 | 75.2 years |
| Robert | 53 | 66.9 years |
| George | 46 | 73.3 years |
| Edith | 26 | 78.5 years |
| Edna | 24 | 81.0 years |
| Helen | 24 | 79.2 years |
| Charles | 23 | 75.1 years |
| Most common last names in Grainger County, TN among deceased individuals | ||
| Last name | Count | Lived (average) |
|---|---|---|
| Morgan | 71 | 73.1 years |
| Roach | 64 | 80.2 years |
| Williams | 57 | 72.7 years |
| Cameron | 50 | 73.8 years |
| Collins | 50 | 73.2 years |
| Hodge | 44 | 77.0 years |
| Jones | 44 | 75.5 years |
| Dalton | 43 | 76.8 years |
| Davis | 39 | 75.7 years |
| Greenlee | 31 | 77.0 years |
| Businesses in Grainger County, TN | ||||
| Name | Count | Name | Count | |
|---|---|---|---|---|
| Chevrolet | 1 | Hardee's | 1 | |
| Ford | 1 | Subway | 1 | |
| H&R Block | 1 | U-Haul | 1 | |
Grainger County on our top lists:
- #25 on the list of "Top 101 counties with the lowest total withdrawal of fresh water for public supply"
- #79 on the list of "Top 101 counties with the lowest ground withdrawal of fresh water for public supply"