Gilmer County, West Virginia (WV)
County owner-occupied free and clear houses and condos in 2010: 1,185
County owner-occupied houses and condos in 2000: 2,001
Renter-occupied apartments: 748 (it was 767 in 2000)
| % of renters here: | 28% |
| State: | 27% |
Land area: 340 sq. mi.
Water area: 0.0 sq. mi.
Population density: 22 people per square mile (low).
Industries providing employment: Educational, health and social services (36.1%), Retail trade (12.2%).
Type of workers:
- Private wage or salary: 63%
- Government: 34%
- Self-employed, not incorporated: 3%
- Unpaid family work: 0%
- OSM Map
- General Map
- Google Map
- MSN Map

- 5,71077.2%White Non-Hispanic Alone
- 99413.4%Black Non-Hispanic Alone
- 3064.1%Hispanic or Latino
- 2984.0%Two or more races
- 470.6%Some other race alone
- 250.3%Asian alone
- 140.2%American Indian and Alaska Native alone

| Median resident age: | 40.8 years |
| West Virginia median age: | 42.9 years |
| Males: 4,427 | |
| Females: 2,943 |

 | Wheeling Jesuit Facing Financial Difficulties (57 replies) |
| West Virginia...Southern or Northern? (474 replies) |
| Morgantown Unemployment still Lowest in State (11 replies) |
| Shocker re High Schools in WV (5 replies) |
| Moving to Glenville (4 replies) |
| Gilmer County: | 2.0 people |
| West Virginia: | 2 people |
Estimated median household income in 2022: $50,722 ($22,857 in 1999)
| This county: | $50,722 |
| West Virginia: | $54,329 |
Median contract rent in 2022 for apartments: $508 (lower quartile is $413, upper quartile is $643)
| This county: | $508 |
| State: | $606 |
Estimated median house or condo value in 2022: $95,528 (it was $59,600 in 2000)
| Gilmer: | $95,528 |
| West Virginia: | $155,100 |
Median monthly housing costs for homes and condos with a mortgage: $723
Median monthly housing costs for units without a mortgage: $238
Institutionalized population: 1,832
Crime in 2021 (reported by the sheriff's office or county police, not the county total):
- Murders: 0
- Rapes: 0
- Robberies: 0
- Assaults: 0
- Burglaries: 0
- Thefts: 4
- Auto thefts: 0
Crime in 2020 (reported by the sheriff's office or county police, not the county total):
- Murders: 0
- Rapes: 0
- Robberies: 0
- Assaults: 0
- Burglaries: 2
- Thefts: 4
- Auto thefts: 0
Single-family new house construction building permits:
- 2022: 8 buildings, average cost: $97,200
- 2021: 10 buildings, average cost: $165,700
- 2020: 9 buildings, average cost: $102,900
- 2019: 8 buildings, average cost: $113,900
- 2018: 6 buildings, average cost: $113,900
- 2017: 9 buildings, average cost: $113,900
- 2016: 8 buildings, average cost: $113,900
- 2015: 7 buildings, average cost: $113,900
- 2014: 0 buildings
- 2013: 0 buildings
- 2012: 0 buildings
- 2011: 1 building, cost: $150,000
- 2010: 0 buildings
- 2009: 0 buildings
- 2008: 0 buildings
- 2007: 0 buildings
- 2006: 0 buildings
- 2005: 0 buildings
- 2004: 0 buildings
- 2003: 0 buildings
- 2002: 0 buildings
- 2001: 0 buildings
- 2000: 0 buildings
- 1999: 0 buildings
- 1998: 0 buildings
- 1997: 1 building, cost: $300,000


Median real estate property taxes paid for housing units with mortgages in 2022: $498 (0.5%)
Median real estate property taxes paid for housing units with no mortgage in 2022: $444 (0.5%)


| Gilmer County: | 11.9% |
| West Virginia: | 17.9% |
Median age of residents in 2022: 40.8 years old
(Males: 39.7 years old, Females: 42.5 years old)
(Median age for: White residents: 42.9 years old, Black residents: 36.2 years old, Asian residents: 57.9 years old, Hispanic or Latino residents: 34.1 years old, Other race residents: 26.4 years old)
Fair market rent in 2006 for a 1-bedroom apartment in Gilmer County is $369 a month.
Fair market rent for a 2-bedroom apartment is $459 a month.
Fair market rent for a 3-bedroom apartment is $601 a month.
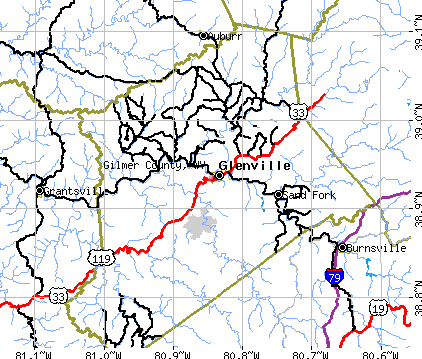
Notable locations in this county outside city limits:
Notable location: Mill Mountain Forest Service Repeater Site (A). Display/hide its location on the map
Neighboring counties: Calhoun County  , Boone County, Missouri
  , Harrison County
  , Scott County, Indiana , Richland County, Illinois .
| Here: | 5.7% |
| West Virginia: | 4.0% |


Current college students: 953
People 25 years of age or older with a high school degree or higher: 83.0%
People 25 years of age or older with a bachelor's degree or higher: 20.2%
Number of foreign born residents: 187 (21.9% naturalized citizens)
| Gilmer County: | 2.5% |
| Whole state: | 1.8% |

- Year of entry for the foreign-born population
- 272010 or later
- 1062000 to 2009
- 611990 to 1999
- 81980 to 1989
- 171970 to 1979
- 11Before 1970
Mean travel time to work (commute): minutes
Percentage of county residents living and working in this county: 99.0%
Housing units in structures:
- One, detached: 2,211
- One, attached: 6
- Two: 17
- 3 or 4: 30
- 5 to 9: 40
- 10 to 19: 34
- 20 or more: 4
- Mobile homes: 746
- Boats, RVs, vans, etc.: 24
Housing units in Gilmer County with a mortgage: 469 (9 second mortgage, 0 home equity loan, 9 both second mortgage and home equity loan)
Houses without a mortgage: 23
| Here: | 95.3% with mortgage |
| State: | 97.1% with mortgage |
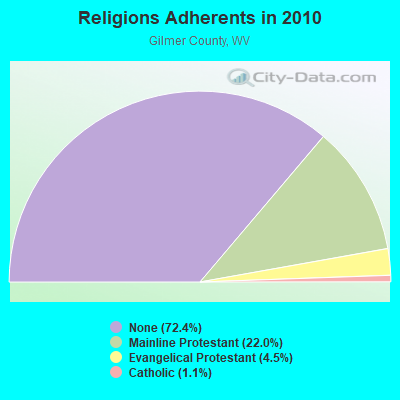
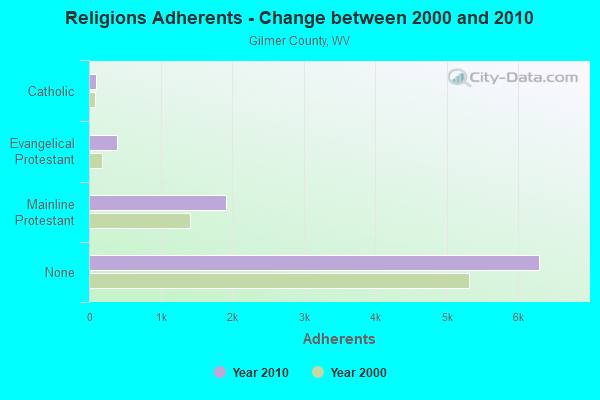
Religion statistics for Gilmer County
| Religion | Adherents | Congregations |
|---|---|---|
| Mainline Protestant | 1,909 | 22 |
| Evangelical Protestant | 391 | 9 |
| Catholic | 97 | 1 |
| Other | - | 1 |
| None | 6,296 | - |
Source: Clifford Grammich, Kirk Hadaway, Richard Houseal, Dale E.Jones, Alexei Krindatch, Richie Stanley and Richard H.Taylor. 2012. 2010 U.S.Religion Census: Religious Congregations & Membership Study. Association of Statisticians of American Religious Bodies. Jones, Dale E., et al. 2002. Congregations and Membership in the United States 2000. Nashville, TN: Glenmary Research Center.
Food Environment Statistics:
| Gilmer County: | 2.90 / 10,000 pop. |
| State: | 2.41 / 10,000 pop. |
| Gilmer County: | 7.25 / 10,000 pop. |
| West Virginia: | 5.38 / 10,000 pop. |
| This county: | 7.25 / 10,000 pop. |
| State: | 6.22 / 10,000 pop. |
| Gilmer County: | 12.0% |
| West Virginia: | 12.2% |
| Gilmer County: | 35.2% |
| State: | 31.1% |
| Here: | 9.2% |
| State: | 13.1% |
Agriculture in Gilmer County:
Average size of farms: 265 acresAverage value of agricultural products sold per farm: $10,237
Average value of crops sold per acre for harvested cropland: $17.57
The value of livestock, poultry, and their products as a percentage of the total market value of agricultural products sold: 94.42%
Average total farm production expenses per farm: $11,834
Harvested cropland as a percentage of land in farms: 12.28%
Average market value of all machinery and equipment per farm: $24,795
The percentage of farms operated by a family or individual: 96.39%
Average age of principal farm operators: 53 years
Average number of cattle and calves per 100 acres of all land in farms: 8.26
Milk cows as a percentage of all cattle and calves: 0.99%
Corn for grain: 11 harvested acres
Land in orchards: 17 acres
Earthquake activity:
Gilmer County-area historical earthquake activity is significantly above West Virginia state average. It is 27% smaller than the overall U.S. average.On 8/23/2011 at 17:51:04, a magnitude 5.8 (5.8 MW, Depth: 3.7 mi, Class: Moderate, Intensity: VI - VII) earthquake occurred 172.8 miles away from Gilmer County center
On 7/27/1980 at 18:52:21, a magnitude 5.2 (5.1 MB, 4.7 MS, 5.0 UK, 5.2 UK) earthquake occurred 174.9 miles away from the county center
On 9/25/1998 at 19:52:52, a magnitude 5.2 (4.8 MB, 4.3 MS, 5.2 LG, 4.5 MW, Depth: 3.1 mi) earthquake occurred 178.5 miles away from the county center
On 8/9/2020 at 12:07:37, a magnitude 5.1 (5.1 MW, Depth: 4.7 mi) earthquake occurred 170.5 miles away from the county center
On 1/31/1986 at 16:46:43, a magnitude 5.0 (5.0 MB) earthquake occurred 185.3 miles away from Gilmer County center
On 9/7/1988 at 02:28:09, a magnitude 4.6 (4.5 MB, 4.6 LG, Class: Light, Intensity: IV - V) earthquake occurred 172.9 miles away from the county center
Magnitude types: regional Lg-wave magnitude (LG), body-wave magnitude (MB), surface-wave magnitude (MS), moment magnitude (MW)
Most recent natural disasters:
- West Virginia Covid-19 Pandemic, Incident Period: January 20, 2020, Major Disaster (Presidential) Declared DR-4517-WV: April 3, 2020, FEMA Id: 4517, Natural disaster type: Other
- West Virginia Severe Storms, Flooding, Landslides, and Mudslides, Incident Period: June 22, 2016 to June 29, 2016, Major Disaster (Presidential) Declared DR-4273: June 25, 2016, FEMA Id: 4273, Natural disaster type: Storm, Mudslide, Landslide, Flood
- West Virginia Severe Storms, Flooding, Landslides, and Mudslides, Incident Period: April 08, 2015 to April 11, 2015, Major Disaster (Presidential) Declared DR-4220: May 18, 2015, FEMA Id: 4220, Natural disaster type: Storm, Mudslide, Landslide, Flood
- West Virginia Severe Winter Storm, Flooding, Landslides, and Mudslides, Incident Period: March 03, 2015 to March 15, 2015, Major Disaster (Presidential) Declared DR-4210: March 31, 2015, FEMA Id: 4210, Natural disaster type: Winter Storm, Mudslide, Landslide, Flood
- West Virginia Hurricane Sandy, Incident Period: October 29, 2012 to November 08, 2012, Emergency Declared EM-3358: October 29, 2012, FEMA Id: 3358, Natural disaster type: Hurricane
- West Virginia Severe Storms, Incident Period: June 29, 2012 to July 10, 2012, Emergency Declared EM-3345: June 30, 2012, FEMA Id: 3345, Natural disaster type: Storm
- West Virginia Severe Storms and Straight-Line Winds, Incident Period: June 29, 2012 to July 08, 2012, Major Disaster (Presidential) Declared DR-4071: July 23, 2012, FEMA Id: 4071, Natural disaster type: Storm, Wind
- West Virginia Severe Storms, Flooding, Mudslides, and Landslides, Incident Period: May 03, 2009 to June 08, 2009, Major Disaster (Presidential) Declared DR-1838: May 15, 2009, FEMA Id: 1838, Natural disaster type: Storm, Mudslide, Landslide, Flood
- West Virginia Severe Storms, Tornadoes, Flooding, Mudslides, and Landslides, Incident Period: June 03, 2008 to June 07, 2008, Major Disaster (Presidential) Declared DR-1769: June 19, 2008, FEMA Id: 1769, Natural disaster type: Storm, Tornado, Mudslide, Landslide, Flood
- West Virginia Severe Storms, Flooding, Landslides, and Mudslides, Incident Period: April 14, 2007 to April 18, 2007, Major Disaster (Presidential) Declared DR-1696: May 01, 2007, FEMA Id: 1696, Natural disaster type: Storm, Mudslide, Landslide, Flood
- 12 other natural disasters have been reported since 1953.
The number of natural disasters in Gilmer County (22) is greater than the US average (15).
Major Disasters (Presidential) Declared: 18
Emergencies Declared: 4
Causes of natural disasters: Floods: 13, Storms: 12, Landslides: 8, Mudslides: 6, Winter Storms: 4, Hurricanes: 2, Tornadoes: 2, Blizzard: 1, Snowfall: 1, Wind: 1, Other: 1 (Note: some incidents may be assigned to more than one category).

Means of transportation to work:
- Drove a car alone: 1,743 (75.9%)
- Carpooled: 206 (9.0%)
- Ferryboat: 6 (0.3%)
- Taxicab, motorcycle, or other means: 114 (5.0%)
- Walked: 102 (4.4%)
- Worked at home: 101 (4.4%)


- Educational services (32%)
- Health care and social assistance (15%)
- Retail trade (12%)
- Public administration (11%)
- Accommodation and food services (6%)
- Professional, scientific, and technical services (4%)
- Other services, except public administration (3%)

- Educational services (36%)
- Health care and social assistance (17%)
- Retail trade (14%)
- Public administration (12%)
- Accommodation and food services (6%)
- Professional, scientific, and technical services (5%)
- Other services, except public administration (4%)

- Construction and extraction occupations (14%)
- Management occupations (13%)
- Educational instruction, and library occupations (12%)
- Material moving occupations (10%)
- Transportation occupations (7%)
- Sales and related occupations (7%)
- Production occupations (7%)

- Office and administrative support occupations (22%)
- Educational instruction, and library occupations (16%)
- Sales and related occupations (9%)
- Business and financial operations occupations (8%)
- Food preparation and serving related occupations (8%)
- Health diagnosing and treating practitioners and other technical occupations (7%)
- Building and grounds cleaning and maintenance occupations (6%)

- Mexico (26%)
- El Salvador (13%)
- Nigeria (9%)
- Colombia (9%)
- Bahamas (7%)
- Dominican Republic (7%)
- Ecuador (7%)

- German (26%)
- American (22%)
- English (14%)
- Irish (10%)
- Scottish (6%)
- European (2%)
- French (except Basque) (2%)


People in group quarters in Gilmer County, West Virginia in 2010:
- 1,773 people in federal prisons
- 407 people in college/university student housing
- 59 people in nursing facilities/skilled-nursing facilities
64 people in nursing homes
8.26% of this county's 2021 resident taxpayers lived in other counties in 2020 ($28,542 average adjusted gross income)
| Here: | 8.26% |
| West Virginia average: | 5.74% |
10 or fewer of this county's residents moved from foreign countries.
3.46% relocated from other counties in West Virginia ($14,296 average AGI)
4.80% relocated from other states ($14,246 average AGI)
Gilmer County: 4.80% West Virginia average: 3.02%

5.87% of this county's 2020 resident taxpayers moved to other counties in 2021 ($29,056 average adjusted gross income)
| Here: | 5.87% |
| West Virginia average: | 5.65% |
10 or fewer of this county's residents moved to foreign countries.
4.26% relocated to other counties in West Virginia ($23,823 average AGI)
1.61% relocated to other states ($5,234 average AGI)
Gilmer County: 1.61% West Virginia average: 2.93%

Births per 1000 population from 1990 to 1999: 10.0
Births per 1000 population from 2000 to 2006: 9.1

Deaths per 1000 population from 1990 to 1999: 11.7
Deaths per 1000 population from 2000 to 2009: 11.3
Deaths per 1000 population from 2010 to 2020: 9.8

Infant deaths per 1000 live births from 1990 to 1999: 5.4
Infant deaths per 1000 live births from 2000 to 2006: 13.1

Persons under 19 years old without health insurance coverage in 2018: 3.4%


Persons enrolled in hospital insurance and/or supplemental medical insurance (Medicare) in July 1, 2007: 1,348 (1,043 aged, 305 disabled)
Children under 18 without health insurance coverage in 2007: 122 (10%)


Most common underlying causes of death in Gilmer County, West Virginia in 1999 - 2019:
- Atherosclerotic heart disease (24)
- Acute myocardial infarction, unspecified (22)
- Bronchus or lung, unspecified - Malignant neoplasms (11)
- Alzheimer disease, unspecified (10)
- Atherosclerotic cardiovascular disease, so described (10)
- Chronic obstructive pulmonary disease, unspecified (10)
Population without health insurance coverage in 2000: 17%
Children under 18 without health insurance coverage in 2000: 12%
Medical specialist MDs per 100,000 population in 2005: 1,180
Dentists per 100,000 population in 1998: 14
Total births per 100,000 population, July 2005 - July 2006 : 14
Total deaths per 100,000 population, July 2005 - July 2006: 29
Limited-service eating places per 100,000 population in 2005 : 14
Household type by relationship:
Households: 7,370- Male householders: 1,071 (306 living alone), Female householders: 1,120 (330 living alone)
1,062 spouses (1,062 opposite-sex spouses), 103 unmarried partners, (101 opposite-sex unmarried partners), 1,604 children (1,567 natural, 16 adopted, 8 stepchildren), 191 grandchildren, 0 brothers or sisters, 36 parents, 14 foster children, 139 other relatives, 128 non-relatives
- In group quarters: 1,909
Size of family households: 796 2-persons, 333 3-persons, 240 4-persons, 70 5-persons, 4 6-persons.
Size of nonfamily households: 636 1-person, 107 2-persons, 2 3-persons.
529 married couples with children.
463 single-parent households (213 men, 250 women).
95.5% of residents of Gilmer speak English at home.
4.0% of residents speak Spanish at home (59% speak English very well, 16% speak English well, 18% speak English not well, 7% don't speak English at all).
0.2% of residents speak other Indo-European language at home (35% speak English very well, 65% speak English well).
0.2% of residents speak Asian or Pacific Island language at home (100% speak English well).
0.4% of residents speak other language at home (43% speak English very well, 57% speak English not well).
In fiscal year 2004:
Federal Government expenditure: $69,322,000 ($9,929 per capita)
Department of Defense expenditure: $724,000
Federal direct payments to individuals for retirement and disability: $20,638,000
Federal other direct payments to individuals: $11,603,000
Federal direct payments not to individuals: $637,000
Federal grants: $16,238,000
Federal procurement contracts: $3,216,000 ($7,000 Department of Defense)
Federal salaries and wages: $16,990,000 ($0,000 Department of Defense)
Federal Government direct loans: $4,948,000
Federal guaranteed/insured loans: $284,000
Federal Government insurance: $14,042,000
Population change from April 1, 2000 to July 1, 2005:
Births: 286| Here: | 41 per 1000 residents |
| State: | 60 per 1000 residents |
Deaths: 419
| Here: | 60 per 1000 residents |
| State: | 61 per 1000 residents |
Net international migration: +27
| Here: | +4 per 1000 residents |
| State: | +2 per 1000 residents |
Net internal migration: -94
| Here: | |
| State: |

Total withdrawal of fresh water for public supply: 0.28 millions of gallons per day (all from surface)
| Here: | 6.4 |
| State: | 6.5 |
| Here: | 5.3 |
| State: | 4.7 |

- Year house built in Gilmer County, West Virginia
- 02020 or later
- 2222010 to 2019
- 2062000 to 2009
- 1771990 to 1999
- 6531980 to 1989
- 5181970 to 1979
- 2631960 to 1969
- 1941950 to 1959
- 2351940 to 1949
- 5931939 or earlier

- Rooms in owner-occupied houses in Gilmer County, West Virginia
- 01 room
- 02 rooms
- 243 rooms
- 1264 rooms
- 3255 rooms
- 3836 rooms
- 3167 rooms
- 2078 rooms
- 2469+ rooms

- Rooms in renter-occupied apartments in Gilmer County, West Virginia
- 21 room
- 62 rooms
- 653 rooms
- 744 rooms
- 1535 rooms
- 1466 rooms
- 597 rooms
- 328 rooms
- 279+ rooms

- Bedrooms in owner-occupied houses in Gilmer County, West Virginia
- 0no bedroom
- 91 bedroom
- 2752 bedrooms
- 1,0123 bedrooms
- 2884 bedrooms
- 475+ bedrooms

- Bedrooms in renter-occupied apartments in Gilmer County, West Virginia
- 2no bedroom
- 511 bedroom
- 1972 bedrooms
- 2623 bedrooms
- 494 bedrooms
- 55+ bedrooms

- Cars and other vehicles available in Gilmer County in owner-occupied houses/condos
- 80no vehicle
- 3821 vehicle
- 7292 vehicles
- 2553 vehicles
- 1184 vehicles
- 655+ vehicles

- Cars and other vehicles available in Gilmer County in renter-occupied apartments
- 63no vehicle
- 3091 vehicle
- 1392 vehicles
- 473 vehicles
- 04 vehicles
- 05+ vehicles
89.0% of Gilmer County residents lived in the same house 1 years ago.
Out of people who lived in different houses, 27% lived in this county.
Out of people who lived in different counties, 67% lived in West Virginia.
| Gilmer County: | 89.0% |
| State average: | 89.6% |
Place of birth for U.S.-born residents:
- This state: 4,298
- Other state: 2,873
- Northeast: 689
- Midwest: 866
- South: 1,168
- West: 134


- 76.8%Utility gas
- 11.3%Electricity
- 5.5%Bottled, tank, or LP gas
- 3.4%Wood
- 2.3%Other fuel
- 0.8%No fuel used

- 67.3%Utility gas
- 24.1%Electricity
- 6.2%Wood
- 1.8%Bottled, tank, or LP gas
- 0.5%Other fuel
Private vs. public school enrollment:
| Here: | 0.0% |
| West Virginia: | 12.2% |
| Here: | 6.8% |
| West Virginia: | 8.8% |
| Here: | 26.7% |
| West Virginia: | 17.3% |


Gilmer County government finances - Expenditure in 2018:
- Charges - Other: $74,000
Other: $42,000
Sewerage: $7,000
Sewerage: $6,000
- Current Operations - Central Staff Services: $535,000
Central Staff Services: $532,000
General - Other: $418,000
Financial Administration: $368,000
Financial Administration: $337,000
General - Other: $304,000
Judicial and Legal Services: $263,000
General Public Buildings: $261,000
Judicial and Legal Services: $261,000
General Public Buildings: $252,000
Health - Other: $244,000
Police Protection: $179,000
Police Protection: $157,000
Sewerage: $8,000
Sewerage: $7,000
Natural Resources - Other: $4,000
Natural Resources - Other: $4,000
- Intergovernmental to State - Correctional Institutions: $270,000
Correctional Institutions: $131,000
- Miscellaneous - General Revenue - Other: $114,000
General Revenue - Other: $83,000
Rents: $48,000
Fines and Forfeits: $41,000
Fines and Forfeits: $38,000
Rents: $11,000
Interest Earnings: $5,000
Sale of Property: $4,000
Royalties: $3,000
Royalties: $2,000
Interest Earnings: $1,000
- Other Funds - Cash and Securities: $1,000,000
Cash and Securities: $1,000,000
- State Intergovernmental - General Local Government Support: $166,000
General Local Government Support: $134,000
Health and Hospitals: $124,000
Other: $112,000
Other: $85,000
- Tax - Property: $1,438,000
Property: $1,300,000
Public Utilities Sales: $554,000
Public Utilities Sales: $464,000
Other License: $14,000
Other License: $10,000
- Total Salaries and Wages: $2,049,000
: $1,878,000
Gilmer County government finances - Revenue in 2018:
- Charges - Other: $74,000
Other: $42,000
Sewerage: $7,000
Sewerage: $6,000
- Current Operations - Central Staff Services: $535,000
Central Staff Services: $532,000
General - Other: $418,000
Financial Administration: $368,000
Financial Administration: $337,000
General - Other: $304,000
Judicial and Legal Services: $263,000
General Public Buildings: $261,000
Judicial and Legal Services: $261,000
General Public Buildings: $252,000
Health - Other: $244,000
Police Protection: $179,000
Police Protection: $157,000
Sewerage: $8,000
Sewerage: $7,000
Natural Resources - Other: $4,000
Natural Resources - Other: $4,000
- Intergovernmental to State - Correctional Institutions: $270,000
Correctional Institutions: $131,000
- Miscellaneous - General Revenue - Other: $114,000
General Revenue - Other: $83,000
Rents: $48,000
Fines and Forfeits: $41,000
Fines and Forfeits: $38,000
Rents: $11,000
Interest Earnings: $5,000
Sale of Property: $4,000
Royalties: $3,000
Royalties: $2,000
Interest Earnings: $1,000
- Other Funds - Cash and Securities: $1,000,000
Cash and Securities: $1,000,000
- State Intergovernmental - General Local Government Support: $166,000
General Local Government Support: $134,000
Health and Hospitals: $124,000
Other: $112,000
Other: $85,000
- Tax - Property: $1,438,000
Property: $1,300,000
Public Utilities Sales: $554,000
Public Utilities Sales: $464,000
Other License: $14,000
Other License: $10,000
- Total Salaries and Wages: $2,049,000
: $1,878,000
Gilmer County government finances - Debt in 2018:
- Charges - Other: $74,000
Other: $42,000
Sewerage: $7,000
Sewerage: $6,000
- Current Operations - Central Staff Services: $535,000
Central Staff Services: $532,000
General - Other: $418,000
Financial Administration: $368,000
Financial Administration: $337,000
General - Other: $304,000
Judicial and Legal Services: $263,000
General Public Buildings: $261,000
Judicial and Legal Services: $261,000
General Public Buildings: $252,000
Health - Other: $244,000
Police Protection: $179,000
Police Protection: $157,000
Sewerage: $8,000
Sewerage: $7,000
Natural Resources - Other: $4,000
Natural Resources - Other: $4,000
- Intergovernmental to State - Correctional Institutions: $270,000
Correctional Institutions: $131,000
- Miscellaneous - General Revenue - Other: $114,000
General Revenue - Other: $83,000
Rents: $48,000
Fines and Forfeits: $41,000
Fines and Forfeits: $38,000
Rents: $11,000
Interest Earnings: $5,000
Sale of Property: $4,000
Royalties: $3,000
Royalties: $2,000
Interest Earnings: $1,000
- Other Funds - Cash and Securities: $1,000,000
Cash and Securities: $1,000,000
- State Intergovernmental - General Local Government Support: $166,000
General Local Government Support: $134,000
Health and Hospitals: $124,000
Other: $112,000
Other: $85,000
- Tax - Property: $1,438,000
Property: $1,300,000
Public Utilities Sales: $554,000
Public Utilities Sales: $464,000
Other License: $14,000
Other License: $10,000
- Total Salaries and Wages: $2,049,000
: $1,878,000
Gilmer County government finances - Cash and Securities in 2018:
- Charges - Other: $74,000
Other: $42,000
Sewerage: $7,000
Sewerage: $6,000
- Current Operations - Central Staff Services: $535,000
Central Staff Services: $532,000
General - Other: $418,000
Financial Administration: $368,000
Financial Administration: $337,000
General - Other: $304,000
Judicial and Legal Services: $263,000
General Public Buildings: $261,000
Judicial and Legal Services: $261,000
General Public Buildings: $252,000
Health - Other: $244,000
Police Protection: $179,000
Police Protection: $157,000
Sewerage: $8,000
Sewerage: $7,000
Natural Resources - Other: $4,000
Natural Resources - Other: $4,000
- Intergovernmental to State - Correctional Institutions: $270,000
Correctional Institutions: $131,000
- Miscellaneous - General Revenue - Other: $114,000
General Revenue - Other: $83,000
Rents: $48,000
Fines and Forfeits: $41,000
Fines and Forfeits: $38,000
Rents: $11,000
Interest Earnings: $5,000
Sale of Property: $4,000
Royalties: $3,000
Royalties: $2,000
Interest Earnings: $1,000
- Other Funds - Cash and Securities: $1,000,000
Cash and Securities: $1,000,000
- State Intergovernmental - General Local Government Support: $166,000
General Local Government Support: $134,000
Health and Hospitals: $124,000
Other: $112,000
Other: $85,000
- Tax - Property: $1,438,000
Property: $1,300,000
Public Utilities Sales: $554,000
Public Utilities Sales: $464,000
Other License: $14,000
Other License: $10,000
- Total Salaries and Wages: $2,049,000
: $1,878,000
Supplemental Security Income (SSI) in 2006:
- Total number of recipients: 378
- Number of aged recipients: 33
- Number of blind and disabled recipients: 345
- Number of recipients under 18: 29
- Number of recipients between 18 and 64: 261
- Number of recipients older than 64: 88
- Number of recipients also receiving OASDI: 136
- Amount of payments (thousands of dollars): 156
| Most common first names in Gilmer County, WV among deceased individuals | ||
| Name | Count | Lived (average) |
|---|---|---|
| James | 30 | 73.7 years |
| Mary | 27 | 79.3 years |
| John | 26 | 76.1 years |
| Robert | 22 | 64.5 years |
| William | 21 | 75.4 years |
| Charles | 20 | 75.1 years |
| Ruth | 13 | 78.6 years |
| Eva | 12 | 82.7 years |
| Ernest | 10 | 75.7 years |
| Edna | 10 | 76.2 years |
| Most common last names in Gilmer County, WV among deceased individuals | ||
| Last name | Count | Lived (average) |
|---|---|---|
| Collins | 22 | 80.5 years |
| Miller | 19 | 72.9 years |
| Reed | 18 | 75.9 years |
| Moore | 16 | 76.3 years |
| Greenlief | 15 | 69.9 years |
| James | 15 | 78.3 years |
| Smith | 15 | 78.5 years |
| Stalnaker | 15 | 79.5 years |
| Jones | 15 | 83.5 years |
| Moss | 14 | 70.4 years |
| Businesses in Gilmer County, WV | ||||
| Name | Count | Name | Count | |
|---|---|---|---|---|
| Best Western | 1 | Rite Aid | 1 | |
| H&R Block | 2 | Subway | 1 | |
| McDonald's | 1 | True Value | 1 | |
| Pizza Hut | 1 | U-Haul | 1 | |