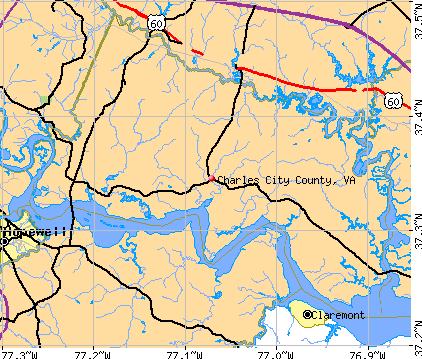
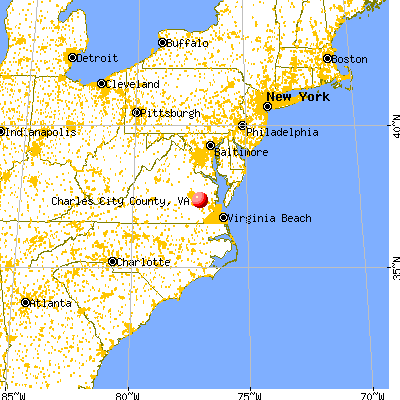
Charles City County, Virginia (VA)
County owner-occupied free and clear houses and condos in 2010: 917
County owner-occupied houses and condos in 2000: 2,266
Renter-occupied apartments: 507 (it was 404 in 2000)
| % of renters here: | 15% |
| State: | 33% |
Land area: 183 sq. mi.
Water area: 21.5 sq. mi.
Population density: 37 people per square mile (low).
Industries providing employment: Educational, health and social services (17.9%), Manufacturing (12.4%), Retail trade (10.9%).
Type of workers:
- Private wage or salary: 76%
- Government: 18%
- Self-employed, not incorporated: 5%
- Unpaid family work: 0%
- OSM Map
- General Map
- Google Map
- MSN Map

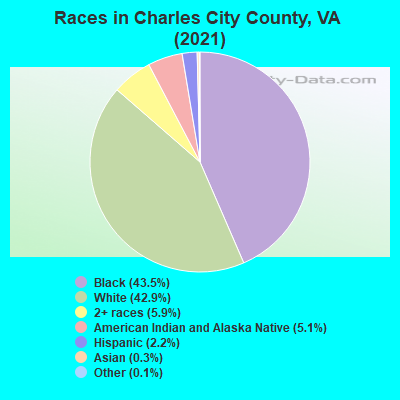
- 2,93943.4%Black Non-Hispanic Alone
- 2,91343.0%White Non-Hispanic Alone
- 3805.6%American Indian and Alaska Native alone
- 3395.0%Two or more races
- 1522.2%Hispanic or Latino
- 430.6%Some other race alone
- 130.2%Asian alone
| Median resident age: | 52.4 years |
| Virginia median age: | 39.0 years |
| Males: 3,385 | |
| Females: 3,421 |

 | Wash DC needs to annex Arlington and Alexandria back (95 replies) |
| VA Pics (256 replies) |
| Trails for dirtbikes and/or fourwheelers (3 replies) |
| Torndado Activity - Conflicting Information (7 replies) |
| Bike Trails (6 replies) |
| Hampton Roads Vs. Richmond (63 replies) |
| Charles City County: | 2.0 people |
| Virginia: | 3 people |
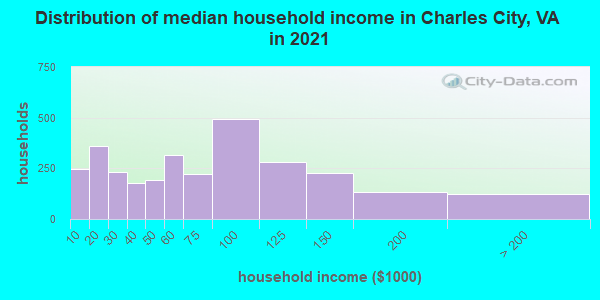
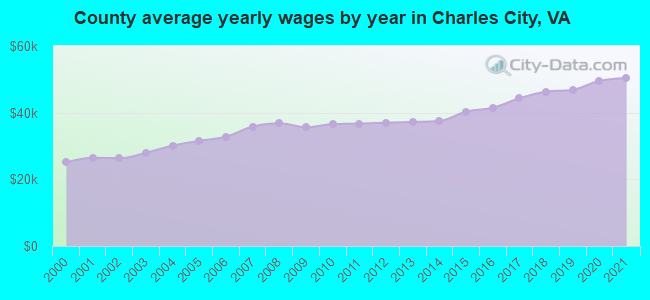
Estimated median household income in 2022: $64,538 ($42,745 in 1999)
| This county: | $64,538 |
| Virginia: | $85,873 |
Median contract rent in 2022 for apartments: $653 (lower quartile is $341, upper quartile is $932)
| This county: | $653 |
| State: | $1270 |
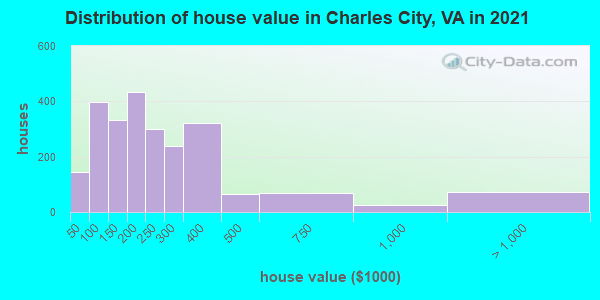
Estimated median house or condo value in 2022: $213,953 (it was $84,000 in 2000)
| Charles City: | $213,953 |
| Virginia: | $365,700 |
Mean price in 2022:
Median monthly housing costs for homes and condos with a mortgage: $1,300Detached houses: $350,080
Here: $350,080 State: $472,865 Townhouses or other attached units: $318,933
Here: $318,933 State: $457,437 Mobile homes: $174,604
Here: $174,604 State: $100,736
Median monthly housing costs for units without a mortgage: $383
Institutionalized population: 0
Crime in 2021 (reported by the sheriff's office or county police, not the county total):
- Murders: 0
- Rapes: 0
- Robberies: 0
- Assaults: 12
- Burglaries: 3
- Thefts: 19
- Auto thefts: 2
Crime in 2020 (reported by the sheriff's office or county police, not the county total):
- Murders: 1
- Rapes: 2
- Robberies: 0
- Assaults: 8
- Burglaries: 13
- Thefts: 20
- Auto thefts: 1
Health of residents in Charles City County based on CDC Behavioral Risk Factor Surveillance System Survey Questionnaires from 2013 to 2021:
General health status score of residents in this county from 1 (poor) to 5 (excellent) is 3.5. This is about average.73.5% of residents exercised in the past month. This is about average.
42.1% of residents smoked 100+ cigarettes in their lives. This is about average.
54.8% of adult residents drank alcohol in the past 30 days. This is less than average.
74.3% of residents visited a dentist within the past year. This is about average.
Average weight of males is 200 pounds. This is more than average.
Average weight of females is 167 pounds. This is more than average.
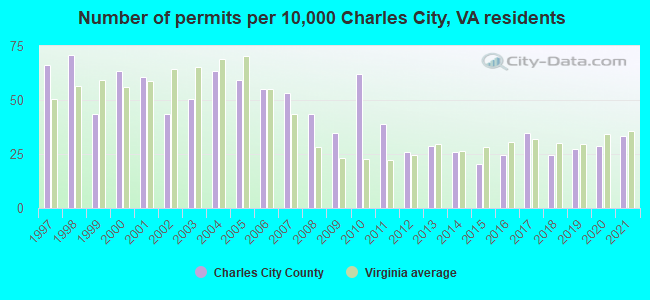
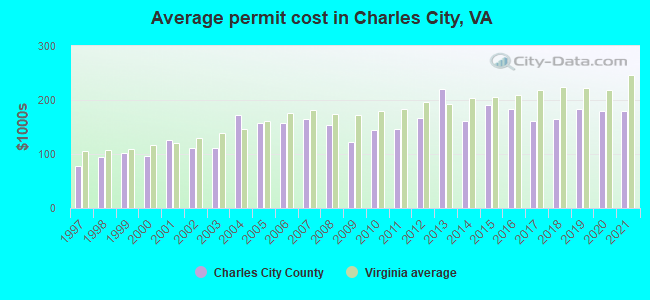
Single-family new house construction building permits:
- 2022: 21 buildings, average cost: $180,000
- 2021: 23 buildings, average cost: $180,300
- 2020: 20 buildings, average cost: $179,200
- 2019: 19 buildings, average cost: $183,000
- 2018: 17 buildings, average cost: $164,000
- 2017: 24 buildings, average cost: $162,400
- 2016: 17 buildings, average cost: $183,700
- 2015: 14 buildings, average cost: $190,700
- 2014: 18 buildings, average cost: $161,400
- 2013: 20 buildings, average cost: $221,100
- 2012: 18 buildings, average cost: $166,100
- 2011: 27 buildings, average cost: $145,800
- 2010: 43 buildings, average cost: $143,600
- 2009: 24 buildings, average cost: $122,400
- 2008: 30 buildings, average cost: $152,900
- 2007: 37 buildings, average cost: $165,100
- 2006: 38 buildings, average cost: $156,600
- 2005: 41 buildings, average cost: $157,700
- 2004: 44 buildings, average cost: $172,300
- 2003: 35 buildings, average cost: $111,800
- 2002: 30 buildings, average cost: $111,400
- 2001: 42 buildings, average cost: $126,400
- 2000: 44 buildings, average cost: $97,300
- 1999: 30 buildings, average cost: $101,500
- 1998: 49 buildings, average cost: $94,400
- 1997: 46 buildings, average cost: $77,700
Median real estate property taxes paid for housing units with mortgages in 2022: $1,368 (0.6%)
Median real estate property taxes paid for housing units with no mortgage in 2022: $1,299 (0.7%)

| Charles City County: | 13.2% |
| Virginia: | 10.6% |
Median age of residents in 2022: 52.4 years old
(Males: 50.6 years old, Females: 53.9 years old)
(Median age for: White residents: 52.3 years old, Black residents: 54.0 years old, American Indian residents: 56.7 years old, Asian residents: 54.8 years old, Hispanic or Latino residents: 37.0 years old, Other race residents: 61.6 years old)
Area name: Richmond, VA HUD Metro FMR Area
Fair market rent in 2006 for a 1-bedroom apartment in Charles City County is $678 a month.
Fair market rent for a 2-bedroom apartment is $757 a month.
Fair market rent for a 3-bedroom apartment is $1010 a month.
Cities in this county include: Charles City.
2023 air pollution in Charles City County:
Nitrogen Dioxide: 0.00 ppm (standard limit: 0.053 ppm). Below U.S. average.
Ozone (1-hour): 0.035 ppm (standard limit: 0.12 ppm). Near U.S. average.
Particulate Matter (PM2.5) Annual: 9.1 µg/m3(standard limit: 15.0 µg/m3). Near U.S. average.
Sulfur Oxides Annual: 0.000 ppm (standard limit: 0.03 ppm). Near U.S. average.
Neighboring counties: Alameda County, California  , Campbell County , Carter County, Missouri , Cedar County, Missouri , Giles County , Mississippi County, Missouri .
| Here: | 2.9% |
| Virginia: | 2.7% |

Current college students: 240
People 25 years of age or older with a high school degree or higher: 84.9%
People 25 years of age or older with a bachelor's degree or higher: 16.2%
Number of foreign born residents: 126 (49.4% naturalized citizens)
| Charles City County: | 1.9% |
| Whole state: | 12.7% |
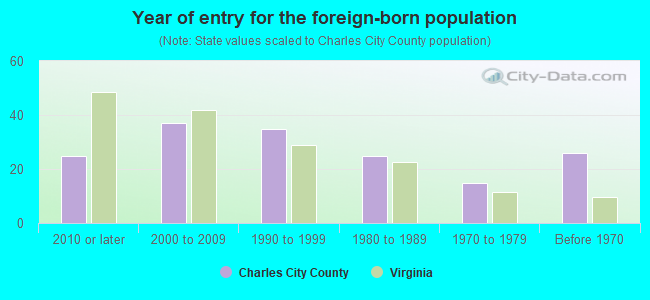
- Year of entry for the foreign-born population
- 312010 or later
- 232000 to 2009
- 321990 to 1999
- 251980 to 1989
- 151970 to 1979
- 26Before 1970
Mean travel time to work (commute): " minutes
Percentage of county residents living and working in this county: 100.7%
Housing units in structures:
- One, detached: 2,832
- One, attached: 24
- Two: 16
- 3 or 4: 4
- 5 to 9: 28
- 10 to 19: 4
- 20 to 49: 10
- 50 or more: 13
- Mobile homes: 358
Housing units in Charles City County with a mortgage: 1,361 (71 second mortgage, 1 home equity loan, 60 both second mortgage and home equity loan)
Houses without a mortgage: 97
| Here: | 1.0% with mortgage |
| State: | 97.2% with mortgage |
Religion statistics for Charles City County
| Religion | Adherents | Congregations |
|---|---|---|
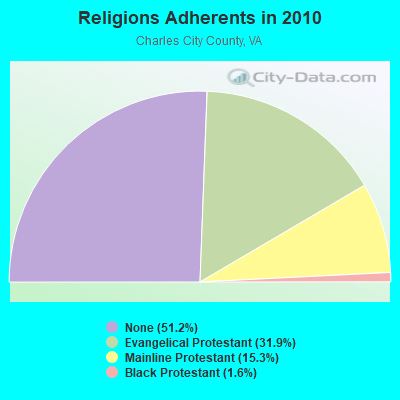
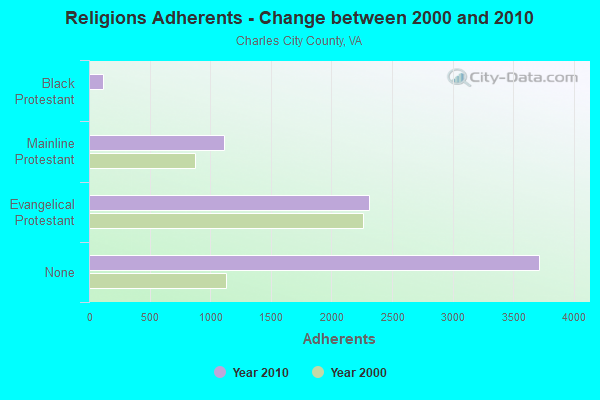
| Evangelical Protestant | 2,312 | 3 |
| Mainline Protestant | 1,112 | 5 |
| Black Protestant | 116 | 1 |
| None | 3,716 | - |
Source: Clifford Grammich, Kirk Hadaway, Richard Houseal, Dale E.Jones, Alexei Krindatch, Richie Stanley and Richard H.Taylor. 2012. 2010 U.S.Religion Census: Religious Congregations & Membership Study. Association of Statisticians of American Religious Bodies. Jones, Dale E., et al. 2002. Congregations and Membership in the United States 2000. Nashville, TN: Glenmary Research Center.
Food Environment Statistics:
| Charles City County: | 1.40 / 10,000 pop. |
| State: | 2.03 / 10,000 pop. |
| Charles City County: | 2.81 / 10,000 pop. |
| Virginia: | 4.03 / 10,000 pop. |
| This county: | 1.40 / 10,000 pop. |
| State: | 7.65 / 10,000 pop. |
| Charles City County: | 14.4% |
| Virginia: | 9.3% |
| Charles City County: | 33.4% |
| State: | 26.7% |
| Here: | 11.5% |
| State: | 18.6% |
Agriculture in Charles City County:
Average size of farms: 326 acresAverage value of agricultural products sold per farm: $71,343
Average value of crops sold per acre for harvested cropland: $292.64
The value of livestock, poultry, and their products as a percentage of the total market value of agricultural products sold: 21.55%
Average total farm production expenses per farm: $73,950
Harvested cropland as a percentage of land in farms: 58.69%
Irrigated harvested cropland as a percentage of land in farms: 6.33%
Average market value of all machinery and equipment per farm: $85,628
The percentage of farms operated by a family or individual: 80.68%
Average age of principal farm operators: 56 years
Average number of cattle and calves per 100 acres of all land in farms: 2.39
Corn for grain: 5011 harvested acres
All wheat for grain: 5746 harvested acres
Upland cotton: 1598 harvested acres
Soybeans for beans: 7871 harvested acres
Land in orchards: 38 acres
Earthquake activity:
Charles City County-area historical earthquake activity is significantly above Virginia state average. It is 57% smaller than the overall U.S. average.On 8/23/2011 at 17:51:04, a magnitude 5.8 (5.8 MW, Depth: 3.7 mi, Class: Moderate, Intensity: VI - VII) earthquake occurred 61.4 miles away from Charles City County center
On 12/9/2003 at 20:59:14, a magnitude 4.5 (4.5 MB, 4.5 LG, Class: Light, Intensity: IV - V) earthquake occurred 48.6 miles away from the county center
On 12/9/2003 at 20:59:18, a magnitude 4.5 (4.5 ML, Depth: 6.2 mi) earthquake occurred 63.7 miles away from the county center
On 8/25/2011 at 05:07:52, a magnitude 4.5 (4.5 ML, Depth: 4.2 mi) earthquake occurred 64.3 miles away from the county center
On 8/9/2020 at 12:07:37, a magnitude 5.1 (5.1 MW, Depth: 4.7 mi) earthquake occurred 230.4 miles away from Charles City County center
On 8/24/2011 at 00:04:36, a magnitude 4.2 (4.2 ML) earthquake occurred 62.4 miles away from the county center
Magnitude types: regional Lg-wave magnitude (LG), body-wave magnitude (MB), local magnitude (ML), moment magnitude (MW)
Most recent natural disasters:
- Virginia Covid-19 Pandemic, Incident Period: January 20, 2020, Major Disaster (Presidential) Declared DR-4512-VA: April 2, 2020, FEMA Id: 4512, Natural disaster type: Other
- Virginia Hurricane Florence, Incident Period: September 8, 2018 - September 21, 2018, FEMA Id: 4401, Natural disaster type: Hurricane
- Virginia Hurricane Sandy, Incident Period: October 26, 2012 to November 01, 2012, Emergency Declared EM-3359: October 29, 2012, FEMA Id: 3359, Natural disaster type: Hurricane
- Virginia Hurricane Irene, Incident Period: August 26, 2011 to August 28, 2011, Major Disaster (Presidential) Declared DR-4024: September 03, 2011, FEMA Id: 4024, Natural disaster type: Hurricane
- Virginia Severe Storms and Flooding, Including Severe Storms and Flooding Associated with Tropical Depression Ernesto, Incident Period: August 29, 2006 to September 07, 2006, Major Disaster (Presidential) Declared DR-1661: September 22, 2006, FEMA Id: 1661, Natural disaster type: Storm, Flood, Tropical Depression
- Virginia Hurricane Katrina Evacuation, Incident Period: August 29, 2005 to October 01, 2005, Emergency Declared EM-3240: September 12, 2005, FEMA Id: 3240, Natural disaster type: Hurricane
- Virginia Severe Storms, Flooding and Tornadoes Associated with Tropical Depression Gaston, Incident Period: August 30, 2004 to September 08, 2004, Major Disaster (Presidential) Declared DR-1544: September 03, 2004, FEMA Id: 1544, Natural disaster type: Storm, Tornado, Flood, Tropical Depression
- Virginia Hurricane Isabel, Incident Period: September 18, 2003 to October 01, 2003, Major Disaster (Presidential) Declared DR-1491: September 18, 2003, FEMA Id: 1491, Natural disaster type: Hurricane
- Virginia Winter Storm, Incident Period: January 25, 2000 to January 30, 2000, Major Disaster (Presidential) Declared DR-1318: February 28, 2000, FEMA Id: 1318, Natural disaster type: Winter Storm
- Virginia Hurricane Floyd, Incident Period: September 13, 1999 to September 26, 1999, Major Disaster (Presidential) Declared DR-1293: September 18, 1999, FEMA Id: 1293, Natural disaster type: Hurricane
- 5 other natural disasters have been reported since 1953.
The number of natural disasters in Charles City County (15) is near the US average (15).
Major Disasters (Presidential) Declared: 10
Emergencies Declared: 4
Causes of natural disasters: Hurricanes: 7, Floods: 2, Storms: 2, Tropical Depressions: 2, Winter Storms: 2, Blizzard: 1, Drought: 1, Tornado: 1, Tropical Storm: 1, Other: 1 (Note: some incidents may be assigned to more than one category).
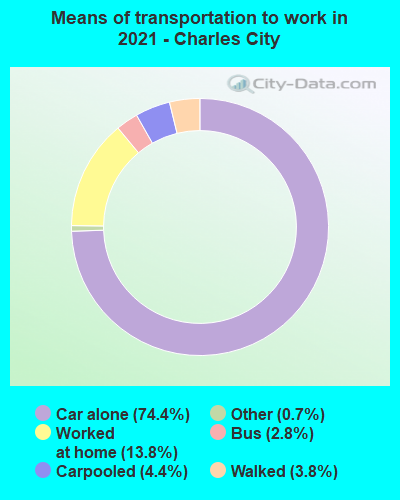
Means of transportation to work:
- Drove a car alone: 1,048 (66.4%)
- Carpooled: 147 (9.3%)
- Bus: 20 (1.3%)
- Taxicab, motorcycle, or other means: 47 (3.0%)
- Walked: 10 (0.6%)
- Worked at home: 318 (20.1%)
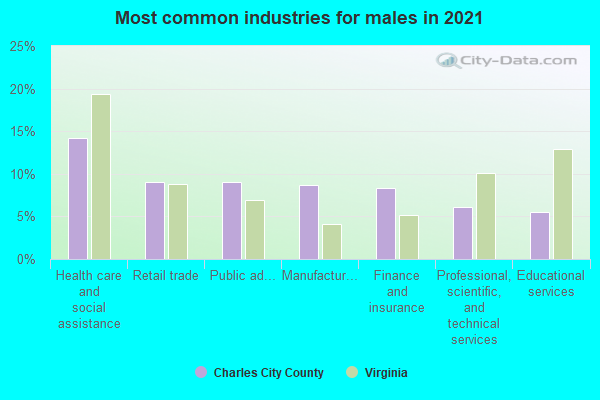
- Health care and social assistance (15%)
- Retail trade (11%)
- Public administration (10%)
- Finance and insurance (9%)
- Manufacturing (8%)
- Professional, scientific, and technical services (6%)
- Educational services (6%)
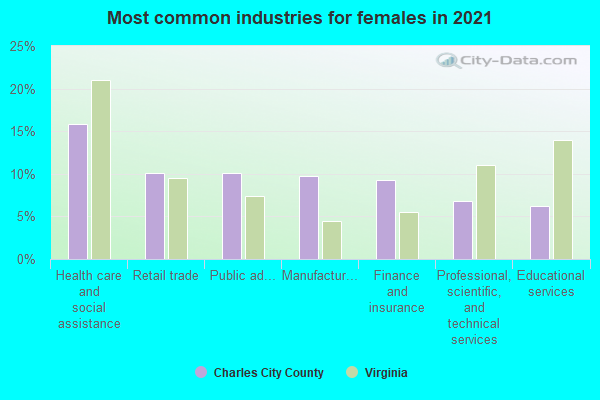
- Health care and social assistance (17%)
- Retail trade (12%)
- Public administration (11%)
- Finance and insurance (11%)
- Manufacturing (9%)
- Professional, scientific, and technical services (7%)
- Educational services (7%)
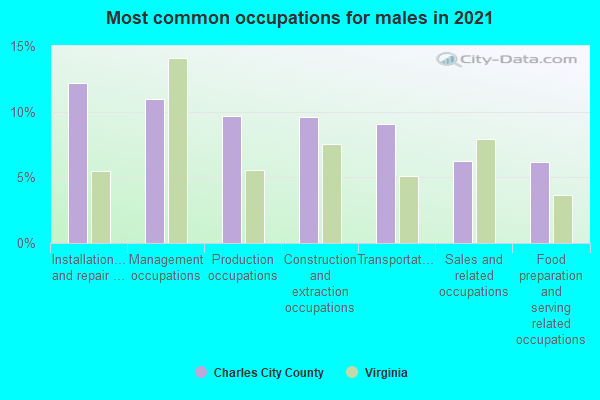
- Transportation occupations (13%)
- Installation, maintenance, and repair occupations (12%)
- Management occupations (11%)
- Construction and extraction occupations (11%)
- Production occupations (9%)
- Sales and related occupations (6%)
- Food preparation and serving related occupations (6%)
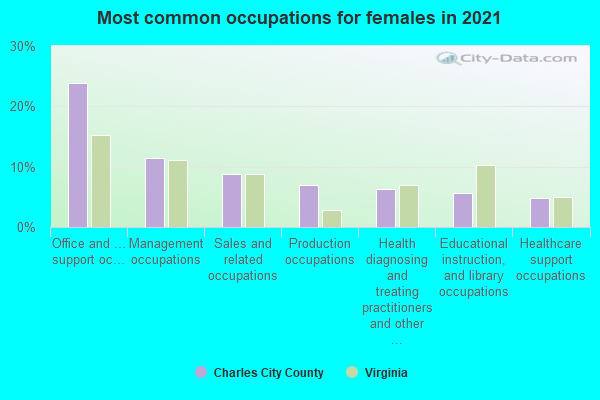
- Office and administrative support occupations (24%)
- Management occupations (11%)
- Sales and related occupations (10%)
- Health diagnosing and treating practitioners and other technical occupations (6%)
- Production occupations (5%)
- Business and financial operations occupations (5%)
- Healthcare support occupations (5%)
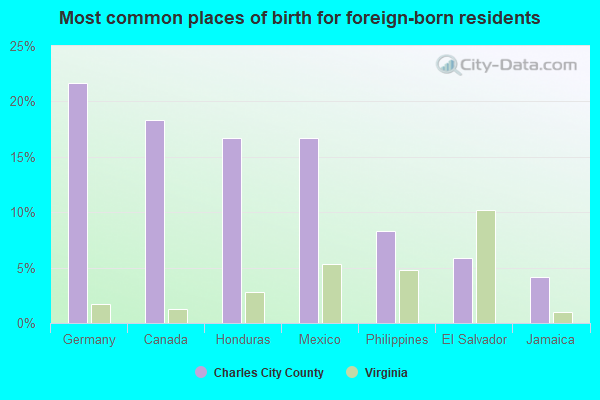
- Honduras (21%)
- United Kingdom, excluding England and Scotland (17%)
- Canada (16%)
- Mexico (13%)
- El Salvador (7%)
- Germany (6%)
- Philippines (4%)
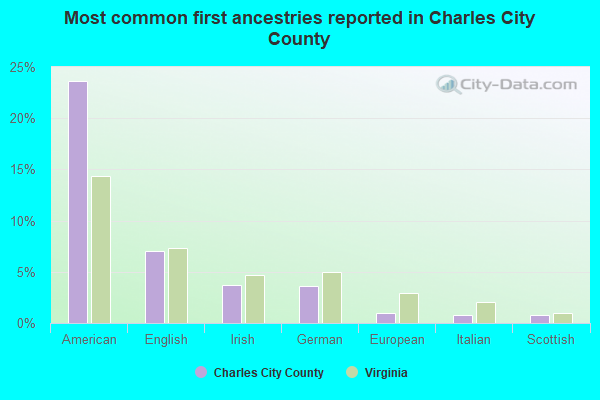
- American (22%)
- English (6%)
- Irish (4%)
- German (3%)
- European (1%)
- Scottish (1%)
- African (1%)
5.60% of this county's 2021 resident taxpayers lived in other counties in 2020 ($60,942 average adjusted gross income)
| Here: | 5.60% |
| Virginia average: | 10.16% |
10 or fewer of this county's residents moved from foreign countries.
5.60% relocated from other counties in Virginia ($60,942 average AGI)
10 or fewer of this county's residents relocated from other states.
Top counties from which taxpayers relocated into this county between 2020 and 2021:
| from Henrico County, VA | |
| from New Kent County, VA |
6.04% of this county's 2020 resident taxpayers moved to other counties in 2021 ($48,515 average adjusted gross income)
| Here: | 6.04% |
| Virginia average: | 10.20% |
10 or fewer of this county's residents moved to foreign countries.
6.04% relocated to other counties in Virginia ($48,515 average AGI)
10 or fewer of this county's residents relocated to other states.
Top counties to which taxpayers relocated from this county between 2020 and 2021:
| to Henrico County, VA |
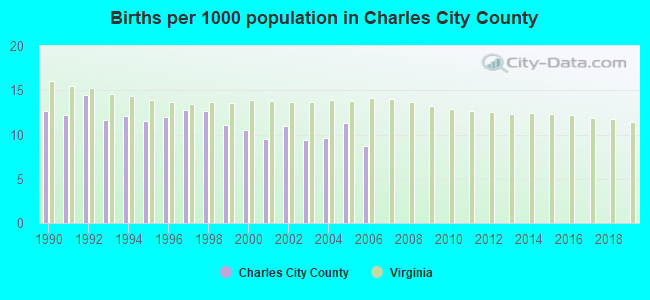
Births per 1000 population from 1990 to 1999: 12.3
Births per 1000 population from 2000 to 2006: 10.0
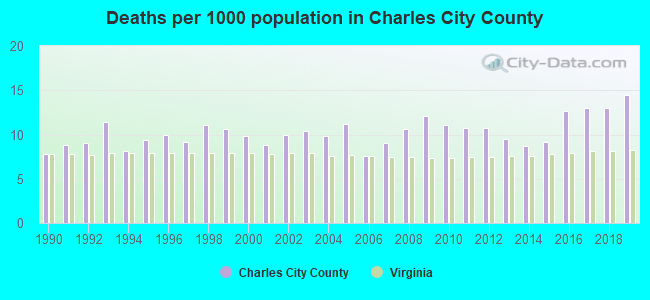
Deaths per 1000 population from 1990 to 1999: 9.5
Deaths per 1000 population from 2000 to 2009: 9.9
Deaths per 1000 population from 2010 to 2020: 11.6
Infant deaths per 1000 live births from 1990 to 1999: 7.2
Infant deaths per 1000 live births from 2000 to 2006: 12.4
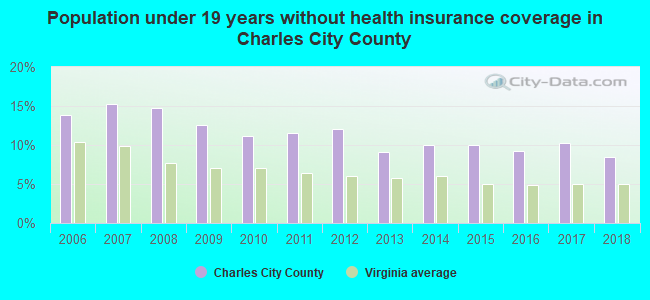
Persons under 19 years old without health insurance coverage in 2018: 8.5%

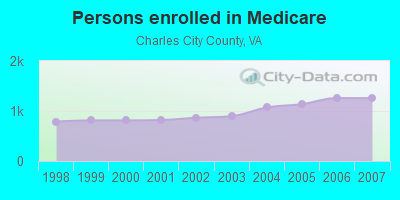
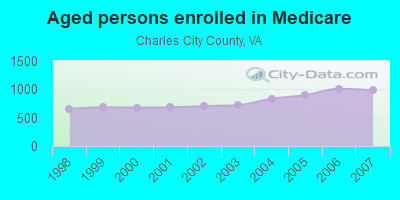
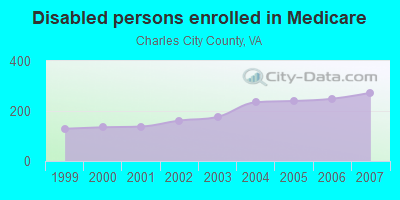
Persons enrolled in hospital insurance and/or supplemental medical insurance (Medicare) in July 1, 2007: 1,257 (984 aged, 273 disabled)
Children under 18 without health insurance coverage in 2007: 201 (14%)
Most common underlying causes of death in Charles City County, Virginia in 1999 - 2019:
- Acute myocardial infarction, unspecified (21)
- Bronchus or lung, unspecified - Malignant neoplasms (10)
Population without health insurance coverage in 2000: 12%
Children under 18 without health insurance coverage in 2000: 8%
Medical specialist MDs per 100,000 population in 2005: 1,264
Total deaths per 100,000 population, July 2005 - July 2006: 28
Limited-service eating places per 100,000 population in 2005 : 14
Beer, wine & liquor stores per 100,000 population in 2005: 1
Crimes per 100,000 population in 1996: 1
Household type by relationship:
Households: 6,806- Male householders: 1,515 (587 living alone), Female householders: 1,469 (492 living alone)
1,242 spouses (1,242 opposite-sex spouses), 158 unmarried partners, (156 opposite-sex unmarried partners), 1,668 children (1,530 natural, 32 adopted, 104 stepchildren), 248 grandchildren, 62 brothers or sisters, 153 parents, 20 foster children, 90 other relatives, 174 non-relatives
Size of family households: 964 2-persons, 409 3-persons, 247 4-persons, 108 5-persons, 36 6-persons, 15 7-or-more-persons.
Size of nonfamily households: 1,079 1-person, 109 2-persons, 11 3-persons, 3 4-persons, 1 5-persons.
479 married couples with children.
284 single-parent households (60 men, 224 women).
97.9% of residents of Charles City speak English at home.
1.3% of residents speak Spanish at home (78% speak English very well, 10% speak English well, 12% speak English not well).
0.4% of residents speak other Indo-European language at home (89% speak English very well, 7% speak English well, 4% speak English not well).
0.2% of residents speak Asian or Pacific Island language at home (100% speak English very well).
0.1% of residents speak other language at home (100% speak English very well).
In fiscal year 2004:
Federal Government expenditure: $33,905,000 ($4,762 per capita)
Department of Defense expenditure: $1,016,000
Federal direct payments to individuals for retirement and disability: $18,535,000
Federal other direct payments to individuals: $6,568,000
Federal direct payments not to individuals: $750,000
Federal grants: $6,643,000
Federal procurement contracts: $262,000 ($55,000 Department of Defense)
Federal salaries and wages: $1,146,000 ($0,000 Department of Defense)
Federal Government direct loans: $0,000
Federal guaranteed/insured loans: $4,251,000
Federal Government insurance: $4,792,000
Population change from April 1, 2000 to July 1, 2005:
Births: 371| Here: | 52 per 1000 residents |
| State: | 70 per 1000 residents |
Deaths: 361
| Here: | 51 per 1000 residents |
| State: | 40 per 1000 residents |
Net international migration: +10
| Here: | +1 per 1000 residents |
| State: | +18 per 1000 residents |
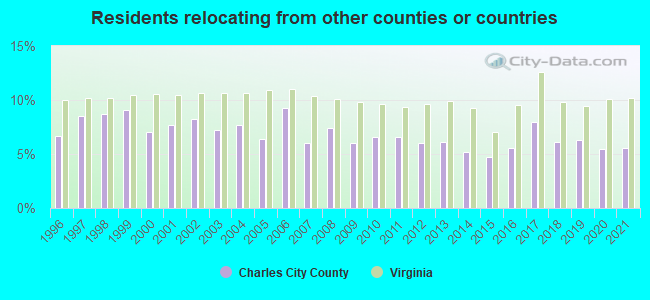
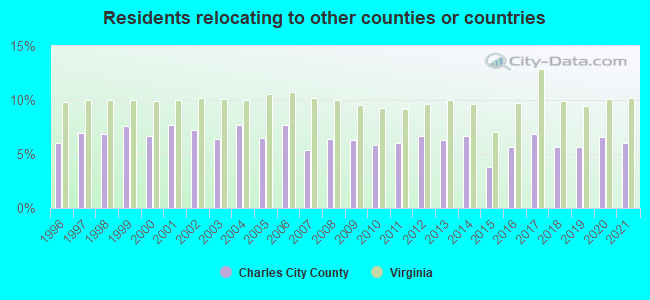
Net internal migration: +183
| Here: | +26 per 1000 residents |
| State: | +14 per 1000 residents |
Total withdrawal of fresh water for public supply: 0.04 millions of gallons per day (all from ground)
| Here: | 6.2 |
| State: | 7.0 |
| Here: | 5.1 |
| State: | 4.3 |
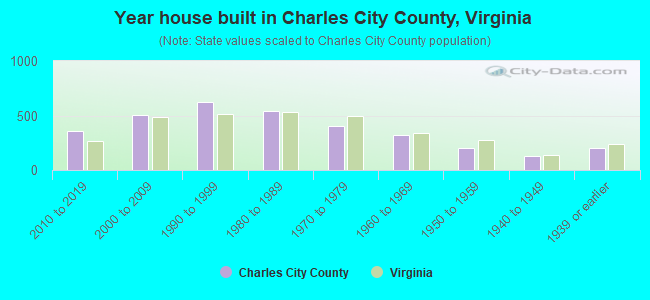
- Year house built in Charles City County, Virginia
- 02020 or later
- 3262010 to 2019
- 5732000 to 2009
- 6171990 to 1999
- 5101980 to 1989
- 3891970 to 1979
- 2981960 to 1969
- 2081950 to 1959
- 1271940 to 1949
- 2201939 or earlier
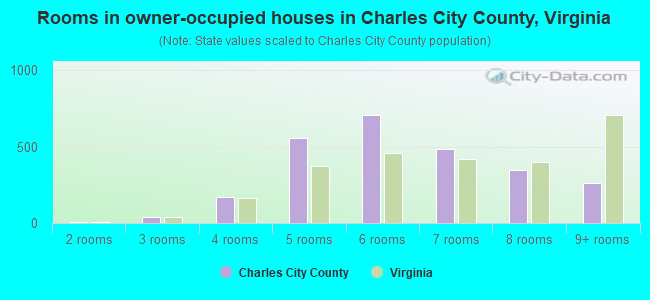
- Rooms in owner-occupied houses in Charles City County, Virginia
- 01 room
- 72 rooms
- 463 rooms
- 1544 rooms
- 5345 rooms
- 7386 rooms
- 4657 rooms
- 3418 rooms
- 2499+ rooms
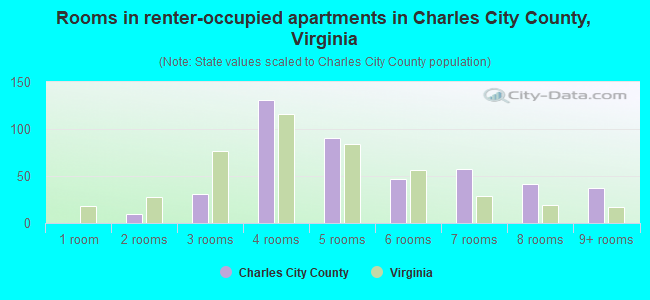
- Rooms in renter-occupied apartments in Charles City County, Virginia
- 01 room
- 82 rooms
- 393 rooms
- 1014 rooms
- 1085 rooms
- 506 rooms
- 707 rooms
- 308 rooms
- 409+ rooms

- Bedrooms in owner-occupied houses in Charles City County, Virginia
- 0no bedroom
- 621 bedroom
- 3422 bedrooms
- 1,7303 bedrooms
- 3754 bedrooms
- 305+ bedrooms
- Bedrooms in renter-occupied apartments in Charles City County, Virginia
- 8no bedroom
- 221 bedroom
- 1962 bedrooms
- 1603 bedrooms
- 424 bedrooms
- 185+ bedrooms
- Cars and other vehicles available in Charles City County in owner-occupied houses/condos
- 152no vehicle
- 4571 vehicle
- 8002 vehicles
- 5653 vehicles
- 2744 vehicles
- 2955+ vehicles
- Cars and other vehicles available in Charles City County in renter-occupied apartments
- 45no vehicle
- 1511 vehicle
- 1762 vehicles
- 423 vehicles
- 254 vehicles
- 75+ vehicles
95.1% of Charles City County residents lived in the same house 1 years ago.
Out of people who lived in different houses, 22% lived in this county.
Out of people who lived in different counties, 88% lived in Virginia.
| Charles City County: | 95.1% |
| State average: | 86.6% |
Place of birth for U.S.-born residents:
- This state: 5,312
- Other state: 1,275
- Northeast: 451
- Midwest: 157
- South: 587
- West: 76
- 82.8%Electricity
- 5.4%Bottled, tank, or LP gas
- 5.2%Fuel oil, kerosene, etc.
- 4.5%Wood
- 1.0%Utility gas
- 0.8%No fuel used
- 0.3%Other fuel
- 75.6%Electricity
- 14.1%Fuel oil, kerosene, etc.
- 4.7%Bottled, tank, or LP gas
- 2.9%Utility gas
- 2.2%Wood
- 0.4%Other fuel
Private vs. public school enrollment:
| Here: | 15.1% |
| Virginia: | 13.2% |
| Here: | 11.3% |
| Virginia: | 10.2% |
| Here: | 23.1% |
| Virginia: | 18.7% |

Charles City County government finances - Expenditure in 2017:
- Assistance and Subsidies - Public Welfare, Federal Categorical Assistance Programs: $115,000
- Charges - Elementary and Secondary Education School Lunch: $99,000
Parks and Recreation: $44,000
Solid Waste Management: $26,000
Elementary and Secondary Education School Tuition and Transportation: $20,000
- Construction - Sewerage: $14,000
- Current Operations - Elementary and Secondary Education: $10,191,000
Police Protection: $866,000
General Public Buildings: $803,000
Public Welfare - Other: $747,000
Judicial and Legal Services: $624,000
Financial Administration: $510,000
Central Staff Services: $458,000
Parks and Recreation: $453,000
Water Utilities: $368,000
General - Other: $334,000
Correctional Institutions: $277,000
Public Welfare Institutions: $246,000
Housing and Community Development: $243,000
Protective Inspection and Regulation - Other: $141,000
Sewerage: $134,000
Local Fire Protection: $132,000
Health - Other: $112,000
Libraries: $71,000
Natural Resources - Other: $66,000
Corrections - Other: $26,000
Sea and Inland Port Facilities: $22,000
- Federal Intergovernmental - Education: $66,000
- Intergovernmental to Local - Other - Elementary and Secondary Education: $191,000
- Local Intergovernmental - Education: $227,000
Other: $77,000
- Long Term Debt - Beginning Outstanding - Unspecified Public Purpose: $4,280,000
Outstanding Unspecified Public Purpose: $4,217,000
Retired Unspecified Public Purpose: $1,452,000
Issue, Unspecified Public Purpose: $1,389,000
Outstanding Nonguaranteed - Industrial Revenue: $288,000
Issue, Nonguaranteed - Public Debt for Private Purpose: $211,000
Beginning Outstanding - Public Debt for Private Purpose: $191,000
Retired Nonguaranteed - Public Debt for Private Purpose: $114,000
- Miscellaneous - General Revenue - Other: $71,000
Fines and Forfeits: $29,000
Donations From Private Sources: $22,000
Rents: $10,000
Interest Earnings: $10,000
Sale of Property: $4,000
- Other Capital Outlay - Elementary and Secondary Education: $520,000
Water Utilities: $72,000
Sewerage: $32,000
Police Protection: $24,000
Local Fire Protection: $13,000
General - Other: $10,000
Judicial and Legal Services: $1,000
- Other Funds - Cash and Securities: $8,301,000
- Revenue - Water Utilities: $61,000
- Sinking Funds - Cash and Securities: $406,000
- State Intergovernmental - Education: $5,093,000
- Tax - Property: $11,010,000
General Sales and Gross Receipts: $830,000
Public Utilities Sales: $301,000
Occupation and Business License - Other: $175,000
- Total Salaries and Wages: $5,716,000
Charles City County government finances - Revenue in 2017:
- Assistance and Subsidies - Public Welfare, Federal Categorical Assistance Programs: $115,000
- Charges - Elementary and Secondary Education School Lunch: $99,000
Parks and Recreation: $44,000
Solid Waste Management: $26,000
Elementary and Secondary Education School Tuition and Transportation: $20,000
- Construction - Sewerage: $14,000
- Current Operations - Elementary and Secondary Education: $10,191,000
Police Protection: $866,000
General Public Buildings: $803,000
Public Welfare - Other: $747,000
Judicial and Legal Services: $624,000
Financial Administration: $510,000
Central Staff Services: $458,000
Parks and Recreation: $453,000
Water Utilities: $368,000
General - Other: $334,000
Correctional Institutions: $277,000
Public Welfare Institutions: $246,000
Housing and Community Development: $243,000
Protective Inspection and Regulation - Other: $141,000
Sewerage: $134,000
Local Fire Protection: $132,000
Health - Other: $112,000
Libraries: $71,000
Natural Resources - Other: $66,000
Corrections - Other: $26,000
Sea and Inland Port Facilities: $22,000
- Federal Intergovernmental - Education: $66,000
- Intergovernmental to Local - Other - Elementary and Secondary Education: $191,000
- Local Intergovernmental - Education: $227,000
Other: $77,000
- Long Term Debt - Beginning Outstanding - Unspecified Public Purpose: $4,280,000
Outstanding Unspecified Public Purpose: $4,217,000
Retired Unspecified Public Purpose: $1,452,000
Issue, Unspecified Public Purpose: $1,389,000
Outstanding Nonguaranteed - Industrial Revenue: $288,000
Issue, Nonguaranteed - Public Debt for Private Purpose: $211,000
Beginning Outstanding - Public Debt for Private Purpose: $191,000
Retired Nonguaranteed - Public Debt for Private Purpose: $114,000
- Miscellaneous - General Revenue - Other: $71,000
Fines and Forfeits: $29,000
Donations From Private Sources: $22,000
Rents: $10,000
Interest Earnings: $10,000
Sale of Property: $4,000
- Other Capital Outlay - Elementary and Secondary Education: $520,000
Water Utilities: $72,000
Sewerage: $32,000
Police Protection: $24,000
Local Fire Protection: $13,000
General - Other: $10,000
Judicial and Legal Services: $1,000
- Other Funds - Cash and Securities: $8,301,000
- Revenue - Water Utilities: $61,000
- Sinking Funds - Cash and Securities: $406,000
- State Intergovernmental - Education: $5,093,000
- Tax - Property: $11,010,000
General Sales and Gross Receipts: $830,000
Public Utilities Sales: $301,000
Occupation and Business License - Other: $175,000
- Total Salaries and Wages: $5,716,000
Charles City County government finances - Debt in 2017:
- Assistance and Subsidies - Public Welfare, Federal Categorical Assistance Programs: $115,000
- Charges - Elementary and Secondary Education School Lunch: $99,000
Parks and Recreation: $44,000
Solid Waste Management: $26,000
Elementary and Secondary Education School Tuition and Transportation: $20,000
- Construction - Sewerage: $14,000
- Current Operations - Elementary and Secondary Education: $10,191,000
Police Protection: $866,000
General Public Buildings: $803,000
Public Welfare - Other: $747,000
Judicial and Legal Services: $624,000
Financial Administration: $510,000
Central Staff Services: $458,000
Parks and Recreation: $453,000
Water Utilities: $368,000
General - Other: $334,000
Correctional Institutions: $277,000
Public Welfare Institutions: $246,000
Housing and Community Development: $243,000
Protective Inspection and Regulation - Other: $141,000
Sewerage: $134,000
Local Fire Protection: $132,000
Health - Other: $112,000
Libraries: $71,000
Natural Resources - Other: $66,000
Corrections - Other: $26,000
Sea and Inland Port Facilities: $22,000
- Federal Intergovernmental - Education: $66,000
- Intergovernmental to Local - Other - Elementary and Secondary Education: $191,000
- Local Intergovernmental - Education: $227,000
Other: $77,000
- Long Term Debt - Beginning Outstanding - Unspecified Public Purpose: $4,280,000
Outstanding Unspecified Public Purpose: $4,217,000
Retired Unspecified Public Purpose: $1,452,000
Issue, Unspecified Public Purpose: $1,389,000
Outstanding Nonguaranteed - Industrial Revenue: $288,000
Issue, Nonguaranteed - Public Debt for Private Purpose: $211,000
Beginning Outstanding - Public Debt for Private Purpose: $191,000
Retired Nonguaranteed - Public Debt for Private Purpose: $114,000
- Miscellaneous - General Revenue - Other: $71,000
Fines and Forfeits: $29,000
Donations From Private Sources: $22,000
Rents: $10,000
Interest Earnings: $10,000
Sale of Property: $4,000
- Other Capital Outlay - Elementary and Secondary Education: $520,000
Water Utilities: $72,000
Sewerage: $32,000
Police Protection: $24,000
Local Fire Protection: $13,000
General - Other: $10,000
Judicial and Legal Services: $1,000
- Other Funds - Cash and Securities: $8,301,000
- Revenue - Water Utilities: $61,000
- Sinking Funds - Cash and Securities: $406,000
- State Intergovernmental - Education: $5,093,000
- Tax - Property: $11,010,000
General Sales and Gross Receipts: $830,000
Public Utilities Sales: $301,000
Occupation and Business License - Other: $175,000
- Total Salaries and Wages: $5,716,000
Charles City County government finances - Cash and Securities in 2017:
- Assistance and Subsidies - Public Welfare, Federal Categorical Assistance Programs: $115,000
- Charges - Elementary and Secondary Education School Lunch: $99,000
Parks and Recreation: $44,000
Solid Waste Management: $26,000
Elementary and Secondary Education School Tuition and Transportation: $20,000
- Construction - Sewerage: $14,000
- Current Operations - Elementary and Secondary Education: $10,191,000
Police Protection: $866,000
General Public Buildings: $803,000
Public Welfare - Other: $747,000
Judicial and Legal Services: $624,000
Financial Administration: $510,000
Central Staff Services: $458,000
Parks and Recreation: $453,000
Water Utilities: $368,000
General - Other: $334,000
Correctional Institutions: $277,000
Public Welfare Institutions: $246,000
Housing and Community Development: $243,000
Protective Inspection and Regulation - Other: $141,000
Sewerage: $134,000
Local Fire Protection: $132,000
Health - Other: $112,000
Libraries: $71,000
Natural Resources - Other: $66,000
Corrections - Other: $26,000
Sea and Inland Port Facilities: $22,000
- Federal Intergovernmental - Education: $66,000
- Intergovernmental to Local - Other - Elementary and Secondary Education: $191,000
- Local Intergovernmental - Education: $227,000
Other: $77,000
- Long Term Debt - Beginning Outstanding - Unspecified Public Purpose: $4,280,000
Outstanding Unspecified Public Purpose: $4,217,000
Retired Unspecified Public Purpose: $1,452,000
Issue, Unspecified Public Purpose: $1,389,000
Outstanding Nonguaranteed - Industrial Revenue: $288,000
Issue, Nonguaranteed - Public Debt for Private Purpose: $211,000
Beginning Outstanding - Public Debt for Private Purpose: $191,000
Retired Nonguaranteed - Public Debt for Private Purpose: $114,000
- Miscellaneous - General Revenue - Other: $71,000
Fines and Forfeits: $29,000
Donations From Private Sources: $22,000
Rents: $10,000
Interest Earnings: $10,000
Sale of Property: $4,000
- Other Capital Outlay - Elementary and Secondary Education: $520,000
Water Utilities: $72,000
Sewerage: $32,000
Police Protection: $24,000
Local Fire Protection: $13,000
General - Other: $10,000
Judicial and Legal Services: $1,000
- Other Funds - Cash and Securities: $8,301,000
- Revenue - Water Utilities: $61,000
- Sinking Funds - Cash and Securities: $406,000
- State Intergovernmental - Education: $5,093,000
- Tax - Property: $11,010,000
General Sales and Gross Receipts: $830,000
Public Utilities Sales: $301,000
Occupation and Business License - Other: $175,000
- Total Salaries and Wages: $5,716,000
Supplemental Security Income (SSI) in 2006:
- Total number of recipients: 159
- Number of aged recipients: 25
- Number of blind and disabled recipients: 134
- Number of recipients under 18: 19
- Number of recipients between 18 and 64: 97
- Number of recipients older than 64: 43
- Number of recipients also receiving OASDI: 71
- Amount of payments (thousands of dollars): 61
Charles City County on our top lists:
- #35 on the list of "Top 101 counties with the lowest total withdrawal of fresh water for public supply"
- #100 on the list of "Top 101 counties with the lowest Sulfur Oxides Annual air pollution readings in 2012 (µg/m3)"