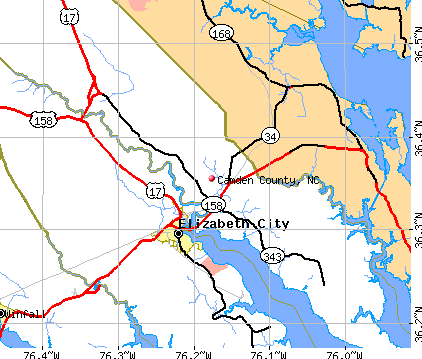
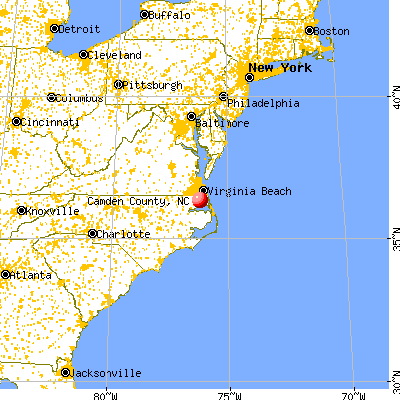
Camden County, North Carolina (NC)
County owner-occupied free and clear houses and condos in 2010: 864
County owner-occupied houses and condos in 2000: 2,222
Renter-occupied apartments: 656 (it was 440 in 2000)
| % of renters here: | 17% |
| State: | 33% |
Land area: 241 sq. mi.
Water area: 65.0 sq. mi.
Population density: 45 people per square mile (average).
Industries providing employment: Educational, health and social services (26.1%), Professional, scientific, management, administrative, and waste management services (12.8%), Public administration (10.3%).
Type of workers:
- Private wage or salary: 67%
- Government: 26%
- Self-employed, not incorporated: 6%
- Unpaid family work: 1%
- OSM Map
- General Map
- Google Map
- MSN Map

- 8,36376.9%White Non-Hispanic Alone
- 9078.3%Two or more races
- 8487.8%Black Non-Hispanic Alone
- 4143.8%Hispanic or Latino
- 1521.4%Asian alone
- 1211.1%Some other race alone
- 400.4%Native Hawaiian and Other
Pacific Islander alone - 240.2%American Indian and Alaska Native alone

| Median resident age: | 41.2 years |
| North Carolina median age: | 39.2 years |
| Males: 5,599 | |
| Females: 5,178 |

 | Road Construction/Projects in Coastal NC (429 replies) |
| Proposed I-795 Quad East loop (719 replies) |
| Is Wilmington, NC that bad? (342 replies) |
| Job in EC, moving with family...few more questions (I've read a lot of posts already) (10 replies) |
| Moving to Coastal NC from Upstate NY (2 replies) |
| Kill Devil Heels for year round young family? Colington Harbour? (15 replies) |
| Camden County: | 2.0 people |
| North Carolina: | 2 people |
Estimated median household income in 2022: $80,668 ($39,493 in 1999)
| This county: | $80,668 |
| North Carolina: | $67,481 |
Median contract rent in 2022 for apartments: $1,013 (lower quartile is $769, upper quartile is $1,198)
| This county: | $1013 |
| State: | $945 |
Estimated median house or condo value in 2022: $311,778 (it was $93,600 in 2000)
| Camden: | $311,778 |
| North Carolina: | $280,600 |
Mean price in 2022:
Median monthly housing costs for homes and condos with a mortgage: $1,541Detached houses: $352,409
Here: $352,409 State: $375,326 Townhouses or other attached units: $285,055
Here: $285,055 State: $317,935 Mobile homes: $108,248
Here: $108,248 State: $124,933
Median monthly housing costs for units without a mortgage: $481
Institutionalized population: 0
Crime in 2021 (reported by the sheriff's office or county police, not the county total):
- Murders: 0
- Rapes: 6
- Robberies: 0
- Assaults: 16
- Burglaries: 18
- Thefts: 31
- Auto thefts: 10
Crime in 2020 (reported by the sheriff's office or county police, not the county total):
- Murders: 2
- Rapes: 2
- Robberies: 1
- Assaults: 8
- Burglaries: 15
- Thefts: 35
- Auto thefts: 3
Single-family new house construction building permits:
- 2022: 62 buildings, average cost: $290,500
- 2021: 75 buildings, average cost: $259,200
- 2020: 101 buildings, average cost: $283,400
- 2019: 83 buildings, average cost: $280,200
- 2018: 81 buildings, average cost: $280,200
- 2017: 52 buildings, average cost: $258,200
- 2016: 36 buildings, average cost: $275,200
- 2015: 20 buildings, average cost: $250,300
- 2014: 20 buildings, average cost: $250,300
- 2013: 42 buildings, average cost: $237,800
- 2012: 16 buildings, average cost: $280,700
- 2011: 15 buildings, average cost: $264,500
- 2010: 16 buildings, average cost: $307,600
- 2009: 18 buildings, average cost: $307,600
- 2008: 125 buildings, average cost: $269,300
- 2007: 91 buildings, average cost: $225,700
- 2006: 113 buildings, average cost: $210,300
- 2005: 141 buildings, average cost: $187,100
- 2004: 132 buildings, average cost: $164,200
- 2003: 188 buildings, average cost: $122,800
- 2002: 158 buildings, average cost: $124,300
- 2001: 79 buildings, average cost: $110,000
- 2000: 63 buildings, average cost: $119,300
- 1999: 77 buildings, average cost: $101,700
- 1998: 81 buildings, average cost: $108,300
- 1997: 79 buildings, average cost: $76,600


Median real estate property taxes paid for housing units with mortgages in 2022: $1,687 (0.5%)
Median real estate property taxes paid for housing units with no mortgage in 2022: $1,797 (0.6%)


| Camden County: | 5.6% |
| North Carolina: | 12.8% |
Median age of residents in 2022: 41.2 years old
(Males: 40.3 years old, Females: 42.8 years old)
(Median age for: White residents: 42.0 years old, Black residents: 50.1 years old, Asian residents: 59.8 years old, Hispanic or Latino residents: 14.0 years old, Other race residents: 32.8 years old)
Fair market rent in 2006 for a 1-bedroom apartment in Camden County is $483 a month.
Fair market rent for a 2-bedroom apartment is $570 a month.
Fair market rent for a 3-bedroom apartment is $770 a month.
Cities in this county include: Camden, South Mills.
Notable locations in this county outside city limits:
Notable locations in Camden County: Knotts Landing (A), Hampton Lodge (B), Pine Island Gun Club Center (C), Dodge (D), Newbern Landing (E), Corolla C G Station 166 (F), Sawyers Lodge (G), Currituck Light (H), Hills Landing (I), Penny Hill C G Station 167 (J), Currituck Beach Lighthouse (K), Poyner Hill C G Station (L), Monteray Plaza (M), Corolla Light Village Shops (N), Seagull (O), Woodleigh (P), Barnett Creek Landing (Q), Waltons Landing (R), Gallop Landing (S), Poplar Branch Landing (T). Display/hide their locations on the map
Shopping Center: Tim Buck II Shopping Center (1). Display/hide its location on the map
Churches in Camden County include: Knotts Island Baptist Church (A), Pleasant Branch Church (B), Corinth Church (C), Hebron Church (D), Knotts Island United Methodist Church (E), Center Chapel (F), Samuel Chapel (G), Good Hope Zion Church (H), Sharon Church (I). Display/hide their locations on the map
Lakes and swamps: Indian Pond (A), Oak Pond (B), Great Beach Pond (C), Buck Island Pond (D), Canvasback Pond (E), Perch Pond (F), Big Pond (G), House Pond (H). Display/hide their locations on the map
Streams, rivers, and creeks: Roland Creek (A), Deep Creek (B), Ware Creek (C), Barnett Creek (D), Bullfrog Creek (E), Bumplanding Creek (F), Cowells Creek (G), Duck Creek (H), Indian Creek (I). Display/hide their locations on the map
Parks in Camden County include: Knotts Island Ruritan Park (1), Outer Banks Center for Wildlife Education (2), Mackay Island National Wildlife Refuge (3). Display/hide their locations on the map
Beach: Currituck Beach (A). Display/hide its location on the map
Neighboring counties: Allen County, Kentucky  , Gates County , Washington County, Arkansas , New Madrid County, Missouri .
| Here: | 2.9% |
| North Carolina: | 3.2% |


Current college students: 264
People 25 years of age or older with a high school degree or higher: 92.3%
People 25 years of age or older with a bachelor's degree or higher: 24.3%
Number of foreign born residents: 185 (76.4% naturalized citizens)
| Camden County: | 1.7% |
| Whole state: | 8.6% |

- Year of entry for the foreign-born population
- 572010 or later
- 02000 to 2009
- 541990 to 1999
- 291980 to 1989
- 01970 to 1979
- 7Before 1970
Mean travel time to work (commute): minutes
Percentage of county residents living and working in this county: 71.1%
Housing units in structures:
- One, detached: 3,494
- One, attached: 12
- 5 to 9: 27
- 10 to 19: 179
- Mobile homes: 561
Housing units in Camden County with a mortgage: 2,661 (154 second mortgage, 0 home equity loan, 152 both second mortgage and home equity loan)
Houses without a mortgage: 77
| Here: | 2.5% with mortgage |
| State: | 97.0% with mortgage |
Religion statistics for Camden County
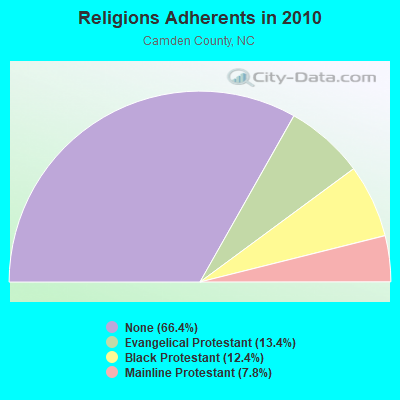
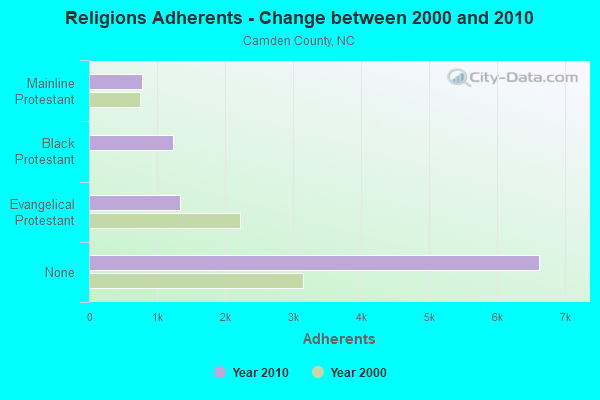
| Religion | Adherents | Congregations |
|---|---|---|
| Evangelical Protestant | 1,341 | 8 |
| Black Protestant | 1,240 | 6 |
| Mainline Protestant | 775 | 5 |
| None | 6,624 | - |
Source: Clifford Grammich, Kirk Hadaway, Richard Houseal, Dale E.Jones, Alexei Krindatch, Richie Stanley and Richard H.Taylor. 2012. 2010 U.S.Religion Census: Religious Congregations & Membership Study. Association of Statisticians of American Religious Bodies. Jones, Dale E., et al. 2002. Congregations and Membership in the United States 2000. Nashville, TN: Glenmary Research Center.
Food Environment Statistics:
| Camden County: | 1.06 / 10,000 pop. |
| State: | 2.05 / 10,000 pop. |
| This county: | 1.06 / 10,000 pop. |
| North Carolina: | 0.92 / 10,000 pop. |
| Camden County: | 5.28 / 10,000 pop. |
| North Carolina: | 4.75 / 10,000 pop. |
| This county: | 1.06 / 10,000 pop. |
| State: | 7.57 / 10,000 pop. |
| Camden County: | 10.2% |
| North Carolina: | 9.8% |
| Camden County: | 31.8% |
| State: | 28.3% |
| Here: | 10.1% |
| State: | 15.6% |
Agriculture in Camden County:
Average value of agricultural products sold per farm: $281,615The value of nursery, greenhouse, floriculture, and sod as a percentage of the total market value of agricultural products sold: 0.00%
Average total farm production expenses per farm: $261,704
Average market value of all machinery and equipment per farm: $286,090
The percentage of farms operated by a family or individual: 80.00%
Average age of principal farm operators: 58 years
Corn for grain: 18304 harvested acres
All wheat for grain: 11206 harvested acres
Upland cotton: 1430 harvested acres
Soybeans for beans: 30449 harvested acres
Vegetables: 470 harvested acres
Tornado activity:
Camden County historical area-adjusted tornado activity is significantly below North Carolina state average. It is 15137781.9 times below overall U.S. average.Tornadoes in this county have caused 2 injuries recorded between 1950 and 2004.
On 6/7/2003, a tornado injured 2 people and caused $30,000 in damages.
Earthquake activity:
Camden County-area historical earthquake activity is significantly above North Carolina state average. It is 65% smaller than the overall U.S. average.On 8/23/2011 at 17:51:04, a magnitude 5.8 (5.8 MW, Depth: 3.7 mi, Class: Moderate, Intensity: VI - VII) earthquake occurred 144.8 miles away from Camden County center
On 12/9/2003 at 20:59:14, a magnitude 4.5 (4.5 MB, 4.5 LG, Class: Light, Intensity: IV - V) earthquake occurred 127.9 miles away from the county center
On 12/9/2003 at 20:59:18, a magnitude 4.5 (4.5 ML, Depth: 6.2 mi) earthquake occurred 144.6 miles away from the county center
On 8/25/2011 at 05:07:52, a magnitude 4.5 (4.5 ML, Depth: 4.2 mi) earthquake occurred 147.9 miles away from the county center
On 8/9/2020 at 12:07:37, a magnitude 5.1 (5.1 MW, Depth: 4.7 mi) earthquake occurred 273.7 miles away from Camden County center
On 1/15/2019 at 23:30:48, a magnitude 4.6 (4.6 MW, Depth: 6.2 mi) earthquake occurred 185.7 miles away from the county center
Magnitude types: regional Lg-wave magnitude (LG), body-wave magnitude (MB), local magnitude (ML), moment magnitude (MW)
Most recent natural disasters:
- North Carolina Covid-19 Pandemic, Incident Period: January 20, 2020, FEMA Id: 4487, Natural disaster type: Other
- North Carolina Hurricane Dorian, Incident Period: September 1, 2019 - September 9, 2019, FEMA Id: 4465, Natural disaster type: Hurricane
- North Carolina Hurricane Matthew, Incident Period: October 04, 2016 to October 24, 2016, Emergency Declared EM-3380: October 07, 2016, FEMA Id: 3380, Natural disaster type: Hurricane
- North Carolina Hurricane Matthew, Incident Period: October 04, 2016 to October 24, 2016, Major Disaster (Presidential) Declared DR-4285: October 10, 2016, FEMA Id: 4285, Natural disaster type: Hurricane
- North Carolina Hurricane Irene, Incident Period: August 25, 2011 to September 01, 2011, Emergency Declared EM-3327: August 25, 2011, FEMA Id: 3327, Natural disaster type: Hurricane
- North Carolina Hurricane Irene, Incident Period: August 25, 2011 to September 01, 2011, Major Disaster (Presidential) Declared DR-4019: August 31, 2011, FEMA Id: 4019, Natural disaster type: Hurricane
- North Carolina Severe Storms, Flooding, and Straight-line Winds associated with the remnants of Tropical Storm Nicole, Incident Period: September 27, 2010 to October 01, 2010, Major Disaster (Presidential) Declared DR-1942: October 14, 2010, FEMA Id: 1942, Natural disaster type: Tropical Storm, Storm, Flood, Wind
- North Carolina Hurricane Earl, Incident Period: September 01, 2010 to September 04, 2010, Emergency Declared EM-3314: September 01, 2010, FEMA Id: 3314, Natural disaster type: Hurricane
- North Carolina Hurricane Ophelia, Incident Period: September 11, 2005 to September 17, 2005, Emergency Declared EM-3254: September 14, 2005, FEMA Id: 3254, Natural disaster type: Hurricane
- North Carolina Hurricane Katrina Evacuation, Incident Period: August 29, 2005 to October 01, 2005, Emergency Declared EM-3222: September 05, 2005, FEMA Id: 3222, Natural disaster type: Hurricane
- 5 other natural disasters have been reported since 1953.
The number of natural disasters in Camden County (15) is near the US average (15).
Major Disasters (Presidential) Declared: 7
Emergencies Declared: 6
Causes of natural disasters: Hurricanes: 12, Blizzard: 1, Flood: 1, Storm: 1, Tropical Storm: 1, Wind: 1, Other: 1 (Note: some incidents may be assigned to more than one category).

Means of transportation to work:
- Drove a car alone: 911 (48.7%)
- Carpooled: 161 (8.6%)
- Bus: 12 (0.6%)
- Taxicab, motorcycle, or other means: 71 (3.8%)
- Walked: 38 (2.0%)
- Worked at home: 832 (44.5%)


- Educational services (26%)
- Health care and social assistance (18%)
- Other services, except public administration (11%)
- Public administration (9%)
- Accommodation and food services (8%)
- Retail trade (7%)
- Administrative and support and waste management services (7%)

- Educational services (25%)
- Health care and social assistance (18%)
- Other services, except public administration (10%)
- Public administration (9%)
- Accommodation and food services (7%)
- Retail trade (7%)
- Administrative and support and waste management services (6%)

- Management occupations (16%)
- Installation, maintenance, and repair occupations (14%)
- Computer and mathematical occupations (10%)
- Sales and related occupations (10%)
- Production occupations (8%)
- Construction and extraction occupations (7%)
- Business and financial operations occupations (5%)

- Educational instruction, and library occupations (21%)
- Office and administrative support occupations (17%)
- Management occupations (16%)
- Sales and related occupations (8%)
- Business and financial operations occupations (8%)
- Health diagnosing and treating practitioners and other technical occupations (6%)
- Food preparation and serving related occupations (5%)

- Jamaica (32%)
- Pakistan (31%)
- Philippines (13%)
- India (9%)
- Vietnam (8%)
- United Kingdom, excluding England and Scotland (4%)
- Ireland (0%)

- American (22%)
- English (15%)
- German (9%)
- Italian (7%)
- Irish (7%)
- Scottish (2%)
- Northern European (1%)


4 people in group homes intended for adults
4 people in nursing homes
11.97% of this county's 2021 resident taxpayers lived in other counties in 2020 ($58,590 average adjusted gross income)
| Here: | 11.97% |
| North Carolina average: | 8.85% |
10 or fewer of this county's residents moved from foreign countries.
5.36% relocated from other counties in North Carolina ($23,574 average AGI)
6.61% relocated from other states ($35,014 average AGI)
Camden County: 6.61% North Carolina average: 4.18%

Top counties from which taxpayers relocated into this county between 2020 and 2021:
| from Pasquotank County, NC | |
| from Chesapeake city, VA | |
| from Currituck County, NC | |
| from Virginia Beach city, VA |
7.64% of this county's 2020 resident taxpayers moved to other counties in 2021 ($53,267 average adjusted gross income)
| Here: | 7.64% |
| North Carolina average: | 7.89% |
10 or fewer of this county's residents moved to foreign countries.
4.79% relocated to other counties in North Carolina ($32,901 average AGI)
2.85% relocated to other states ($20,366 average AGI)
Camden County: 2.85% North Carolina average: 3.18%

Top counties to which taxpayers relocated from this county between 2020 and 2021:
| to Pasquotank County, NC | |
| to Virginia Beach city, VA | |
| to Chesapeake city, VA | |
| to Currituck County, NC |
Births per 1000 population from 1990 to 1999: 9.2
Births per 1000 population from 2000 to 2006: 11.5

Deaths per 1000 population from 1990 to 1999: 9.6
Deaths per 1000 population from 2000 to 2009: 7.8
Deaths per 1000 population from 2010 to 2020: 8.2

Infant deaths per 1000 live births from 1990 to 1999: 20.8
Infant deaths per 1000 live births from 2000 to 2006: 3.3

Persons under 19 years old without health insurance coverage in 2018: 6.1%


Persons enrolled in hospital insurance and/or supplemental medical insurance (Medicare) in July 1, 2007: 1,412 (1,171 aged, 241 disabled)
Children under 18 without health insurance coverage in 2007: 218 (9%)


Most common underlying causes of death in Camden County, North Carolina in 1999 - 2019:
- Acute myocardial infarction, unspecified (12)
- Bronchus or lung, unspecified - Malignant neoplasms (10)
Population without health insurance coverage in 2000: 12%
Children under 18 without health insurance coverage in 2000: 8%
Medical specialist MDs per 100,000 population in 2005: 669
Dentists per 100,000 population in 1998: 22
Total deaths per 100,000 population, July 2005 - July 2006: 33
Household type by relationship:
Households: 10,777- Male householders: 1,911 (289 living alone), Female householders: 2,143 (436 living alone)
2,597 spouses (2,597 opposite-sex spouses), 128 unmarried partners, (108 opposite-sex unmarried partners), 3,326 children (3,080 natural, 11 adopted, 239 stepchildren), 246 grandchildren, 0 brothers or sisters, 169 parents, 8 foster children, 211 other relatives, 50 non-relatives
- In group quarters: 34
Size of family households: 1,230 2-persons, 861 3-persons, 637 4-persons, 383 5-persons, 77 6-persons, 26 7-or-more-persons.
Size of nonfamily households: 725 1-person, 106 2-persons.
1,913 married couples with children.
382 single-parent households (143 men, 239 women).
96.6% of residents of Camden speak English at home.
0.7% of residents speak Spanish at home (100% speak English very well).
0.7% of residents speak other Indo-European language at home (32% speak English very well, 68% speak English well).
0.9% of residents speak Asian or Pacific Island language at home (83% speak English very well, 17% speak English not well).
1.1% of residents speak other language at home (38% speak English very well, 62% don't speak English at all).
In fiscal year 2004:
Federal Government expenditure: $53,051,000 ($6,288 per capita)
Department of Defense expenditure: $4,345,000
Federal direct payments to individuals for retirement and disability: $28,835,000
Federal other direct payments to individuals: $7,630,000
Federal direct payments not to individuals: $3,254,000
Federal grants: $10,547,000
Federal procurement contracts: $263,000 ($64,000 Department of Defense)
Federal salaries and wages: $2,523,000 ($0,000 Department of Defense)
Federal Government direct loans: $710,000
Federal guaranteed/insured loans: $14,752,000
Federal Government insurance: $86,556,000
Population change from April 1, 2000 to July 1, 2005:
Births: 473| Here: | 53 per 1000 residents |
| State: | 72 per 1000 residents |
Deaths: 330
| Here: | 37 per 1000 residents |
| State: | 44 per 1000 residents |
Net international migration: +2
| Here: | +0 per 1000 residents |
| State: | +18 per 1000 residents |
Net internal migration: +1,957
| Here: | +218 per 1000 residents |
| State: | +27 per 1000 residents |

Total withdrawal of fresh water for public supply: 0.27 millions of gallons per day (all from ground)
| Here: | 6.8 |
| State: | 6.4 |
| Here: | 4.7 |
| State: | 4.4 |

- Year house built in Camden County, North Carolina
- 392020 or later
- 5132010 to 2019
- 1,3562000 to 2009
- 6271990 to 1999
- 6991980 to 1989
- 2791970 to 1979
- 921960 to 1969
- 1431950 to 1959
- 2291940 to 1949
- 2511939 or earlier

- Rooms in owner-occupied houses in Camden County, North Carolina
- 01 room
- 172 rooms
- 693 rooms
- 2984 rooms
- 4655 rooms
- 7416 rooms
- 4747 rooms
- 6478 rooms
- 7339+ rooms

- Rooms in renter-occupied apartments in Camden County, North Carolina
- 381 room
- 02 rooms
- 1213 rooms
- 1304 rooms
- 1915 rooms
- 916 rooms
- 197 rooms
- 448 rooms
- 09+ rooms

- Bedrooms in owner-occupied houses in Camden County, North Carolina
- 23no bedroom
- 521 bedroom
- 3912 bedrooms
- 1,7893 bedrooms
- 9734 bedrooms
- 2135+ bedrooms

- Bedrooms in renter-occupied apartments in Camden County, North Carolina
- 38no bedroom
- 01 bedroom
- 3792 bedrooms
- 1483 bedrooms
- 724 bedrooms
- 05+ bedrooms

- Cars and other vehicles available in Camden County in owner-occupied houses/condos
- 51no vehicle
- 6551 vehicle
- 1,6102 vehicles
- 6843 vehicles
- 2864 vehicles
- 1485+ vehicles

- Cars and other vehicles available in Camden County in renter-occupied apartments
- 0no vehicle
- 2751 vehicle
- 2202 vehicles
- 1323 vehicles
- 184 vehicles
- 05+ vehicles
97.0% of Camden County residents lived in the same house 1 years ago.
Out of people who lived in different houses, 11% lived in this county.
Out of people who lived in different counties, 67% lived in North Carolina.
| Camden County: | 97.0% |
| State average: | 87.3% |
Place of birth for U.S.-born residents:
- This state: 4,279
- Other state: 6,302
- Northeast: 1,019
- Midwest: 797
- South: 4,017
- West: 458


- 80.4%Electricity
- 11.3%Bottled, tank, or LP gas
- 6.5%Utility gas
- 1.1%Wood
- 0.4%Fuel oil, kerosene, etc.
- 0.1%No fuel used

- 71.0%Electricity
- 20.9%Bottled, tank, or LP gas
- 8.1%Solar energy
Private vs. public school enrollment:
| Here: | 4.5% |
| North Carolina: | 13.8% |
| Here: | 2.4% |
| North Carolina: | 11.9% |
| Here: | 21.3% |
| North Carolina: | 19.3% |


Camden County government finances - Expenditure in 2020:
- Assistance and Subsidies - Public Welfare, Cash Assistance Programs - Other: $301,000
Public Welfare, Cash Assistance Programs - Other: $87,000
- Charges - Miscellaneous Commercial Activities: $667,000
Miscellaneous Commercial Activities: $305,000
Elementary and Secondary Education School Lunch: $261,000
Elementary and Secondary Education School Tuition and Transportation: $183,000
Elementary and Secondary Education School Lunch: $180,000
Sewerage: $151,000
Sewerage: $123,000
Elementary and Secondary Education School Tuition and Transportation: $123,000
Other: $94,000
Natural Resources - Other: $7,000
- Construction - Elementary and Secondary Education: $181,000
Elementary and Secondary Education: $173,000
- Current Operations - Elementary and Secondary Education: $19,586,000
Elementary and Secondary Education: $17,439,000
Police Protection: $2,749,000
Police Protection: $2,665,000
Housing and Community Development: $1,554,000
Local Fire Protection: $1,481,000
Liquor Stores: $1,376,000
Financial Administration: $1,281,000
Public Welfare - Other: $1,113,000
General - Other: $1,099,000
Parks and Recreation: $1,083,000
General - Other: $1,068,000
Liquor Stores: $990,000
Financial Administration: $964,000
Public Welfare - Other: $936,000
Solid Waste Management: $756,000
Solid Waste Management: $669,000
Correctional Institutions: $663,000
Housing and Community Development: $579,000
Local Fire Protection: $569,000
Correctional Institutions: $480,000
General Public Buildings: $430,000
Water Utilities: $397,000
Miscellaneous Commercial Activities - Other: $390,000
Water Utilities: $355,000
General Public Buildings: $350,000
Sewerage: $292,000
Parks and Recreation: $285,000
Libraries: $239,000
Protective Inspection and Regulation - Other: $217,000
Sewerage: $211,000
Libraries: $194,000
Central Staff Services: $179,000
Natural Resources - Other: $157,000
Protective Inspection and Regulation - Other: $135,000
Health - Other: $121,000
Health - Other: $118,000
Central Staff Services: $80,000
Natural Resources - Other: $69,000
Judicial and Legal Services: $37,000
Judicial and Legal Services: $18,000
Transit Utilities: $2,000
Transit Utilities: $2,000
- Federal Intergovernmental - Education: $209,000
Education: $120,000
- General - Interest on Debt: $486,000
Interest on Debt: $54,000
- Intergovernmental to Local - Other - Elementary and Secondary Education: $34,000
Other - Elementary and Secondary Education: $19,000
Other - Health - Other: $6,000
Other - Health - Other: $4,000
- Long Term Debt - Beginning Outstanding - Unspecified Public Purpose: $3,709,000
Outstanding Unspecified Public Purpose: $3,166,000
Beginning Outstanding - Unspecified Public Purpose: $1,908,000
Outstanding Unspecified Public Purpose: $1,621,000
Retired Unspecified Public Purpose: $543,000
Retired Unspecified Public Purpose: $287,000
- Miscellaneous - General Revenue - Other: $522,000
Donations From Private Sources: $256,000
General Revenue - Other: $152,000
Donations From Private Sources: $150,000
Interest Earnings: $78,000
Fines and Forfeits: $62,000
Fines and Forfeits: $53,000
Rents: $48,000
Rents: $41,000
Interest Earnings: $14,000
Sale of Property: $6,000
- Other Capital Outlay - Elementary and Secondary Education: $277,000
Elementary and Secondary Education: $191,000
Police Protection: $111,000
- Other Funds - Cash and Securities: $3,394,000
Cash and Securities: $1,269,000
- Revenue - Liquor Stores: $1,529,000
Water Utilities: $1,368,000
Water Utilities: $1,110,000
Liquor Stores: $1,059,000
- State Intergovernmental - Education: $16,426,000
Education: $14,403,000
Other: $1,406,000
General Local Government Support: $1,391,000
General Local Government Support: $1,293,000
Other: $1,246,000
- Tax - Property: $8,651,000
Property: $8,414,000
Other License: $2,175,000
General Sales and Gross Receipts: $1,369,000
Other License: $924,000
General Sales and Gross Receipts: $891,000
Occupation and Business License - Other: $779,000
Occupation and Business License - Other: $189,000
Alcoholic Beverage Sales: $129,000
Alcoholic Beverage Sales: $58,000
- Total Salaries and Wages: $12,660,000
: $11,410,000
- Water Utilities - Interest on Debt: $149,000
Camden County government finances - Revenue in 2020:
- Assistance and Subsidies - Public Welfare, Cash Assistance Programs - Other: $301,000
Public Welfare, Cash Assistance Programs - Other: $87,000
- Charges - Miscellaneous Commercial Activities: $667,000
Miscellaneous Commercial Activities: $305,000
Elementary and Secondary Education School Lunch: $261,000
Elementary and Secondary Education School Tuition and Transportation: $183,000
Elementary and Secondary Education School Lunch: $180,000
Sewerage: $151,000
Sewerage: $123,000
Elementary and Secondary Education School Tuition and Transportation: $123,000
Other: $94,000
Natural Resources - Other: $7,000
- Construction - Elementary and Secondary Education: $181,000
Elementary and Secondary Education: $173,000
- Current Operations - Elementary and Secondary Education: $19,586,000
Elementary and Secondary Education: $17,439,000
Police Protection: $2,749,000
Police Protection: $2,665,000
Housing and Community Development: $1,554,000
Local Fire Protection: $1,481,000
Liquor Stores: $1,376,000
Financial Administration: $1,281,000
Public Welfare - Other: $1,113,000
General - Other: $1,099,000
Parks and Recreation: $1,083,000
General - Other: $1,068,000
Liquor Stores: $990,000
Financial Administration: $964,000
Public Welfare - Other: $936,000
Solid Waste Management: $756,000
Solid Waste Management: $669,000
Correctional Institutions: $663,000
Housing and Community Development: $579,000
Local Fire Protection: $569,000
Correctional Institutions: $480,000
General Public Buildings: $430,000
Water Utilities: $397,000
Miscellaneous Commercial Activities - Other: $390,000
Water Utilities: $355,000
General Public Buildings: $350,000
Sewerage: $292,000
Parks and Recreation: $285,000
Libraries: $239,000
Protective Inspection and Regulation - Other: $217,000
Sewerage: $211,000
Libraries: $194,000
Central Staff Services: $179,000
Natural Resources - Other: $157,000
Protective Inspection and Regulation - Other: $135,000
Health - Other: $121,000
Health - Other: $118,000
Central Staff Services: $80,000
Natural Resources - Other: $69,000
Judicial and Legal Services: $37,000
Judicial and Legal Services: $18,000
Transit Utilities: $2,000
Transit Utilities: $2,000
- Federal Intergovernmental - Education: $209,000
Education: $120,000
- General - Interest on Debt: $486,000
Interest on Debt: $54,000
- Intergovernmental to Local - Other - Elementary and Secondary Education: $34,000
Other - Elementary and Secondary Education: $19,000
Other - Health - Other: $6,000
Other - Health - Other: $4,000
- Long Term Debt - Beginning Outstanding - Unspecified Public Purpose: $3,709,000
Outstanding Unspecified Public Purpose: $3,166,000
Beginning Outstanding - Unspecified Public Purpose: $1,908,000
Outstanding Unspecified Public Purpose: $1,621,000
Retired Unspecified Public Purpose: $543,000
Retired Unspecified Public Purpose: $287,000
- Miscellaneous - General Revenue - Other: $522,000
Donations From Private Sources: $256,000
General Revenue - Other: $152,000
Donations From Private Sources: $150,000
Interest Earnings: $78,000
Fines and Forfeits: $62,000
Fines and Forfeits: $53,000
Rents: $48,000
Rents: $41,000
Interest Earnings: $14,000
Sale of Property: $6,000
- Other Capital Outlay - Elementary and Secondary Education: $277,000
Elementary and Secondary Education: $191,000
Police Protection: $111,000
- Other Funds - Cash and Securities: $3,394,000
Cash and Securities: $1,269,000
- Revenue - Liquor Stores: $1,529,000
Water Utilities: $1,368,000
Water Utilities: $1,110,000
Liquor Stores: $1,059,000
- State Intergovernmental - Education: $16,426,000
Education: $14,403,000
Other: $1,406,000
General Local Government Support: $1,391,000
General Local Government Support: $1,293,000
Other: $1,246,000
- Tax - Property: $8,651,000
Property: $8,414,000
Other License: $2,175,000
General Sales and Gross Receipts: $1,369,000
Other License: $924,000
General Sales and Gross Receipts: $891,000
Occupation and Business License - Other: $779,000
Occupation and Business License - Other: $189,000
Alcoholic Beverage Sales: $129,000
Alcoholic Beverage Sales: $58,000
- Total Salaries and Wages: $12,660,000
: $11,410,000
- Water Utilities - Interest on Debt: $149,000
Camden County government finances - Debt in 2020:
- Assistance and Subsidies - Public Welfare, Cash Assistance Programs - Other: $301,000
Public Welfare, Cash Assistance Programs - Other: $87,000
- Charges - Miscellaneous Commercial Activities: $667,000
Miscellaneous Commercial Activities: $305,000
Elementary and Secondary Education School Lunch: $261,000
Elementary and Secondary Education School Tuition and Transportation: $183,000
Elementary and Secondary Education School Lunch: $180,000
Sewerage: $151,000
Sewerage: $123,000
Elementary and Secondary Education School Tuition and Transportation: $123,000
Other: $94,000
Natural Resources - Other: $7,000
- Construction - Elementary and Secondary Education: $181,000
Elementary and Secondary Education: $173,000
- Current Operations - Elementary and Secondary Education: $19,586,000
Elementary and Secondary Education: $17,439,000
Police Protection: $2,749,000
Police Protection: $2,665,000
Housing and Community Development: $1,554,000
Local Fire Protection: $1,481,000
Liquor Stores: $1,376,000
Financial Administration: $1,281,000
Public Welfare - Other: $1,113,000
General - Other: $1,099,000
Parks and Recreation: $1,083,000
General - Other: $1,068,000
Liquor Stores: $990,000
Financial Administration: $964,000
Public Welfare - Other: $936,000
Solid Waste Management: $756,000
Solid Waste Management: $669,000
Correctional Institutions: $663,000
Housing and Community Development: $579,000
Local Fire Protection: $569,000
Correctional Institutions: $480,000
General Public Buildings: $430,000
Water Utilities: $397,000
Miscellaneous Commercial Activities - Other: $390,000
Water Utilities: $355,000
General Public Buildings: $350,000
Sewerage: $292,000
Parks and Recreation: $285,000
Libraries: $239,000
Protective Inspection and Regulation - Other: $217,000
Sewerage: $211,000
Libraries: $194,000
Central Staff Services: $179,000
Natural Resources - Other: $157,000
Protective Inspection and Regulation - Other: $135,000
Health - Other: $121,000
Health - Other: $118,000
Central Staff Services: $80,000
Natural Resources - Other: $69,000
Judicial and Legal Services: $37,000
Judicial and Legal Services: $18,000
Transit Utilities: $2,000
Transit Utilities: $2,000
- Federal Intergovernmental - Education: $209,000
Education: $120,000
- General - Interest on Debt: $486,000
Interest on Debt: $54,000
- Intergovernmental to Local - Other - Elementary and Secondary Education: $34,000
Other - Elementary and Secondary Education: $19,000
Other - Health - Other: $6,000
Other - Health - Other: $4,000
- Long Term Debt - Beginning Outstanding - Unspecified Public Purpose: $3,709,000
Outstanding Unspecified Public Purpose: $3,166,000
Beginning Outstanding - Unspecified Public Purpose: $1,908,000
Outstanding Unspecified Public Purpose: $1,621,000
Retired Unspecified Public Purpose: $543,000
Retired Unspecified Public Purpose: $287,000
- Miscellaneous - General Revenue - Other: $522,000
Donations From Private Sources: $256,000
General Revenue - Other: $152,000
Donations From Private Sources: $150,000
Interest Earnings: $78,000
Fines and Forfeits: $62,000
Fines and Forfeits: $53,000
Rents: $48,000
Rents: $41,000
Interest Earnings: $14,000
Sale of Property: $6,000
- Other Capital Outlay - Elementary and Secondary Education: $277,000
Elementary and Secondary Education: $191,000
Police Protection: $111,000
- Other Funds - Cash and Securities: $3,394,000
Cash and Securities: $1,269,000
- Revenue - Liquor Stores: $1,529,000
Water Utilities: $1,368,000
Water Utilities: $1,110,000
Liquor Stores: $1,059,000
- State Intergovernmental - Education: $16,426,000
Education: $14,403,000
Other: $1,406,000
General Local Government Support: $1,391,000
General Local Government Support: $1,293,000
Other: $1,246,000
- Tax - Property: $8,651,000
Property: $8,414,000
Other License: $2,175,000
General Sales and Gross Receipts: $1,369,000
Other License: $924,000
General Sales and Gross Receipts: $891,000
Occupation and Business License - Other: $779,000
Occupation and Business License - Other: $189,000
Alcoholic Beverage Sales: $129,000
Alcoholic Beverage Sales: $58,000
- Total Salaries and Wages: $12,660,000
: $11,410,000
- Water Utilities - Interest on Debt: $149,000
Camden County government finances - Cash and Securities in 2020:
- Assistance and Subsidies - Public Welfare, Cash Assistance Programs - Other: $301,000
Public Welfare, Cash Assistance Programs - Other: $87,000
- Charges - Miscellaneous Commercial Activities: $667,000
Miscellaneous Commercial Activities: $305,000
Elementary and Secondary Education School Lunch: $261,000
Elementary and Secondary Education School Tuition and Transportation: $183,000
Elementary and Secondary Education School Lunch: $180,000
Sewerage: $151,000
Sewerage: $123,000
Elementary and Secondary Education School Tuition and Transportation: $123,000
Other: $94,000
Natural Resources - Other: $7,000
- Construction - Elementary and Secondary Education: $181,000
Elementary and Secondary Education: $173,000
- Current Operations - Elementary and Secondary Education: $19,586,000
Elementary and Secondary Education: $17,439,000
Police Protection: $2,749,000
Police Protection: $2,665,000
Housing and Community Development: $1,554,000
Local Fire Protection: $1,481,000
Liquor Stores: $1,376,000
Financial Administration: $1,281,000
Public Welfare - Other: $1,113,000
General - Other: $1,099,000
Parks and Recreation: $1,083,000
General - Other: $1,068,000
Liquor Stores: $990,000
Financial Administration: $964,000
Public Welfare - Other: $936,000
Solid Waste Management: $756,000
Solid Waste Management: $669,000
Correctional Institutions: $663,000
Housing and Community Development: $579,000
Local Fire Protection: $569,000
Correctional Institutions: $480,000
General Public Buildings: $430,000
Water Utilities: $397,000
Miscellaneous Commercial Activities - Other: $390,000
Water Utilities: $355,000
General Public Buildings: $350,000
Sewerage: $292,000
Parks and Recreation: $285,000
Libraries: $239,000
Protective Inspection and Regulation - Other: $217,000
Sewerage: $211,000
Libraries: $194,000
Central Staff Services: $179,000
Natural Resources - Other: $157,000
Protective Inspection and Regulation - Other: $135,000
Health - Other: $121,000
Health - Other: $118,000
Central Staff Services: $80,000
Natural Resources - Other: $69,000
Judicial and Legal Services: $37,000
Judicial and Legal Services: $18,000
Transit Utilities: $2,000
Transit Utilities: $2,000
- Federal Intergovernmental - Education: $209,000
Education: $120,000
- General - Interest on Debt: $486,000
Interest on Debt: $54,000
- Intergovernmental to Local - Other - Elementary and Secondary Education: $34,000
Other - Elementary and Secondary Education: $19,000
Other - Health - Other: $6,000
Other - Health - Other: $4,000
- Long Term Debt - Beginning Outstanding - Unspecified Public Purpose: $3,709,000
Outstanding Unspecified Public Purpose: $3,166,000
Beginning Outstanding - Unspecified Public Purpose: $1,908,000
Outstanding Unspecified Public Purpose: $1,621,000
Retired Unspecified Public Purpose: $543,000
Retired Unspecified Public Purpose: $287,000
- Miscellaneous - General Revenue - Other: $522,000
Donations From Private Sources: $256,000
General Revenue - Other: $152,000
Donations From Private Sources: $150,000
Interest Earnings: $78,000
Fines and Forfeits: $62,000
Fines and Forfeits: $53,000
Rents: $48,000
Rents: $41,000
Interest Earnings: $14,000
Sale of Property: $6,000
- Other Capital Outlay - Elementary and Secondary Education: $277,000
Elementary and Secondary Education: $191,000
Police Protection: $111,000
- Other Funds - Cash and Securities: $3,394,000
Cash and Securities: $1,269,000
- Revenue - Liquor Stores: $1,529,000
Water Utilities: $1,368,000
Water Utilities: $1,110,000
Liquor Stores: $1,059,000
- State Intergovernmental - Education: $16,426,000
Education: $14,403,000
Other: $1,406,000
General Local Government Support: $1,391,000
General Local Government Support: $1,293,000
Other: $1,246,000
- Tax - Property: $8,651,000
Property: $8,414,000
Other License: $2,175,000
General Sales and Gross Receipts: $1,369,000
Other License: $924,000
General Sales and Gross Receipts: $891,000
Occupation and Business License - Other: $779,000
Occupation and Business License - Other: $189,000
Alcoholic Beverage Sales: $129,000
Alcoholic Beverage Sales: $58,000
- Total Salaries and Wages: $12,660,000
: $11,410,000
- Water Utilities - Interest on Debt: $149,000
Supplemental Security Income (SSI) in 2006:
- Total number of recipients: 148
- Number of aged recipients: 27
- Number of blind and disabled recipients: 121
- Number of recipients under 18: 25
- Number of recipients between 18 and 64: 87
- Number of recipients older than 64: 36
- Number of recipients also receiving OASDI: 65
- Amount of payments (thousands of dollars): 56
Businesses in Camden County, NC
- U-Haul: 1
- UPS: 1