Calhoun County, Illinois (IL)
County owner-occupied free and clear houses and condos in 2010: 819
County owner-occupied houses and condos in 2000: 1,654
Renter-occupied apartments: 404 (it was 392 in 2000)
| % of renters here: | 19% |
| State: | 33% |
Land area: 254 sq. mi.
Water area: 29.9 sq. mi.
Population density: 17 people per square mile (low).
Industries providing employment: Educational, health and social services (26.3%), Agriculture,forestry,fishing and hunting, and mining (12.4%).
Type of workers:
- Private wage or salary: 73%
- Government: 15%
- Self-employed, not incorporated: 12%
- Unpaid family work: 0%
- OSM Map
- General Map
- Google Map
- MSN Map

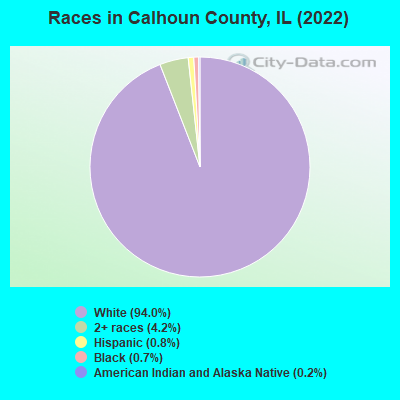
- 4,11394.0%White Non-Hispanic Alone
- 1854.2%Two or more races
- 360.8%Hispanic or Latino
- 310.7%Black Non-Hispanic Alone
- 90.2%American Indian and Alaska Native alone
- 10.02%Asian alone
| Median resident age: | 48.6 years |
| Illinois median age: | 39.1 years |
| Males: 2,267 | |
| Females: 2,143 |

 | Interesting/quirky/off-the-beaten-path stuff to see in non-Chicagoland IL? (13 replies) |
| Some great things about East, West, Central and Southern Illinois (48 replies) |
| teaching in Illinois (7 replies) |
| Calhoun County: | 2.0 people |
| Illinois: | 3 people |
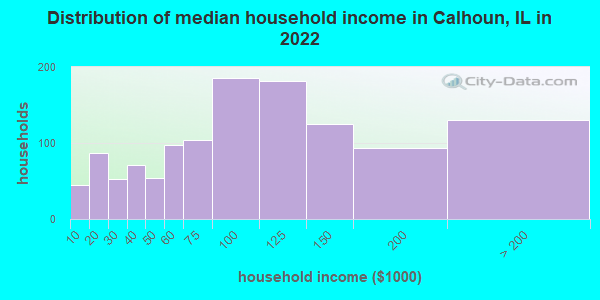
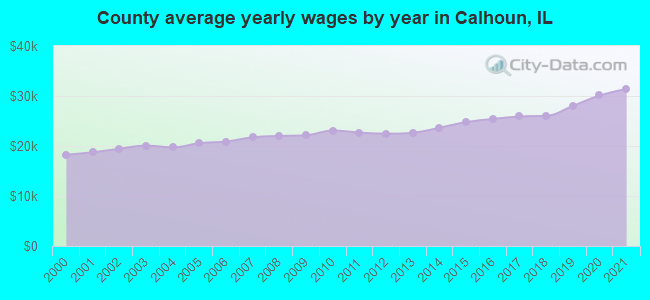
Estimated median household income in 2022: $86,122 ($34,375 in 1999)
| This county: | $86,122 |
| Illinois: | $76,708 |
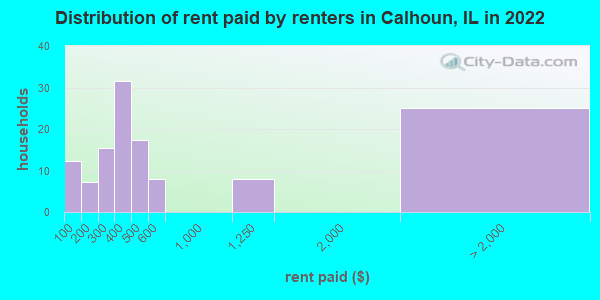
Median contract rent in 2022 for apartments: $367 (lower quartile is $256, upper quartile is $475)
| This county: | $367 |
| State: | $1008 |
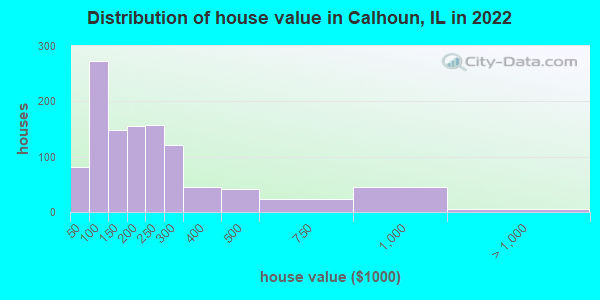
Estimated median house or condo value in 2022: $169,312 (it was $69,300 in 2000)
| Calhoun: | $169,312 |
| Illinois: | $251,600 |
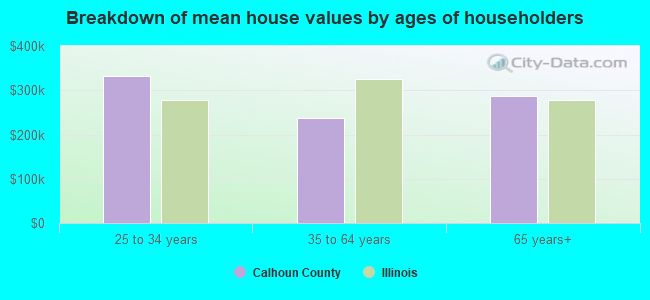
Mean price in 2022:
Median monthly housing costs for homes and condos with a mortgage: $1,415Detached houses: $207,742
Here: $207,742 State: $310,164 Townhouses or other attached units: $204,426
Here: $204,426 State: $286,230 Mobile homes: $95,393
Here: $95,393 State: $78,855
Median monthly housing costs for units without a mortgage: $643
Institutionalized population: 69
Crime in 2011 (reported by the sheriff's office or county police, not the county total):
- Murders: 0
- Rapes: 0
- Robberies: 0
- Assaults: 13
- Burglaries: 14
- Thefts: 41
- Auto thefts: 1
Crime in 2010 (reported by the sheriff's office or county police, not the county total):
- Murders: 0
- Rapes: 0
- Robberies: 0
- Assaults: 15
- Burglaries: 11
- Thefts: 37
- Auto thefts: 0
Health of residents in Calhoun County based on CDC Behavioral Risk Factor Surveillance System Survey Questionnaires from 2013 to 2021:
General health status score of residents in this county from 1 (poor) to 5 (excellent) is 3.4. This is about average.71.9% of residents exercised in the past month. This is about average.
45.2% of residents smoked 100+ cigarettes in their lives. This is about average.
53.7% of adult residents drank alcohol in the past 30 days. This is less than average.
67.3% of residents visited a dentist within the past year. This is about average.
Average weight of males is 200 pounds. This is more than average.
Average weight of females is 167 pounds. This is more than average.
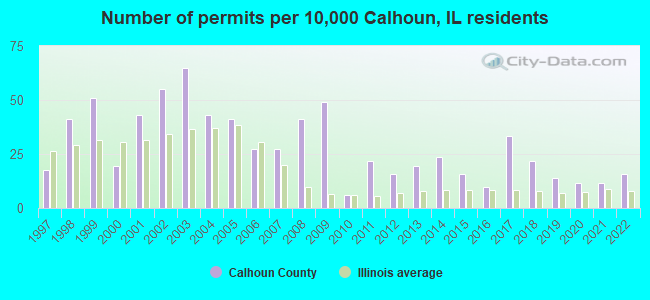
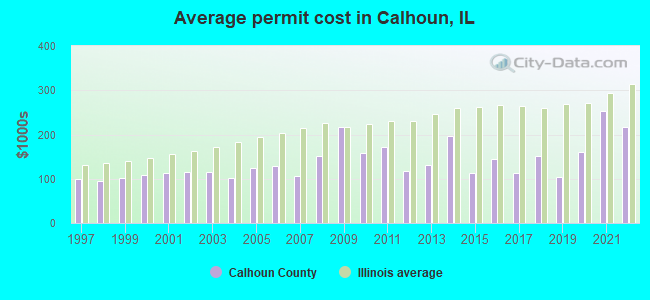
Single-family new house construction building permits:
- 2022: 8 buildings, average cost: $217,900
- 2021: 6 buildings, average cost: $253,900
- 2020: 6 buildings, average cost: $160,800
- 2019: 7 buildings, average cost: $103,600
- 2018: 11 buildings, average cost: $151,300
- 2017: 17 buildings, average cost: $114,000
- 2016: 5 buildings, average cost: $143,500
- 2015: 8 buildings, average cost: $112,500
- 2014: 12 buildings, average cost: $197,100
- 2013: 10 buildings, average cost: $129,500
- 2012: 8 buildings, average cost: $118,300
- 2011: 11 buildings, average cost: $170,900
- 2010: 3 buildings, average cost: $158,900
- 2009: 25 buildings, average cost: $216,600
- 2008: 21 buildings, average cost: $152,000
- 2007: 14 buildings, average cost: $106,600
- 2006: 14 buildings, average cost: $127,900
- 2005: 21 buildings, average cost: $125,000
- 2004: 22 buildings, average cost: $101,700
- 2003: 33 buildings, average cost: $116,300
- 2002: 28 buildings, average cost: $116,300
- 2001: 22 buildings, average cost: $111,900
- 2000: 10 buildings, average cost: $108,200
- 1999: 26 buildings, average cost: $101,700
- 1998: 21 buildings, average cost: $96,000
- 1997: 9 buildings, average cost: $100,000
Median real estate property taxes paid for housing units with mortgages in 2022: $2,468 (1.4%)
Median real estate property taxes paid for housing units with no mortgage in 2022: $2,485 (1.5%)
| Calhoun County: | 8.5% |
| Illinois: | 11.9% |
Median age of residents in 2022: 48.6 years old
(Males: 47.7 years old, Females: 50.1 years old)
(Median age for: White residents: 49.4 years old, Black residents: 21.9 years old, American Indian residents: 32.0 years old, Hispanic or Latino residents: 43.4 years old)
Area name: St. Louis, MO-IL HUD Metro FMR Area
Fair market rent in 2006 for a 1-bedroom apartment in Calhoun County is $526 a month.
Fair market rent for a 2-bedroom apartment is $654 a month.
Fair market rent for a 3-bedroom apartment is $842 a month.
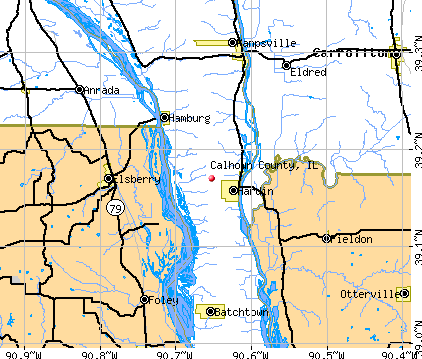
Cities in this county include: Hardin, Kampsville, Batchtown, Brussels, Hamburg.
Neighboring counties: Millard County, Utah  , Greene County
  , Jackson County, Ohio
  , Monroe County, Missouri
  , Warren County, Virginia , Wabaunsee County, Kansas .
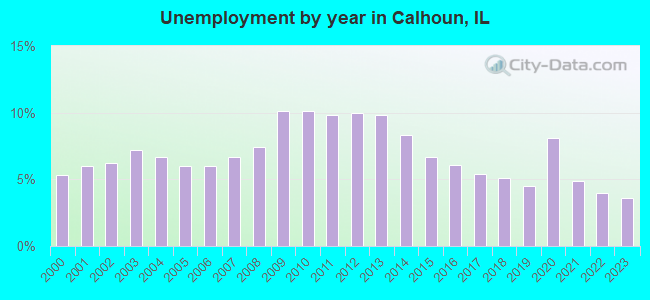
| Here: | 3.6% |
| Illinois: | 4.2% |
Current college students: 179
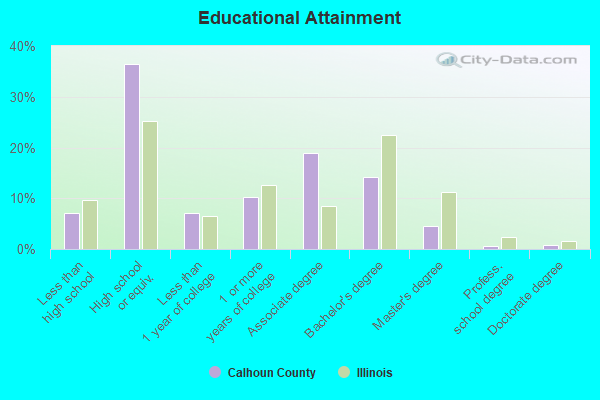
People 25 years of age or older with a high school degree or higher: 92.0%
People 25 years of age or older with a bachelor's degree or higher: 19.5%
Number of foreign born residents: 24 (83.7% naturalized citizens)
| Calhoun County: | 0.5% |
| Whole state: | 14.4% |

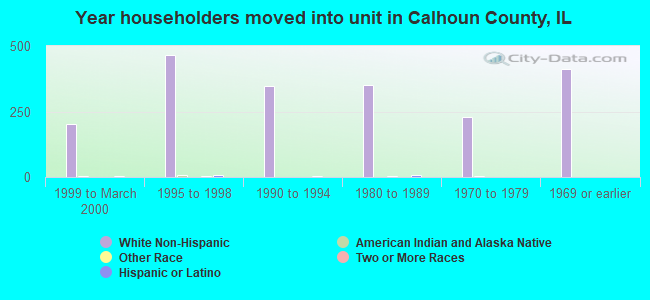
- Year of entry for the foreign-born population
- 12010 or later
- 52000 to 2009
- 01990 to 1999
- 51980 to 1989
- 131970 to 1979
- 28Before 1970
Mean travel time to work (commute): / minutes
Percentage of county residents living and working in this county: 72.4%
Housing units in structures:
- One, detached: 1,910
- One, attached: 38
- Two: 21
- 3 or 4: 45
- 5 to 9: 36
- 10 to 19: 7
- Mobile homes: 250
Housing units in Calhoun County with a mortgage: 431 (38 second mortgage, 1 home equity loan, 26 both second mortgage and home equity loan)
Houses without a mortgage: 1
| Here: | 99.8% with mortgage |
| State: | 97.4% with mortgage |
Religion statistics for Calhoun County
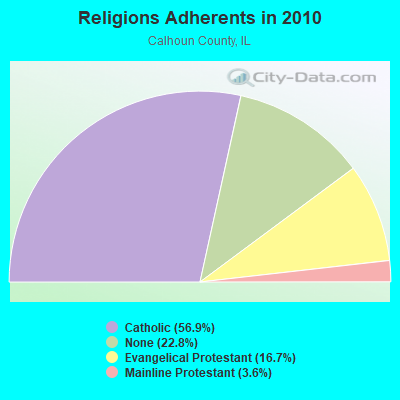
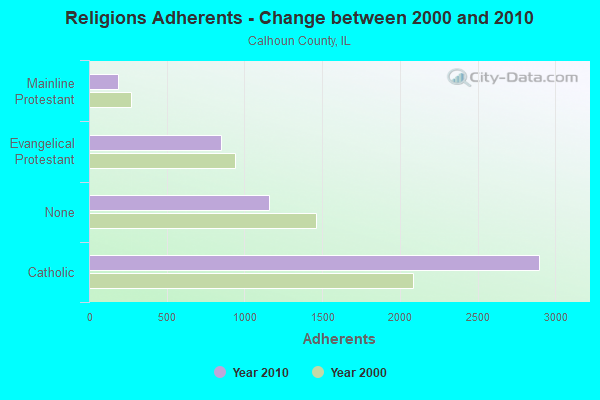
| Religion | Adherents | Congregations |
|---|---|---|
| Catholic | 2,898 | 2 |
| Evangelical Protestant | 848 | 9 |
| Mainline Protestant | 185 | 5 |
| None | 1,158 | - |
Source: Clifford Grammich, Kirk Hadaway, Richard Houseal, Dale E.Jones, Alexei Krindatch, Richie Stanley and Richard H.Taylor. 2012. 2010 U.S.Religion Census: Religious Congregations & Membership Study. Association of Statisticians of American Religious Bodies. Jones, Dale E., et al. 2002. Congregations and Membership in the United States 2000. Nashville, TN: Glenmary Research Center.
Food Environment Statistics:
| Calhoun County: | 5.84 / 10,000 pop. |
| State: | 2.24 / 10,000 pop. |
| Calhoun County: | 1.95 / 10,000 pop. |
| Illinois: | 2.61 / 10,000 pop. |
| This county: | 21.41 / 10,000 pop. |
| State: | 6.86 / 10,000 pop. |
| Calhoun County: | 9.5% |
| Illinois: | 8.3% |
| Calhoun County: | 26.3% |
| State: | 25.2% |
| Here: | 9.8% |
| State: | 14.5% |
Agriculture in Calhoun County:
Average size of farms: 188 acresAverage value of agricultural products sold per farm: $26,397
Average value of crops sold per acre for harvested cropland: $251.24
The value of nursery, greenhouse, floriculture, and sod as a percentage of the total market value of agricultural products sold: 0.09%
The value of livestock, poultry, and their products as a percentage of the total market value of agricultural products sold: 21.20%
Average total farm production expenses per farm: $19,108
Harvested cropland as a percentage of land in farms: 43.98%
Irrigated harvested cropland as a percentage of land in farms: 0.08%
Average market value of all machinery and equipment per farm: $49,647
The percentage of farms operated by a family or individual: 91.88%
Average age of principal farm operators: 56 years
Average number of cattle and calves per 100 acres of all land in farms: 6.57
Milk cows as a percentage of all cattle and calves: 1.80%
Corn for grain: 16523 harvested acres
All wheat for grain: 767 harvested acres
Soybeans for beans: 16562 harvested acres
Vegetables: 295 harvested acres
Land in orchards: 1,188 acres
Earthquake activity:
Calhoun County-area historical earthquake activity is significantly above Illinois state average. It is 296% greater than the overall U.S. average.On 4/18/2008 at 09:36:59, a magnitude 5.4 (5.1 MB, 4.8 MS, 5.4 MW, 5.2 MW, Class: Moderate, Intensity: VI - VII) earthquake occurred 157.2 miles away from Calhoun County center
On 4/18/2008 at 09:36:59, a magnitude 5.2 (5.2 MW, Depth: 8.9 mi) earthquake occurred 157.2 miles away from the county center
On 6/10/1987 at 23:48:54, a magnitude 5.1 (4.9 MB, 4.4 MS, 4.6 MS, 5.1 LG) earthquake occurred 150.7 miles away from the county center
On 9/26/1990 at 13:18:51, a magnitude 5.0 (4.7 MB, 4.8 LG, 5.0 LG, Depth: 7.7 mi) earthquake occurred 151.2 miles away from the county center
On 6/18/2002 at 17:37:15, a magnitude 5.0 (4.3 MB, 4.6 MW, 5.0 LG) earthquake occurred 175.5 miles away from Calhoun County center
On 5/4/1991 at 01:18:54, a magnitude 5.0 (4.4 MB, 4.6 LG, 5.0 LG, Depth: 3.1 mi) earthquake occurred 185.8 miles away from the county center
Magnitude types: regional Lg-wave magnitude (LG), body-wave magnitude (MB), surface-wave magnitude (MS), moment magnitude (MW)
Most recent natural disasters:
- Illinois Covid-19 Pandemic, Incident Period: January 20, 2020, FEMA Id: 4489, Natural disaster type: Other
- Illinois Severe Storms And Flooding, Incident Period: February 24, 2019 - July 3, 2019, FEMA Id: 4461, Natural disaster type: Storm, Flood
- Illinois Severe Storms, Straight-Line Winds and Flooding, Incident Period: April 16, 2013 to May 05, 2013, Major Disaster (Presidential) Declared DR-4116: May 10, 2013, FEMA Id: 4116, Natural disaster type: Storm, Flood, Wind
- Illinois Severe Winter Storm and Snowstorm, Incident Period: January 31, 2011 to February 03, 2011, Major Disaster (Presidential) Declared DR-1960: March 17, 2011, FEMA Id: 1960, Natural disaster type: Snowstorm, Winter Storm
- Illinois Severe Storms and Flooding, Incident Period: June 01, 2008 to July 22, 2008, Major Disaster (Presidential) Declared DR-1771: June 24, 2008, FEMA Id: 1771, Natural disaster type: Storm, Flood
- Illinois Severe Winter Storm, Incident Period: November 30, 2006 to December 01, 2006, Major Disaster (Presidential) Declared DR-1681: February 09, 2007, FEMA Id: 1681, Natural disaster type: Winter Storm
- Illinois Hurricane Katrina Evacuation, Incident Period: August 29, 2005 to October 01, 2005, Emergency Declared EM-3230: September 07, 2005, FEMA Id: 3230, Natural disaster type: Hurricane
- Illinois Severe Storms, Tornadoes, and Flooding, Incident Period: April 21, 2002 to May 23, 2002, Major Disaster (Presidential) Declared DR-1416: May 21, 2002, FEMA Id: 1416, Natural disaster type: Storm, Tornado, Flood
- Illinois Flooding, Incident Period: April 18, 2001 to May 29, 2001, Major Disaster (Presidential) Declared DR-1368: May 09, 2001, FEMA Id: 1368, Natural disaster type: Flood
- Illinois Winter Snow Storm, Incident Period: January 01, 1999 to January 15, 1999, Emergency Declared EM-3134: January 08, 1999, FEMA Id: 3134, Natural disaster type: Storm, Snow
- 13 other natural disasters have been reported since 1953.
The number of natural disasters in Calhoun County (23) is greater than the US average (15).
Major Disasters (Presidential) Declared: 19
Emergencies Declared: 2
Causes of natural disasters: Floods: 18, Storms: 16, Tornadoes: 4, Winter Storms: 2, Heavy Rain: 1, Hurricane: 1, Snow: 1, Snowstorm: 1, Wind: 1, Other: 1 (Note: some incidents may be assigned to more than one category).
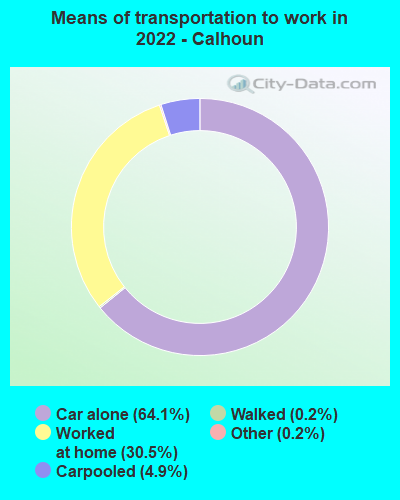
Means of transportation to work:
- Drove a car alone: 551 (61.8%)
- Carpooled: 45 (5.0%)
- Taxicab, motorcycle, or other means: 2 (0.2%)
- Walked: 1 (0.1%)
- Worked at home: 355 (39.8%)

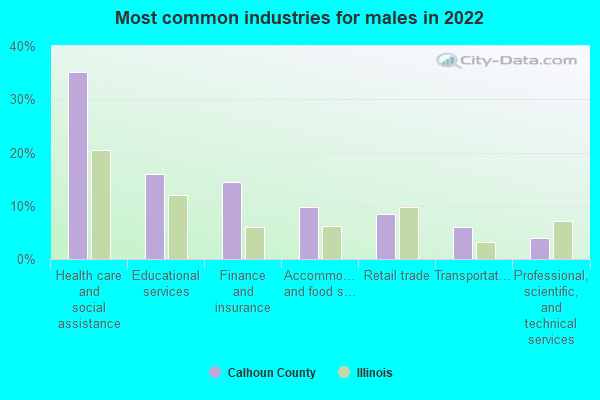
- Health care and social assistance (35%)
- Educational services (16%)
- Finance and insurance (15%)
- Accommodation and food services (10%)
- Retail trade (9%)
- Transportation and warehousing (6%)
- Professional, scientific, and technical services (4%)
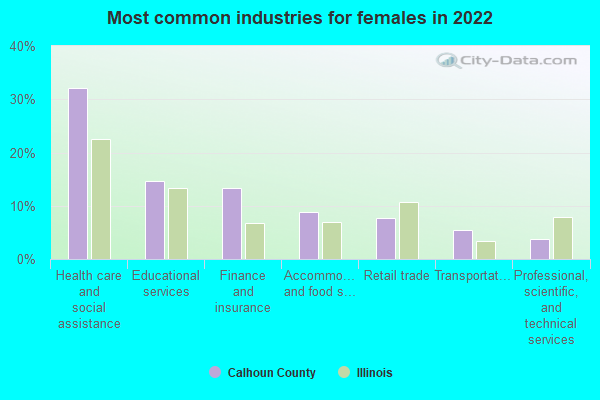
- Health care and social assistance (32%)
- Educational services (15%)
- Finance and insurance (13%)
- Accommodation and food services (9%)
- Retail trade (8%)
- Transportation and warehousing (6%)
- Professional, scientific, and technical services (4%)
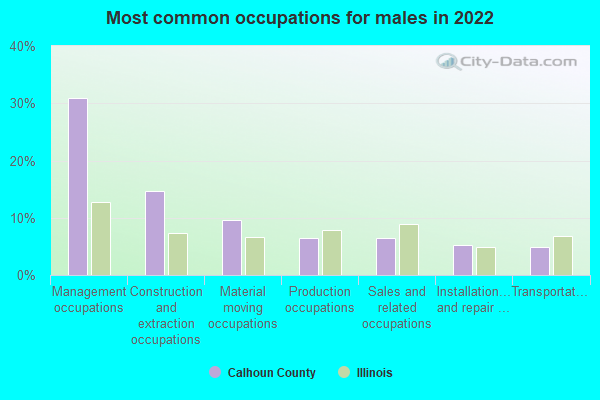
- Management occupations (31%)
- Construction and extraction occupations (15%)
- Material moving occupations (10%)
- Production occupations (6%)
- Sales and related occupations (6%)
- Installation, maintenance, and repair occupations (5%)
- Transportation occupations (5%)
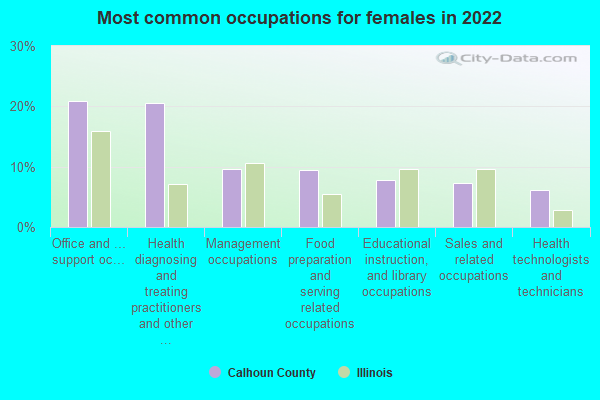
- Office and administrative support occupations (21%)
- Health diagnosing and treating practitioners and other technical occupations (21%)
- Management occupations (10%)
- Food preparation and serving related occupations (10%)
- Educational instruction, and library occupations (8%)
- Sales and related occupations (7%)
- Health technologists and technicians (6%)

- Germany (50%)
- Czechoslovakia (includes Czech Republic and Slovakia) (12%)
- Mexico (8%)
- Brazil (8%)
- Pakistan (4%)
- Norway (0%)
- Sweden (0%)
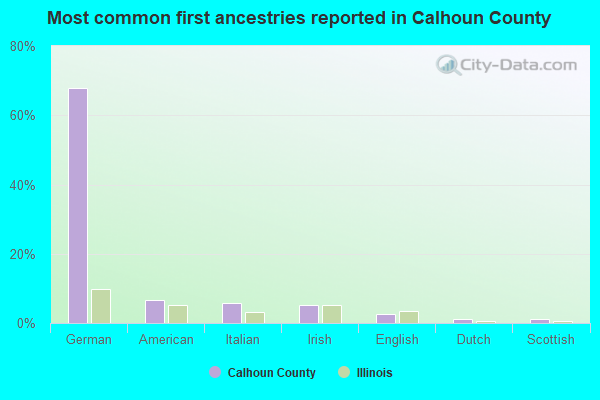
- German (68%)
- American (7%)
- Italian (6%)
- Irish (5%)
- English (3%)
- Dutch (1%)
- Scottish (1%)
People in group quarters in Calhoun County, Illinois in 2010:
- 67 people in nursing facilities/skilled-nursing facilities
- 21 people in group homes intended for adults
- 2 people in local jails and other municipal confinement facilities
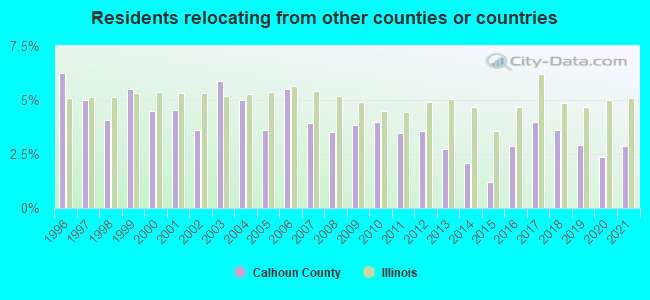
2.88% of this county's 2021 resident taxpayers lived in other counties in 2020 ($39,327 average adjusted gross income)
| Here: | 2.88% |
| Illinois average: | 5.09% |
10 or fewer of this county's residents moved from foreign countries.
2.88% relocated from other counties in Illinois ($39,327 average AGI)
10 or fewer of this county's residents relocated from other states.
Top counties from which taxpayers relocated into this county between 2020 and 2021:
| from Jersey County, IL |
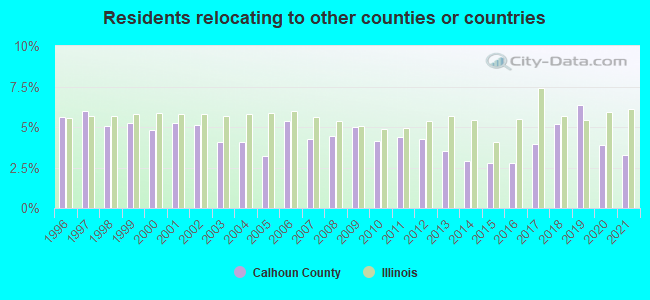
3.28% of this county's 2020 resident taxpayers moved to other counties in 2021 ($46,179 average adjusted gross income)
| Here: | 3.28% |
| Illinois average: | 6.10% |
10 or fewer of this county's residents moved to foreign countries.
3.28% relocated to other counties in Illinois ($46,179 average AGI)
10 or fewer of this county's residents relocated to other states.
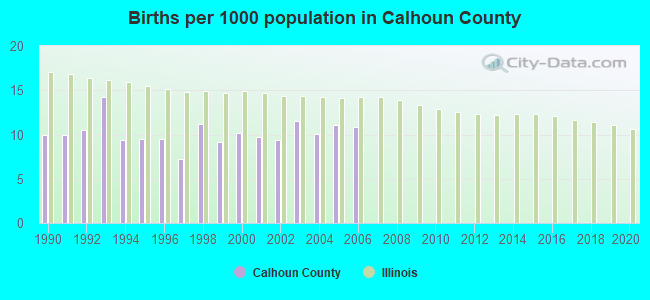
Births per 1000 population from 1990 to 1999: 10.1
Births per 1000 population from 2000 to 2006: 10.4
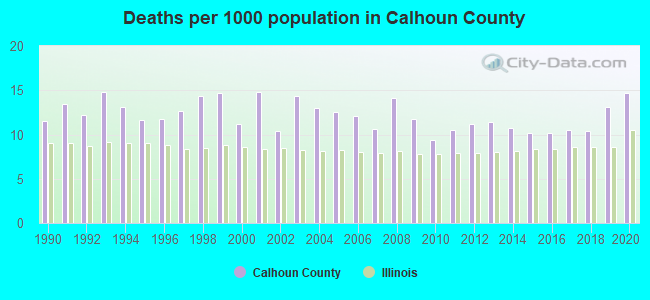
Deaths per 1000 population from 1990 to 1999: 13.0
Deaths per 1000 population from 2000 to 2009: 12.5
Deaths per 1000 population from 2010 to 2020: 11.1
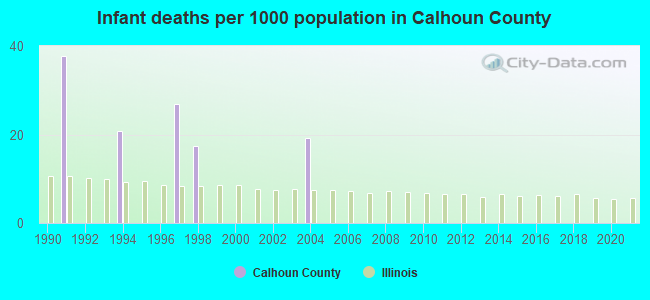
Infant deaths per 1000 live births from 1990 to 1999: 10.3
Infant deaths per 1000 live births from 2000 to 2006: 2.7
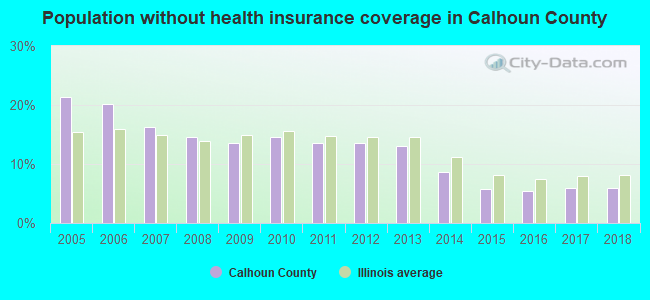
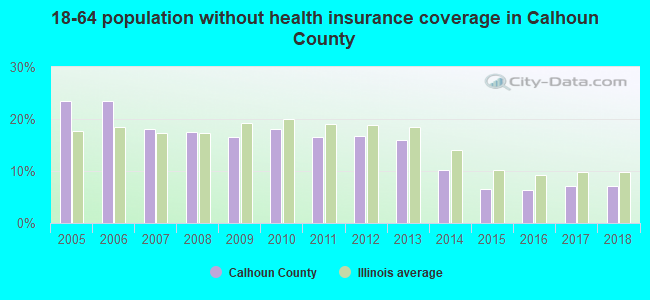
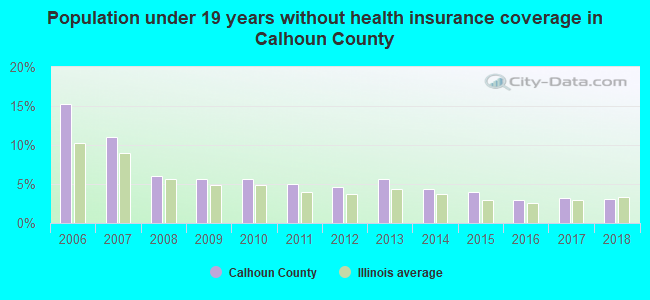
Persons under 19 years old without health insurance coverage in 2018: 3.1%
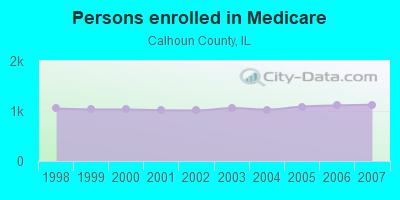
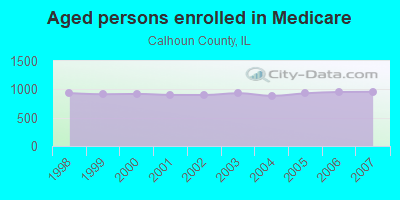
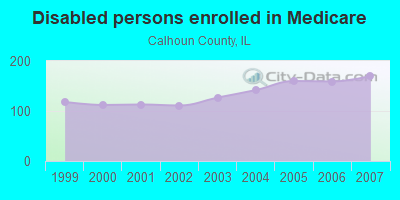
Persons enrolled in hospital insurance and/or supplemental medical insurance (Medicare) in July 1, 2007: 1,127 (957 aged, 170 disabled)
Children under 18 without health insurance coverage in 2007: 103 (10%)
Most common underlying causes of death in Calhoun County, Illinois in 1999 - 2019:
- Acute myocardial infarction, unspecified (69)
- Atherosclerotic heart disease (23)
Population without health insurance coverage in 2000: 8%
Children under 18 without health insurance coverage in 2000: 7%
Medical specialist MDs per 100,000 population in 2005: 1,666
Dentists per 100,000 population in 1998: 19
Total births per 100,000 population, July 2005 - July 2006 : 20
Total deaths per 100,000 population, July 2005 - July 2006: 58
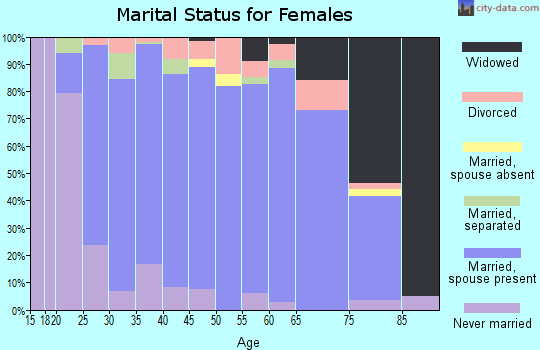
Household type by relationship:
Households: 4,410- Male householders: 585 (122 living alone), Female householders: 641 (139 living alone)
805 spouses (805 opposite-sex spouses), 48 unmarried partners, (48 opposite-sex unmarried partners), 1,595 children (1,554 natural, 6 adopted, 33 stepchildren), 64 grandchildren, 159 brothers or sisters, 196 parents, 10 foster children, 42 other relatives, 85 non-relatives
- In group quarters: 117
Size of family households: 459 2-persons, 139 3-persons, 186 4-persons, 81 5-persons, 13 6-persons, 34 7-or-more-persons.
Size of nonfamily households: 262 1-person, 44 2-persons.
668 married couples with children.
145 single-parent households (38 men, 107 women).
99.1% of residents of Calhoun speak English at home.
0.2% of residents speak Spanish at home (100% speak English very well).
0.5% of residents speak other Indo-European language at home (55% speak English very well, 45% speak English well).
0.1% of residents speak Asian or Pacific Island language at home (100% speak English very well).
In fiscal year 2004:
Federal Government expenditure: $83,490,000 ($16,087 per capita)
Department of Defense expenditure: $50,036,000
Federal direct payments to individuals for retirement and disability: $15,080,000
Federal other direct payments to individuals: $7,877,000
Federal direct payments not to individuals: $2,419,000
Federal grants: $6,023,000
Federal procurement contracts: $50,250,000 ($49,583,000 Department of Defense)
Federal salaries and wages: $1,841,000 ($0,000 Department of Defense)
Federal Government direct loans: $1,210,000
Federal guaranteed/insured loans: $1,030,000
Federal Government insurance: $17,070,000
Population change from April 1, 2000 to July 1, 2005:
Births: 275| Here: | 53 per 1000 residents |
| State: | 75 per 1000 residents |
Deaths: 356
| Here: | 69 per 1000 residents |
| State: | 43 per 1000 residents |
Net international migration: -4
| Here: | |
| State: |
Net internal migration: +174
| Here: | |
| State: |
Total withdrawal of fresh water for public supply: 0.30 millions of gallons per day (all from ground)
| Here: | 6.1 |
| State: | 6.4 |
| Here: | 4.7 |
| State: | 4.1 |
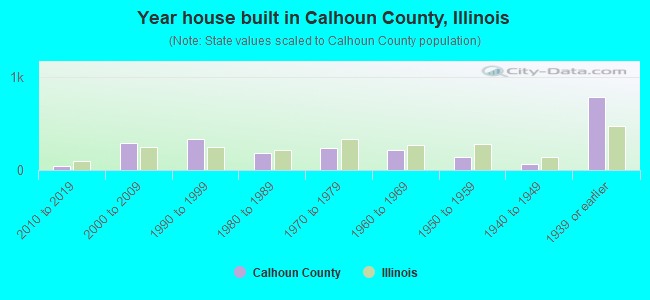
- Year house built in Calhoun County, Illinois
- 72020 or later
- 482010 to 2019
- 2902000 to 2009
- 3311990 to 1999
- 1871980 to 1989
- 2341970 to 1979
- 2131960 to 1969
- 1361950 to 1959
- 661940 to 1949
- 7781939 or earlier
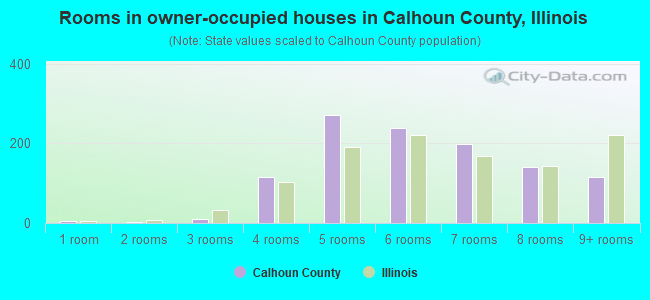
- Rooms in owner-occupied houses in Calhoun County, Illinois
- 41 room
- 22 rooms
- 93 rooms
- 1154 rooms
- 2715 rooms
- 2386 rooms
- 1977 rooms
- 1418 rooms
- 1159+ rooms
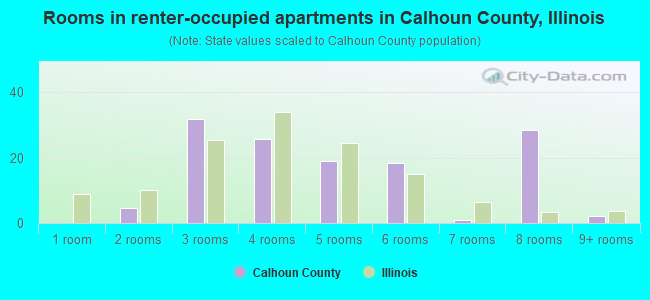
- Rooms in renter-occupied apartments in Calhoun County, Illinois
- 01 room
- 52 rooms
- 323 rooms
- 264 rooms
- 195 rooms
- 186 rooms
- 17 rooms
- 288 rooms
- 29+ rooms

- Bedrooms in owner-occupied houses in Calhoun County, Illinois
- 4no bedroom
- 311 bedroom
- 2172 bedrooms
- 6483 bedrooms
- 1604 bedrooms
- 365+ bedrooms
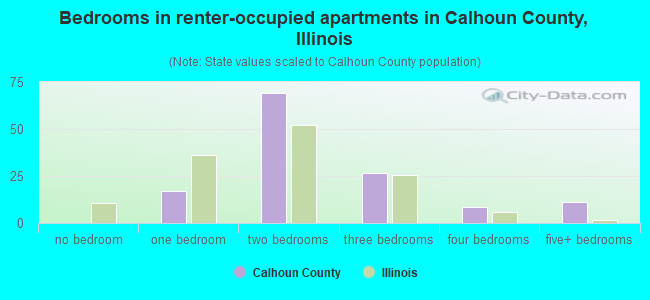
- Bedrooms in renter-occupied apartments in Calhoun County, Illinois
- 0no bedroom
- 171 bedroom
- 692 bedrooms
- 273 bedrooms
- 84 bedrooms
- 115+ bedrooms
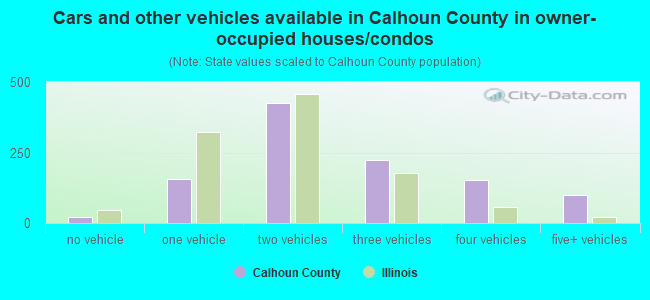
- Cars and other vehicles available in Calhoun County in owner-occupied houses/condos
- 23no vehicle
- 1571 vehicle
- 4262 vehicles
- 2243 vehicles
- 1534 vehicles
- 995+ vehicles
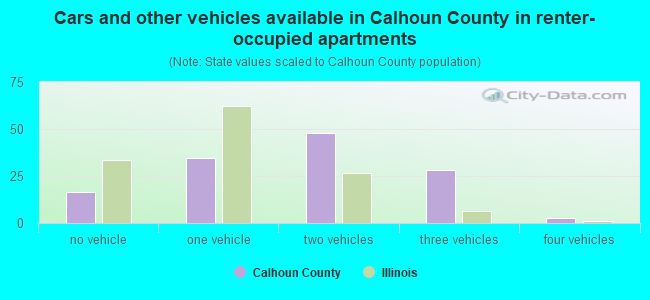
- Cars and other vehicles available in Calhoun County in renter-occupied apartments
- 17no vehicle
- 351 vehicle
- 482 vehicles
- 283 vehicles
- 34 vehicles
- 05+ vehicles
97.5% of Calhoun County residents lived in the same house 1 years ago.
Out of people who lived in different houses, 27% lived in this county.
Out of people who lived in different counties, 97% lived in Illinois.
| Calhoun County: | 97.5% |
| State average: | 88.3% |
Place of birth for U.S.-born residents:
- This state: 3,535
- Other state: 833
- Northeast: 162
- Midwest: 549
- South: 63
- West: 66

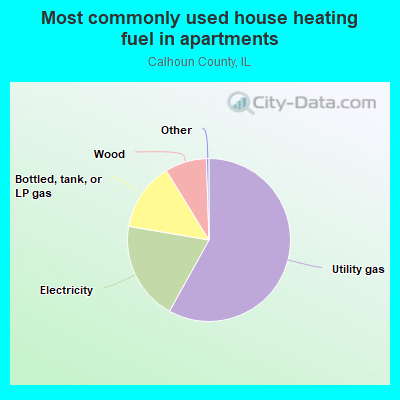
- 49.6%Bottled, tank, or LP gas
- 22.8%Electricity
- 19.4%Utility gas
- 8.2%Wood
- 58.3%Utility gas
- 19.7%Electricity
- 13.6%Bottled, tank, or LP gas
- 8.3%Wood
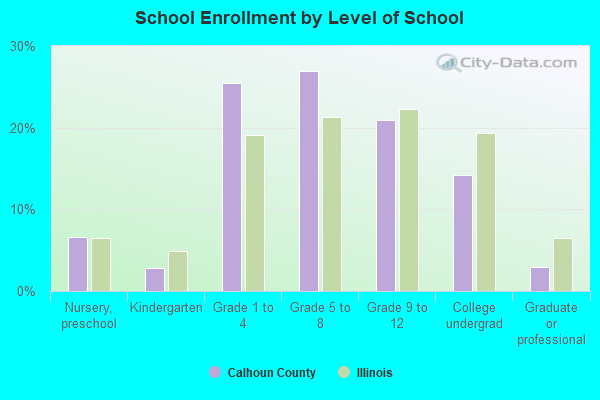
Private vs. public school enrollment:
| Here: | 18.5% |
| Illinois: | 13.3% |
| Here: | 11.4% |
| Illinois: | 9.9% |
| Here: | 11.2% |
| Illinois: | 27.4% |
Calhoun County government finances - Expenditure in 2017:
- Charges - Other: $67,000
- Construction - Regular Highways: $2,338,000
Central Staff Services: $426,000
- Current Operations - Regular Highways: $1,451,000
General - Other: $670,000
Central Staff Services: $434,000
Police Protection: $400,000
Judicial and Legal Services: $341,000
General Public Buildings: $59,000
Financial Administration: $35,000
Health - Other: $25,000
Protective Inspection and Regulation - Other: $9,000
- Federal Intergovernmental - Other: $230,000
Highways: $24,000
General Local Government Support: $2,000
- Miscellaneous - Fines and Forfeits: $348,000
General Revenue - Other: $261,000
Interest Earnings: $18,000
- Other Capital Outlay - Regular Highways: $131,000
Police Protection: $40,000
General - Other: $17,000
Central Staff Services: $6,000
- Other Funds - Cash and Securities: $4,937,000
- State Intergovernmental - Highways: $2,720,000
General Local Government Support: $795,000
Other: $7,000
- Tax - Property: $1,152,000
Other Selective Sales: $113,000
Other License: $11,000
- Total Salaries and Wages: $1,508,000
Calhoun County government finances - Revenue in 2017:
- Charges - Other: $67,000
- Construction - Regular Highways: $2,338,000
Central Staff Services: $426,000
- Current Operations - Regular Highways: $1,451,000
General - Other: $670,000
Central Staff Services: $434,000
Police Protection: $400,000
Judicial and Legal Services: $341,000
General Public Buildings: $59,000
Financial Administration: $35,000
Health - Other: $25,000
Protective Inspection and Regulation - Other: $9,000
- Federal Intergovernmental - Other: $230,000
Highways: $24,000
General Local Government Support: $2,000
- Miscellaneous - Fines and Forfeits: $348,000
General Revenue - Other: $261,000
Interest Earnings: $18,000
- Other Capital Outlay - Regular Highways: $131,000
Police Protection: $40,000
General - Other: $17,000
Central Staff Services: $6,000
- Other Funds - Cash and Securities: $4,937,000
- State Intergovernmental - Highways: $2,720,000
General Local Government Support: $795,000
Other: $7,000
- Tax - Property: $1,152,000
Other Selective Sales: $113,000
Other License: $11,000
- Total Salaries and Wages: $1,508,000
Calhoun County government finances - Debt in 2017:
- Charges - Other: $67,000
- Construction - Regular Highways: $2,338,000
Central Staff Services: $426,000
- Current Operations - Regular Highways: $1,451,000
General - Other: $670,000
Central Staff Services: $434,000
Police Protection: $400,000
Judicial and Legal Services: $341,000
General Public Buildings: $59,000
Financial Administration: $35,000
Health - Other: $25,000
Protective Inspection and Regulation - Other: $9,000
- Federal Intergovernmental - Other: $230,000
Highways: $24,000
General Local Government Support: $2,000
- Miscellaneous - Fines and Forfeits: $348,000
General Revenue - Other: $261,000
Interest Earnings: $18,000
- Other Capital Outlay - Regular Highways: $131,000
Police Protection: $40,000
General - Other: $17,000
Central Staff Services: $6,000
- Other Funds - Cash and Securities: $4,937,000
- State Intergovernmental - Highways: $2,720,000
General Local Government Support: $795,000
Other: $7,000
- Tax - Property: $1,152,000
Other Selective Sales: $113,000
Other License: $11,000
- Total Salaries and Wages: $1,508,000
Calhoun County government finances - Cash and Securities in 2017:
- Charges - Other: $67,000
- Construction - Regular Highways: $2,338,000
Central Staff Services: $426,000
- Current Operations - Regular Highways: $1,451,000
General - Other: $670,000
Central Staff Services: $434,000
Police Protection: $400,000
Judicial and Legal Services: $341,000
General Public Buildings: $59,000
Financial Administration: $35,000
Health - Other: $25,000
Protective Inspection and Regulation - Other: $9,000
- Federal Intergovernmental - Other: $230,000
Highways: $24,000
General Local Government Support: $2,000
- Miscellaneous - Fines and Forfeits: $348,000
General Revenue - Other: $261,000
Interest Earnings: $18,000
- Other Capital Outlay - Regular Highways: $131,000
Police Protection: $40,000
General - Other: $17,000
Central Staff Services: $6,000
- Other Funds - Cash and Securities: $4,937,000
- State Intergovernmental - Highways: $2,720,000
General Local Government Support: $795,000
Other: $7,000
- Tax - Property: $1,152,000
Other Selective Sales: $113,000
Other License: $11,000
- Total Salaries and Wages: $1,508,000
Supplemental Security Income (SSI) in 2006:
- Total number of recipients: 88
- Number of aged recipients: 8
- Number of blind and disabled recipients: 80
- Number of recipients under 18: 6
- Number of recipients between 18 and 64: 65
- Number of recipients older than 64: 17
- Number of recipients also receiving OASDI: 37
- Amount of payments (thousands of dollars): 37
| Most common first names in Calhoun County, IL among deceased individuals | ||
| Name | Count | Lived (average) |
|---|---|---|
| John | 40 | 76.2 years |
| Mary | 33 | 79.4 years |
| Charles | 33 | 77.7 years |
| William | 32 | 76.1 years |
| James | 26 | 69.2 years |
| George | 23 | 84.0 years |
| Paul | 21 | 75.5 years |
| Raymond | 20 | 77.7 years |
| Dorothy | 18 | 83.7 years |
| Joseph | 16 | 81.2 years |
| Most common last names in Calhoun County, IL among deceased individuals | ||
| Last name | Count | Lived (average) |
|---|---|---|
| Godar | 20 | 81.2 years |
| Snyders | 19 | 77.7 years |
| Franke | 17 | 80.6 years |
| Gress | 16 | 75.7 years |
| Schumann | 16 | 81.4 years |
| Klaas | 16 | 74.8 years |
| Bick | 15 | 67.6 years |
| Schleeper | 14 | 81.1 years |
| Sievers | 13 | 84.9 years |
| Hagen | 13 | 79.1 years |
Businesses in Calhoun County, IL
- Jimmy John's: 3
- Subway: 1
Calhoun County on our top lists:
- #55 on the list of "Top 101 counties with the lowest percentage of residents relocating from other counties between 2010 and 2011"