Bear Lake County, Idaho (ID)
County owner-occupied free and clear houses and condos in 2010: 770
County owner-occupied houses and condos in 2000: 1,879
Renter-occupied apartments: 426 (it was 380 in 2000)
| % of renters here: | 17% |
| State: | 30% |
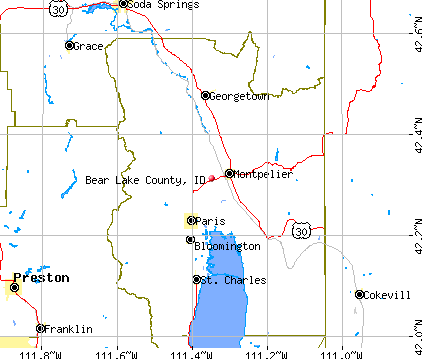
Land area: 971 sq. mi.
Water area: 78.1 sq. mi.
Population density: 7 people per square mile (very low).
Industries providing employment: Educational, health and social services (27.4%), Agriculture,forestry,fishing and hunting, and mining (13.2%), Retail trade (10.3%), Construction (10.1%).
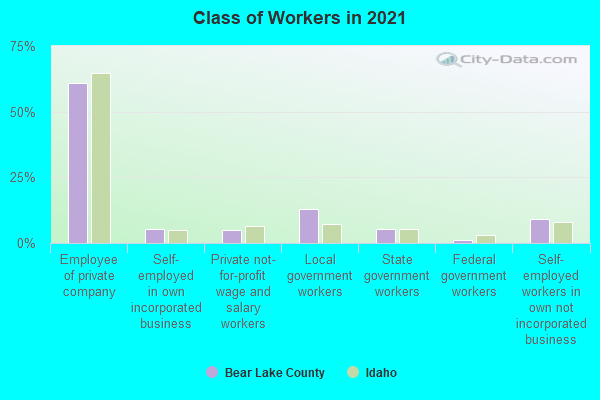
Type of workers:
- Private wage or salary: 71%
- Government: 20%
- Self-employed, not incorporated: 9%
- Unpaid family work: 0%
- OSM Map
- General Map
- Google Map
- MSN Map

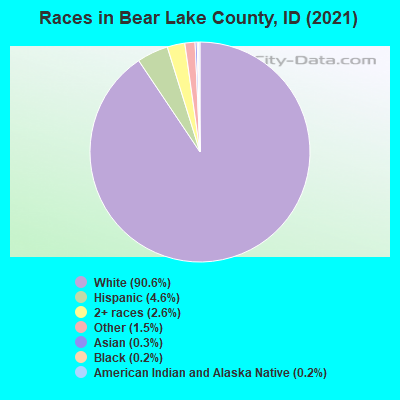
- 6,13892.0%White Non-Hispanic Alone
- 2994.5%Hispanic or Latino
- 1131.7%Two or more races
- 560.8%Asian alone
- 380.6%Some other race alone
- 200.3%American Indian and Alaska Native alone
- 70.1%Black Non-Hispanic Alone
| Median resident age: | 40.7 years |
| Idaho median age: | 37.5 years |
| Males: 3,392 | |
| Females: 3,338 |

 | New blogs for Idaho Falls development junkies (2415 replies) |
| Californians! (88 replies) |
| Life in Bear Lake... (4 replies) |
| Bear Lake County: | 2.0 people |
| Idaho: | 3 people |
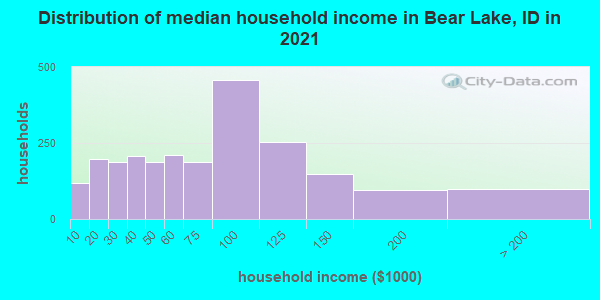
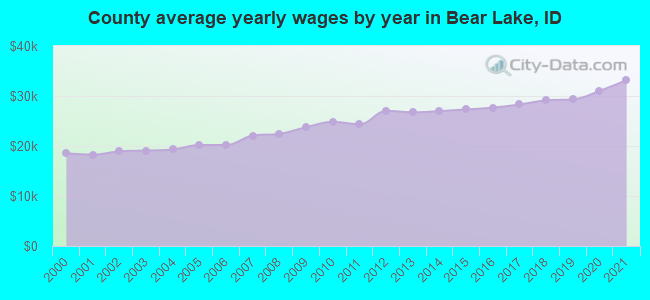
Estimated median household income in 2022: $65,559 ($32,162 in 1999)
| This county: | $65,559 |
| Idaho: | $72,785 |
Median contract rent in 2022 for apartments: $512 (lower quartile is $395, upper quartile is $812)
| This county: | $512 |
| State: | $1003 |
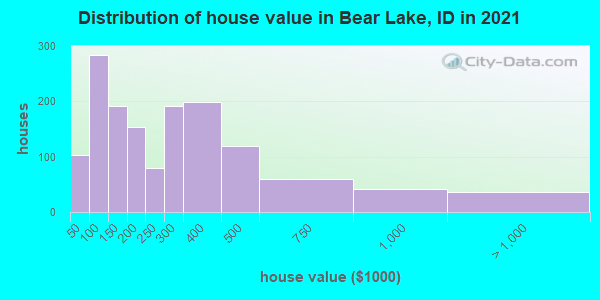
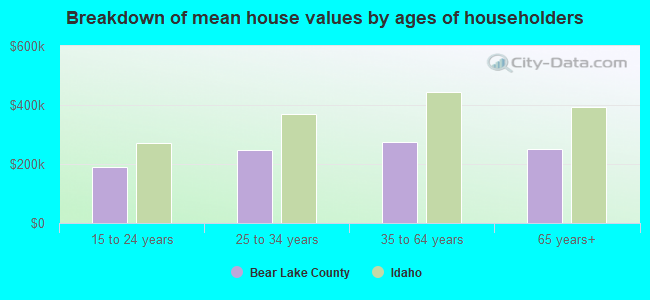
Estimated median house or condo value in 2022: $253,944 (it was $71,400 in 2000)
| Bear Lake: | $253,944 |
| Idaho: | $432,500 |
Mean price in 2022:
Median monthly housing costs for homes and condos with a mortgage: $1,185Detached houses: $312,137
Here: $312,137 State: $527,539 Mobile homes: $117,688
Here: $117,688 State: $150,232 Occupied boats, RVs, vans, etc.: $166,908
Here: $166,908 State: $136,871
Median monthly housing costs for units without a mortgage: $355
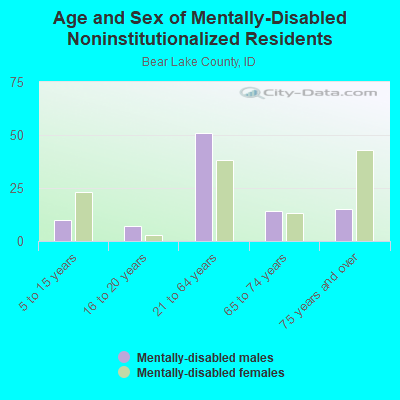
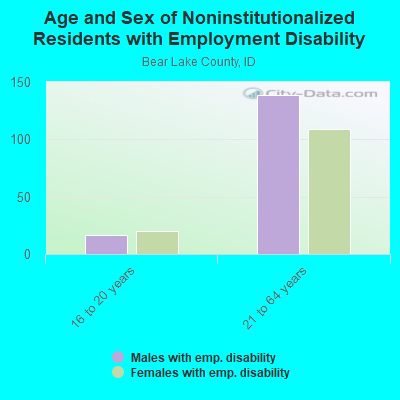
Institutionalized population: 31
Crime in 2021 (reported by the sheriff's office or county police, not the county total):
- Murders: 0
- Rapes: 1
- Robberies: 0
- Assaults: 0
- Burglaries: 0
- Thefts: 8
- Auto thefts: 0
Crime in 2019 (reported by the sheriff's office or county police, not the county total):
- Murders: 0
- Rapes: 0
- Robberies: 0
- Assaults: 0
- Burglaries: 3
- Thefts: 17
- Auto thefts: 0
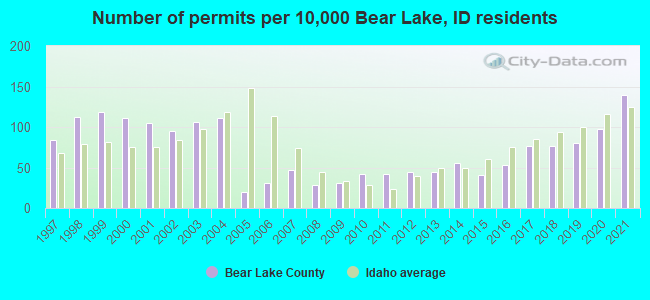
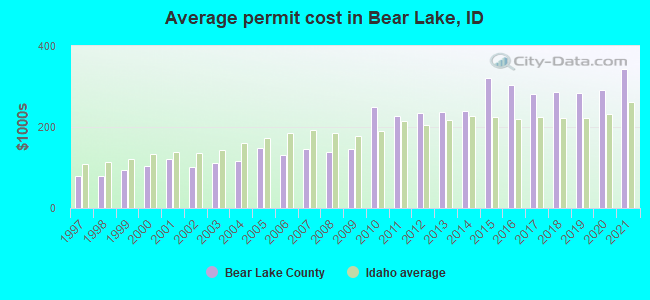
Single-family new house construction building permits:
- 2022: 89 buildings, average cost: $335,000
- 2021: 89 buildings, average cost: $341,700
- 2020: 63 buildings, average cost: $292,200
- 2019: 51 buildings, average cost: $285,000
- 2018: 49 buildings, average cost: $287,300
- 2017: 49 buildings, average cost: $280,800
- 2016: 34 buildings, average cost: $304,400
- 2015: 26 buildings, average cost: $322,100
- 2014: 35 buildings, average cost: $240,300
- 2013: 28 buildings, average cost: $237,800
- 2012: 28 buildings, average cost: $234,200
- 2011: 27 buildings, average cost: $227,100
- 2010: 27 buildings, average cost: $248,500
- 2009: 20 buildings, average cost: $146,300
- 2008: 18 buildings, average cost: $137,500
- 2007: 30 buildings, average cost: $146,200
- 2006: 20 buildings, average cost: $130,700
- 2005: 13 buildings, average cost: $147,300
- 2004: 71 buildings, average cost: $116,300
- 2003: 68 buildings, average cost: $111,600
- 2002: 61 buildings, average cost: $100,600
- 2001: 67 buildings, average cost: $121,400
- 2000: 71 buildings, average cost: $104,200
- 1999: 76 buildings, average cost: $94,600
- 1998: 72 buildings, average cost: $79,000
- 1997: 54 buildings, average cost: $78,300
Median real estate property taxes paid for housing units with mortgages in 2022: $1,296 (0.4%)
Median real estate property taxes paid for housing units with no mortgage in 2022: $936 (0.5%)

| Bear Lake County: | 10.3% |
| Idaho: | 10.7% |
Median age of residents in 2022: 40.7 years old
(Males: 40.5 years old, Females: 41.1 years old)
(Median age for: White residents: 41.2 years old, American Indian residents: 17.6 years old, Asian residents: 38.8 years old, Hispanic or Latino residents: 40.9 years old, Other race residents: 20.5 years old)
Fair market rent in 2006 for a 1-bedroom apartment in Bear Lake County is $404 a month.
Fair market rent for a 2-bedroom apartment is $516 a month.
Fair market rent for a 3-bedroom apartment is $733 a month.
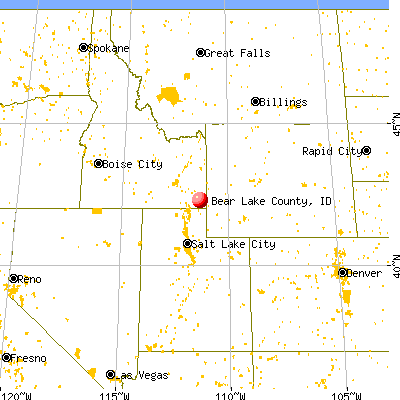
Cities in this county include: Montpelier, Paris, Georgetown, Bloomington, Bennington, St. Charles.
Neighboring counties: Allegan County, Michigan  , Del Norte County, California
  , Hampshire County, Massachusetts , Bradford County, Pennsylvania , Jackson County, Oregon , Dakota County, Nebraska , Montgomery County, New York , Jones County, Iowa .
| Here: | 2.9% |
| Idaho: | 3.1% |

Current college students: 101
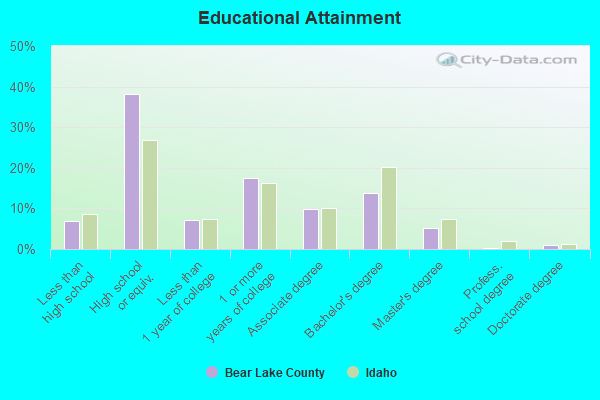
People 25 years of age or older with a high school degree or higher: 93.1%
People 25 years of age or older with a bachelor's degree or higher: 20.8%
Number of foreign born residents: 171 (46.0% naturalized citizens)
| Bear Lake County: | 2.5% |
| Whole state: | 6.0% |
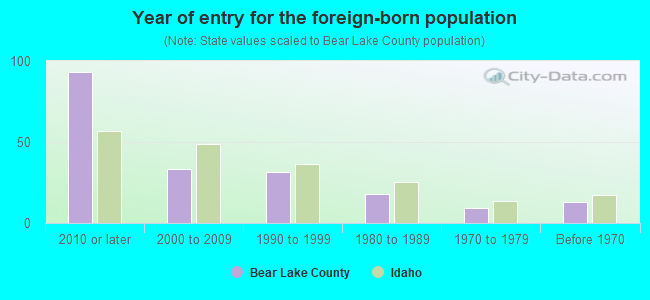
- Year of entry for the foreign-born population
- 932010 or later
- 162000 to 2009
- 321990 to 1999
- 181980 to 1989
- 91970 to 1979
- 13Before 1970
Mean travel time to work (commute): minutes
Percentage of county residents living and working in this county: 92.1%
Housing units in structures:
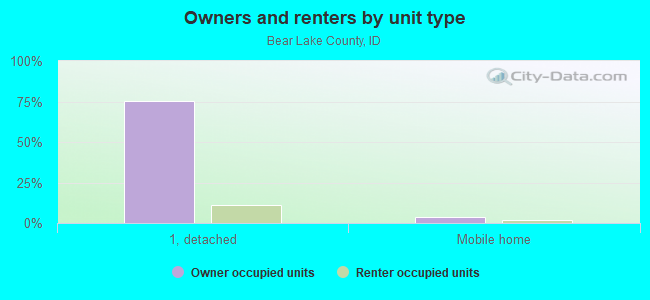
- One, detached: 3,702
- Two: 6
- 3 or 4: 78
- 5 to 9: 34
- 10 to 19: 9
- 20 or more: 62
- Mobile homes: 187
- Boats, RVs, vans, etc.: 26
Housing units in Bear Lake County with a mortgage: 1,110 (91 second mortgage, 0 home equity loan, 65 both second mortgage and home equity loan)
Houses without a mortgage: 57
| Here: | 1.7% with mortgage |
| State: | 97.4% with mortgage |
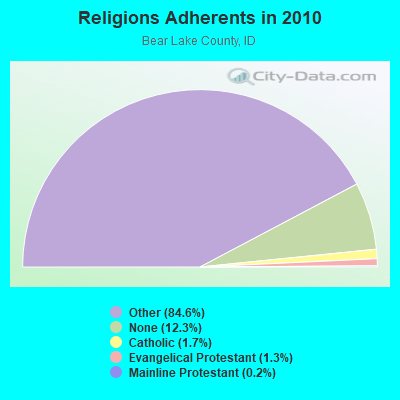
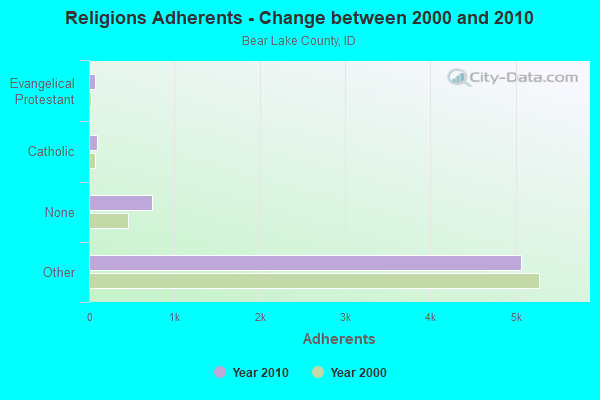
Religion statistics for Bear Lake County
| Religion | Adherents | Congregations |
|---|---|---|
| Other | 5,064 | 18 |
| Catholic | 99 | 1 |
| Evangelical Protestant | 75 | 2 |
| Mainline Protestant | 13 | 1 |
| None | 735 | - |
Source: Clifford Grammich, Kirk Hadaway, Richard Houseal, Dale E.Jones, Alexei Krindatch, Richie Stanley and Richard H.Taylor. 2012. 2010 U.S.Religion Census: Religious Congregations & Membership Study. Association of Statisticians of American Religious Bodies. Jones, Dale E., et al. 2002. Congregations and Membership in the United States 2000. Nashville, TN: Glenmary Research Center.
Food Environment Statistics:
| Bear Lake County: | 5.13 / 10,000 pop. |
| State: | 1.88 / 10,000 pop. |
| This county: | 3.42 / 10,000 pop. |
| Idaho: | 0.53 / 10,000 pop. |
| Bear Lake County: | 6.84 / 10,000 pop. |
| Idaho: | 3.87 / 10,000 pop. |
| This county: | 10.26 / 10,000 pop. |
| State: | 7.75 / 10,000 pop. |
| Bear Lake County: | 7.5% |
| Idaho: | 7.7% |
| Bear Lake County: | 24.6% |
| State: | 25.7% |
| Here: | 6.4% |
| State: | 11.7% |
Agriculture in Bear Lake County:
Average size of farms: 499 acresAverage value of agricultural products sold per farm: $30,544
Average value of crops sold per acre for harvested cropland: $49.67
The value of livestock, poultry, and their products as a percentage of the total market value of agricultural products sold: 74.60%
Average total farm production expenses per farm: $33,163
Harvested cropland as a percentage of land in farms: 31.31%
Irrigated harvested cropland as a percentage of land in farms: 57.15%
Average market value of all machinery and equipment per farm: $69,509
The percentage of farms operated by a family or individual: 93.16%
Average age of principal farm operators: 57 years
Average number of cattle and calves per 100 acres of all land in farms: 11.18
Milk cows as a percentage of all cattle and calves: 6.62%
All wheat for grain: 13289 harvested acres
Earthquake activity:
Bear Lake County-area historical earthquake activity is significantly above Idaho state average. It is 1797% greater than the overall U.S. average.On 8/18/1959 at 06:37:13, a magnitude 7.7 (7.7 UK, Class: Major, Intensity: VIII - XII) earthquake occurred 159.9 miles away from Bear Lake County center, causing $26,000,000 total damage
On 10/28/1983 at 14:06:06, a magnitude 7.3 (6.2 MB, 7.3 MS, 7.0 MW) earthquake occurred 173.8 miles away from the county center, causing 2 deaths (2 shaking deaths) and 3 injuries, causing $15,000,000 total damage
On 10/3/1915 at 06:52:48, a magnitude 7.6 (7.6 UK) earthquake occurred 342.6 miles away from the county center
On 3/28/1975 at 02:31:05, a magnitude 6.2 (6.1 MB, 6.0 MS, 6.2 ML, Class: Strong, Intensity: VII - IX) earthquake occurred 61.3 miles away from the county center
On 2/3/1994 at 09:05:04, a magnitude 5.8 (5.4 MB, 5.5 MS, 5.8 MW, 5.8 ML, Depth: 4.9 mi, Class: Moderate, Intensity: VI - VII) earthquake occurred 37.8 miles away from Bear Lake County center
On 3/31/2020 at 23:52:30, a magnitude 6.5 (6.5 MW, Depth: 7.5 mi) earthquake occurred 240.9 miles away from the county center
Magnitude types: body-wave magnitude (MB), local magnitude (ML), surface-wave magnitude (MS), moment magnitude (MW)
Most recent natural disasters:
- Idaho Covid-19 Pandemic, Incident Period: January 20, 2020, FEMA Id: 4534, Natural disaster type: Other
- Idaho Hurricane Katrina Evacuation, Incident Period: August 29, 2005 to October 01, 2005, Emergency Declared EM-3244: September 13, 2005, FEMA Id: 3244, Natural disaster type: Hurricane
- Idaho Drought, Incident Period: May 05, 1977, Emergency Declared EM-3040: May 05, 1977, FEMA Id: 3040, Natural disaster type: Drought
The number of natural disasters in Bear Lake County (3) is a lot smaller than the US average (15).
Emergencies Declared: 2
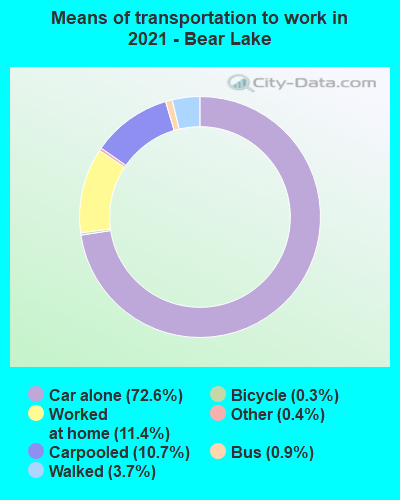
Means of transportation to work:
- Drove a car alone: 1,514 (70.5%)
- Carpooled: 223 (10.4%)
- Bus: 13 (0.6%)
- Taxicab, motorcycle, or other means: 11 (0.5%)
- Bicycle: 4 (0.2%)
- Walked: 60 (2.8%)
- Worked at home: 323 (15.0%)

- Health care and social assistance (25%)
- Educational services (16%)
- Retail trade (9%)
- Accommodation and food services (6%)
- Transportation and warehousing (5%)
- Professional, scientific, and technical services (4%)
- Public administration (3%)
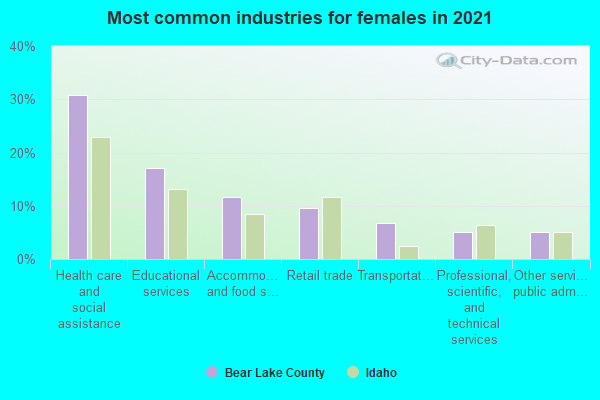
- Health care and social assistance (31%)
- Educational services (19%)
- Retail trade (11%)
- Accommodation and food services (8%)
- Transportation and warehousing (6%)
- Professional, scientific, and technical services (5%)
- Public administration (4%)
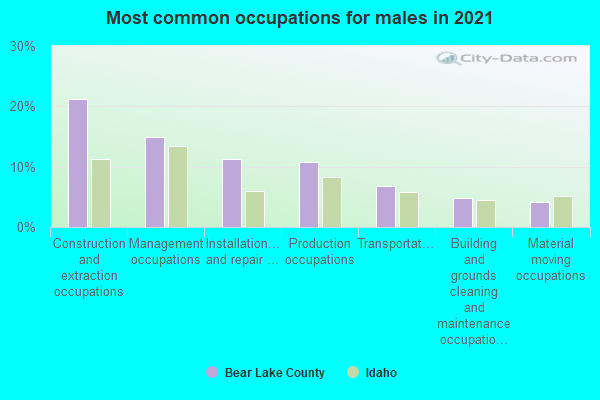
- Construction and extraction occupations (22%)
- Management occupations (16%)
- Transportation occupations (10%)
- Installation, maintenance, and repair occupations (8%)
- Production occupations (7%)
- Sales and related occupations (5%)
- Material moving occupations (4%)
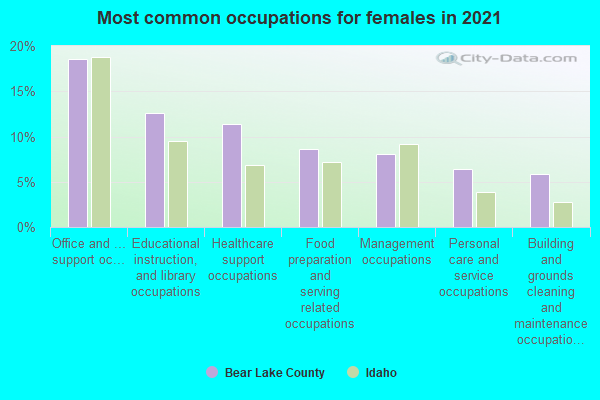
- Office and administrative support occupations (18%)
- Educational instruction, and library occupations (14%)
- Healthcare support occupations (10%)
- Management occupations (8%)
- Food preparation and serving related occupations (7%)
- Health diagnosing and treating practitioners and other technical occupations (7%)
- Personal care and service occupations (6%)
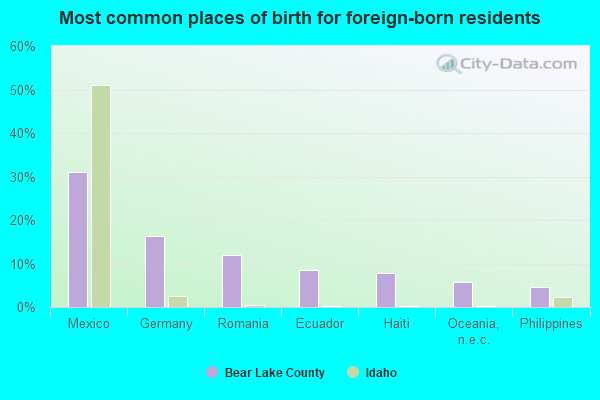
- Germany (19%)
- Mexico (12%)
- Canada (12%)
- Burma (Myanmar) (10%)
- Philippines (9%)
- Ecuador (8%)
- Romania (7%)
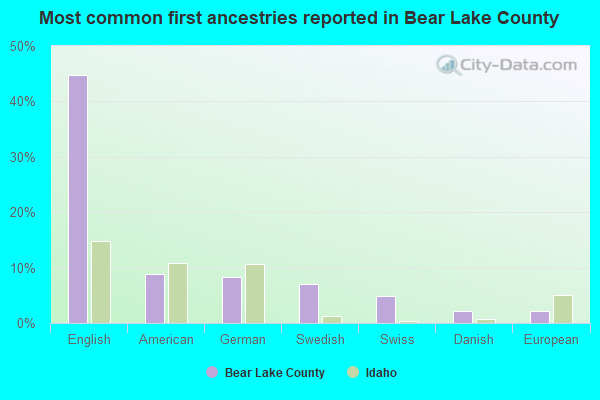
- English (46%)
- American (10%)
- German (8%)
- Swiss (5%)
- Swedish (4%)
- European (3%)
- Welsh (3%)
People in group quarters in Bear Lake County, Idaho in 2000:
- 33 people in nursing homes
- 21 people in other noninstitutional group quarters
- 2 people in local jails and other confinement facilities (including police lockups)
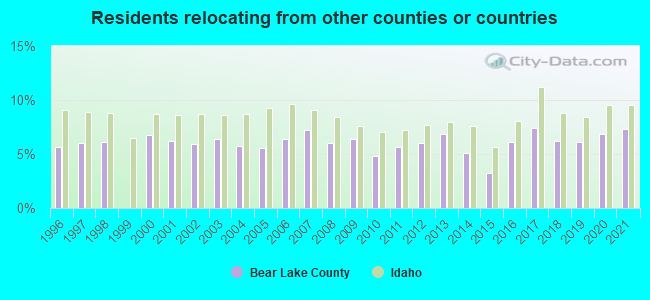
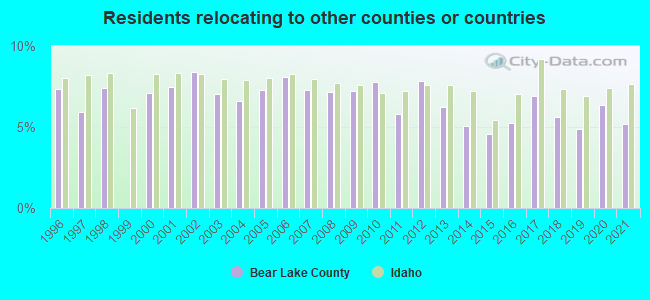
7.29% of this county's 2021 resident taxpayers lived in other counties in 2020 ($66,467 average adjusted gross income)
| Here: | 7.29% |
| Idaho average: | 9.53% |
10 or fewer of this county's residents moved from foreign countries.
2.10% relocated from other counties in Idaho ($17,054 average AGI)
5.20% relocated from other states ($49,413 average AGI)
Bear Lake County: 5.20% Idaho average: 5.98%
5.18% of this county's 2020 resident taxpayers moved to other counties in 2021 ($50,655 average adjusted gross income)
| Here: | 5.18% |
| Idaho average: | 7.66% |
10 or fewer of this county's residents moved to foreign countries.
1.79% relocated to other counties in Idaho ($18,655 average AGI)
3.39% relocated to other states ($32,009 average AGI)
Bear Lake County: 3.39% Idaho average: 4.04%
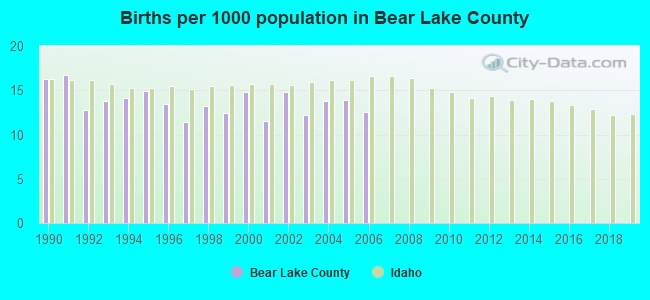
Births per 1000 population from 1990 to 1999: 13.9
Births per 1000 population from 2000 to 2006: 13.4
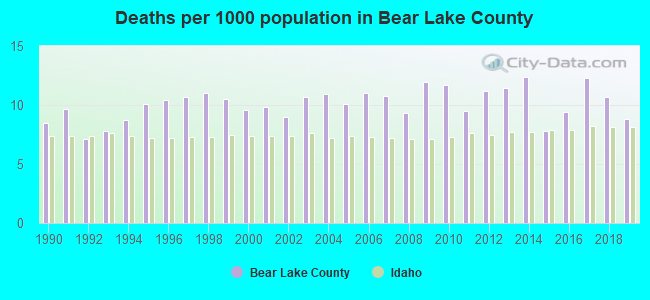
Deaths per 1000 population from 1990 to 1999: 9.4
Deaths per 1000 population from 2000 to 2009: 10.3
Deaths per 1000 population from 2010 to 2020: 10.7
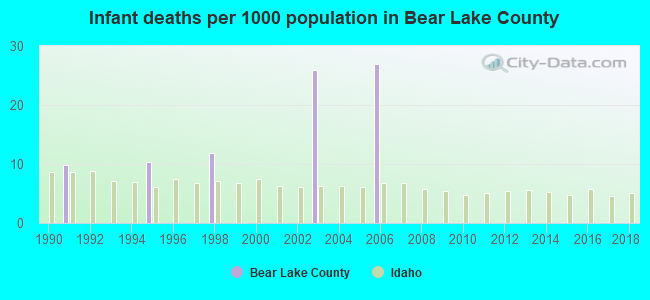
Infant deaths per 1000 live births from 1990 to 1999: 3.2
Infant deaths per 1000 live births from 2000 to 2006: 7.6
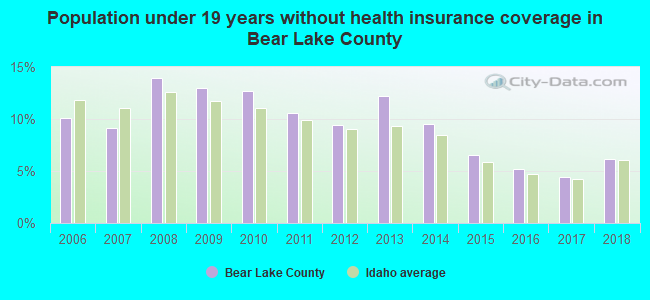
Persons under 19 years old without health insurance coverage in 2018: 6.2%

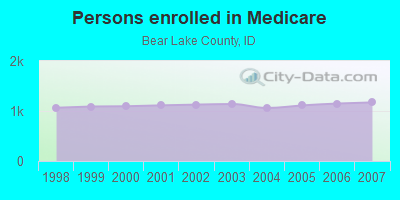
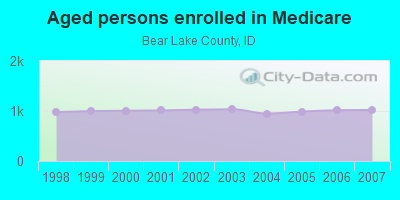
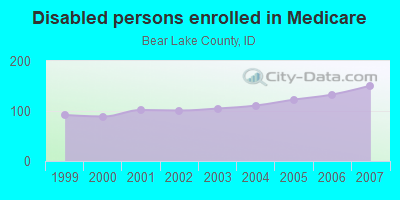
Persons enrolled in hospital insurance and/or supplemental medical insurance (Medicare) in July 1, 2007: 1,172 (1,021 aged, 151 disabled)
Children under 18 without health insurance coverage in 2007: 133 (8%)
Most common underlying causes of death in Bear Lake County, Idaho in 1999 - 2019:
- Acute myocardial infarction, unspecified (55)
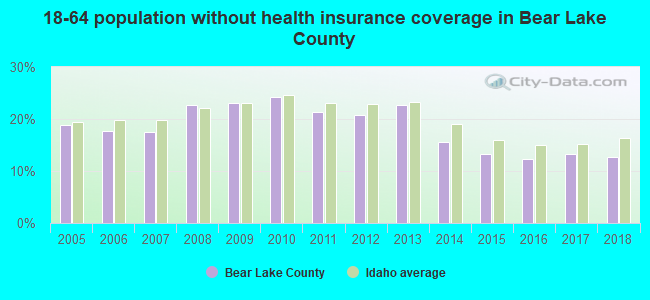
Population without health insurance coverage in 2000: 17%
Children under 18 without health insurance coverage in 2000: 17%
Short term general hospital admissions per 100,000 population in 2004: 7,591
Short term general hospital beds per 100,000 population in 2004: 1,297
Emergency room visits per 100,000 population in 2004: 58,738
General practice office based MDs per 100,000 population in 2005: 1,231
Medical specialist MDs per 100,000 population in 2005: 1,036
Total births per 100,000 population, July 2005 - July 2006 : 31
Total deaths per 100,000 population, July 2005 - July 2006: 113
Household type by relationship:
Households: 6,730- Male householders: 1,288 (359 living alone), Female householders: 1,175 (264 living alone)
1,583 spouses (1,583 opposite-sex spouses), 35 unmarried partners, (35 opposite-sex unmarried partners), 2,082 children (1,961 natural, 60 adopted, 57 stepchildren), 189 grandchildren, 29 brothers or sisters, 47 parents, 0 foster children, 83 other relatives, 147 non-relatives
- In group quarters: 63
Size of family households: 974 2-persons, 295 3-persons, 239 4-persons, 157 5-persons, 71 6-persons, 44 7-or-more-persons.
Size of nonfamily households: 627 1-person, 28 2-persons, 9 4-persons.
1,289 married couples with children.
264 single-parent households (86 men, 178 women).
96.0% of residents of Bear Lake speak English at home.
2.5% of residents speak Spanish at home (64% speak English very well, 33% speak English well, 3% don't speak English at all).
0.4% of residents speak other Indo-European language at home (88% speak English very well, 12% speak English not well).
0.8% of residents speak Asian or Pacific Island language at home (49% speak English very well, 51% speak English not well).
0.2% of residents speak other language at home (100% speak English very well).
In fiscal year 2004:
Federal Government expenditure: $36,345,000 ($5,748 per capita)
Department of Defense expenditure: $762,000
Federal direct payments to individuals for retirement and disability: $17,141,000
Federal other direct payments to individuals: $5,544,000
Federal direct payments not to individuals: $1,934,000
Federal grants: $8,873,000
Federal procurement contracts: $364,000 ($0,000 Department of Defense)
Federal salaries and wages: $2,490,000 ($0,000 Department of Defense)
Federal Government direct loans: $556,000
Federal guaranteed/insured loans: $3,943,000
Federal Government insurance: $547,000
Population change from April 1, 2000 to July 1, 2005:
Births: 432| Here: | 70 per 1000 residents |
| State: | 78 per 1000 residents |
Deaths: 329
| Here: | 53 per 1000 residents |
| State: | 37 per 1000 residents |
Net international migration: +4
| Here: | +1 per 1000 residents |
| State: | +10 per 1000 residents |
Net internal migration: -328
| Here: | |
| State: |
Total withdrawal of fresh water for public supply: 1.58 millions of gallons per day (all from ground)
| Here: | 6.4 |
| State: | 6.5 |
| Here: | 4.7 |
| State: | 4.4 |
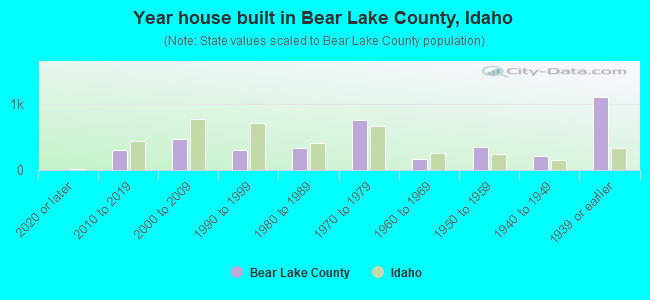
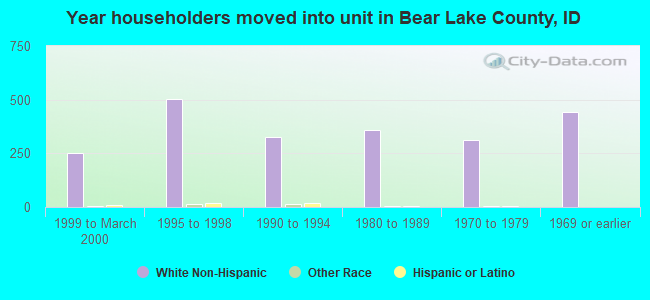
- Year house built in Bear Lake County, Idaho
- 02020 or later
- 3212010 to 2019
- 4422000 to 2009
- 3161990 to 1999
- 2821980 to 1989
- 6681970 to 1979
- 1891960 to 1969
- 4211950 to 1959
- 1541940 to 1949
- 1,1331939 or earlier

- Rooms in owner-occupied houses in Bear Lake County, Idaho
- 41 room
- 192 rooms
- 653 rooms
- 2154 rooms
- 3325 rooms
- 3916 rooms
- 2047 rooms
- 2608 rooms
- 5049+ rooms
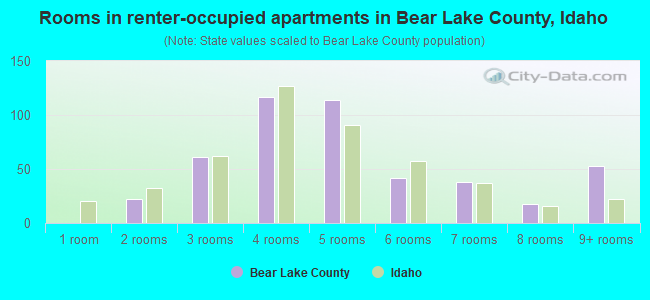
- Rooms in renter-occupied apartments in Bear Lake County, Idaho
- 01 room
- 192 rooms
- 823 rooms
- 1084 rooms
- 1215 rooms
- 176 rooms
- 357 rooms
- 238 rooms
- 619+ rooms

- Bedrooms in owner-occupied houses in Bear Lake County, Idaho
- 4no bedroom
- 711 bedroom
- 3942 bedrooms
- 7613 bedrooms
- 5194 bedrooms
- 2435+ bedrooms
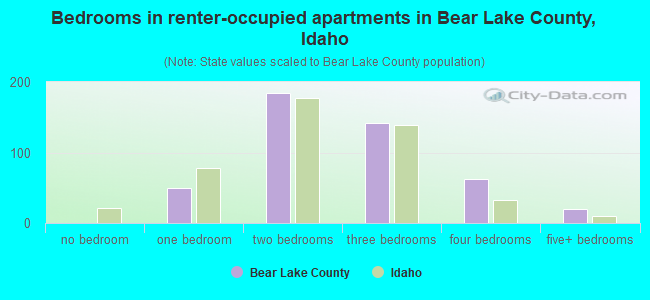
- Bedrooms in renter-occupied apartments in Bear Lake County, Idaho
- 0no bedroom
- 651 bedroom
- 1982 bedrooms
- 1263 bedrooms
- 684 bedrooms
- 155+ bedrooms
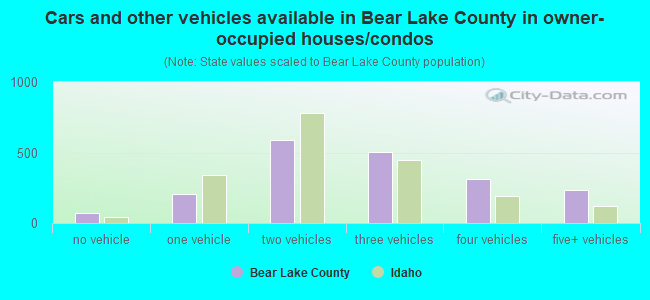
- Cars and other vehicles available in Bear Lake County in owner-occupied houses/condos
- 80no vehicle
- 2611 vehicle
- 6662 vehicles
- 5093 vehicles
- 2864 vehicles
- 1875+ vehicles
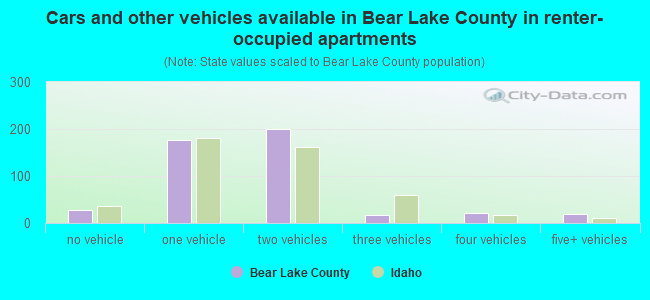
- Cars and other vehicles available in Bear Lake County in renter-occupied apartments
- 20no vehicle
- 2051 vehicle
- 1972 vehicles
- 143 vehicles
- 134 vehicles
- 175+ vehicles
90.0% of Bear Lake County residents lived in the same house 1 years ago.
Out of people who lived in different houses, 29% lived in this county.
Out of people who lived in different counties, 34% lived in Idaho.
| Bear Lake County: | 90.0% |
| State average: | 85.1% |
Place of birth for U.S.-born residents:
- This state: 3,923
- Other state: 2,556
- Northeast: 36
- Midwest: 210
- South: 187
- West: 2,142
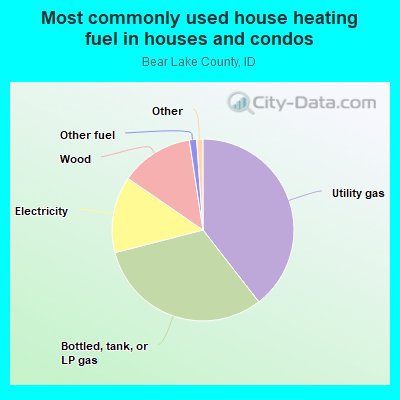
- 41.4%Utility gas
- 28.6%Bottled, tank, or LP gas
- 13.6%Wood
- 13.1%Electricity
- 1.5%Other fuel
- 0.9%Fuel oil, kerosene, etc.
- 0.9%Coal or coke
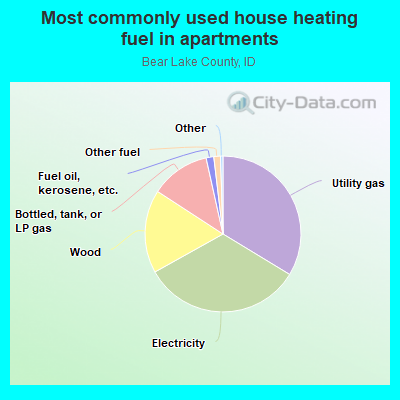
- 34.0%Utility gas
- 33.1%Electricity
- 16.7%Bottled, tank, or LP gas
- 15.1%Wood
- 1.1%Other fuel
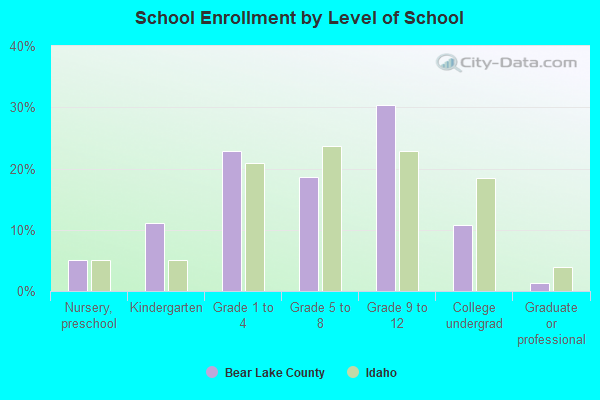
Private vs. public school enrollment:
| Here: | 10.9% |
| Idaho: | 13.5% |
| Here: | 3.2% |
| Idaho: | 8.5% |
| Here: | 29.8% |
| Idaho: | 30.0% |


Bear Lake County government finances - Expenditure in 2018:
- Charges - Solid Waste Management: $429,000
Other: $244,000
Hospital Public: $28,000
Air Transportation: $14,000
Parks and Recreation: $1,000
- Construction - Regular Highways: $1,002,000
- Current Operations - Police Protection: $870,000
Correctional Institutions: $510,000
Solid Waste Management: $487,000
Financial Administration: $350,000
Judicial and Legal Services: $335,000
Corrections - Other: $323,000
Regular Highways: $274,000
Central Staff Services: $268,000
General Public Buildings: $194,000
Health - Other: $184,000
Local Fire Protection: $132,000
Air Transportation: $76,000
General - Other: $50,000
Natural Resources - Other: $35,000
Public Welfare, Vendor Payments for Medical Care: $25,000
Parks and Recreation: $15,000
- Federal Intergovernmental - Highways: $206,000
General Local Government Support: $110,000
- Local Intergovernmental - General Local Government Support: $258,000
Other: $141,000
- Long Term Debt - Retired Unspecified Public Purpose: $11,000
Beginning Outstanding - Unspecified Public Purpose: $11,000
- Miscellaneous - General Revenue - Other: $98,000
Fines and Forfeits: $62,000
Interest Earnings: $47,000
Sale of Property: $25,000
Rents: $22,000
- Other Capital Outlay - Police Protection: $16,000
- Other Funds - Cash and Securities: $2,376,000
- State Intergovernmental - Highways: $692,000
General Local Government Support: $624,000
Other: $99,000
- Tax - Property: $2,089,000
Public Utilities Sales: $79,000
Motor Vehicle License: $67,000
Alcoholic Beverage License: $5,000
- Total Salaries and Wages: $2,642,000
Bear Lake County government finances - Revenue in 2018:
- Charges - Solid Waste Management: $429,000
Other: $244,000
Hospital Public: $28,000
Air Transportation: $14,000
Parks and Recreation: $1,000
- Construction - Regular Highways: $1,002,000
- Current Operations - Police Protection: $870,000
Correctional Institutions: $510,000
Solid Waste Management: $487,000
Financial Administration: $350,000
Judicial and Legal Services: $335,000
Corrections - Other: $323,000
Regular Highways: $274,000
Central Staff Services: $268,000
General Public Buildings: $194,000
Health - Other: $184,000
Local Fire Protection: $132,000
Air Transportation: $76,000
General - Other: $50,000
Natural Resources - Other: $35,000
Public Welfare, Vendor Payments for Medical Care: $25,000
Parks and Recreation: $15,000
- Federal Intergovernmental - Highways: $206,000
General Local Government Support: $110,000
- Local Intergovernmental - General Local Government Support: $258,000
Other: $141,000
- Long Term Debt - Retired Unspecified Public Purpose: $11,000
Beginning Outstanding - Unspecified Public Purpose: $11,000
- Miscellaneous - General Revenue - Other: $98,000
Fines and Forfeits: $62,000
Interest Earnings: $47,000
Sale of Property: $25,000
Rents: $22,000
- Other Capital Outlay - Police Protection: $16,000
- Other Funds - Cash and Securities: $2,376,000
- State Intergovernmental - Highways: $692,000
General Local Government Support: $624,000
Other: $99,000
- Tax - Property: $2,089,000
Public Utilities Sales: $79,000
Motor Vehicle License: $67,000
Alcoholic Beverage License: $5,000
- Total Salaries and Wages: $2,642,000
Bear Lake County government finances - Debt in 2018:
- Charges - Solid Waste Management: $429,000
Other: $244,000
Hospital Public: $28,000
Air Transportation: $14,000
Parks and Recreation: $1,000
- Construction - Regular Highways: $1,002,000
- Current Operations - Police Protection: $870,000
Correctional Institutions: $510,000
Solid Waste Management: $487,000
Financial Administration: $350,000
Judicial and Legal Services: $335,000
Corrections - Other: $323,000
Regular Highways: $274,000
Central Staff Services: $268,000
General Public Buildings: $194,000
Health - Other: $184,000
Local Fire Protection: $132,000
Air Transportation: $76,000
General - Other: $50,000
Natural Resources - Other: $35,000
Public Welfare, Vendor Payments for Medical Care: $25,000
Parks and Recreation: $15,000
- Federal Intergovernmental - Highways: $206,000
General Local Government Support: $110,000
- Local Intergovernmental - General Local Government Support: $258,000
Other: $141,000
- Long Term Debt - Retired Unspecified Public Purpose: $11,000
Beginning Outstanding - Unspecified Public Purpose: $11,000
- Miscellaneous - General Revenue - Other: $98,000
Fines and Forfeits: $62,000
Interest Earnings: $47,000
Sale of Property: $25,000
Rents: $22,000
- Other Capital Outlay - Police Protection: $16,000
- Other Funds - Cash and Securities: $2,376,000
- State Intergovernmental - Highways: $692,000
General Local Government Support: $624,000
Other: $99,000
- Tax - Property: $2,089,000
Public Utilities Sales: $79,000
Motor Vehicle License: $67,000
Alcoholic Beverage License: $5,000
- Total Salaries and Wages: $2,642,000
Bear Lake County government finances - Cash and Securities in 2018:
- Charges - Solid Waste Management: $429,000
Other: $244,000
Hospital Public: $28,000
Air Transportation: $14,000
Parks and Recreation: $1,000
- Construction - Regular Highways: $1,002,000
- Current Operations - Police Protection: $870,000
Correctional Institutions: $510,000
Solid Waste Management: $487,000
Financial Administration: $350,000
Judicial and Legal Services: $335,000
Corrections - Other: $323,000
Regular Highways: $274,000
Central Staff Services: $268,000
General Public Buildings: $194,000
Health - Other: $184,000
Local Fire Protection: $132,000
Air Transportation: $76,000
General - Other: $50,000
Natural Resources - Other: $35,000
Public Welfare, Vendor Payments for Medical Care: $25,000
Parks and Recreation: $15,000
- Federal Intergovernmental - Highways: $206,000
General Local Government Support: $110,000
- Local Intergovernmental - General Local Government Support: $258,000
Other: $141,000
- Long Term Debt - Retired Unspecified Public Purpose: $11,000
Beginning Outstanding - Unspecified Public Purpose: $11,000
- Miscellaneous - General Revenue - Other: $98,000
Fines and Forfeits: $62,000
Interest Earnings: $47,000
Sale of Property: $25,000
Rents: $22,000
- Other Capital Outlay - Police Protection: $16,000
- Other Funds - Cash and Securities: $2,376,000
- State Intergovernmental - Highways: $692,000
General Local Government Support: $624,000
Other: $99,000
- Tax - Property: $2,089,000
Public Utilities Sales: $79,000
Motor Vehicle License: $67,000
Alcoholic Beverage License: $5,000
- Total Salaries and Wages: $2,642,000
Supplemental Security Income (SSI) in 2006:
- Total number of recipients: 108
- Number of aged recipients: 14
- Number of blind and disabled recipients: 94
- Number of recipients under 18: 26
- Number of recipients between 18 and 64: 63
- Number of recipients older than 64: 19
- Number of recipients also receiving OASDI: 31
- Amount of payments (thousands of dollars): 44
| Most common first names in Bear Lake County, ID among deceased individuals | ||
| Name | Count | Lived (average) |
|---|---|---|
| William | 26 | 76.3 years |
| John | 21 | 82.5 years |
| George | 18 | 74.5 years |
| James | 17 | 75.0 years |
| Robert | 17 | 72.1 years |
| Charles | 16 | 75.9 years |
| Mary | 14 | 81.7 years |
| Ruth | 13 | 78.5 years |
| Joseph | 12 | 78.1 years |
| Raymond | 10 | 73.5 years |
| Most common last names in Bear Lake County, ID among deceased individuals | ||
| Last name | Count | Lived (average) |
|---|---|---|
| Smith | 25 | 77.5 years |
| Kunz | 20 | 76.6 years |
| Lewis | 17 | 80.7 years |
| Jensen | 16 | 82.4 years |
| Rich | 15 | 82.9 years |
| Nelson | 15 | 79.7 years |
| Eborn | 15 | 74.5 years |
| Peterson | 15 | 67.8 years |
| Hymas | 14 | 80.3 years |
| Bartschi | 14 | 76.6 years |
| Businesses in Bear Lake County, ID | ||||
| Name | Count | Name | Count | |
|---|---|---|---|---|
| AT&T | 1 | Subway | 1 | |
| Alco Stores | 1 | Super 8 | 1 | |
| FedEx | 1 | T-Mobile | 1 | |
| Ford | 1 | True Value | 1 | |
| RadioShack | 1 | U-Haul | 1 | |
Bear Lake County on our top lists:
- #37 on the list of "Top 101 counties with highest percentage of residents voting for Romney (Republican) in the 2012 Presidential Election"