Tucumcari, New Mexico
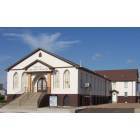
Tucumcari: Trinity Baptist Church
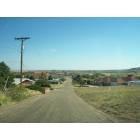
Tucumcari: Tucumcari neighborhood
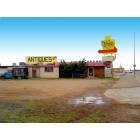
Tucumcari: Unique antique store in Tucumcari
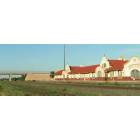
Tucumcari: The only original Spanish architecture Train Depot in New Mexico

Tucumcari: Rainbow Just Outside of Town
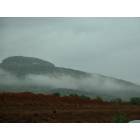
Tucumcari: Tucumcari Mountain
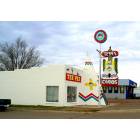
Tucumcari: Old Route 66 curio shop still in business.
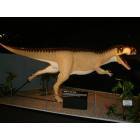
Tucumcari: The Dinosaur Museum

Tucumcari: The Dinosaur Museum
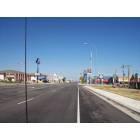
Tucumcari: just off the interstate
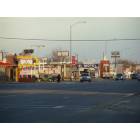
Tucumcari: Tucumcari Blvd.

Tucumcari: RT .66 TUCUMCARI, NEW MEXICO U.S.A.
- add
your
Submit your own pictures of this city and show them to the world
- OSM Map
- General Map
- Google Map
- MSN Map
Population change since 2000: -14.0%
 |
| Males: 2,576 | |
| Females: 2,573 |
| Median resident age: | 40.3 years |
| New Mexico median age: | 39.4 years |
Zip codes: 88401.
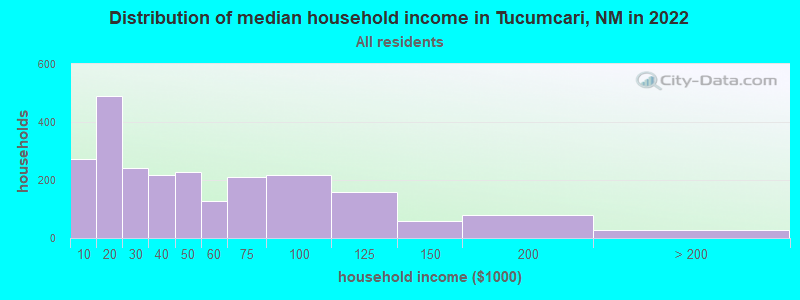
| Tucumcari: | $35,013 |
| NM: | $59,726 |
Estimated per capita income in 2022: $24,107 (it was $14,786 in 2000)
Tucumcari city income, earnings, and wages data
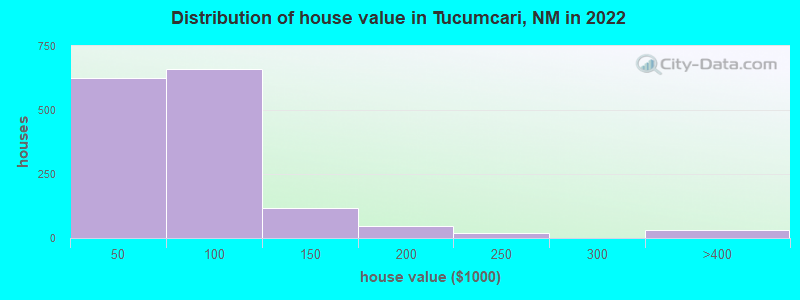
Estimated median house or condo value in 2022: $60,775 (it was $45,800 in 2000)
| Tucumcari: | $60,775 |
| NM: | $243,100 |
Median gross rent in 2022: $664.
(21.9% for White Non-Hispanic residents, 8.8% for Black residents, 33.5% for Hispanic or Latino residents, 19.4% for American Indian residents, 58.2% for other race residents, 36.0% for two or more races residents)
Detailed information about poverty and poor residents in Tucumcari, NM

Compare current foreclosures near your location:
| Photo | Address | Area | Beds / Baths | Price | Details |
|---|---|---|---|---|---|

|
#1
Bayberry Cir
Columbus, OH 43207
|
1,564 sq. feet
|
1 baths 3 beds |
$127,500
|
show details |

|
#2
S High St
Columbus, OH 43207
|
1,678 sq. feet
|
2 baths 4 beds |
$31,900
|
show details |

|
#3
E 21st Ave
Columbus, OH 43211
|
1,061 sq. feet
|
1 baths 3 beds |
$179,900
|
show details |

|
#4
Roundelay Rd N
Reynoldsburg, OH 43068
|
1,712 sq. feet
|
2 baths 3 beds |
show details | |

|
#5
E Howard Rd
Columbus, OH 43207
|
1,056 sq. feet
|
1 baths 3 beds |
show details | |

|
#6
London Groveport Rd
Grove City, OH 43123
|
816 sq. feet
|
1 baths 2 beds |
show details | |

|
#7
Chidley St
Galloway, OH 43119
|
1,502 sq. feet
|
1 baths 3 beds |
show details | |

|
#8
Summertree Ln
Westerville, OH 43081
|
2,496 sq. feet
|
2 baths 3 beds |
show details | |

|
#9
E Lincoln Ave
Columbus, OH 43214
|
874 sq. feet
|
1 baths 3 beds |
show details | |

|
#10
Fergus Rd
Grove City, OH 43123
|
3,312 sq. feet
|
2 baths 4 beds |
show details |
| Photo | Address | Area | Beds / Baths | Price | Details |
|---|---|---|---|---|---|

|
#11
Rosewood Ct
Powell, OH 43065
|
2,801 sq. feet
|
3 baths 4 beds |
show details | |

|
#12
Armada Rd
Columbus, OH 43232
|
1,028 sq. feet
|
1 baths 4 beds |
show details | |

|
#13
N Roys Ave
Columbus, OH 43204
|
1,248 sq. feet
|
2 baths 3 beds |
show details | |

|
#14
N Roys Ave
Columbus, OH 43204
|
648 sq. feet
|
2 baths 3 beds |
show details | |

|
#15
S Richardson Ave
Columbus, OH 43204
|
1,520 sq. feet
|
2 baths 3 beds |
show details | |

|
#16
Meadowbrook Dr
Columbus, OH 43207
|
1,752 sq. feet
|
2 baths 4 beds |
show details | |

|
#17
Executive Ct
Westerville, OH 43081
|
1,811 sq. feet
|
2 baths 3 beds |
show details | |

|
#18
High Free Pike
West Jefferson, OH 43162
|
1,216 sq. feet
|
2 baths 4 beds |
show details | |

|
#19
Falls Peak Ln
Delaware, OH 43015
|
1,352 sq. feet
|
2 baths 2 beds |
show details | |

|
#20
Ashgrove Dr
Grove City, OH 43123
|
1,772 sq. feet
|
2 baths 4 beds |
show details |
| Photo | Address | Area | Beds / Baths | Price | Details |
|---|---|---|---|---|---|

|
#21
Lehner Rd
Columbus, OH 43224
|
1,628 sq. feet
|
2 baths 4 beds |
show details | |

|
#22
Grasmere Ave
Columbus, OH 43211
|
720 sq. feet
|
1 baths 2 beds |
show details | |

|
#23
E Welch Ave
Columbus, OH 43207
|
1,864 sq. feet
|
2 baths 4 beds |
show details | |

|
#24
Wrexham Ave
Columbus, OH 43223
|
1,235 sq. feet
|
1 baths 3 beds |
show details | |

|
#25
Kelton Ave
Columbus, OH 43206
|
1,080 sq. feet
|
1 baths 3 beds |
show details | |

|
#26
Hamilton Ave
Columbus, OH 43211
|
1,061 sq. feet
|
1 baths 3 beds |
show details | |

|
#27
Striebel Ct
Columbus, OH 43227
|
925 sq. feet
|
1 baths 3 beds |
show details | |

|
#28
S Champion Ave
Columbus, OH 43207
|
1,157 sq. feet
|
1 baths 2 beds |
show details | |

|
#29
Fairfield Ave
Columbus, OH 43203
|
984 sq. feet
|
1 baths 2 beds |
show details | |

|
#30
N 18th St
Columbus, OH 43203
|
1,690 sq. feet
|
1 baths 4 beds |
show details |
| Photo | Address | Area | Beds / Baths | Price | Details |
|---|---|---|---|---|---|

|
#31
Cannonade Ct
Columbus, OH 43230
|
2,023 sq. feet
|
2 baths 3 beds |
show details | |

|
#32
Glenmate Ct
Columbus, OH 43223
|
1,050 sq. feet
|
1 baths 3 beds |
show details | |

|
#33
Safford Ave
Columbus, OH 43223
|
784 sq. feet
|
1 baths 2 beds |
show details | |

|
#34
Chester Rd
Columbus, OH 43221
|
3,300 sq. feet
|
4 baths 5 beds |
show details | |

|
#35
Upton Rd E
Columbus, OH 43232
|
852 sq. feet
|
1 baths 3 beds |
show details | |

|
#36
Whittman Ct
Plain City, OH 43064
|
3,186 sq. feet
|
3 baths 4 beds |
show details | |

|
#37
Hildreth Ave
Columbus, OH 43203
|
1,798 sq. feet
|
2 baths 4 beds |
show details | |

|
#38
Gladys Rd
Columbus, OH 43228
|
832 sq. feet
|
1 baths 3 beds |
show details | |

|
#39
Mccutcheon Rd
Columbus, OH 43219
|
2,130 sq. feet
|
2 baths 3 beds |
show details | |

|
#40
Hedgerow Rd
Columbus, OH 43220
|
1,102 sq. feet
|
2 baths 2 beds |
show details |
| Photo | Address | Area | Beds / Baths | Price | Details |
|---|---|---|---|---|---|

|
#41
Stephen St
Grove City, OH 43123
|
1,027 sq. feet
|
1 baths 3 beds |
show details | |

|
#42
Messner Dr
Hilliard, OH 43026
|
832 sq. feet
|
1 baths 2 beds |
show details | |

|
#43
Falene Pl
Galloway, OH 43119
|
1,178 sq. feet
|
1 baths 3 beds |
show details | |

|
#44
Autumn Wind Dr
Grove City, OH 43123
|
1,697 sq. feet
|
2 baths 3 beds |
show details | |

|
#45
Wesson Dr
Columbus, OH 43232
|
1,200 sq. feet
|
1 baths 3 beds |
show details | |

|
#46
Stoneybrook B 21a
Hilliard, OH 43026
|
1,031 sq. feet
|
1 baths 3 beds |
show details | |

|
#47
Almont Dr
Columbus, OH 43229
|
1,563 sq. feet
|
2 baths 5 beds |
show details | |

|
#48
Windy Hill Ln
Galloway, OH 43119
|
1,350 sq. feet
|
2 baths 3 beds |
show details | |

|
#49
Conway Dr
Columbus, OH 43227
|
1,225 sq. feet
|
1 baths 3 beds |
show details | |

|
Check over 1 million property listings on Foreclosure.com!
|
browse all offers | |||


- 3,39665.2%Hispanic
- 1,52029.2%White alone
- 1563.0%Two or more races
- 1502.9%Black alone
- 20.04%American Indian alone

Races in Tucumcari detailed stats: ancestries, foreign born residents, place of birth
According to our research of New Mexico and other state lists, there were 17 registered sex offenders living in Tucumcari, New Mexico as of May 23, 2024.
The ratio of all residents to sex offenders in Tucumcari is 299 to 1.
Type |
2009 |
2010 |
2011 |
2012 |
2013 |
2014 |
2015 |
2016 |
2020 |
2021 |
2022 |
|---|---|---|---|---|---|---|---|---|---|---|---|
| Murders (per 100,000) | 1 (19.2) | 0 (0.0) | 2 (36.9) | 0 (0.0) | 0 (0.0) | 0 (0.0) | 0 (0.0) | 0 (0.0) | 0 (0.0) | 0 (0.0) | 0 (0.0) |
| Rapes (per 100,000) | 3 (57.7) | 5 (93.2) | 0 (0.0) | 2 (37.3) | 3 (58.3) | 2 (39.2) | 0 (0.0) | 1 (20.2) | 2 (41.6) | 1 (20.9) | 0 (0.0) |
| Robberies (per 100,000) | 4 (77.0) | 2 (37.3) | 2 (36.9) | 4 (74.6) | 5 (97.1) | 5 (98.0) | 1 (20.1) | 1 (20.2) | 0 (0.0) | 0 (0.0) | 0 (0.0) |
| Assaults (per 100,000) | 66 (1,270) | 38 (708.6) | 31 (571.6) | 16 (298.3) | 18 (349.6) | 29 (568.6) | 14 (281.4) | 6 (121.0) | 0 (0.0) | 2 (41.9) | 0 (0.0) |
| Burglaries (per 100,000) | 147 (2,828) | 136 (2,536) | 159 (2,932) | 87 (1,622) | 95 (1,845) | 51 (1,000) | 41 (824.1) | 13 (262.2) | 15 (311.7) | 18 (377.0) | 16 (310.0) |
| Thefts (per 100,000) | 191 (3,674) | 142 (2,648) | 125 (2,305) | 105 (1,958) | 136 (2,641) | 103 (2,020) | 86 (1,729) | 32 (645.4) | 49 (1,018) | 39 (816.8) | 31 (600.5) |
| Auto thefts (per 100,000) | 8 (153.9) | 4 (74.6) | 5 (92.2) | 5 (93.2) | 4 (77.7) | 4 (78.4) | 2 (40.2) | 0 (0.0) | 7 (145.4) | 8 (167.5) | 3 (58.1) |
| Arson (per 100,000) | 0 (0.0) | 0 (0.0) | 0 (0.0) | 0 (0.0) | 0 (0.0) | 0 (0.0) | 0 (0.0) | 0 (0.0) | 0 (0.0) | 1 (20.9) | 1 (19.4) |
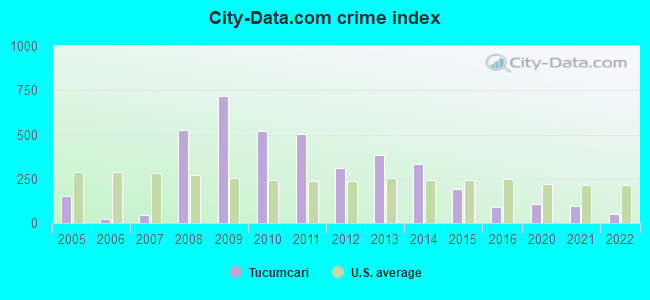
| City-Data.com crime index | 718.9 | 516.9 | 504.0 | 311.2 | 386.7 | 331.6 | 192.4 | 90.6 | 107.4 | 97.6 | 50.4 |
The City-Data.com crime index weighs serious crimes and violent crimes more heavily. Higher means more crime, U.S. average is 246.1. It adjusts for the number of visitors and daily workers commuting into cities.
Crime rate in Tucumcari detailed stats: murders, rapes, robberies, assaults, burglaries, thefts, arson
Full-time law enforcement employees in 2021, including police officers: 14 (12 officers - 12 male; 0 female).
| Officers per 1,000 residents here: | 2.51 |
| New Mexico average: | 1.93 |
 Recent articles from our blog. Our writers, many of them Ph.D. graduates or candidates, create easy-to-read articles on a wide variety of topics.

 | Is March a nice time to visit? (61 replies) |
| New Mexico to end tax on Social Security income (26 replies) |
| Tucumcari in 2016 (25 replies) |
| Fedex SmartPost packages being scanned in Tucumcari? (1 reply) |
| NM Route 66 in a 56-Year Old 356: what are your Route 66 “must see” spots in New Mexico? (10 replies) |
| Affordable lakefront home (23 replies) |
Latest news from Tucumcari, NM collected exclusively by city-data.com from local newspapers, TV, and radio stations
Ancestries: American (4.7%), German (3.6%), Irish (2.7%), English (2.5%), French (1.7%).
Current Local Time: MST time zone
Elevation: 4086 feet
Land area: 7.54 square miles.
Population density: 682 people per square mile (low).
105 residents are foreign born (1.3% Latin America, 0.7% Asia).
| This city: | 2.0% |
| New Mexico: | 9.2% |
Median real estate property taxes paid for housing units with mortgages in 2022: $503 (0.9%)
Median real estate property taxes paid for housing units with no mortgage in 2022: $410 (0.6%)
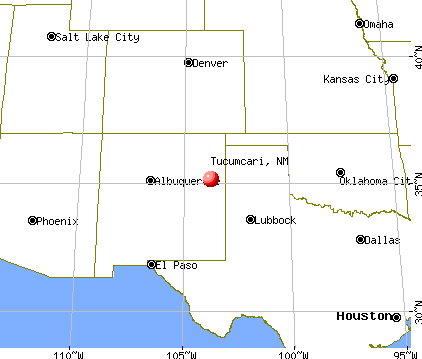
Nearest city with pop. 50,000+: Amarillo, TX  (106.3 miles , pop. 173,627).
Nearest city with pop. 200,000+: Albuquerque, NM (163.2 miles , pop. 448,607).
Nearest city with pop. 1,000,000+: Dallas, TX (430.2 miles , pop. 1,188,580).
Nearest cities:
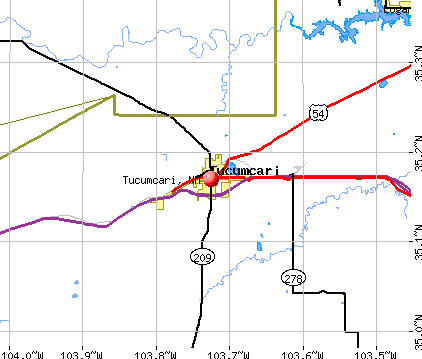
), Latitude: 35.17 N, Longitude: 103.73 W
Daytime population change due to commuting: -133 (-2.6%)
Workers who live and work in this city: 2,028 (82.7%)
Area code: 505

Tucumcari, New Mexico accommodation & food services, waste management - Economy and Business Data
| Here: | 4.1% |
| New Mexico: | 3.6% |


- Accommodation & food services (14.6%)
- Educational services (13.6%)
- Health care (7.4%)
- Public administration (7.1%)
- Construction (6.9%)
- Social assistance (5.6%)
- Gasoline stations (4.0%)

- Construction (13.8%)
- Educational services (9.1%)
- Accommodation & food services (9.0%)
- Truck transportation (7.5%)
- Agriculture, forestry, fishing & hunting (6.8%)
- Public administration (5.7%)
- Motor vehicle & parts dealers (5.3%)

- Accommodation & food services (20.1%)
- Educational services (18.1%)
- Health care (13.3%)
- Public administration (8.5%)
- Social assistance (6.8%)
- Department & other general merchandise stores (4.1%)
- Finance & insurance (4.1%)

- Other management occupations, except farmers and farm managers (7.7%)
- Driver/sales workers and truck drivers (5.4%)
- Other sales and related occupations, including supervisors (5.4%)
- Preschool, kindergarten, elementary, and middle school teachers (4.7%)
- Building and grounds cleaning and maintenance occupations (4.6%)
- Cooks and food preparation workers (4.4%)
- Information and record clerks, except customer service representatives (3.7%)

- Driver/sales workers and truck drivers (10.2%)
- Other management occupations, except farmers and farm managers (7.1%)
- Material recording, scheduling, dispatching, and distributing workers (5.6%)
- Vehicle and mobile equipment mechanics, installers, and repairers (5.5%)
- Other sales and related occupations, including supervisors (5.1%)
- Building and grounds cleaning and maintenance occupations (5.0%)
- Electrical equipment mechanics and other installation, maintenance, and repair workers, including supervisors (4.4%)

- Other management occupations, except farmers and farm managers (8.2%)
- Preschool, kindergarten, elementary, and middle school teachers (7.8%)
- Information and record clerks, except customer service representatives (6.5%)
- Cooks and food preparation workers (6.3%)
- Cashiers (6.1%)
- Other sales and related occupations, including supervisors (5.6%)
- Waiters and waitresses (5.6%)
Average climate in Tucumcari, New Mexico
Based on data reported by over 4,000 weather stations


|
|

Tornado activity:
Tucumcari-area historical tornado activity is significantly above New Mexico state average. It is 66% smaller than the overall U.S. average.
On 7/12/1963, a category F2 (max. wind speeds 113-157 mph) tornado 9.1 miles away from the Tucumcari city center caused between $5000 and $50,000 in damages.
On 6/3/1961, a category F2 tornado 12.9 miles away from the city center injured one person and caused between $5000 and $50,000 in damages.
Earthquake activity:
Tucumcari-area historical earthquake activity is significantly above New Mexico state average. It is 509% greater than the overall U.S. average.On 8/23/2011 at 05:46:18, a magnitude 5.3 (5.3 MW, Depth: 2.5 mi, Class: Moderate, Intensity: VI - VII) earthquake occurred 141.9 miles away from the city center
On 8/10/2005 at 22:08:22, a magnitude 5.0 (5.0 MB, 4.7 MS, 5.0 MW) earthquake occurred 134.4 miles away from the city center
On 8/10/2005 at 22:08:22, a magnitude 5.0 (5.0 MW, Depth: 3.1 mi) earthquake occurred 137.7 miles away from Tucumcari center
On 6/16/1978 at 11:46:54, a magnitude 5.3 (4.4 MB, 4.6 UK, 5.3 ML) earthquake occurred 225.0 miles away from the city center
On 8/22/2011 at 23:30:19, a magnitude 4.7 (4.7 MW, Depth: 3.1 mi, Class: Light, Intensity: IV - V) earthquake occurred 136.9 miles away from the city center
On 1/2/1992 at 11:45:35, a magnitude 5.0 (4.6 MB, 5.0 LG, Depth: 3.1 mi) earthquake occurred 199.3 miles away from the city center
Magnitude types: regional Lg-wave magnitude (LG), body-wave magnitude (MB), local magnitude (ML), surface-wave magnitude (MS), moment magnitude (MW)
Natural disasters:
The number of natural disasters in Quay County (6) is a lot smaller than the US average (15).Major Disasters (Presidential) Declared: 2
Emergencies Declared: 3
Causes of natural disasters: Drought: 1, Fire: 1, Hurricane: 1, Storm: 1, Tornado: 1, Winter Storm: 1, Other: 1 (Note: some incidents may be assigned to more than one category).
Hospitals and medical centers in Tucumcari:
Airports located in Tucumcari:
- Tucumcari Municipal Airport (TCC) (Runways: 2, Air Taxi Ops: 600, Itinerant Ops: 20,000, Local Ops: 4,400, Military Ops: 600)
College/University in Tucumcari:
Colleges/universities with over 2000 students nearest to Tucumcari:
- Eastern New Mexico University-Main Campus (about 72 miles; Portales, NM; Full-time enrollment: 4,263)
- New Mexico Highlands University (about 90 miles; Las Vegas, NM; FT enrollment: 2,931)
- West Texas A & M University (about 104 miles; Canyon, TX; FT enrollment: 6,820)
- Amarillo College (about 107 miles; Amarillo, TX; FT enrollment: 6,622)
- Santa Fe Community College (about 132 miles; Santa Fe, NM; FT enrollment: 3,047)
- Wayland Baptist University (about 133 miles; Plainview, TX; FT enrollment: 5,526)
- South Plains College (about 135 miles; Levelland, TX; FT enrollment: 7,007)
Public high school in Tucumcari:
- TUCUMCARI HIGH (Students: 304, Location: 1100 SOUTH 7TH ST, Grades: 9-12)
Public elementary/middle schools in Tucumcari:
- TUCUMCARI MIDDLE (Students: 245, Location: 914 SOUTH 4TH ST, Grades: 6-8)
- TUCUMCARI ELEMENTARY (Location: 1701 SOUTH 9TH ST, Grades: PK-5)
User-submitted facts and corrections:
- The following need to be changed. Thank you! College/University in Tucumcari: · MESALANDS COMMUNITY COLLEGE (Full-time enrollment: 267; Location: 911 S TENTH ST; Public; Website: www.mesalands.edu) Public high schools in Tucumcari: · TUCUMCARI HIGH (Students: 321; Location: 1100 S 7TH ST; Grades: 09 - 12) Public primary/middle schools in Tucumcari: · TUCUMCARI ELEM (Students: 491; Location: 1701 S 9TH; Grades: PK - 05) · TUCUMCARI MIDDLE (Students: 280; Location: 914 S 4TH STREET; Grades: 06 - 08)
- Esperanza High School is now closed. There are only three regular public schools: Tucumcari Elementary School (Pre-K thru 5th); Tucumcari Middle School (5th thru 8th); Tucumcari High School (9th thru 12th).
Points of interest:
Notable locations in Tucumcari: Tucumcari Area Vocational School Library (A), Rural Bookmobile East Library (B), Tucumcari Historical Research Institute (C), Conservancy Fire District 1 Main Station (D), Tucumcari Fire Department Station 1 (E), Tucumcari Medical Services Department (F), Tucumcari Fire Department Station 2 (G), Quay County Courthouse Historic Site (H), Rock Island-Southern Pacific Passenger Depot Historic Site (I), Baca-Goodman House Historic Site (J). Display/hide their locations on the map
Churches in Tucumcari include: First Baptist Church (A), First Christian Church (B), First Presbyterian Church (C), Full Gospel Grace Tabernacle (D), First Spanish Baptist Church (E), First Assembly of God Church (F), Church of God (G), The Church of Jesus Christ of Latter Day Saints (H), Temple Baptist (I). Display/hide their locations on the map
Parks in Tucumcari include: Tucumcari Metropolitan Park (1), Tucumcari Historical Marker (2), East Side Park (3). Display/hide their locations on the map
Tourist attractions: Mesalands Community College's Dinosaur Museum (222 East Laughlin Avenue) (1), New Mexico State Government - Rural Book Mobile East (Cultural Attractions- Events- & Facilities; Po Box 1163) (2). Display/hide their approximate locations on the map
Hotels: Travelodge Motel (1214 East Route 66 Boulevard) (1), Americana Motel (406 East Route 66 Boulevard) (2), Pony Soldier Motel (1803 East Route 66 Boulevard) (3), Royal Palacio Motel (1620 East Route 66 Boulevard) (4), Econo Lodge Tucumcari (3400 East Tucumcari Boulevard) (5), Microtel Inn Tucumcari (2420 South 1st Street) (6), Pow Wow South Apartments (415 East Washington Avenue) (7), Budget Inns (824 West Route 66 Boulevard) (8), Branding Iron Restaurant & Lounge (3716 East Tucumcari Boulevard) (9). Display/hide their approximate locations on the map
Courts: New Mexico State Government - District Court Clerk (300 South 3) (1), Quay County Government - Magistrate Court (122 East Center Street) (2), Tucumcari Municipal Court (225 East Center Street) (3). Display/hide their approximate locations on the map
Birthplace of: Abel Cullum - Martial artist, Paul Brinegar - Actor, Danny Villanueva - Football player.
Drinking water stations with addresses in Tucumcari and their reported violations in the past:
RAD WATER USERS COOP (Population served: 588, Purch groundwater):Past health violations:LIBERTY MDWCA (Address: 4321 Quay Road 65 , Population served: 170, Purch groundwater):
- MCL, Monthly (TCR) - In JUL-2007, Contaminant: Coliform. Follow-up actions: St Tech Assistance Visit (JUL-26-2007), St Violation/Reminder Notice (JUL-26-2007), St Public Notif requested (JUL-26-2007), St Public Notif received (AUG-20-2007), St Compliance achieved (SEP-18-2008)
Past monitoring violations:HILLS VILLAGE WATER SYSTEM (Population served: 150, Purch groundwater):
- Follow-up Or Routine LCR Tap M/R - In JAN-01-1996, Contaminant: Lead and Copper Rule. Follow-up actions: St Public Notif requested (JAN-12-2005), St Violation/Reminder Notice (JAN-12-2005), St Public Notif received (MAR-14-2005), St Compliance achieved (SEP-02-2010)
- Follow-up Or Routine LCR Tap M/R - In JAN-01-1996, Contaminant: Lead and Copper Rule. Follow-up actions: St Public Notif requested (JAN-12-2005), St Violation/Reminder Notice (JAN-12-2005), St Public Notif received (MAR-14-2005), St Compliance achieved (SEP-02-2010)
Past monitoring violations:
- Follow-up Or Routine LCR Tap M/R - In JAN-01-1996, Contaminant: Lead and Copper Rule. Follow-up actions: St Public Notif requested (JAN-13-2005), St Violation/Reminder Notice (JAN-13-2005), St Compliance achieved (OCT-17-2005)
- Follow-up Or Routine LCR Tap M/R - In JAN-01-1996, Contaminant: Lead and Copper Rule. Follow-up actions: St Public Notif requested (JAN-13-2005), St Violation/Reminder Notice (JAN-13-2005), St Compliance achieved (OCT-17-2005)
| This city: | 2.2 people |
| New Mexico: | 2.5 people |
| This city: | 57.6% |
| Whole state: | 65.5% |
| This city: | 7.5% |
| Whole state: | 8.2% |
Likely homosexual households (counted as self-reported same-sex unmarried-partner households)
- Lesbian couples: 0.1% of all households
- Gay men: 0.1% of all households
4 people in correctional facilities intended for juveniles in 2010
People in group quarters in Tucumcari in 2000:
- 74 people in local jails and other confinement facilities (including police lockups)
- 62 people in nursing homes
- 12 people in other noninstitutional group quarters
Banks with branches in Tucumcari (2011 data):
- Citizens Bank: Tucumcari Branch at 211 East Main Street, branch established on 1948/03/15. Info updated 2010/06/01: Bank assets: $112.2 mil, Deposits: $99.4 mil, headquarters in Claude, TX, positive income, Agricultural Specialization, 4 total offices, Holding Company: Triple J Financial, Inc.
- Tucumcari Federal Savings and Loan Association: Tucumcari Federal Savings And Loan A at 301 S First St, branch established on 1934/07/01. Info updated 2011/07/21: Bank assets: $39.0 mil, Deposits: $27.4 mil, local headquarters, positive income, Mortgage Lending Specialization, 1 total offices
- Wells Fargo Bank, National Association: Tucumcari Branch at 302 South First Street, branch established on 1901/01/01. Info updated 2011/04/05: Bank assets: $1,161,490.0 mil, Deposits: $905,653.0 mil, headquarters in Sioux Falls, SD, positive income, 6395 total offices, Holding Company: Wells Fargo & Company
- The First National Bank of New Mexico: Tucumcari Branch at 101 East Tucumcari Boulevard, branch established on 1920/01/08. Info updated 2006/11/03: Bank assets: $179.4 mil, Deposits: $161.1 mil, headquarters in Clayton, NM, positive income, Agricultural Specialization, 6 total offices, Holding Company: Union Bancshares, Inc.
For population 15 years and over in Tucumcari:

- Never married: 34.4%
- Now married: 29.6%
- Separated: 5.0%
- Widowed: 12.6%
- Divorced: 18.4%
For population 25 years and over in Tucumcari:
- High school or higher: 81.0%
- Bachelor's degree or higher: 13.6%
- Graduate or professional degree: 5.1%
- Unemployed: 7.0%
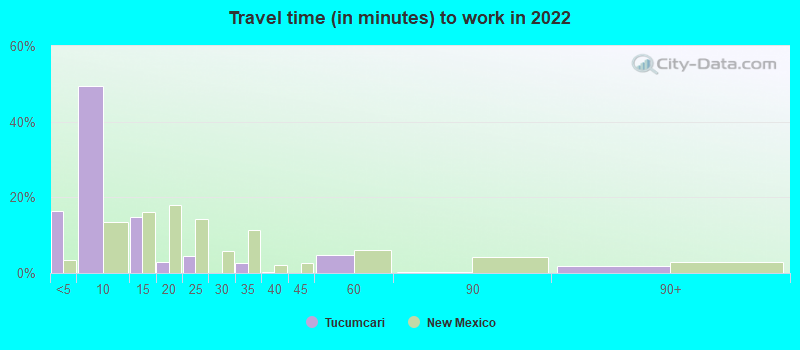
- Mean travel time to work (commute): 9.5 minutes


| Here: | 9.0 |
| New Mexico average: | 12.6 |
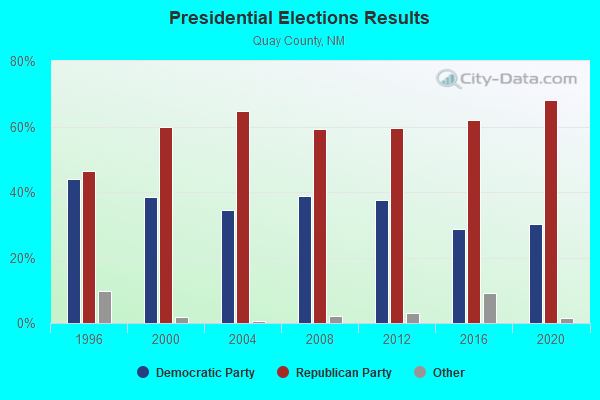
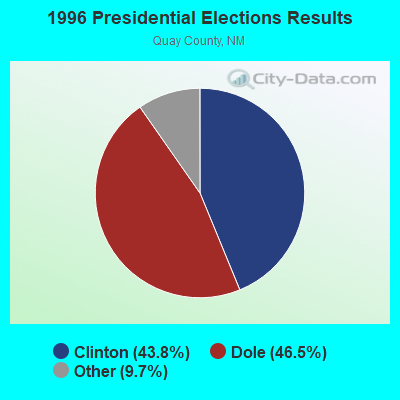
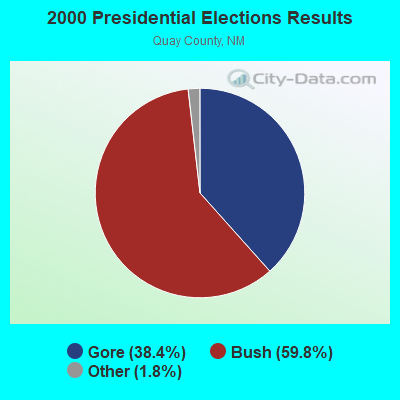
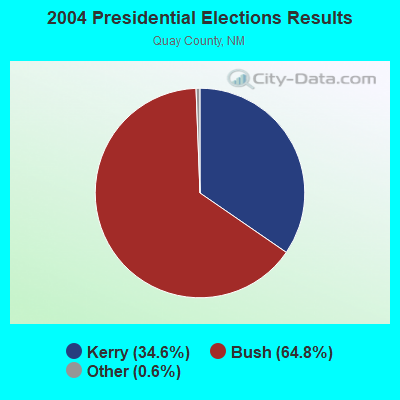
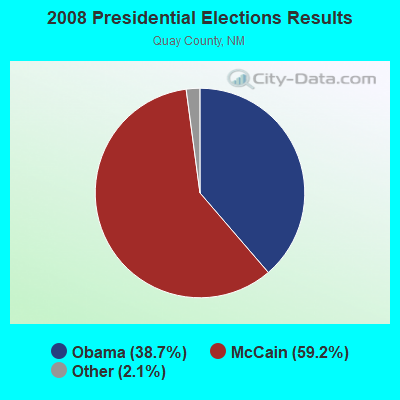
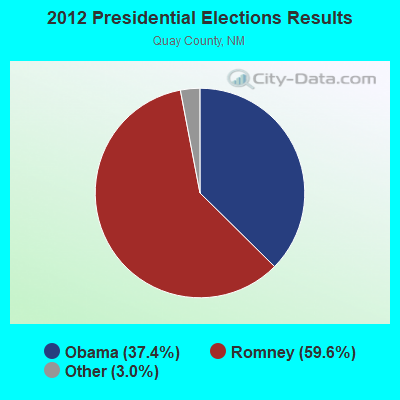
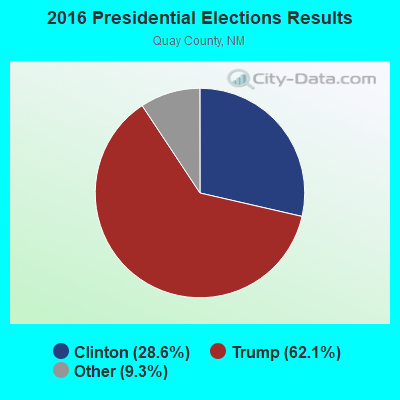
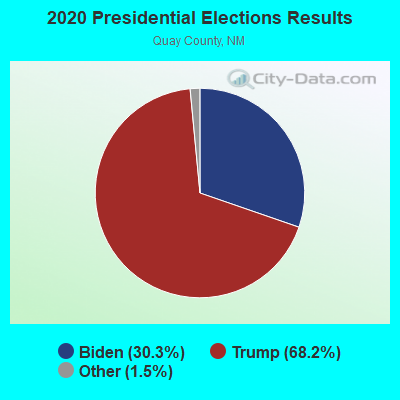
Graphs represent county-level data. Detailed 2008 Election Results
Religion statistics for Tucumcari, NM (based on Quay County data)
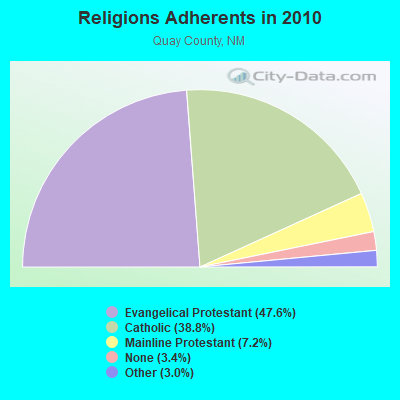
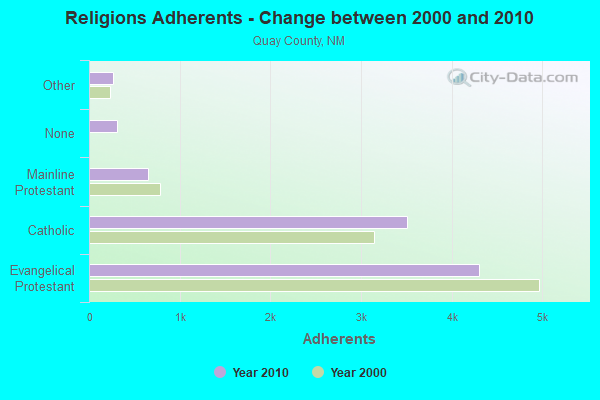
| Religion | Adherents | Congregations |
|---|---|---|
| Evangelical Protestant | 4,299 | 19 |
| Catholic | 3,510 | 5 |
| Mainline Protestant | 655 | 6 |
| Other | 270 | 2 |
| None | 307 | - |
Food Environment Statistics:
| Quay County: | 2.23 / 10,000 pop. |
| New Mexico: | 1.44 / 10,000 pop. |
| Here: | 1.12 / 10,000 pop. |
| New Mexico: | 0.32 / 10,000 pop. |
| Here: | 13.41 / 10,000 pop. |
| New Mexico: | 4.06 / 10,000 pop. |
| Here: | 7.82 / 10,000 pop. |
| New Mexico: | 7.12 / 10,000 pop. |
| Quay County: | 6.8% |
| New Mexico: | 6.4% |
| Here: | 25.8% |
| New Mexico: | 22.1% |
Health and Nutrition:
| Tucumcari: | 48.9% |
| New Mexico: | 49.0% |
| Tucumcari: | 46.0% |
| New Mexico: | 48.1% |
| Here: | 28.9 |
| State: | 28.6 |
| This city: | 20.0% |
| New Mexico: | 20.7% |
| Tucumcari: | 12.0% |
| New Mexico: | 10.1% |
| This city: | 6.8 |
| New Mexico: | 6.8 |
| This city: | 34.8% |
| State: | 34.6% |
| This city: | 53.7% |
| New Mexico: | 55.9% |
| Here: | 78.5% |
| New Mexico: | 80.3% |
More about Health and Nutrition of Tucumcari, NM Residents
| Local government employment and payroll (March 2022) | |||||
| Function | Full-time employees | Monthly full-time payroll | Average yearly full-time wage | Part-time employees | Monthly part-time payroll |
|---|---|---|---|---|---|
| Police Protection - Officers | 11 | $53,499 | $58,363 | 0 | $0 |
| Parks and Recreation | 11 | $27,482 | $29,980 | 4 | $4,575 |
| Housing and Community Development (Local) | 9 | $30,232 | $40,309 | 0 | $0 |
| Water Supply | 9 | $32,931 | $43,908 | 0 | $0 |
| Health | 7 | $30,012 | $51,449 | 7 | $12,278 |
| Financial Administration | 7 | $27,632 | $47,369 | 0 | $0 |
| Solid Waste Management | 7 | $21,421 | $36,722 | 1 | $1,289 |
| Sewerage | 7 | $26,011 | $44,590 | 0 | $0 |
| Other Government Administration | 6 | $15,028 | $30,056 | 1 | $906 |
| Streets and Highways | 4 | $9,931 | $29,793 | 0 | $0 |
| Local Libraries | 3 | $7,329 | $29,316 | 1 | $1,329 |
| Other and Unallocable | 3 | $10,746 | $42,984 | 0 | $0 |
| Judicial and Legal | 2 | $4,271 | $25,626 | 0 | $0 |
| Airports | 2 | $5,872 | $35,232 | 0 | $0 |
| Welfare | 2 | $5,970 | $35,820 | 4 | $5,199 |
| Police - Other | 1 | $2,442 | $29,304 | 0 | $0 |
| Firefighters | 0 | $0 | 6 | $1,650 | |
| Totals for Government | 91 | $310,810 | $40,986 | 24 | $27,225 |
Tucumcari government finances - Expenditure in 2021 (per resident):
- Construction - General - Other: $100,000 ($19.42)
Water Utilities: $75,000 ($14.57)
Solid Waste Management: $13,000 ($2.52)
- Current Operations - Police Protection: $1,383,000 ($268.60)
Water Utilities: $1,279,000 ($248.40)
General - Other: $956,000 ($185.67)
Central Staff Services: $952,000 ($184.89)
Health - Other: $789,000 ($153.23)
Sewerage: $780,000 ($151.49)
Solid Waste Management: $754,000 ($146.44)
Parks and Recreation: $676,000 ($131.29)
Regular Highways: $510,000 ($99.05)
Miscellaneous Commercial Activities - Other: $417,000 ($80.99)
Air Transportation: $372,000 ($72.25)
Local Fire Protection: $279,000 ($54.19)
Financial Administration: $274,000 ($53.21)
Libraries: $188,000 ($36.51)
Judicial and Legal Services: $74,000 ($14.37)
- General - Interest on Debt: $162,000 ($31.46)
- Intergovernmental to Local - Other - Public Welfare - Other: $7,000 ($1.36)
- Other Capital Outlay - Local Fire Protection: $233,000 ($45.25)
Solid Waste Management: $72,000 ($13.98)
Sewerage: $61,000 ($11.85)
Police Protection: $27,000 ($5.24)
- Total Salaries and Wages: $3,725,000 ($723.44)
- Water Utilities - Interest on Debt: $26,000 ($5.05)
Tucumcari government finances - Revenue in 2021 (per resident):
- Charges - Sewerage: $1,407,000 ($273.26)
Solid Waste Management: $1,208,000 ($234.61)
Hospital Public: $494,000 ($95.94)
Air Transportation: $363,000 ($70.50)
Miscellaneous Commercial Activities: $78,000 ($15.15)
Parks and Recreation: $59,000 ($11.46)
Other: $36,000 ($6.99)
- Federal Intergovernmental - Public Welfare: $122,000 ($23.69)
Highways: $19,000 ($3.69)
Air Transportation: $16,000 ($3.11)
- Local Intergovernmental - Public Welfare: $14,000 ($2.72)
- Miscellaneous - General Revenue - Other: $116,000 ($22.53)
Rents: $50,000 ($9.71)
Fines and Forfeits: $34,000 ($6.60)
Interest Earnings: $16,000 ($3.11)
- Revenue - Water Utilities: $1,793,000 ($348.22)
- State Intergovernmental - Other: $1,234,000 ($239.66)
Health and Hospitals: $621,000 ($120.61)
Public Welfare: $420,000 ($81.57)
Sewerage: $49,000 ($9.52)
Highways: $14,000 ($2.72)
- Tax - General Sales and Gross Receipts: $3,428,000 ($665.76)
Other Selective Sales: $701,000 ($136.14)
Property: $443,000 ($86.04)
Public Utilities Sales: $208,000 ($40.40)
Motor Vehicle License: $25,000 ($4.86)
Occupation and Business License - Other: $10,000 ($1.94)
Other License: $5,000 ($0.97)
Alcoholic Beverage License: $5,000 ($0.97)
Tucumcari government finances - Debt in 2021 (per resident):
- Long Term Debt - Beginning Outstanding - Unspecified Public Purpose: $5,998,000 ($1164.89)
Outstanding Unspecified Public Purpose: $5,554,000 ($1078.66)
Retired Unspecified Public Purpose: $444,000 ($86.23)
Tucumcari government finances - Cash and Securities in 2021 (per resident):
- Other Funds - Cash and Securities: $9,478,000 ($1840.75)
- Sinking Funds - Cash and Securities: $166,000 ($32.24)
| Businesses in Tucumcari, NM | ||||
| Name | Count | Name | Count | |
|---|---|---|---|---|
| Ace Hardware | 1 | La Quinta | 1 | |
| Alco Stores | 1 | McDonald's | 1 | |
| Arby's | 1 | Motel 6 | 1 | |
| Best Western | 1 | Nike | 1 | |
| Circle K | 2 | Quality | 1 | |
| Dairy Queen | 1 | RadioShack | 1 | |
| Days Inn | 1 | Rodeway Inn | 1 | |
| Dennys | 1 | SONIC Drive-In | 1 | |
| Econo Lodge | 1 | Super 8 | 1 | |
| FedEx | 4 | Travelodge | 1 | |
| Holiday Inn | 1 | True Value | 1 | |
| KFC | 1 | U-Haul | 1 | |
| Kmart | 1 | UPS | 1 | |
Strongest AM radio stations in Tucumcari:
- KTNM (1400 AM; 1 kW; TUCUMCARI, NM; Owner: QUAY BROADCASTERS, INC.)
- KICA (980 AM; 50 kW; CLOVIS, NM; Owner: BROADCAST ENTERTAINMENT CORPORATION)
- KMUL (1380 AM; 50 kW; MULESHOE, TX; Owner: BROADCAST ENTERTAINMENT CORPORATION)
- KKOB (770 AM; 50 kW; ALBUQUERQUE, NM; Owner: CITADEL BROADCASTING COMPANY)
- KINF (1020 AM; 50 kW; ROSWELL, NM; Owner: JAMES CRYSTAL HOLDINGS OF NEW MEXICO, INC.)
- KIJN (1060 AM; daytime; 10 kW; FARWELL, TX; Owner: METROPOLITIAN RADIO GROUP, INC.)
- KGYN (1210 AM; 50 kW; GUYMON, OK; Owner: TELNS BROADCASTING COMPANY, INC.)
- KNMX (540 AM; 5 kW; LAS VEGAS, NM; Owner: SANGRE DE CRISTO B/DCASTING CO, INC)
- KGNC (710 AM; 10 kW; AMARILLO, TX; Owner: MCC RADIO, LLC)
- KTNN (660 AM; 50 kW; WINDOW ROCK, AZ; Owner: THE NAVAJO NATION)
- KLTT (670 AM; 50 kW; COMMERCE CITY, CO; Owner: KLZ RADIO, INC.)
- KOA (850 AM; 50 kW; DENVER, CO; Owner: JACOR BROADCASTING OF COLORADO, INC.)
- KKZN (760 AM; 50 kW; THORNTON, CO; Owner: JACOR BROADCASTING OF COLORADO, INC.)
Strongest FM radio stations in Tucumcari:
- KQAY-FM (92.7 FM; TUCUMCARI, NM; Owner: QUAY BROADCASTERS, INC.)
- K288EQ (105.5 FM; CONCHAS DAM, NM; Owner: CONCHAS TELEVISION ASSOCIATION)
- K202CX (88.3 FM; CONCHAS, NM; Owner: EASTERN NEW MEXICO UNIVERSITY)
- K280EM (103.9 FM; TUCUMCARI, NM; Owner: EASTERN NEW MEXICO UNIVERSITY)
- K211DW (90.1 FM; TUCUMCARI, NM; Owner: FAMILY LIFE BROADCASTING SYSTEM)
TV broadcast stations around Tucumcari:
- K32FE (Channel 32; TUCUMCARI, NM; Owner: EASTERN NEW MEXICO UNIVERSITY)
- K35FP (Channel 35; TUCUMCARI, NM; Owner: UHF-TV ASSOCIATION)
- K44CJ (Channel 44; TUCUMCARI, NM; Owner: EMMIS TELEVISION LICENSE CORPORATION)
- K38FP (Channel 38; TUCUMCARI, NM; Owner: UHF TV ASSOCIATION)
- K48EH (Channel 48; TUCUMCARI, NM; Owner: RAYCOM NATIONAL, INC.)
- K40DK (Channel 40; TUCUMCARI, NM; Owner: UHF TV ASSOCIATION)
- K42CR (Channel 42; TUCUMCARI, NM; Owner: UHF TV ASSOCIATION)
- K46BU (Channel 46; TUCUMCARI, NM; Owner: UHF TV ASSOCIATION)
- K50CX (Channel 50; TUCUMCARI, NM; Owner: UHF TV ASSOCIATION)
- K52CR (Channel 52; FORREST, ETC., NM; Owner: KOAT HEARST-ARGYLE TELEVISION, INC.)
- K61AF (Channel 61; FORREST/McALLISTER, NM; Owner: KOB-TV, LLC)

- National Bridge Inventory (NBI) Statistics
- 55Number of bridges
- 564ft / 172mTotal length
- $2,256,000Total costs
- 309,920Total average daily traffic
- 116,904Total average daily truck traffic

- New bridges - historical statistics
- 11930-1939
- 31940-1949
- 21950-1959
- 131970-1979
- 321980-1989
- 21990-1999
- 12000-2009
- 12020-2022
FCC Registered Cell Phone Towers:
3 (See the full list of FCC Registered Cell Phone Towers in Tucumcari)FCC Registered Antenna Towers:
65 (See the full list of FCC Registered Antenna Towers)FCC Registered Broadcast Land Mobile Towers:
17 (See the full list of FCC Registered Broadcast Land Mobile Towers in Tucumcari, NM)FCC Registered Microwave Towers:
30 (See the full list of FCC Registered Microwave Towers in this town)FCC Registered Paging Towers:
1 (See the full list of FCC Registered Paging Towers)FCC Registered Maritime Coast & Aviation Ground Towers:
2 (See the full list of FCC Registered Maritime Coast & Aviation Ground Towers)FCC Registered Amateur Radio Licenses:
25 (See the full list of FCC Registered Amateur Radio Licenses in Tucumcari)FAA Registered Aircraft:
7- Aircraft: MULVAHILL MICHAEL AVENTURA II (Category: Amphibian, Seats: 2, Weight: Up to 12,499 Pounds), Engine: Reciprocating
N-Number: 517MV, N517MV, N-517MV, Serial Number: AP2A0049, Certificate Issue Date: 06/03/2020
Registrant (Individual): Michael Mulvahill, Po Box 343, Tucumcari, NM 88401
Deregistered: Cancel Date: 03/27/2018 - Aircraft: SENSENIG-BELISLE VICKIE L CHALLENGER 2P (Category: Land, Seats: 2, Weight: Up to 12,499 Pounds), Engine: ROTAX 503 DCDI (52 HP) (Reciprocating)
N-Number: 608VS, N608VS, N-608VS, Serial Number: VS-CH2-101506, Year manufactured: 2015, Airworthiness Date: 01/13/2016, Certificate Issue Date: 08/23/2018
Registrant (Individual): Vicki L Sensenig, 3681 Quay Road 63.2, Tucumcari, NM 88401 - Aircraft: SENSENIG VICKI L T E A M HI-MAX 1700R (Category: Land, Weight: Up to 12,499 Pounds), Engine: ROTAX 503 DCDI (52 HP) (Reciprocating)
N-Number: 8756V, N8756V, N-8756V, Serial Number: 8-2019-68, Year manufactured: 2019, Airworthiness Date: 10/17/2019, Certificate Issue Date: 09/18/2019
Registrant (Individual): Vicki L Sensenig, 3681 Quay Road 63.2, Tucumcari, NM 88401 - Aircraft: PIPER PA-18-150 (Category: Land, Seats: 2, Weight: Up to 12,499 Pounds, Speed: 97 mph), Engine: LYCOMING 0-320 SERIES (180 HP) (Reciprocating)
N-Number: 9929P, N9929P, N-9929P, Serial Number: 18-7709009, Year manufactured: 1976, Airworthiness Date: 10/18/1976, Certificate Issue Date: 06/04/2013
Registrant (Individual): Lesa M Floeck, 3705 Quay Road 64.5, Tucumcari, NM 88401 - Aircraft: BEECH V35 (Category: Land, Seats: 6, Weight: Up to 12,499 Pounds, Speed: 150 mph), Engine: CONT MOTOR IO 520 SERIES (285 HP) (Reciprocating)
N-Number: 50BD, N50BD, N-50BD, Serial Number: D-8175, Year manufactured: 1966, Airworthiness Date: 05/17/1966
Registrant (Individual): Reported Sale, 7265 Quay Road Ac, Tucumcari, NM 88401 - Aircraft: TYLER TIM P CHALLENGER II (Category: Land, Seats: 2, Weight: Up to 12,499 Pounds), Engine: ROTAX 503 SERIES (52 HP) (Reciprocating)
N-Number: 138TT, N138TT, N-138TT, Serial Number: CH2-0900-W-2006, Year manufactured: 2000, Airworthiness Date: 07/13/2013, Certificate Issue Date: 12/31/2014
Registrant (Individual): Bob Mcclelland, 511 S 2nd St, Tucumcari, NM 88401
Deregistered: Cancel Date: 10/20/2016 - Aircraft: STINSON 108-1 (Category: Land, Seats: 4, Weight: Up to 12,499 Pounds, Speed: 84 mph), Engine: FRANKLIN 6A4150 SERIES (150 HP) (Reciprocating)
N-Number: 8334K, N8334K, N-8334K, Serial Number: 108-1334, Year manufactured: 1946, Airworthiness Date: 08/08/1957, Certificate Issue Date: 10/18/2000
Registrant (Individual): Stanley E Jennings, Po Box 831, Tucumcari, NM 88401
Deregistered: Cancel Date: 07/18/2017
2002 - 2018 National Fire Incident Reporting System (NFIRS) incidents
- Fire incident types reported to NFIRS in Tucumcari, NM
- 63059.1%Outside Fires
- 25123.5%Structure Fires
- 12311.5%Mobile Property/Vehicle Fires
- 625.8%Other
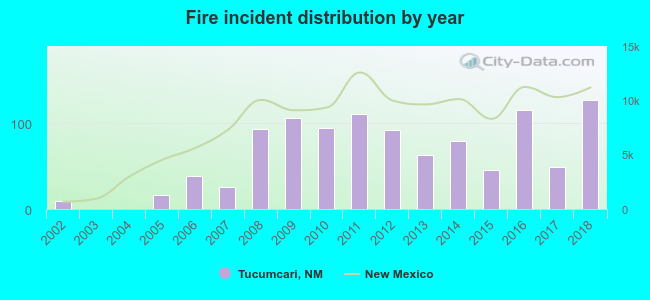 Based on the data from the years 2002 - 2018 the average number of fire incidents per year is 63. The highest number of fire incidents - 127 took place in 2018, and the least - 0 in 2003. The data has a growing trend.
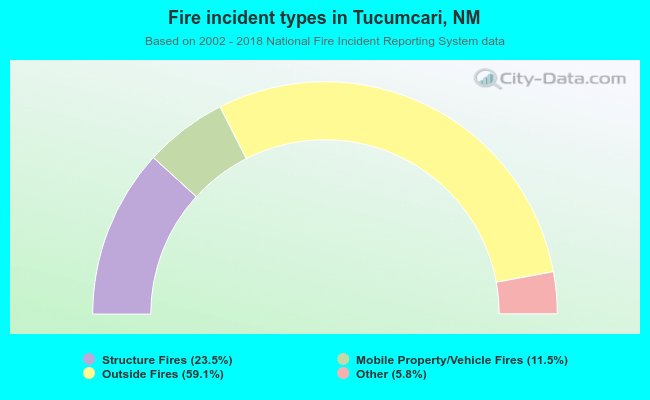 When looking into fire subcategories, the most incidents belonged to: Outside Fires (59.1%), and Structure Fires (23.5%).
Fire-safe hotels and motels in Tucumcari, New Mexico:
- Quality Inn, 3716 E Tucumcari Blvd, Tucumcari, New Mexico 88401 , Phone: (800) 335-3780, Fax: (505) 461-3931
- Americas Best Value Inn, 3604 E Tucumcari Blvd, Tucumcari, New Mexico 88401 , Phone: (575) 461-9611
- Hampton Inn, 3409 E Rt 66 Blvd, Tucumcari, New Mexico 88401 , Phone: (505) 461-1111, Fax: (505) 461-0000
- Holiday Inn Express Hotel & Suites, 2624 S Adams St, Tucumcari, New Mexico 88401 , Phone: (505) 461-3333, Fax: (505) 461-3336
- Econo Lodge, 3400 E Rt 66 Blvd, Tucumcari, New Mexico 88401 , Phone: (505) 461-4194
- Days Inn Tucumcari, 2623 S First St, Tucumcari, New Mexico 88401 , Phone: (575) 461-3158, Fax: (575) 461-4871
- Tristar Inn Xpress, 1302 Rt 66 Blvd, Tucumcari, New Mexico 88401 , Phone: (575) 461-3140, Fax: (575) 461-3143
- La Quinta Inn & Suites, 2615 S Adam St, Tucumcari, New Mexico 88401 , Phone: (575) 461-2233, Fax: (575) 461-7988
- Fairfield Inn & Suites by Marriott, 1901 S Mountain Rd, Tucumcari, New Mexico 88401 , Phone: (888) 236-2427
| Most common first names in Tucumcari, NM among deceased individuals | ||
| Name | Count | Lived (average) |
|---|---|---|
| Mary | 76 | 77.1 years |
| James | 54 | 73.3 years |
| John | 48 | 76.6 years |
| William | 38 | 74.6 years |
| Robert | 35 | 70.9 years |
| Charles | 34 | 74.9 years |
| George | 29 | 72.6 years |
| Jose | 28 | 72.2 years |
| Juan | 25 | 73.4 years |
| Dorothy | 21 | 74.9 years |
| Most common last names in Tucumcari, NM among deceased individuals | ||
| Last name | Count | Lived (average) |
|---|---|---|
| Martinez | 69 | 69.9 years |
| Smith | 42 | 80.2 years |
| Garcia | 35 | 76.0 years |
| Lopez | 29 | 67.9 years |
| Romero | 28 | 72.1 years |
| Aragon | 26 | 70.9 years |
| Sandoval | 25 | 68.6 years |
| Lucero | 20 | 76.2 years |
| White | 19 | 72.3 years |
| Gutierrez | 19 | 68.3 years |
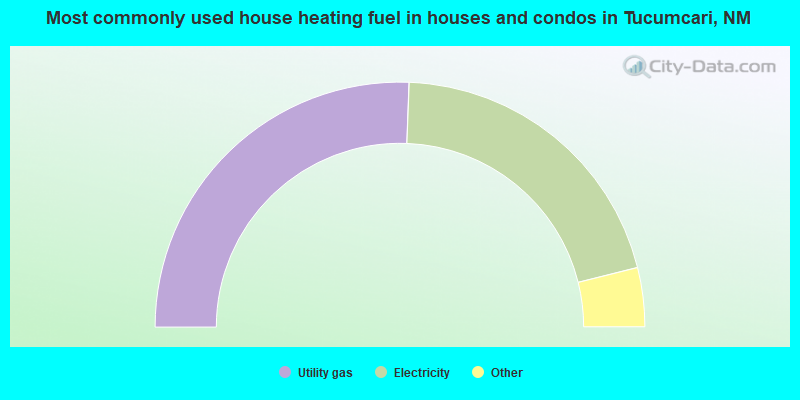
- 51.2%Utility gas
- 41.0%Electricity
- 2.8%Wood
- 1.9%Bottled, tank, or LP gas
- 1.7%Solar energy
- 1.3%No fuel used
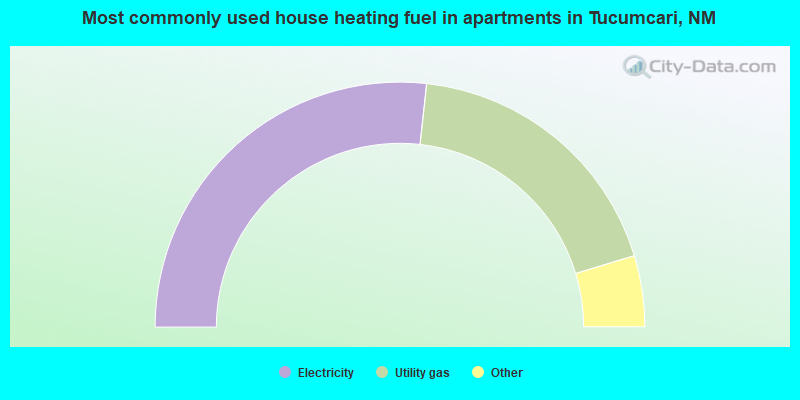
- 53.6%Electricity
- 37.2%Utility gas
- 3.6%No fuel used
- 2.7%Bottled, tank, or LP gas
- 1.9%Solar energy
- 0.9%Fuel oil, kerosene, etc.
Tucumcari compared to New Mexico state average:
- Median household income below state average.
- Median house value significantly below state average.
- Unemployed percentage below state average.
- Foreign-born population percentage significantly below state average.
- Length of stay since moving in above state average.
- House age above state average.
- Percentage of population with a bachelor's degree or higher below state average.
Tucumcari on our top lists:
- #9 on the list of "Top 101 cities with largest percentage of females in industries: real estate and rental and leasing (population 5,000+)"
- #17 on the list of "Top 100 cities with shortest commuting times (pop. 5,000+)"
- #31 on the list of "Top 101 cities with the highest number of burglaries per 100,000 residents, excludes tourist destinations and others with a lot of outsiders visiting based on city industries data (population 5,000+)"
- #36 on the list of "Top 101 cities with the highest number of murders per 100,000 residents, excludes tourist destinations and others with a lot of outsiders visiting based on city industries data (population 5,000+)"
- #66 on the list of "Top 101 cities with largest percentage of males in occupations: food preparation and serving related occupations (population 5,000+)"
- #93 on the list of "Top 101 cities with the largest percentage population decrease from 2000 (population 5,000+)"
- #98 on the list of "Top 101 cities with the largest house values disparities (population 5,000+)"