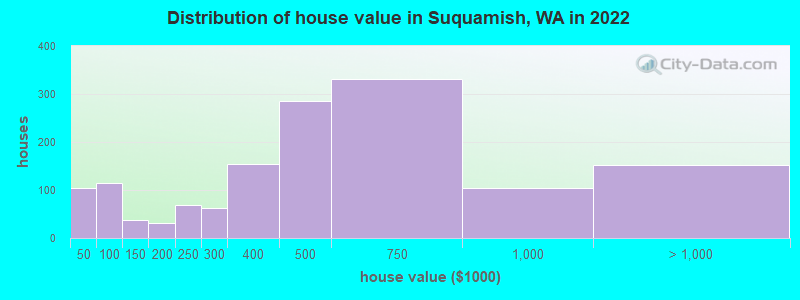
Estimated median house or condo value in 2022: $466,652 (it was $126,500 in 2000)
Suquamish:
$466,652
WA:
$569,500
Mean prices in 2022:all housing units: $521,798; detached houses: $589,335; townhouses or other attached units: $741,255; in 2-unit structures: $358,677; mobile homes: $160,479; occupied boats, rvs, vans, etc.: $99,438
Median gross rent in 2022: $1,381.
March 2022 cost of living index in Suquamish: 108.1 (more than average, U.S. average is 100)
Percentage of residents living in poverty in 2022: 8.7%
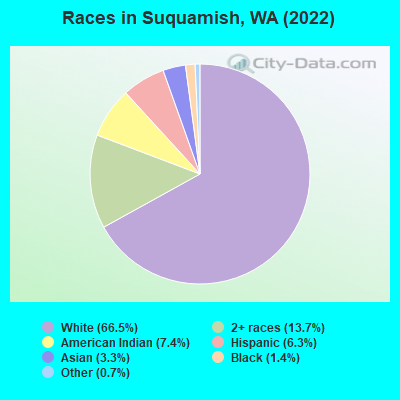
(7.6% for White Non-Hispanic residents, 30.8% for Black residents, 11.6% for Hispanic or Latino residents, 13.9% for American Indian residents, 23.4% for other race residents, 6.6% for two or more races residents)
Ancestries: German (9.0%), English (6.8%), Irish (6.7%), European (6.7%), American (4.0%), Norwegian (3.7%).
Current Local Time: PST time zone
Elevation: 202 feet
Land area: 6.84 square miles.
Population density: 605 people per square mile (low).
283 residents are foreign born (2.2% Asia, 1.6% Europe, 1.6% Latin America).
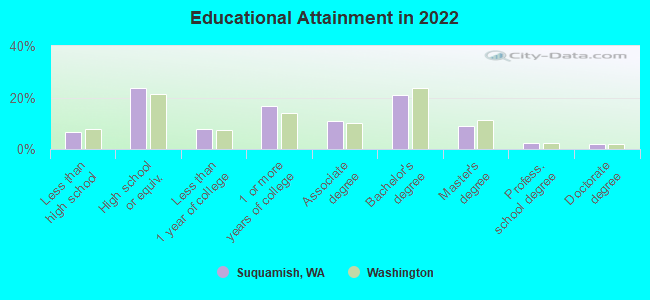
This place:
6.5%
Washington:
14.9%
Median real estate property taxes paid for housing units with mortgages in 2022: $3,336 (0.7%) Median real estate property taxes paid for housing units with no mortgage in 2022: $2,737 (0.8%)
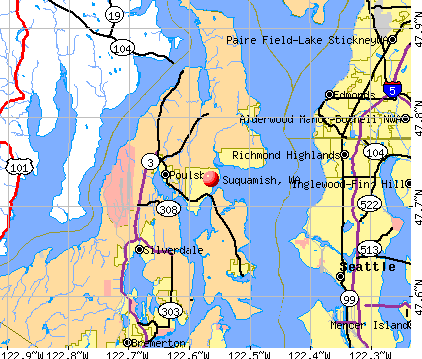
Nearest city with pop. 50,000+: Shoreline, WA (10.6 miles , pop. 53,025).
Nearest city with pop. 200,000+: Seattle, WA (13.0 miles , pop. 563,374).
Nearest city with pop. 1,000,000+: Los Angeles, CA (968.4 miles , pop. 3,694,820).
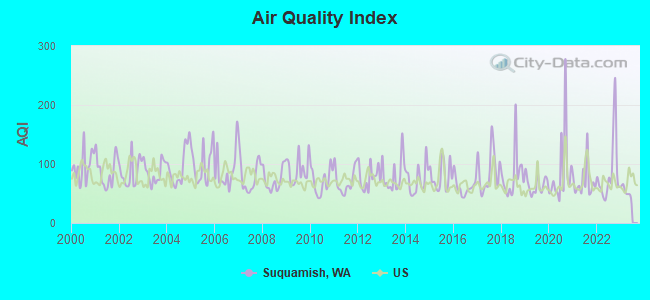
Air Quality Index (AQI) level in 2022 was 85.5. This is about average.
City:
85.5
U.S.:
72.6
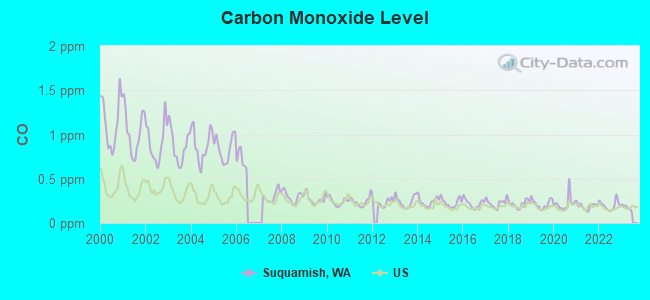
Carbon Monoxide (CO) [ppm] level in 2022 was 0.200. This is better than average.Closest monitor was 10.2 miles away from the city center.
City:
0.200
U.S.:
0.251
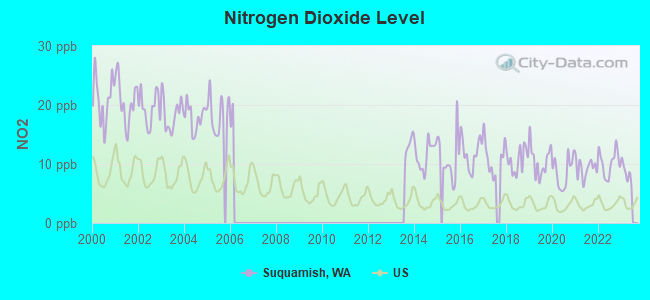
Nitrogen Dioxide (NO2) [ppb] level in 2022 was 10.2. This is significantly worse than average.Closest monitor was 14.0 miles away from the city center.
City:
10.2
U.S.:
5.1
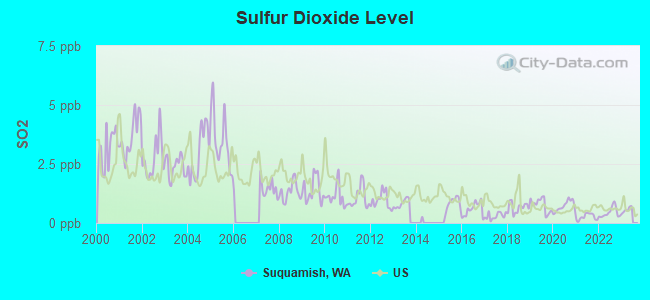
Sulfur Dioxide (SO2) [ppb] level in 2022 was 0.443. This is significantly better than average.Closest monitor was 10.5 miles away from the city center.
City:
0.443
U.S.:
1.515
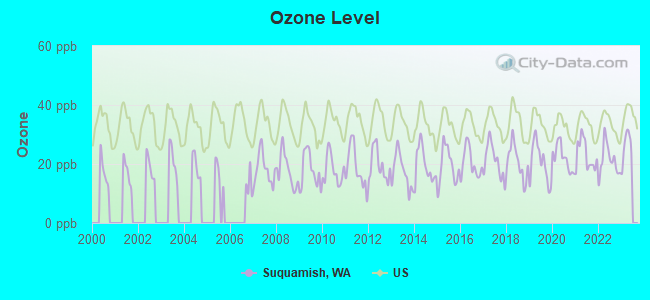
Ozone [ppb] level in 2022 was 21.2. This is significantly better than average.Closest monitor was 16.4 miles away from the city center.
City:
21.2
U.S.:
33.3
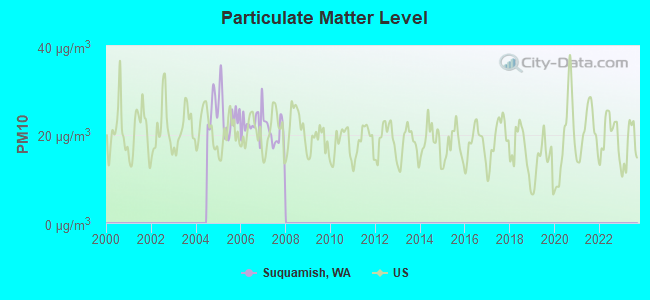
Particulate Matter (PM10) [µg/m3] level in 2007 was 20.3. This is about average.Closest monitor was 3.6 miles away from the city center.
City:
20.3
U.S.:
19.2
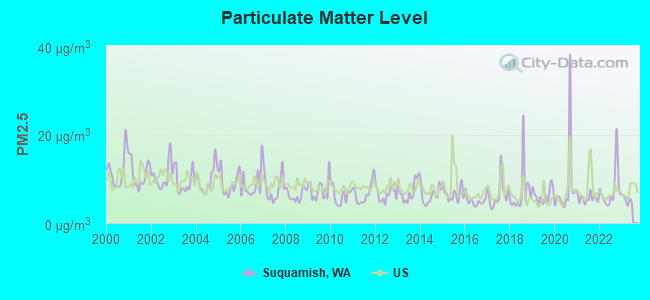
Particulate Matter (PM2.5) [µg/m3] level in 2022 was 7.55. This is about average.Closest monitor was 0.5 miles away from the city center.
City:
7.55
U.S.:
8.11
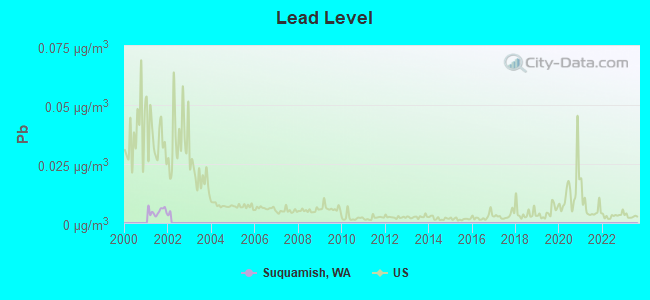
Lead (Pb) [µg/m3] level in 2001 was 0.00494. This is significantly better than average.Closest monitor was 10.5 miles away from the city center.
City:
0.00494
U.S.:
0.00931
Earthquake activity:
Suquamish-area historical earthquake activity is significantly above Washington state average. It is 1255% greater than the overall U.S. average.
On 4/13/1949 at 19:55:42, a magnitude 7.0 (7.0 UK, Class: Major, Intensity: VIII - XII) earthquake occurred 33.4 miles away from Suquamish center, causing $80,000,000 total damage On 2/28/2001 at 18:54:32, a magnitude 6.8 (6.8 MD, Depth: 32.2 mi, Class: Strong, Intensity: VII - IX) earthquake occurred 41.0 miles away from Suquamish center On 2/28/2001 at 18:54:32, a magnitude 6.8 (6.5 MB, 6.6 MS, 6.8 MW) earthquake occurred 44.3 miles away from the city center, causing $2,000,000,000 total damage and $305,000,000 insured losses On 4/29/1965 at 15:28:43, a magnitude 6.6 (6.6 UK) earthquake occurred 30.6 miles away from Suquamish center, causing $28,000,000 total damage On 7/3/1999 at 01:43:54, a magnitude 5.8 (5.4 MB, 5.5 MS, 5.8 MW, 5.3 ME, Depth: 25.2 mi, Class: Moderate, Intensity: VI - VII) earthquake occurred 56.0 miles away from Suquamish center On 5/3/1996 at 04:04:22, a magnitude 5.5 (5.2 MB, 5.3 MD, 5.5 ML, Depth: 2.5 mi) earthquake occurred 38.8 miles away from the city center Magnitude types: body-wave magnitude (MB), duration magnitude (MD), energy magnitude (ME), local magnitude (ML), surface-wave magnitude (MS), moment magnitude (MW)
Natural disasters:
The number of natural disasters in Kitsap County (15) is near the US average (15). Major Disasters (Presidential) Declared: 14 Emergencies Declared: 1
Causes of natural disasters: Floods: 9, Storms: 9, Mudslides: 4, Landslides: 3, Earthquakes: 2, Hurricane: 1, Snow: 1, Volcanic Eruption: 1, Winter Storm: 1, Other: 1 (Note: some incidents may be assigned to more than one category).
Hospitals and medical centers near Suquamish:
MARTHA AND MARY HEALTH SERVICE (Nursing Home, about 4 miles away; POULSBO, WA)
MARTHA AND MARY NURSING HOME (Nursing Home, about 4 miles away; POULSBO, WA)
MESSENGER HOUSE CARE CENTER (Nursing Home, about 6 miles away; BAINBRIDGE ISLAND, WA)
NORTHWOODS LODGE (Nursing Home, about 7 miles away; SILVERDALE, WA)
ISLAND HEALTH AND REHAB CENTER (Nursing Home, about 8 miles away; BAINBRIDGE ISLAND, WA)
CRISTA SHORES NURSING CARE CENTER (Nursing Home, about 8 miles away; SILVERDALE, WA)
HOSPICE OF KITSAP COUNTY (Hospital, about 9 miles away; SILVERDALE, WA)
Amtrak stations near Suquamish:
11 miles: EDMONDS (211 RAILROAD AVE.) . Services: ticket office, fully wheelchair accessible, enclosed waiting area, public restrooms, public payphones, vending machines, paid short-term parking, paid long-term parking, call for taxi service, public transit connection.
15 miles: SEATTLE (303 S. JACKSON ST.) . Services: ticket office, fully wheelchair accessible, enclosed waiting area, public restrooms, public payphones, vending machines, paid short-term parking, paid long-term parking, call for car rental service, taxi stand, intercity bus service, public transit connection.
Colleges/universities with over 2000 students nearest to Suquamish:
Shoreline Community College (about 10 miles; Shoreline, WA; Full-time enrollment: 5,026)
Seattle Community College-North Campus (about 11 miles; Seattle, WA; FT enrollment: 4,220)
Seattle Pacific University (about 11 miles; Seattle, WA; FT enrollment: 3,897)
Olympic College (about 12 miles; Bremerton, WA; FT enrollment: 6,158)
Edmonds Community College (about 13 miles; Lynnwood, WA; FT enrollment: 7,271)
University of Washington-Seattle Campus (about 13 miles; Seattle, WA; FT enrollment: 39,445)
Seattle Central College (about 14 miles; Seattle, WA; FT enrollment: 5,825)
Notable locations in Suquamish: Agate Pass Park and Ride East (A), Agate Pass Park and Ride West (B), Sandy Hook Park (C), Suquamish Wastewater Treatment Plant (D), North Kitsap Fire and Rescue Station 84 Suquamish (E), Suquamish Museum (F). Display/hide their locations on the map
Kitsap County has a predicted average indoor radon screening level less than 2 pCi/L (pico curies per liter) - Low Potential
Average household size:
This place:
2.3 people
Washington:
2.5 people
Percentage of family households:
This place:
61.1%
Whole state:
64.4%
Percentage of households with unmarried partners:
This place:
9.5%
Whole state:
7.7%
Likely homosexual households (counted as self-reported same-sex unmarried-partner households)
Lesbian couples: 0.6% of all households
Gay men: 0.5% of all households
80 people in other noninstitutional facilities in 2010
2 people in hospitals/wards and hospices for chronically ill in 2000
2 people in hospices or homes for chronically ill in 2000
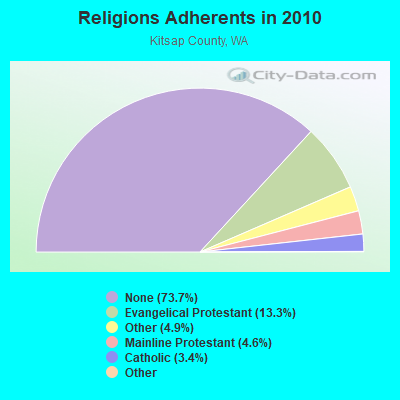
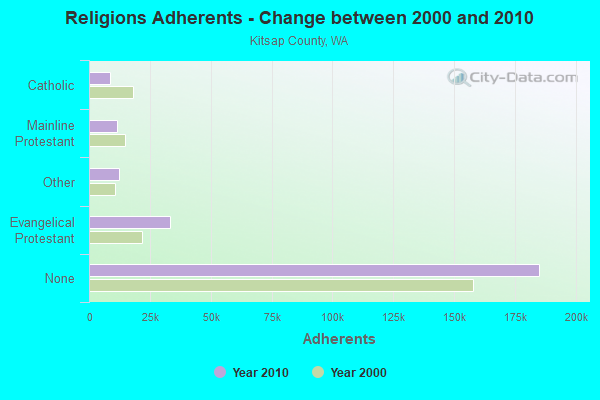
Religion statistics for Suquamish, WA (based on Kitsap County data)
Religion
Adherents
Congregations
Evangelical Protestant
33,373
118
Other
12,378
42
Mainline Protestant
11,484
39
Catholic
8,572
5
Orthodox
140
2
Black Protestant
84
1
None
185,102
-
Source: Clifford Grammich, Kirk Hadaway, Richard Houseal, Dale E.Jones, Alexei Krindatch, Richie Stanley and Richard H.Taylor. 2012. 2010 U.S.Religion Census: Religious Congregations & Membership Study. Association of Statisticians of American Religious Bodies. Jones, Dale E., et al. 2002. Congregations and Membership in the United States 2000. Nashville, TN: Glenmary Research Center. Graphs represent county-level data
Aircraft: TAYLORCRAFT A (Category: Land, Seats: 2, Weight: Up to 12,499 Pounds, Speed: 69 mph), Engine: CONT MOTOR A&C65 SERIES (65 HP) (Reciprocating) N-Number: 19008, N19008, N-19008, Serial Number: 114, Year manufactured: 1937, Certificate Issue Date: 09/15/2014 Registrant (Individual): Allan E Martin, 19901 Columbia St Ne, Suquamish, WA 98392
Aircraft: MCVICKER CHARLES A KOLB FIRESTAR (Category: Land, Weight: Up to 12,499 Pounds), Engine: ROTAX 503ULDCDI (52 HP) (2 Cycle) N-Number: 2030L, N2030L, N-2030L, Serial Number: FS534, Year manufactured: 1997, Airworthiness Date: 08/24/2007, Certificate Issue Date: 10/07/2010 Registrant (Individual): Michael W Hale, 17580 Division Ave, Suquamish, WA 98392
Aircraft: CESSNA 182E (Category: Land, Seats: 4, Weight: Up to 12,499 Pounds, Speed: 119 mph), Engine: CONT MOTOR O-470 SERIES (230 HP) (Reciprocating) N-Number: 3516Y, N3516Y, N-3516Y, Serial Number: 18254416, Year manufactured: 1962, Airworthiness Date: 09/17/1962, Certificate Issue Date: 07/30/2014 Registrant (LLC): Mks Aviation LLC, 17580 Division Ave, Suquamish, WA 98392
Aircraft: KARNES JOHN P CH 601 HDS (Category: Land, Seats: 2, Weight: Up to 12,499 Pounds), Engine: AMA/EXPR UNKNOWN ENG (Reciprocating) N-Number: 601JK, N601JK, N-601JK, Serial Number: 63825, Year manufactured: 2000, Airworthiness Date: 10/29/2000, Certificate Issue Date: 01/17/2018 Registrant (Individual): John P Karnes, 19171 Soundview Blvd Ne, Suquamish, WA 98392
Aircraft: MOONEY M20B (Category: Land, Seats: 4, Weight: Up to 12,499 Pounds, Speed: 127 mph), Engine: LYCOMING O&VO-360 SER (180 HP) (Reciprocating) N-Number: 74711, N74711, N-74711, Serial Number: 1711, Airworthiness Date: 01/28/1961, Certificate Issue Date: 02/12/2015 Registrant (Individual): Robert D Oneill, 18054 Cherry Tree Ln Ne, Suquamish, WA 98392 Deregistered:Cancel Date: 07/12/2018
Home Mortgage Disclosure Act Aggregated Statistics For Year 2009 (Based on 1 partial tract)
A) FHA, FSA/RHS & VA Home Purchase Loans
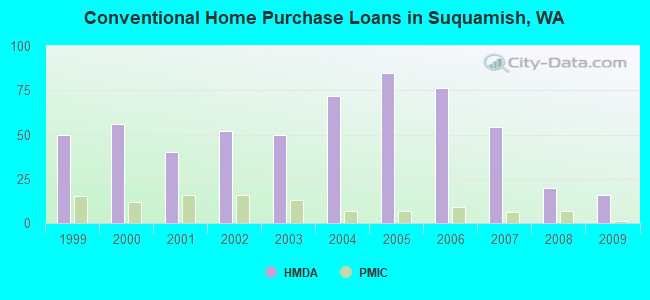
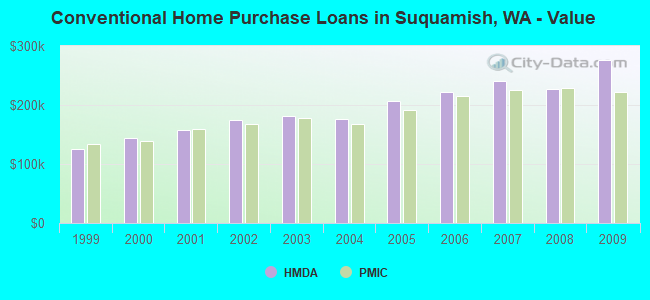
B) Conventional Home Purchase Loans
C) Refinancings
D) Home Improvement Loans
F) Non-occupant Loans on < 5 Family Dwellings (A B C & D)
G) Loans On Manufactured Home Dwelling (A B C & D)
Number
Average Value
Number
Average Value
Number
Average Value
Number
Average Value
Number
Average Value
Number
Average Value
LOANS ORIGINATED
15
$224,843
16
$275,786
113
$238,598
5
$195,146
8
$218,605
7
$184,684
APPLICATIONS APPROVED, NOT ACCEPTED
2
$322,080
2
$194,535
6
$209,790
0
$0
1
$53,590
1
$154,620
APPLICATIONS DENIED
2
$141,225
3
$224,770
32
$259,633
1
$157,970
3
$184,393
2
$121,965
APPLICATIONS WITHDRAWN
2
$217,420
2
$200,395
21
$239,627
0
$0
1
$188,110
2
$141,225
FILES CLOSED FOR INCOMPLETENESS
1
$65,870
0
$0
8
$225,304
1
$55,820
1
$89,310
1
$70,330
Aggregated Statistics For Year 2008 (Based on 1 partial tract)
A) FHA, FSA/RHS & VA Home Purchase Loans
B) Conventional Home Purchase Loans
C) Refinancings
D) Home Improvement Loans
F) Non-occupant Loans on < 5 Family Dwellings (A B C & D)
G) Loans On Manufactured Home Dwelling (A B C & D)
Number
Average Value
Number
Average Value
Number
Average Value
Number
Average Value
Number
Average Value
Number
Average Value
LOANS ORIGINATED
8
$211,349
20
$226,685
70
$243,702
9
$147,923
10
$201,343
8
$205,906
APPLICATIONS APPROVED, NOT ACCEPTED
1
$199,840
2
$280,215
15
$232,807
1
$11,160
3
$204,487
1
$207,650
APPLICATIONS DENIED
2
$148,480
2
$201,790
32
$223,524
5
$155,626
1
$97,690
3
$168,390
APPLICATIONS WITHDRAWN
0
$0
3
$200,023
22
$249,769
2
$134,805
1
$347,760
3
$135,643
FILES CLOSED FOR INCOMPLETENESS
0
$0
1
$111,640
3
$384,413
0
$0
1
$92,100
0
$0
Aggregated Statistics For Year 2007 (Based on 1 partial tract)
A) FHA, FSA/RHS & VA Home Purchase Loans
B) Conventional Home Purchase Loans
C) Refinancings
D) Home Improvement Loans
F) Non-occupant Loans on < 5 Family Dwellings (A B C & D)
G) Loans On Manufactured Home Dwelling (A B C & D)
Number
Average Value
Number
Average Value
Number
Average Value
Number
Average Value
Number
Average Value
Number
Average Value
LOANS ORIGINATED
6
$252,307
54
$240,367
94
$255,935
8
$127,479
20
$238,324
11
$156,753
APPLICATIONS APPROVED, NOT ACCEPTED
0
$0
4
$128,945
23
$223,377
2
$127,550
3
$237,793
2
$84,010
APPLICATIONS DENIED
1
$231,090
7
$117,780
52
$251,136
8
$68,799
7
$174,159
6
$140,480
APPLICATIONS WITHDRAWN
1
$264,590
4
$294,870
18
$239,716
2
$259,285
2
$250,630
2
$117,500
FILES CLOSED FOR INCOMPLETENESS
0
$0
3
$225,327
6
$221,420
1
$61,400
2
$163,555
0
$0
Aggregated Statistics For Year 2006 (Based on 1 partial tract)
A) FHA, FSA/RHS & VA Home Purchase Loans
B) Conventional Home Purchase Loans
C) Refinancings
D) Home Improvement Loans
F) Non-occupant Loans on < 5 Family Dwellings (A B C & D)
G) Loans On Manufactured Home Dwelling (A B C & D)
Number
Average Value
Number
Average Value
Number
Average Value
Number
Average Value
Number
Average Value
Number
Average Value
LOANS ORIGINATED
8
$183,160
76
$222,237
100
$197,184
13
$142,771
17
$201,707
14
$152,668
APPLICATIONS APPROVED, NOT ACCEPTED
0
$0
7
$176,950
14
$212,116
3
$95,267
3
$155,367
1
$89,310
APPLICATIONS DENIED
3
$149,970
15
$194,253
47
$177,888
12
$78,892
4
$242,260
6
$100,477
APPLICATIONS WITHDRAWN
1
$127,830
9
$205,790
30
$199,910
6
$107,918
3
$142,713
4
$170,670
FILES CLOSED FOR INCOMPLETENESS
1
$85,400
1
$157,970
5
$209,102
2
$112,755
1
$152,390
1
$186,440
Aggregated Statistics For Year 2005 (Based on 1 partial tract)
A) FHA, FSA/RHS & VA Home Purchase Loans
B) Conventional Home Purchase Loans
C) Refinancings
D) Home Improvement Loans
F) Non-occupant Loans on < 5 Family Dwellings (A B C & D)
G) Loans On Manufactured Home Dwelling (A B C & D)
Number
Average Value
Number
Average Value
Number
Average Value
Number
Average Value
Number
Average Value
Number
Average Value
LOANS ORIGINATED
4
$194,115
85
$206,002
115
$199,651
17
$125,825
31
$184,260
16
$129,049
APPLICATIONS APPROVED, NOT ACCEPTED
0
$0
10
$169,972
25
$182,956
2
$112,755
1
$356,130
3
$97,870
APPLICATIONS DENIED
0
$0
16
$101,034
61
$154,814
12
$49,122
7
$155,737
12
$91,033
APPLICATIONS WITHDRAWN
2
$146,805
9
$322,143
44
$157,260
4
$233,048
4
$239,608
2
$140,665
FILES CLOSED FOR INCOMPLETENESS
0
$0
1
$184,210
9
$190,594
1
$50,800
1
$72,010
1
$68,660
Aggregated Statistics For Year 2004 (Based on 1 partial tract)
A) FHA, FSA/RHS & VA Home Purchase Loans
B) Conventional Home Purchase Loans
C) Refinancings
D) Home Improvement Loans
F) Non-occupant Loans on < 5 Family Dwellings (A B C & D)
G) Loans On Manufactured Home Dwelling (A B C & D)
Number
Average Value
Number
Average Value
Number
Average Value
Number
Average Value
Number
Average Value
Number
Average Value
LOANS ORIGINATED
8
$156,785
72
$176,546
116
$166,844
12
$54,424
19
$139,521
16
$112,303
APPLICATIONS APPROVED, NOT ACCEPTED
0
$0
4
$134,525
20
$140,555
2
$47,725
1
$150,160
4
$147,782
APPLICATIONS DENIED
1
$176,390
11
$123,717
51
$137,372
11
$47,650
7
$94,017
9
$114,307
APPLICATIONS WITHDRAWN
0
$0
7
$163,633
42
$165,932
4
$119,735
2
$168,575
2
$97,685
FILES CLOSED FOR INCOMPLETENESS
0
$0
0
$0
12
$207,743
1
$22,330
1
$75,360
3
$146,433
Aggregated Statistics For Year 2003 (Based on 1 partial tract)
A) FHA, FSA/RHS & VA Home Purchase Loans
B) Conventional Home Purchase Loans
C) Refinancings
D) Home Improvement Loans
F) Non-occupant Loans on < 5 Family Dwellings (A B C & D)
Number
Average Value
Number
Average Value
Number
Average Value
Number
Average Value
Number
Average Value
LOANS ORIGINATED
11
$161,574
50
$182,063
255
$153,030
6
$39,818
27
$137,937
APPLICATIONS APPROVED, NOT ACCEPTED
1
$98,240
8
$133,410
30
$131,679
2
$18,700
3
$81,870
APPLICATIONS DENIED
1
$68,100
9
$134,960
60
$151,263
6
$63,635
3
$126,527
APPLICATIONS WITHDRAWN
1
$26,790
6
$103,825
59
$166,996
1
$26,240
2
$254,260
FILES CLOSED FOR INCOMPLETENESS
1
$75,920
3
$184,950
13
$136,630
0
$0
2
$122,245
Aggregated Statistics For Year 2002 (Based on 1 partial tract)
A) FHA, FSA/RHS & VA Home Purchase Loans
B) Conventional Home Purchase Loans
C) Refinancings
D) Home Improvement Loans
F) Non-occupant Loans on < 5 Family Dwellings (A B C & D)
Number
Average Value
Number
Average Value
Number
Average Value
Number
Average Value
Number
Average Value
LOANS ORIGINATED
16
$145,795
52
$174,545
156
$163,531
8
$23,794
16
$139,062
APPLICATIONS APPROVED, NOT ACCEPTED
1
$174,720
7
$155,659
23
$163,213
4
$18,700
1
$77,590
APPLICATIONS DENIED
0
$0
7
$70,413
44
$134,146
6
$48,657
3
$209,883
APPLICATIONS WITHDRAWN
1
$63,080
7
$192,899
31
$139,982
2
$50,240
3
$132,107
FILES CLOSED FOR INCOMPLETENESS
1
$75,920
1
$50,240
8
$179,321
1
$49,680
1
$117,780
Aggregated Statistics For Year 2001 (Based on 1 partial tract)
A) FHA, FSA/RHS & VA Home Purchase Loans
B) Conventional Home Purchase Loans
C) Refinancings
D) Home Improvement Loans
F) Non-occupant Loans on < 5 Family Dwellings (A B C & D)
Number
Average Value
Number
Average Value
Number
Average Value
Number
Average Value
Number
Average Value
LOANS ORIGINATED
16
$120,955
40
$157,036
123
$144,102
11
$22,886
11
$115,243
APPLICATIONS APPROVED, NOT ACCEPTED
1
$127,830
4
$131,318
12
$170,623
2
$46,050
1
$69,780
APPLICATIONS DENIED
1
$103,830
6
$125,037
29
$142,168
6
$22,513
2
$142,340
APPLICATIONS WITHDRAWN
3
$93,220
8
$140,526
25
$136,781
1
$3,350
1
$275,750
FILES CLOSED FOR INCOMPLETENESS
2
$88,195
0
$0
6
$123,177
0
$0
1
$26,790
Aggregated Statistics For Year 2000 (Based on 1 partial tract)
A) FHA, FSA/RHS & VA Home Purchase Loans
B) Conventional Home Purchase Loans
C) Refinancings
D) Home Improvement Loans
F) Non-occupant Loans on < 5 Family Dwellings (A B C & D)
Number
Average Value
Number
Average Value
Number
Average Value
Number
Average Value
Number
Average Value
LOANS ORIGINATED
11
$132,141
56
$144,544
33
$129,113
8
$13,955
8
$132,712
APPLICATIONS APPROVED, NOT ACCEPTED
1
$49,680
6
$123,177
8
$132,224
3
$33,120
1
$41,310
APPLICATIONS DENIED
1
$69,780
9
$150,156
26
$92,575
6
$24,282
2
$50,515
APPLICATIONS WITHDRAWN
1
$75,360
4
$182,112
8
$121,269
3
$17,863
0
$0
FILES CLOSED FOR INCOMPLETENESS
1
$113,310
1
$150,710
8
$139,271
1
$5,580
1
$110,520
Aggregated Statistics For Year 1999 (Based on 1 partial tract)
A) FHA, FSA/RHS & VA Home Purchase Loans
B) Conventional Home Purchase Loans
C) Refinancings
D) Home Improvement Loans
F) Non-occupant Loans on < 5 Family Dwellings (A B C & D)
Detailed PMIC statistics for the following Tracts:0906.01
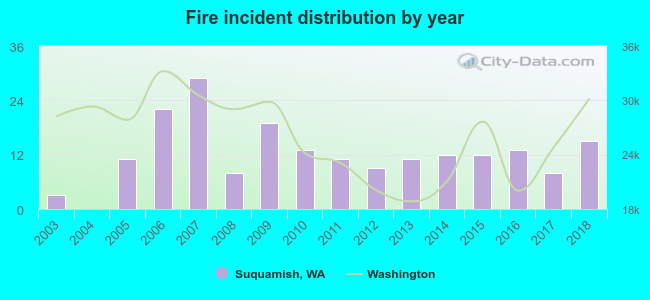
2003 - 2018 National Fire Incident Reporting System (NFIRS) incidents
According to the data from the years 2003 - 2018 the average number of fires per year is 12. The highest number of reported fires - 29 took place in 2007, and the least - 0 in 2004. The data has an increasing trend.
When looking into fire subcategories, the most reports belonged to: Structure Fires (47.4%), and Outside Fires (37.8%).
Fire incident types reported to NFIRS in Suquamish, WA


 Recent articles from our blog. Our writers, many of them Ph.D. graduates or candidates, create easy-to-read articles on a wide variety of topics.

 (10.6 miles
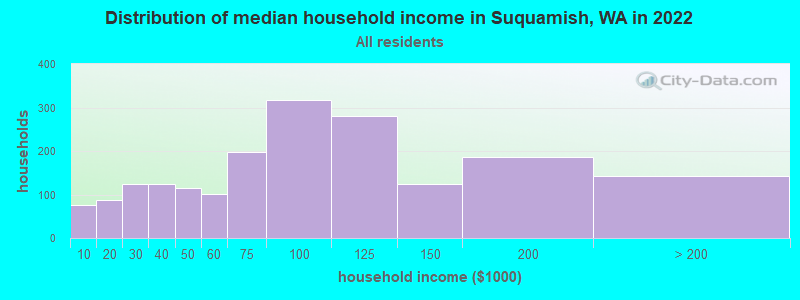


 According to the data from the years 2003 - 2018 the average number of fires per year is 12. The highest number of reported fires - 29 took place in 2007, and the least - 0 in 2004. The data has an increasing trend.
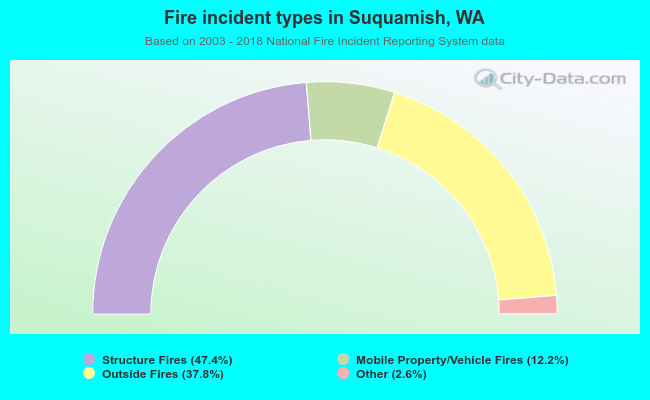 When looking into fire subcategories, the most reports belonged to: Structure Fires (47.4%), and Outside Fires (37.8%).