Somers Point, New Jersey Submit your own pictures of this city and show them to the world
OSM Map
General Map
Google Map
MSN Map
OSM Map
General Map
Google Map
MSN Map
OSM Map
General Map
Google Map
MSN Map
OSM Map
General Map
Google Map
MSN Map
Please wait while loading the map...
Population in 2022: 10,495 (100% urban, 0% rural). Population change since 2000: -9.6%Males: 5,186 Females: 5,309
March 2022 cost of living index in Somers Point: 103.3 (near average, U.S. average is 100) Percentage of residents living in poverty in 2022: 11.3%for White Non-Hispanic residents , 19.2% for Black residents , 27.7% for Hispanic or Latino residents , 26.9% for other race residents , 13.2% for two or more races residents )
Profiles of local businesses
Business Search - 14 Million verified businesses
Data:
Median household income ($)
Median household income (% change since 2000)
Household income diversity
Ratio of average income to average house value (%)
Ratio of average income to average rent
Median household income ($) - White
Median household income ($) - Black or African American
Median household income ($) - Asian
Median household income ($) - Hispanic or Latino
Median household income ($) - American Indian and Alaska Native
Median household income ($) - Multirace
Median household income ($) - Other Race
Median household income for houses/condos with a mortgage ($)
Median household income for apartments without a mortgage ($)
Races - White alone (%)
Races - White alone (% change since 2000)
Races - Black alone (%)
Races - Black alone (% change since 2000)
Races - American Indian alone (%)
Races - American Indian alone (% change since 2000)
Races - Asian alone (%)
Races - Asian alone (% change since 2000)
Races - Hispanic (%)
Races - Hispanic (% change since 2000)
Races - Native Hawaiian and Other Pacific Islander alone (%)
Races - Native Hawaiian and Other Pacific Islander alone (% change since 2000)
Races - Two or more races (%)
Races - Two or more races (% change since 2000)
Races - Other race alone (%)
Races - Other race alone (% change since 2000)
Racial diversity
Unemployment (%)
Unemployment (% change since 2000)
Unemployment (%) - White
Unemployment (%) - Black or African American
Unemployment (%) - Asian
Unemployment (%) - Hispanic or Latino
Unemployment (%) - American Indian and Alaska Native
Unemployment (%) - Multirace
Unemployment (%) - Other Race
Population density (people per square mile)
Population - Males (%)
Population - Females (%)
Population - Males (%) - White
Population - Males (%) - Black or African American
Population - Males (%) - Asian
Population - Males (%) - Hispanic or Latino
Population - Males (%) - American Indian and Alaska Native
Population - Males (%) - Multirace
Population - Males (%) - Other Race
Population - Females (%) - White
Population - Females (%) - Black or African American
Population - Females (%) - Asian
Population - Females (%) - Hispanic or Latino
Population - Females (%) - American Indian and Alaska Native
Population - Females (%) - Multirace
Population - Females (%) - Other Race
Coronavirus confirmed cases (May 11, 2024)
Deaths caused by coronavirus (May 11, 2024)
Coronavirus confirmed cases (per 100k population) (May 11, 2024)
Deaths caused by coronavirus (per 100k population) (May 11, 2024)
Daily increase in number of cases (May 11, 2024)
Weekly increase in number of cases (May 11, 2024)
Cases doubled (in days) (May 11, 2024)
Hospitalized patients (Apr 18, 2022)
Negative test results (Apr 18, 2022)
Total test results (Apr 18, 2022)
COVID Vaccine doses distributed (per 100k population) (Sep 19, 2023)
COVID Vaccine doses administered (per 100k population) (Sep 19, 2023)
COVID Vaccine doses distributed (Sep 19, 2023)
COVID Vaccine doses administered (Sep 19, 2023)
Likely homosexual households (%)
Likely homosexual households (% change since 2000)
Likely homosexual households - Lesbian couples (%)
Likely homosexual households - Lesbian couples (% change since 2000)
Likely homosexual households - Gay men (%)
Likely homosexual households - Gay men (% change since 2000)
Cost of living index
Median gross rent ($)
Median contract rent ($)
Median monthly housing costs ($)
Median house or condo value ($)
Median house or condo value ($ change since 2000)
Mean house or condo value by units in structure - 1, detached ($)
Mean house or condo value by units in structure - 1, attached ($)
Mean house or condo value by units in structure - 2 ($)
Mean house or condo value by units in structure by units in structure - 3 or 4 ($)
Mean house or condo value by units in structure - 5 or more ($)
Mean house or condo value by units in structure - Boat, RV, van, etc. ($)
Mean house or condo value by units in structure - Mobile home ($)
Median house or condo value ($) - White
Median house or condo value ($) - Black or African American
Median house or condo value ($) - Asian
Median house or condo value ($) - Hispanic or Latino
Median house or condo value ($) - American Indian and Alaska Native
Median house or condo value ($) - Multirace
Median house or condo value ($) - Other Race
Median resident age
Resident age diversity
Median resident age - Males
Median resident age - Females
Median resident age - White
Median resident age - Black or African American
Median resident age - Asian
Median resident age - Hispanic or Latino
Median resident age - American Indian and Alaska Native
Median resident age - Multirace
Median resident age - Other Race
Median resident age - Males - White
Median resident age - Males - Black or African American
Median resident age - Males - Asian
Median resident age - Males - Hispanic or Latino
Median resident age - Males - American Indian and Alaska Native
Median resident age - Males - Multirace
Median resident age - Males - Other Race
Median resident age - Females - White
Median resident age - Females - Black or African American
Median resident age - Females - Asian
Median resident age - Females - Hispanic or Latino
Median resident age - Females - American Indian and Alaska Native
Median resident age - Females - Multirace
Median resident age - Females - Other Race
Commute - mean travel time to work (minutes)
Travel time to work - Less than 5 minutes (%)
Travel time to work - Less than 5 minutes (% change since 2000)
Travel time to work - 5 to 9 minutes (%)
Travel time to work - 5 to 9 minutes (% change since 2000)
Travel time to work - 10 to 19 minutes (%)
Travel time to work - 10 to 19 minutes (% change since 2000)
Travel time to work - 20 to 29 minutes (%)
Travel time to work - 20 to 29 minutes (% change since 2000)
Travel time to work - 30 to 39 minutes (%)
Travel time to work - 30 to 39 minutes (% change since 2000)
Travel time to work - 40 to 59 minutes (%)
Travel time to work - 40 to 59 minutes (% change since 2000)
Travel time to work - 60 to 89 minutes (%)
Travel time to work - 60 to 89 minutes (% change since 2000)
Travel time to work - 90 or more minutes (%)
Travel time to work - 90 or more minutes (% change since 2000)
Marital status - Never married (%)
Marital status - Now married (%)
Marital status - Separated (%)
Marital status - Widowed (%)
Marital status - Divorced (%)
Median family income ($)
Median family income (% change since 2000)
Median non-family income ($)
Median non-family income (% change since 2000)
Median per capita income ($)
Median per capita income (% change since 2000)
Median family income ($) - White
Median family income ($) - Black or African American
Median family income ($) - Asian
Median family income ($) - Hispanic or Latino
Median family income ($) - American Indian and Alaska Native
Median family income ($) - Multirace
Median family income ($) - Other Race
Median year house/condo built
Median year apartment built
Year house built - Built 2005 or later (%)
Year house built - Built 2000 to 2004 (%)
Year house built - Built 1990 to 1999 (%)
Year house built - Built 1980 to 1989 (%)
Year house built - Built 1970 to 1979 (%)
Year house built - Built 1960 to 1969 (%)
Year house built - Built 1950 to 1959 (%)
Year house built - Built 1940 to 1949 (%)
Year house built - Built 1939 or earlier (%)
Average household size
Household density (households per square mile)
Average household size - White
Average household size - Black or African American
Average household size - Asian
Average household size - Hispanic or Latino
Average household size - American Indian and Alaska Native
Average household size - Multirace
Average household size - Other Race
Occupied housing units (%)
Vacant housing units (%)
Owner occupied housing units (%)
Renter occupied housing units (%)
Vacancy status - For rent (%)
Vacancy status - For sale only (%)
Vacancy status - Rented or sold, not occupied (%)
Vacancy status - For seasonal, recreational, or occasional use (%)
Vacancy status - For migrant workers (%)
Vacancy status - Other vacant (%)
Residents with income below the poverty level (%)
Residents with income below 50% of the poverty level (%)
Children below poverty level (%)
Poor families by family type - Married-couple family (%)
Poor families by family type - Male, no wife present (%)
Poor families by family type - Female, no husband present (%)
Poverty status for native-born residents (%)
Poverty status for foreign-born residents (%)
Poverty among high school graduates not in families (%)
Poverty among people who did not graduate high school not in families (%)
Residents with income below the poverty level (%) - White
Residents with income below the poverty level (%) - Black or African American
Residents with income below the poverty level (%) - Asian
Residents with income below the poverty level (%) - Hispanic or Latino
Residents with income below the poverty level (%) - American Indian and Alaska Native
Residents with income below the poverty level (%) - Multirace
Residents with income below the poverty level (%) - Other Race
Air pollution - Air Quality Index (AQI)
Air pollution - CO
Air pollution - NO2
Air pollution - SO2
Air pollution - Ozone
Air pollution - PM10
Air pollution - PM25
Air pollution - Pb
Crime - Murders per 100,000 population
Crime - Rapes per 100,000 population
Crime - Robberies per 100,000 population
Crime - Assaults per 100,000 population
Crime - Burglaries per 100,000 population
Crime - Thefts per 100,000 population
Crime - Auto thefts per 100,000 population
Crime - Arson per 100,000 population
Crime - City-data.com crime index
Crime - Violent crime index
Crime - Property crime index
Crime - Murders per 100,000 population (5 year average)
Crime - Rapes per 100,000 population (5 year average)
Crime - Robberies per 100,000 population (5 year average)
Crime - Assaults per 100,000 population (5 year average)
Crime - Burglaries per 100,000 population (5 year average)
Crime - Thefts per 100,000 population (5 year average)
Crime - Auto thefts per 100,000 population (5 year average)
Crime - Arson per 100,000 population (5 year average)
Crime - City-data.com crime index (5 year average)
Crime - Violent crime index (5 year average)
Crime - Property crime index (5 year average)
1996 Presidential Elections Results (%) - Democratic Party (Clinton)
1996 Presidential Elections Results (%) - Republican Party (Dole)
1996 Presidential Elections Results (%) - Other
2000 Presidential Elections Results (%) - Democratic Party (Gore)
2000 Presidential Elections Results (%) - Republican Party (Bush)
2000 Presidential Elections Results (%) - Other
2004 Presidential Elections Results (%) - Democratic Party (Kerry)
2004 Presidential Elections Results (%) - Republican Party (Bush)
2004 Presidential Elections Results (%) - Other
2008 Presidential Elections Results (%) - Democratic Party (Obama)
2008 Presidential Elections Results (%) - Republican Party (McCain)
2008 Presidential Elections Results (%) - Other
2012 Presidential Elections Results (%) - Democratic Party (Obama)
2012 Presidential Elections Results (%) - Republican Party (Romney)
2012 Presidential Elections Results (%) - Other
2016 Presidential Elections Results (%) - Democratic Party (Clinton)
2016 Presidential Elections Results (%) - Republican Party (Trump)
2016 Presidential Elections Results (%) - Other
2020 Presidential Elections Results (%) - Democratic Party (Biden)
2020 Presidential Elections Results (%) - Republican Party (Trump)
2020 Presidential Elections Results (%) - Other
Ancestries Reported - Arab (%)
Ancestries Reported - Czech (%)
Ancestries Reported - Danish (%)
Ancestries Reported - Dutch (%)
Ancestries Reported - English (%)
Ancestries Reported - French (%)
Ancestries Reported - French Canadian (%)
Ancestries Reported - German (%)
Ancestries Reported - Greek (%)
Ancestries Reported - Hungarian (%)
Ancestries Reported - Irish (%)
Ancestries Reported - Italian (%)
Ancestries Reported - Lithuanian (%)
Ancestries Reported - Norwegian (%)
Ancestries Reported - Polish (%)
Ancestries Reported - Portuguese (%)
Ancestries Reported - Russian (%)
Ancestries Reported - Scotch-Irish (%)
Ancestries Reported - Scottish (%)
Ancestries Reported - Slovak (%)
Ancestries Reported - Subsaharan African (%)
Ancestries Reported - Swedish (%)
Ancestries Reported - Swiss (%)
Ancestries Reported - Ukrainian (%)
Ancestries Reported - United States (%)
Ancestries Reported - Welsh (%)
Ancestries Reported - West Indian (%)
Ancestries Reported - Other (%)
Educational Attainment - No schooling completed (%)
Educational Attainment - Less than high school (%)
Educational Attainment - High school or equivalent (%)
Educational Attainment - Less than 1 year of college (%)
Educational Attainment - 1 or more years of college (%)
Educational Attainment - Associate degree (%)
Educational Attainment - Bachelor's degree (%)
Educational Attainment - Master's degree (%)
Educational Attainment - Professional school degree (%)
Educational Attainment - Doctorate degree (%)
School Enrollment - Nursery, preschool (%)
School Enrollment - Kindergarten (%)
School Enrollment - Grade 1 to 4 (%)
School Enrollment - Grade 5 to 8 (%)
School Enrollment - Grade 9 to 12 (%)
School Enrollment - College undergrad (%)
School Enrollment - Graduate or professional (%)
School Enrollment - Not enrolled in school (%)
School enrollment - Public schools (%)
School enrollment - Private schools (%)
School enrollment - Not enrolled (%)
Median number of rooms in houses and condos
Median number of rooms in apartments
Housing units lacking complete plumbing facilities (%)
Housing units lacking complete kitchen facilities (%)
Density of houses
Urban houses (%)
Rural houses (%)
Households with people 60 years and over (%)
Households with people 65 years and over (%)
Households with people 75 years and over (%)
Households with one or more nonrelatives (%)
Households with no nonrelatives (%)
Population in households (%)
Family households (%)
Nonfamily households (%)
Population in families (%)
Family households with own children (%)
Median number of bedrooms in owner occupied houses
Mean number of bedrooms in owner occupied houses
Median number of bedrooms in renter occupied houses
Mean number of bedrooms in renter occupied houses
Median number of vehichles in owner occupied houses
Mean number of vehichles in owner occupied houses
Median number of vehichles in renter occupied houses
Mean number of vehichles in renter occupied houses
Mortgage status - with mortgage (%)
Mortgage status - with second mortgage (%)
Mortgage status - with home equity loan (%)
Mortgage status - with both second mortgage and home equity loan (%)
Mortgage status - without a mortgage (%)
Average family size
Average family size - White
Average family size - Black or African American
Average family size - Asian
Average family size - Hispanic or Latino
Average family size - American Indian and Alaska Native
Average family size - Multirace
Average family size - Other Race
Geographical mobility - Same house 1 year ago (%)
Geographical mobility - Moved within same county (%)
Geographical mobility - Moved from different county within same state (%)
Geographical mobility - Moved from different state (%)
Geographical mobility - Moved from abroad (%)
Place of birth - Born in state of residence (%)
Place of birth - Born in other state (%)
Place of birth - Native, outside of US (%)
Place of birth - Foreign born (%)
Housing units in structures - 1, detached (%)
Housing units in structures - 1, attached (%)
Housing units in structures - 2 (%)
Housing units in structures - 3 or 4 (%)
Housing units in structures - 5 to 9 (%)
Housing units in structures - 10 to 19 (%)
Housing units in structures - 20 to 49 (%)
Housing units in structures - 50 or more (%)
Housing units in structures - Mobile home (%)
Housing units in structures - Boat, RV, van, etc. (%)
House/condo owner moved in on average (years ago)
Renter moved in on average (years ago)
Year householder moved into unit - Moved in 1999 to March 2000 (%)
Year householder moved into unit - Moved in 1995 to 1998 (%)
Year householder moved into unit - Moved in 1990 to 1994 (%)
Year householder moved into unit - Moved in 1980 to 1989 (%)
Year householder moved into unit - Moved in 1970 to 1979 (%)
Year householder moved into unit - Moved in 1969 or earlier (%)
Means of transportation to work - Drove car alone (%)
Means of transportation to work - Carpooled (%)
Means of transportation to work - Public transportation (%)
Means of transportation to work - Bus or trolley bus (%)
Means of transportation to work - Streetcar or trolley car (%)
Means of transportation to work - Subway or elevated (%)
Means of transportation to work - Railroad (%)
Means of transportation to work - Ferryboat (%)
Means of transportation to work - Taxicab (%)
Means of transportation to work - Motorcycle (%)
Means of transportation to work - Bicycle (%)
Means of transportation to work - Walked (%)
Means of transportation to work - Other means (%)
Working at home (%)
Industry diversity
Most Common Industries - Agriculture, forestry, fishing and hunting, and mining (%)
Most Common Industries - Agriculture, forestry, fishing and hunting (%)
Most Common Industries - Mining, quarrying, and oil and gas extraction (%)
Most Common Industries - Construction (%)
Most Common Industries - Manufacturing (%)
Most Common Industries - Wholesale trade (%)
Most Common Industries - Retail trade (%)
Most Common Industries - Transportation and warehousing, and utilities (%)
Most Common Industries - Transportation and warehousing (%)
Most Common Industries - Utilities (%)
Most Common Industries - Information (%)
Most Common Industries - Finance and insurance, and real estate and rental and leasing (%)
Most Common Industries - Finance and insurance (%)
Most Common Industries - Real estate and rental and leasing (%)
Most Common Industries - Professional, scientific, and management, and administrative and waste management services (%)
Most Common Industries - Professional, scientific, and technical services (%)
Most Common Industries - Management of companies and enterprises (%)
Most Common Industries - Administrative and support and waste management services (%)
Most Common Industries - Educational services, and health care and social assistance (%)
Most Common Industries - Educational services (%)
Most Common Industries - Health care and social assistance (%)
Most Common Industries - Arts, entertainment, and recreation, and accommodation and food services (%)
Most Common Industries - Arts, entertainment, and recreation (%)
Most Common Industries - Accommodation and food services (%)
Most Common Industries - Other services, except public administration (%)
Most Common Industries - Public administration (%)
Occupation diversity
Most Common Occupations - Management, business, science, and arts occupations (%)
Most Common Occupations - Management, business, and financial occupations (%)
Most Common Occupations - Management occupations (%)
Most Common Occupations - Business and financial operations occupations (%)
Most Common Occupations - Computer, engineering, and science occupations (%)
Most Common Occupations - Computer and mathematical occupations (%)
Most Common Occupations - Architecture and engineering occupations (%)
Most Common Occupations - Life, physical, and social science occupations (%)
Most Common Occupations - Education, legal, community service, arts, and media occupations (%)
Most Common Occupations - Community and social service occupations (%)
Most Common Occupations - Legal occupations (%)
Most Common Occupations - Education, training, and library occupations (%)
Most Common Occupations - Arts, design, entertainment, sports, and media occupations (%)
Most Common Occupations - Healthcare practitioners and technical occupations (%)
Most Common Occupations - Health diagnosing and treating practitioners and other technical occupations (%)
Most Common Occupations - Health technologists and technicians (%)
Most Common Occupations - Service occupations (%)
Most Common Occupations - Healthcare support occupations (%)
Most Common Occupations - Protective service occupations (%)
Most Common Occupations - Fire fighting and prevention, and other protective service workers including supervisors (%)
Most Common Occupations - Law enforcement workers including supervisors (%)
Most Common Occupations - Food preparation and serving related occupations (%)
Most Common Occupations - Building and grounds cleaning and maintenance occupations (%)
Most Common Occupations - Personal care and service occupations (%)
Most Common Occupations - Sales and office occupations (%)
Most Common Occupations - Sales and related occupations (%)
Most Common Occupations - Office and administrative support occupations (%)
Most Common Occupations - Natural resources, construction, and maintenance occupations (%)
Most Common Occupations - Farming, fishing, and forestry occupations (%)
Most Common Occupations - Construction and extraction occupations (%)
Most Common Occupations - Installation, maintenance, and repair occupations (%)
Most Common Occupations - Production, transportation, and material moving occupations (%)
Most Common Occupations - Production occupations (%)
Most Common Occupations - Transportation occupations (%)
Most Common Occupations - Material moving occupations (%)
People in Group quarters - Institutionalized population (%)
People in Group quarters - Correctional institutions (%)
People in Group quarters - Federal prisons and detention centers (%)
People in Group quarters - Halfway houses (%)
People in Group quarters - Local jails and other confinement facilities (including police lockups) (%)
People in Group quarters - Military disciplinary barracks (%)
People in Group quarters - State prisons (%)
People in Group quarters - Other types of correctional institutions (%)
People in Group quarters - Nursing homes (%)
People in Group quarters - Hospitals/wards, hospices, and schools for the handicapped (%)
People in Group quarters - Hospitals/wards and hospices for chronically ill (%)
People in Group quarters - Hospices or homes for chronically ill (%)
People in Group quarters - Military hospitals or wards for chronically ill (%)
People in Group quarters - Other hospitals or wards for chronically ill (%)
People in Group quarters - Hospitals or wards for drug/alcohol abuse (%)
People in Group quarters - Mental (Psychiatric) hospitals or wards (%)
People in Group quarters - Schools, hospitals, or wards for the mentally retarded (%)
People in Group quarters - Schools, hospitals, or wards for the physically handicapped (%)
People in Group quarters - Institutions for the deaf (%)
People in Group quarters - Institutions for the blind (%)
People in Group quarters - Orthopedic wards and institutions for the physically handicapped (%)
People in Group quarters - Wards in general hospitals for patients who have no usual home elsewhere (%)
People in Group quarters - Wards in military hospitals for patients who have no usual home elsewhere (%)
People in Group quarters - Juvenile institutions (%)
People in Group quarters - Long-term care (%)
People in Group quarters - Homes for abused, dependent, and neglected children (%)
People in Group quarters - Residential treatment centers for emotionally disturbed children (%)
People in Group quarters - Training schools for juvenile delinquents (%)
People in Group quarters - Short-term care, detention or diagnostic centers for delinquent children (%)
People in Group quarters - Type of juvenile institution unknown (%)
People in Group quarters - Noninstitutionalized population (%)
People in Group quarters - College dormitories (includes college quarters off campus) (%)
People in Group quarters - Military quarters (%)
People in Group quarters - On base (%)
People in Group quarters - Barracks, unaccompanied personnel housing (UPH), (Enlisted/Officer), ;and similar group living quarters for military personnel (%)
People in Group quarters - Transient quarters for temporary residents (%)
People in Group quarters - Military ships (%)
People in Group quarters - Group homes (%)
People in Group quarters - Homes or halfway houses for drug/alcohol abuse (%)
People in Group quarters - Homes for the mentally ill (%)
People in Group quarters - Homes for the mentally retarded (%)
People in Group quarters - Homes for the physically handicapped (%)
People in Group quarters - Other group homes (%)
People in Group quarters - Religious group quarters (%)
People in Group quarters - Dormitories (%)
People in Group quarters - Agriculture workers' dormitories on farms (%)
People in Group quarters - Job Corps and vocational training facilities (%)
People in Group quarters - Other workers' dormitories (%)
People in Group quarters - Crews of maritime vessels (%)
People in Group quarters - Other nonhousehold living situations (%)
People in Group quarters - Other noninstitutional group quarters (%)
Residents speaking English at home (%)
Residents speaking English at home - Born in the United States (%)
Residents speaking English at home - Native, born elsewhere (%)
Residents speaking English at home - Foreign born (%)
Residents speaking Spanish at home (%)
Residents speaking Spanish at home - Born in the United States (%)
Residents speaking Spanish at home - Native, born elsewhere (%)
Residents speaking Spanish at home - Foreign born (%)
Residents speaking other language at home (%)
Residents speaking other language at home - Born in the United States (%)
Residents speaking other language at home - Native, born elsewhere (%)
Residents speaking other language at home - Foreign born (%)
Class of Workers - Employee of private company (%)
Class of Workers - Self-employed in own incorporated business (%)
Class of Workers - Private not-for-profit wage and salary workers (%)
Class of Workers - Local government workers (%)
Class of Workers - State government workers (%)
Class of Workers - Federal government workers (%)
Class of Workers - Self-employed workers in own not incorporated business and Unpaid family workers (%)
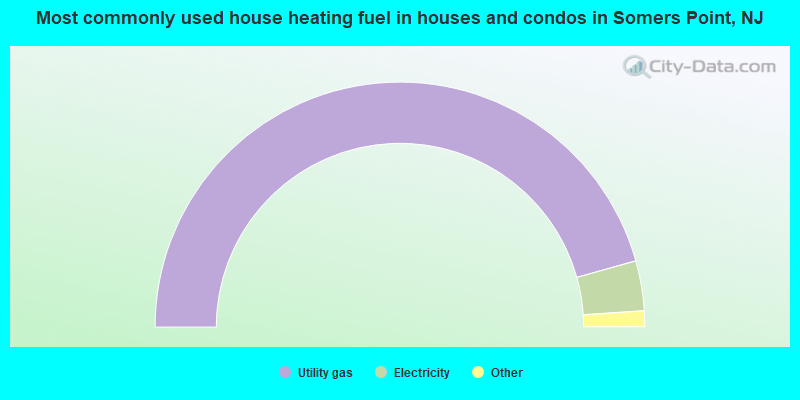
House heating fuel used in houses and condos - Utility gas (%)
House heating fuel used in houses and condos - Bottled, tank, or LP gas (%)
House heating fuel used in houses and condos - Electricity (%)
House heating fuel used in houses and condos - Fuel oil, kerosene, etc. (%)
House heating fuel used in houses and condos - Coal or coke (%)
House heating fuel used in houses and condos - Wood (%)
House heating fuel used in houses and condos - Solar energy (%)
House heating fuel used in houses and condos - Other fuel (%)
House heating fuel used in houses and condos - No fuel used (%)
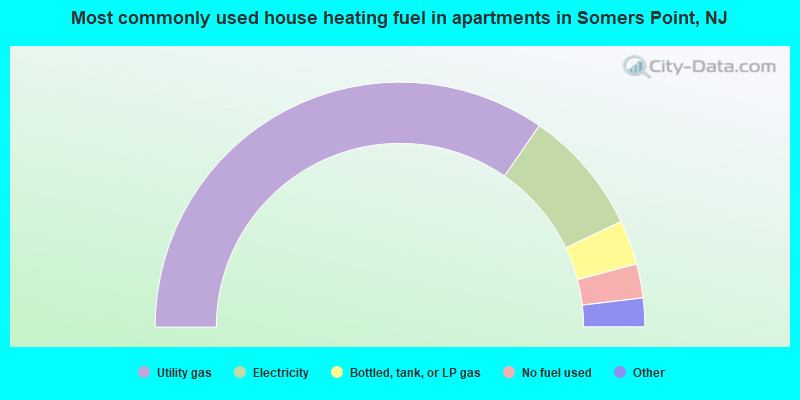
House heating fuel used in apartments - Utility gas (%)
House heating fuel used in apartments - Bottled, tank, or LP gas (%)
House heating fuel used in apartments - Electricity (%)
House heating fuel used in apartments - Fuel oil, kerosene, etc. (%)
House heating fuel used in apartments - Coal or coke (%)
House heating fuel used in apartments - Wood (%)
House heating fuel used in apartments - Solar energy (%)
House heating fuel used in apartments - Other fuel (%)
House heating fuel used in apartments - No fuel used (%)
Armed forces status - In Armed Forces (%)
Armed forces status - Civilian (%)
Armed forces status - Civilian - Veteran (%)
Armed forces status - Civilian - Nonveteran (%)
Fatal accidents locations in years 2005-2021
Fatal accidents locations in 2005
Fatal accidents locations in 2006
Fatal accidents locations in 2007
Fatal accidents locations in 2008
Fatal accidents locations in 2009
Fatal accidents locations in 2010
Fatal accidents locations in 2011
Fatal accidents locations in 2012
Fatal accidents locations in 2013
Fatal accidents locations in 2014
Fatal accidents locations in 2015
Fatal accidents locations in 2016
Fatal accidents locations in 2017
Fatal accidents locations in 2018
Fatal accidents locations in 2019
Fatal accidents locations in 2020
Fatal accidents locations in 2021
Alcohol use - People drinking some alcohol every month (%)
Alcohol use - People not drinking at all (%)
Alcohol use - Average days/month drinking alcohol
Alcohol use - Average drinks/week
Alcohol use - Average days/year people drink much
Audiometry - Average condition of hearing (%)
Audiometry - People that can hear a whisper from across a quiet room (%)
Audiometry - People that can hear normal voice from across a quiet room (%)
Audiometry - Ears ringing, roaring, buzzing (%)
Audiometry - Had a job exposure to loud noise (%)
Audiometry - Had off-work exposure to loud noise (%)
Blood Pressure & Cholesterol - Has high blood pressure (%)
Blood Pressure & Cholesterol - Checking blood pressure at home (%)
Blood Pressure & Cholesterol - Frequently checking blood cholesterol (%)
Blood Pressure & Cholesterol - Has high cholesterol level (%)
Consumer Behavior - Money monthly spent on food at supermarket/grocery store
Consumer Behavior - Money monthly spent on food at other stores
Consumer Behavior - Money monthly spent on eating out
Consumer Behavior - Money monthly spent on carryout/delivered foods
Consumer Behavior - Income spent on food at supermarket/grocery store (%)
Consumer Behavior - Income spent on food at other stores (%)
Consumer Behavior - Income spent on eating out (%)
Consumer Behavior - Income spent on carryout/delivered foods (%)
Current Health Status - General health condition (%)
Current Health Status - Blood donors (%)
Current Health Status - Has blood ever tested for HIV virus (%)
Current Health Status - Left-handed people (%)
Dermatology - People using sunscreen (%)
Diabetes - Diabetics (%)
Diabetes - Had a blood test for high blood sugar (%)
Diabetes - People taking insulin (%)
Diet Behavior & Nutrition - Diet health (%)
Diet Behavior & Nutrition - Milk product consumption (# of products/month)
Diet Behavior & Nutrition - Meals not home prepared (#/week)
Diet Behavior & Nutrition - Meals from fast food or pizza place (#/week)
Diet Behavior & Nutrition - Ready-to-eat foods (#/month)
Diet Behavior & Nutrition - Frozen meals/pizza (#/month)
Drug Use - People that ever used marijuana or hashish (%)
Drug Use - Ever used hard drugs (%)
Drug Use - Ever used any form of cocaine (%)
Drug Use - Ever used heroin (%)
Drug Use - Ever used methamphetamine (%)
Health Insurance - People covered by health insurance (%)
Kidney Conditions-Urology - Avg. # of times urinating at night
Medical Conditions - People with asthma (%)
Medical Conditions - People with anemia (%)
Medical Conditions - People with psoriasis (%)
Medical Conditions - People with overweight (%)
Medical Conditions - Elderly people having difficulties in thinking or remembering (%)
Medical Conditions - People who ever received blood transfusion (%)
Medical Conditions - People having trouble seeing even with glass/contacts (%)
Medical Conditions - People with arthritis (%)
Medical Conditions - People with gout (%)
Medical Conditions - People with congestive heart failure (%)
Medical Conditions - People with coronary heart disease (%)
Medical Conditions - People with angina pectoris (%)
Medical Conditions - People who ever had heart attack (%)
Medical Conditions - People who ever had stroke (%)
Medical Conditions - People with emphysema (%)
Medical Conditions - People with thyroid problem (%)
Medical Conditions - People with chronic bronchitis (%)
Medical Conditions - People with any liver condition (%)
Medical Conditions - People who ever had cancer or malignancy (%)
Mental Health - People who have little interest in doing things (%)
Mental Health - People feeling down, depressed, or hopeless (%)
Mental Health - People who have trouble sleeping or sleeping too much (%)
Mental Health - People feeling tired or having little energy (%)
Mental Health - People with poor appetite or overeating (%)
Mental Health - People feeling bad about themself (%)
Mental Health - People who have trouble concentrating on things (%)
Mental Health - People moving or speaking slowly or too fast (%)
Mental Health - People having thoughts they would be better off dead (%)
Oral Health - Average years since last visit a dentist
Oral Health - People embarrassed because of mouth (%)
Oral Health - People with gum disease (%)
Oral Health - General health of teeth and gums (%)
Oral Health - Average days a week using dental floss/device
Oral Health - Average days a week using mouthwash for dental problem
Oral Health - Average number of teeth
Pesticide Use - Households using pesticides to control insects (%)
Pesticide Use - Households using pesticides to kill weeds (%)
Physical Activity - People doing vigorous-intensity work activities (%)
Physical Activity - People doing moderate-intensity work activities (%)
Physical Activity - People walking or bicycling (%)
Physical Activity - People doing vigorous-intensity recreational activities (%)
Physical Activity - People doing moderate-intensity recreational activities (%)
Physical Activity - Average hours a day doing sedentary activities
Physical Activity - Average hours a day watching TV or videos
Physical Activity - Average hours a day using computer
Physical Functioning - People having limitations keeping them from working (%)
Physical Functioning - People limited in amount of work they can do (%)
Physical Functioning - People that need special equipment to walk (%)
Physical Functioning - People experiencing confusion/memory problems (%)
Physical Functioning - People requiring special healthcare equipment (%)
Prescription Medications - Average number of prescription medicines taking
Preventive Aspirin Use - Adults 40+ taking low-dose aspirin (%)
Reproductive Health - Vaginal deliveries (%)
Reproductive Health - Cesarean deliveries (%)
Reproductive Health - Deliveries resulted in a live birth (%)
Reproductive Health - Pregnancies resulted in a delivery (%)
Reproductive Health - Women breastfeeding newborns (%)
Reproductive Health - Women that had a hysterectomy (%)
Reproductive Health - Women that had both ovaries removed (%)
Reproductive Health - Women that have ever taken birth control pills (%)
Reproductive Health - Women taking birth control pills (%)
Reproductive Health - Women that have ever used Depo-Provera or injectables (%)
Reproductive Health - Women that have ever used female hormones (%)
Sexual Behavior - People 18+ that ever had sex (vaginal, anal, or oral) (%)
Sexual Behavior - Males 18+ that ever had vaginal sex with a woman (%)
Sexual Behavior - Males 18+ that ever performed oral sex on a woman (%)
Sexual Behavior - Males 18+ that ever had anal sex with a woman (%)
Sexual Behavior - Males 18+ that ever had any sex with a man (%)
Sexual Behavior - Females 18+ that ever had vaginal sex with a man (%)
Sexual Behavior - Females 18+ that ever performed oral sex on a man (%)
Sexual Behavior - Females 18+ that ever had anal sex with a man (%)
Sexual Behavior - Females 18+ that ever had any kind of sex with a woman (%)
Sexual Behavior - Average age people first had sex
Sexual Behavior - Average number of female sex partners in lifetime (males 18+)
Sexual Behavior - Average number of female vaginal sex partners in lifetime (males 18+)
Sexual Behavior - Average age people first performed oral sex on a woman (18+)
Sexual Behavior - Average number of woman performed oral sex on in lifetime (18+)
Sexual Behavior - Average number of male sex partners in lifetime (males 18+)
Sexual Behavior - Average number of male anal sex partners in lifetime (males 18+)
Sexual Behavior - Average age people first performed oral sex on a man (18+)
Sexual Behavior - Average number of male oral sex partners in lifetime (18+)
Sexual Behavior - People using protection when performing oral sex (%)
Sexual Behavior - Average number of times people have vaginal or anal sex a year
Sexual Behavior - People having sex without condom (%)
Sexual Behavior - Average number of male sex partners in lifetime (females 18+)
Sexual Behavior - Average number of male vaginal sex partners in lifetime (females 18+)
Sexual Behavior - Average number of female sex partners in lifetime (females 18+)
Sexual Behavior - Circumcised males 18+ (%)
Sleep Disorders - Average hours sleeping at night
Sleep Disorders - People that has trouble sleeping (%)
Smoking-Cigarette Use - People smoking cigarettes (%)
Taste & Smell - People 40+ having problems with smell (%)
Taste & Smell - People 40+ having problems with taste (%)
Taste & Smell - People 40+ that ever had wisdom teeth removed (%)
Taste & Smell - People 40+ that ever had tonsils teeth removed (%)
Taste & Smell - People 40+ that ever had a loss of consciousness because of a head injury (%)
Taste & Smell - People 40+ that ever had a broken nose or other serious injury to face or skull (%)
Taste & Smell - People 40+ that ever had two or more sinus infections (%)
Weight - Average height (inches)
Weight - Average weight (pounds)
Weight - Average BMI
Weight - People that are obese (%)
Weight - People that ever were obese (%)
Weight - People trying to lose weight (%)
Officers per 1,000 residents here:
2.68New Jersey average:
5.53
Latest news from Somers Point, NJ collected exclusively by city-data.com from local newspapers, TV, and radio stations
Ancestries: Irish (16.4%), Italian (9.7%), German (5.5%), American (4.9%), English (4.5%), Barbadian (3.1%).
Current Local Time:
Land area: 4.03 square miles.
Population density: 2,605 people per square mile (average).
1,323 residents are foreign born (6.5% Latin America , 3.5% Asia , 1.5% Europe ).
This city:
12.6%New Jersey:
23.2%
Median real estate property taxes paid for housing units with mortgages in 2022: $6,673 (2.3%)Median real estate property taxes paid for housing units with no mortgage in 2022: $6,878 (2.4%)
Nearest city with pop. 50,000+: Vineland, NJ
Nearest city with pop. 200,000+: Philadelphia, PA
Nearest cities:
Latitude: 39.32 N, Longitude: 74.60 W
Daytime population change due to commuting: +664 (+6.3%)Workers who live and work in this city: 1,803 (34.4%)
Somers Point tourist attractions:
Single-family new house construction building permits:
2022: 15 buildings , average cost: $887,5002021: 14 buildings , average cost: $722,1002020: 13 buildings , average cost: $713,4002019: 11 buildings , average cost: $919,2002018: 6 buildings , average cost: $427,9002017: 6 buildings , average cost: $484,6002016: 8 buildings , average cost: $368,1002015: 8 buildings , average cost: $329,8002014: 14 buildings , average cost: $257,1002013: 15 buildings , average cost: $267,5002012: 13 buildings , average cost: $349,9002011: 10 buildings , average cost: $158,7002010: 12 buildings , average cost: $156,2002009: 11 buildings , average cost: $180,3002008: 16 buildings , average cost: $114,2002007: 17 buildings , average cost: $86,2002006: 21 buildings , average cost: $85,8002005: 22 buildings , average cost: $148,9002004: 33 buildings , average cost: $88,6002003: 59 buildings , average cost: $84,4002002: 56 buildings , average cost: $91,3002001: 3 buildings , average cost: $64,1002000: 5 buildings , average cost: $67,5001999: 12 buildings , average cost: $52,8001998: 8 buildings , average cost: $34,9001997: 5 buildings , average cost: $67,200Unemployment in December 2023:
Population change in the 1990s: +354 (+3.1%).
Most common industries in Somers Point, NJ (%)
Both Males Females
Arts, entertainment, recreation (13.7%)
Health care (13.7%)
Accommodation & food services (13.3%)
Educational services (7.1%)
Construction (6.7%)
Public administration (5.5%)
Professional, scientific, technical services (4.3%)
Accommodation & food services (14.4%)
Arts, entertainment, recreation (14.0%)
Construction (12.1%)
Public administration (7.7%)
Health care (6.1%)
Educational services (6.0%)
Repair & maintenance (4.4%)
Health care (21.5%)
Arts, entertainment, recreation (13.5%)
Accommodation & food services (12.2%)
Educational services (8.3%)
Professional, scientific, technical services (4.7%)
Administrative & support & waste management services (3.4%)
Social assistance (3.1%)
Most common occupations in Somers Point, NJ (%)
Both Males Females
Supervisors and other personal care and service workers, except child care workers (6.1%)
Other management occupations, except farmers and farm managers (4.6%)
Other sales and related occupations, including supervisors (4.5%)
Waiters and waitresses (3.7%)
Registered nurses (3.6%)
Building and grounds cleaning and maintenance occupations (3.2%)
Other office and administrative support workers, including supervisors (3.2%)
Supervisors and other personal care and service workers, except child care workers (5.7%)
Building and grounds cleaning and maintenance occupations (4.5%)
Other management occupations, except farmers and farm managers (4.4%)
Cooks and food preparation workers (4.0%)
Electrical equipment mechanics and other installation, maintenance, and repair workers, including supervisors (4.0%)
Other sales and related occupations, including supervisors (3.9%)
Other protective service workers, including supervisors (3.6%)
Waiters and waitresses (6.5%)
Supervisors and other personal care and service workers, except child care workers (6.5%)
Registered nurses (6.2%)
Other office and administrative support workers, including supervisors (5.4%)
Cashiers (5.1%)
Other sales and related occupations, including supervisors (5.0%)
Information and record clerks, except customer service representatives (4.9%)
Tornado activity:
Somers Point-area historical tornado activity is below New Jersey state average. It is 55% smaller than the overall U.S. average.
On 7/21/1983, a category F3 (max. wind speeds 158-206 mph) tornado 29.7 miles away from the Somers Point city center caused between $500,000 and $5,000,000 in damages.
On 7/21/1987, a category F2 (max. wind speeds 113-157 mph) tornado 2.4 miles away from the city center injured 3 people and caused between $500 and $5000 in damages.
Earthquake activity:
Somers Point-area historical earthquake activity is significantly above New Jersey state average. It is 69% smaller than the overall U.S. average. On 8/23/2011 at 17:51:04, a magnitude 5.8 (5.8 MW, Depth: 3.7 mi, Class: Moderate, Intensity: VI - VII) earthquake occurred 204.9 miles away from Somers Point center On 1/16/1994 at 01:49:16, a magnitude 4.6 (4.6 MB, 4.6 LG, Depth: 3.1 mi, Class: Light, Intensity: IV - V) earthquake occurred 103.5 miles away from Somers Point center On 11/30/2017 at 21:47:31, a magnitude 4.1 (4.1 MW, Depth: 6.1 mi) earthquake occurred 45.4 miles away from the city center On 1/15/2019 at 23:30:48, a magnitude 4.6 (4.6 MW, Depth: 6.2 mi) earthquake occurred 168.2 miles away from Somers Point center On 1/16/1994 at 00:42:43, a magnitude 4.2 (4.2 MB, 4.0 LG, Depth: 3.1 mi) earthquake occurred 102.2 miles away from Somers Point center On 10/7/1983 at 10:18:46, a magnitude 5.3 (5.1 MB, 5.3 LG, 5.1 ML) earthquake occurred 320.8 miles away from Somers Point center Magnitude types: regional Lg-wave magnitude (LG), body-wave magnitude (MB), local magnitude (ML), moment magnitude (MW) Natural disasters: The number of natural disasters in Atlantic County (32) is a lot greater than the US average (15).Major Disasters (Presidential) Declared: 23Emergencies Declared: 9Storms: 10, Floods: 8, Hurricanes: 7, Snowstorms: 5, Winter Storms: 3, Blizzards: 2, Heavy Rains: 2, Water Shortages: 2, Winds: 2, Tropical Depression: 1, Tropical Storm: 1, Other: 3 (Note: some incidents may be assigned to more than one category). Hospitals and medical centers in Somers Point: SHORE MEDICAL CENTER (Voluntary non-profit - Private, 100 MEDICAL CENTER WAY) OCEAN POINT HEALTH CARE CENTER (555 BAY AVENUE)
Other hospitals and medical centers near Somers Point: LIBERTY LINWOOD DIALYSIS (Dialysis Facility, about 3 miles away; LINWOOD, NJ)
LINWOOD CARE CENTER (Nursing Home, about 4 miles away; LINWOOD, NJ)
SHORE MEM HOSP REGIONAL DIALYSIS UNIT (Dialysis Facility, about 4 miles away; NORTHFIELD, NJ)
SHORES AT WESLEY MANOR, THE (Nursing Home, about 4 miles away; OCEAN CITY, NJ)
MEADOWVIEW NURSING HOME (Nursing Home, about 6 miles away; NORTHFIELD, NJ)
ATLANTIC CO HME ANNEX (Nursing Home, about 6 miles away; NORTHFIELD, NJ)
OUR LADYS RESIDENCE (Nursing Home, about 6 miles away; PLEASANTVILLE, NJ)
Heliports located in Somers Point: Colleges/universities with over 2000 students nearest to Somers Point:
Atlantic Cape Community College (about 11 miles; Mays Landing, NJ ; Full-time enrollment: 5,392)
The Richard Stockton College of New Jersey (about 13 miles; Galloway, NJ ; FT enrollment: 8,360)
Cumberland County College (about 26 miles; Vineland, NJ ; FT enrollment: 2,898)
Rowan University (about 39 miles; Glassboro, NJ ; FT enrollment: 10,632)
Camden County College (about 40 miles; Blackwood, NJ ; FT enrollment: 9,901)
Gloucester County College (about 43 miles; Sewell, NJ ; FT enrollment: 5,490)
Burlington County College (about 45 miles; Pemberton, NJ ; FT enrollment: 7,928)
Public high school in Somers Point: CHARTER~TECH HIGH SCHOOL FOR THE PERFORMING ARTS Location: 413 NEW ROAD, Grades: 9-12, Charter school )
Public elementary/middle schools in Somers Point:
Private elementary/middle school in Somers Point: ST JOSEPH REGIONAL SCHOOL Students: 530, Location: 11 HARBOR LN, Grades: PK-8)
See full list of schools located in Somers Point
Notable locations in Somers Point: (A) , Mutual Aid Emergency Services (B) , Somers Point Fire Company 1 Station 1 Headquarters (C) , Somers Point City Fire Company 1 Station 2 (D) , Somers Point City Fire Department - Chief (E) . Display/hide their locations on the map
Creek: (A) . Display/hide its location on the map
Park in Somers Point: (1) . Display/hide its location on the map
Tourist attractions:
Hotels:
Birthplace of: Doug Colman - Football player and coach, Joshua Cohen (writer) - Short story writer, David Kagen - Film actor, Jason Lawrence - Motorcycle racer, Peter Erskine - musician.
Atlantic County has a predicted average indoor radon screening level less than 2 pCi/L (pico curies per liter) - Low Potential Average household size: This city:
2.3 peopleNew Jersey:
2.7 people
Percentage of family households: This city:
60.7%Whole state:
69.3%
Percentage of households with unmarried partners: This city:
8.9%Whole state:
5.9%
Likely homosexual households (counted as self-reported same-sex unmarried-partner households)
Lesbian couples: 0.4% of all households Gay men: 0.4% of all households
10 people in group homes intended for adults in 2010People in group quarters in Somers Point in 2000:
139 people in nursing homes
24 people in other group homes
8 people in other nonhousehold living situations
3 people in homes for the mentally ill
3 people in other noninstitutional group quarters
2 people in religious group quarters
Banks with branches in Somers Point (2011 data):
Bank of America, National Association: Somers Point Branch at Bethel Road & Route 9, branch established on 1927/01/01. Info updated 2009/11/18: Bank assets: $1,451,969.3 mil, Deposits: $1,077,176.8 mil, headquarters in Charlotte, NC, positive income , 5782 total offices , Holding Company: Bank Of America Corporation
TD Bank, National Association: Somers Point Branch at Route 9 And Chapman Boulevard, branch established on 1994/11/12. Info updated 2010/10/04: Bank assets: $188,912.6 mil, Deposits: $153,149.8 mil, headquarters in Wilmington, DE, positive income , 1314 total offices , Holding Company: Toronto-Dominion Bank, The
Cape Bank: Somers Point Branch at 199 New Road, branch established on 2002/09/19. Info updated 2010/06/23: Bank assets: $1,071.9 mil, Deposits: $778.0 mil, headquarters in Cape May Court House, NJ, positive income , Commercial Lending Specialization, 15 total offices
Wells Fargo Bank, National Association: Somers Point Branch at 500 New Road, branch established on 1953/06/25. Info updated 2011/04/05: Bank assets: $1,161,490.0 mil, Deposits: $905,653.0 mil, headquarters in Sioux Falls, SD, positive income , 6395 total offices , Holding Company: Wells Fargo & Company
Sun National Bank: Somers Point Branch at 521 New Road, branch established on 1974/11/15. Info updated 2006/11/03: Bank assets: $3,180.3 mil, Deposits: $2,715.6 mil, headquarters in Vineland, NJ, negative income in the last year , Commercial Lending Specialization, 62 total offices , Holding Company: Sun Bancorp, Inc
For population 15 years and over in Somers Point:
Never married: 33.0%Now married: 47.1%Separated: 1.4%Widowed: 6.8%Divorced: 11.7% For population 25 years and over in Somers Point:
High school or higher: 88.7%Bachelor's degree or higher: 27.6%Graduate or professional degree: 11.8%Unemployed: 6.0%Mean travel time to work (commute): 20.7 minutes
Education Gini index (Inequality in education) Here:
11.9New Jersey average:
12.8
Religion statistics for Somers Point, NJ (based on Atlantic County data)
Religion Adherents Congregations Catholic 65,867 23 Other 16,570 27 Evangelical Protestant 13,661 100 Mainline Protestant 13,250 57 Black Protestant 6,321 19 Orthodox 1,520 5 None 157,360 -
Source: Clifford Grammich, Kirk Hadaway, Richard Houseal, Dale E.Jones, Alexei Krindatch, Richie Stanley and Richard H.Taylor. 2012. 2010 U.S.Religion Census: Religious Congregations & Membership Study. Association of Statisticians of American Religious Bodies. Jones, Dale E., et al. 2002. Congregations and Membership in the United States 2000. Nashville, TN: Glenmary Research Center. Graphs represent county-level data
Food Environment Statistics: Number of grocery stores : 68Atlantic County :
2.52 / 10,000 pop.State :
2.90 / 10,000 pop.
Number of supercenters and club stores : 2Atlantic County :
0.07 / 10,000 pop.New Jersey :
0.06 / 10,000 pop.
Number of convenience stores (no gas) : 55Here :
2.04 / 10,000 pop.New Jersey :
1.76 / 10,000 pop.
Number of convenience stores (with gas) : 24Atlantic County :
0.89 / 10,000 pop.State :
0.81 / 10,000 pop.
Number of full-service restaurants : 311This county :
11.52 / 10,000 pop.New Jersey :
7.15 / 10,000 pop.
Adult diabetes rate : Here :
10.0%New Jersey :
8.3%
Adult obesity rate : This county :
26.5%State :
23.3%
Low-income preschool obesity rate : Atlantic County :
19.0%State :
18.0%
Health and Nutrition: Healthy diet rate : Here:
48.9%New Jersey:
50.6%
Average overall health of teeth and gums : Somers Point:
45.5%New Jersey:
48.5%
Average BMI : Somers Point:
29.0New Jersey:
28.5
People feeling badly about themselves : Somers Point:
21.8%New Jersey:
20.0%
People not drinking alcohol at all : Here:
12.1%New Jersey:
11.1%
Average hours sleeping at night : Somers Point:
6.8New Jersey:
6.8
Overweight people : Somers Point:
34.7%State:
33.6%
General health condition : Somers Point:
55.4%New Jersey:
56.9%
Average condition of hearing : Somers Point:
77.9%State:
80.0%
More about Health and Nutrition of Somers Point, NJ Residents
Local government employment and payroll (March 2022)
Function
Full-time employees
Monthly full-time payroll
Average yearly full-time wage
Part-time employees
Monthly part-time payroll
Police Protection - Officers
24 $207,519 $103,760 0 $0 Housing and Community Development (Local)
10 $26,082 $31,298 2 $3,070 Solid Waste Management
9 $21,274 $28,365 5 $7,833 Police - Other
7 $36,517 $62,601 13 $4,415 Other Government Administration
6 $24,748 $49,496 8 $5,009 Financial Administration
5 $19,395 $46,548 0 $0 Sewerage
3 $9,637 $38,548 1 $1,026 Parks and Recreation
2 $7,586 $45,516 0 $0 Judicial and Legal
2 $10,478 $62,868 2 $2,572 Firefighters
0 $0 9 $17,277
Totals for Government
68 $363,237 $64,101 40 $41,203
Somers Point government finances - Expenditure in 2021 (per resident):
General - Interest on Debt: $445,000 ($42.40)
Intergovernmental to Local - Other - Sewerage: $1,146,000 ($109.19)
Other - Solid Waste Management: $437,000 ($41.64)Other - Libraries: $375,000 ($35.73)Intergovernmental to State - Protective Inspection and Regulations - Other: $2,000 ($0.19)
Somers Point government finances - Revenue in 2021 (per resident):
Charges - Sewerage: $1,978,000 ($188.47)
Other: $55,000 ($5.24)Local Intergovernmental - Health and Hospitals: $10,000 ($0.95)
Miscellaneous - Fines and Forfeits: $202,000 ($19.25)
Donations From Private Sources: $168,000 ($16.01)General Revenue - Other: $127,000 ($12.10)Interest Earnings: $118,000 ($11.24)Rents: $28,000 ($2.67)State Intergovernmental - General Local Government Support: $1,040,000 ($99.09)
Other: $351,000 ($33.44)Highways: $221,000 ($21.06)Tax - Property: $33,833,000 ($3223.73)
Other License: $348,000 ($33.16)Other Selective Sales: $164,000 ($15.63)Alcoholic Beverage License: $22,000 ($2.10)Amusements License: $1,000 ($0.10)
Somers Point government finances - Debt in 2021 (per resident):
Long Term Debt - Beginning Outstanding - Unspecified Public Purpose: $5,859,000 ($558.27)
Outstanding Unspecified Public Purpose: $4,242,000 ($404.19)Retired Unspecified Public Purpose: $1,617,000 ($154.07)
Somers Point government finances - Cash and Securities in 2021 (per resident):
Sinking Funds - Cash and Securities: $11,344,000 ($1080.90)
4.72% of this county's 2020 resident taxpayers moved to other counties in 2021 ($64,371 average adjusted gross income )
Here:
4.72%New Jersey average:
7.02%
0.02% of residents moved to foreign countries ($83 average AGI )Atlantic County:
0.02%New Jersey average:
0.02%
Top counties to which taxpayers relocated from this county between 2020 and 2021:
Businesses in Somers Point, NJ
Name Count Name Count
Advance Auto Parts 1 Marriott 1 Applebee's 1 MasterBrand Cabinets 2 CVS 1 Payless 1 Curves 1 Pier 1 Imports 1 Dairy Queen 1 RadioShack 1 Dunkin Donuts 1 Rite Aid 1 Econo Lodge 1 Sears 1 Fashion Bug 1 Staples 1 FedEx 1 Starbucks 1 GNC 1 T-Mobile 2 GameStop 1 True Value 1 H&R Block 1 U-Haul 1 Kmart 1 UPS 4 Little Caesars Pizza 1 Wendy's 1
Strongest AM radio stations in Somers Point:
WIBG (1020 AM; daytime; 2 kW; OCEAN CITY/SOMERS PO, NJ; Owner: ENRICO S. BRANCADORA)
WVCH (740 AM; 50 kW; CHESTER, PA; Owner: WVCH COMMUNICATIONS, INC.)
WPHT (1210 AM; 50 kW; PHILADELPHIA, PA; Owner: INFINITY BROADCASTING OPERATIONS, INC.)
WOND (1400 AM; 1 kW; PLEASANTVILLE, NJ; Owner: SOUTH JERSEY RADIO, INC.)
WPEN (950 AM; 50 kW; PHILADELPHIA, PA; Owner: GREATER PHILADELPHIA RADIO, INC.)
WZZD (990 AM; 50 kW; PHILADELPHIA, PA; Owner: PENNSYLVANIA MEDIA ASSOCIATES, INC.)
KYW (1060 AM; 50 kW; PHILADELPHIA, PA; Owner: INFINITY BROADCASTING OPERATIONS, INC.)
WWJZ (640 AM; 50 kW; MOUNT HOLLY, NJ; Owner: ABC, INC.)
WNWR (1540 AM; 50 kW; PHILADELPHIA, PA)
WMID (1340 AM; 1 kW; ATLANTIC CITY, NJ; Owner: EQUITY COMMUNICATIONS, L.P.)
WKXW (1450 AM; 1 kW; ATLANTIC CITY, NJ; Owner: MILLENNIUM ATLANTIC CITY LICENSE HOLDCO, LLC)
WMCA (570 AM; 50 kW; NEW YORK, NY; Owner: SALEM MEDIA OF NEW YORK, LLC)
WOR (710 AM; 50 kW; NEW YORK, NY; Owner: BUCKLEY BROADCASTING CORPORATION)
Strongest FM radio stations in Somers Point:
WXGN (90.5 FM; EGG HARBOR TOWNSHIP, NJ; Owner: JOY BROADCASTING, INC.)
WMGM (103.7 FM; ATLANTIC CITY, NJ; Owner: SOUTH JERSEY RADIO, INC.)
WIXM (97.3 FM; MILLVILLE, NJ; Owner: MILLENNIUM ATLANTIC CITY II LICENSE HOLDCO, LLC)
WTTH (96.1 FM; MARGATE CITY, NJ; Owner: EQUITY COMMUNICATIONS, L.P.)
WKOE (106.3 FM; OCEAN CITY, NJ; Owner: OCEAN COMMUNICATIONS)
WRTQ (91.3 FM; OCEAN CITY, NJ; Owner: TEMPLE U. OF THE COMMONWEALTH SYSTEM)
WFPG-FM (96.9 FM; ATLANTIC CITY, NJ; Owner: MILLENNIUM ATLANTIC CITY LICENSE HOLDCO, LLC)
WTKU (98.3 FM; OCEAN CITY, NJ; Owner: SOUTH JERSEY RADIO, INC.)
WZBZ (99.3 FM; PLEASANTVILLE, NJ; Owner: EQUITY COMMUNICATIONS, L.P.)
WAYV (95.1 FM; ATLANTIC CITY, NJ; Owner: EQUITY COMMUNICATIONS, L.P.)
WJSE (102.7 FM; PETERSBURG, NJ; Owner: PARINELLO ENTERPRISES, INC.)
WPUR (107.3 FM; ATLANTIC CITY, NJ; Owner: MILLENNIUM ATLANTIC CITY LICENSE HOLDCO, LLC)
WOJZ (104.9 FM; EGG HARBOR CITY, NJ; Owner: MEGA COMMUNICATIONS OF EGG HARBOR LICENSEE, L.L.C.)
WNJN-FM (89.7 FM; ATLANTIC CITY, NJ; Owner: NEW JERSEY PUBLIC BCSNTG AUTHORITY)
WZXL (100.7 FM; WILDWOOD, NJ; Owner: EQUITY COMMUNICATIONS, L.P.)
WNJS-FM (88.1 FM; BERLIN, NJ; Owner: NEW JERSEY PUBLIC BROADCASTING AUTHORITY)
WWZK (94.3 FM; AVALON, NJ; Owner: COASTAL BROADCASTING SYSTEMS, INC.)
WAJM (88.9 FM; ATLANTIC CITY, NJ; Owner: ATLANTIC CITY BOARD OF EDUCATION)
WGBZ (105.5 FM; CAPE MAY COURT HOUSE, NJ; Owner: EQUITY COMMUNICATIONS, L.P.)
WLFR (91.7 FM; POMONA, NJ; Owner: STOCKTON STATE COLLEGE)
TV broadcast stations around Somers Point:
WQAV-LP (Channel 34; ATLANTIC CITY, NJ; Owner: ASIAVISION, INC.)
W07CE (Channel 7; ATLANTIC CITY, ETC., NJ; Owner: SOUTH JERSEY RADIO, INC.)
W60CX (Channel 60; ATLANTIC CITY, NJ; Owner: TRINITY BROADCASTING NETWORK)
WWSI (Channel 62; ATLANTIC CITY, NJ; Owner: HISPANIC BROADCASTERS OF PHILADELPHIA, L.L.C.)
WUVP (Channel 65; VINELAND, NJ; Owner: UNIVISION PHILADELPHIA LLC)
WMGM-TV (Channel 40; WILDWOOD, NJ; Owner: SOUTH JERSEY RADIO, INC.)
WMCN-TV (Channel 53; ATLANTIC CITY, NJ; Owner: LENFEST BROADCASTING, LLC)
WNJS (Channel 23; CAMDEN, NJ; Owner: NEW JERSEY PUBLIC BROADCASTING AUTHORITY)
WPSJ-LP (Channel 8; HAMMONTON, ETC., NJ; Owner: ENGLE BROADCASTING)
National Bridge Inventory (NBI) Statistics 26 Number of bridges1,122ft / 342m Total length $21,751,000 Total costs357,238 Total average daily traffic11,495 Total average daily truck traffic
New bridges - historical statistics
13 1950-1959 3 1960-1969 3 1970-1979 4 1980-1989 3 2010-2019
See full National Bridge Inventory statistics for Somers Point, NJ
FCC Registered Broadcast Land Mobile Towers: 13 (
See the full list of FCC Registered Broadcast Land Mobile Towers in Somers Point, NJ )
FCC Registered Maritime Coast & Aviation Ground Towers: 3
Decatur And Bay Ave (Lat: 39.305667 Lon: -74.585722), Type: Building, Overall height: 8 m, Call Sign: KVL853, Assigned Frequencies: 156.450 MHz, 2.09790 MHz, 156.800 MHz, 2.18340 MHz, 4.12640 MHz, Grant Date: 05/10/1999, Expiration Date: 05/10/2004, Cancellation Date: 07/11/2004, Registrant: Cape Island Yacht Sales & Marina, Decatur And Bay Ave, Somers Point, NJ 08244 Rt Us 52 Ship Channel Bridge (Lat: 39.305667 Lon: -74.597389), Type: Building, Overall height: 4 m, Call Sign: WHD816, Assigned Frequencies: 156.450 MHz, 156.650 MHz, 156.800 MHz, Grant Date: 02/12/2011, Expiration Date: 05/06/2021, Cancellation Date: 08/14/2021, Registrant: Njdot, 999 Parkway Avenue, 999 Parkway Avenue, NJ 08604, Phone: (609) 963-1621, Fax: (609) 963-1621, Email:
830 Bay Avenue (Lat: 39.317611 Lon: -74.602389), Type: Building, Overall height: 5 m, Call Sign: WRD593, Licensee ID: L00004376, Assigned Frequencies: 156.425 MHz, 156.450 MHz, 156.800 MHz, Grant Date: 02/21/2002, Expiration Date: 05/06/2012, Cancellation Date: 07/07/2012, Registrant: Mayer Marine, 830 Bay Ave, Somers Point, NJ 08244 FCC Registered Amateur Radio Licenses: 35 (
See the full list of FCC Registered Amateur Radio Licenses in Somers Point )
Home Mortgage Disclosure Act Aggregated Statistics For Year 2009(Based on 4 full tracts) A) FHA, FSA/RHS & VA B) Conventional C) Refinancings D) Home Improvement Loans F) Non-occupant Loans on Number Average Value Number Average Value Number Average Value Number Average Value Number Average Value
LOANS ORIGINATED 29 $208,103 50 $203,040 220 $194,718 11 $61,909 58 $240,000 APPLICATIONS APPROVED, NOT ACCEPTED 2 $228,500 2 $213,500 25 $195,280 1 $25,000 7 $257,857 APPLICATIONS DENIED 3 $173,333 11 $201,000 91 $203,780 10 $59,800 18 $192,500 APPLICATIONS WITHDRAWN 3 $183,000 5 $244,800 55 $202,109 4 $137,500 11 $265,545 FILES CLOSED FOR INCOMPLETENESS 1 $238,000 0 $0 17 $201,235 0 $0 3 $187,667
Aggregated Statistics For Year 2008(Based on 4 full tracts) A) FHA, FSA/RHS & VA B) Conventional C) Refinancings D) Home Improvement Loans E) Loans on Dwellings For 5+ Families F) Non-occupant Loans on G) Loans On Manufactured Number Average Value Number Average Value Number Average Value Number Average Value Number Average Value Number Average Value Number Average Value
LOANS ORIGINATED 19 $205,368 84 $232,500 154 $177,403 33 $42,394 1 $6,000,000 68 $224,235 1 $19,000 APPLICATIONS APPROVED, NOT ACCEPTED 1 $174,000 7 $200,286 34 $178,912 12 $31,750 0 $0 8 $186,250 1 $53,000 APPLICATIONS DENIED 2 $182,000 15 $204,600 84 $229,036 25 $56,280 0 $0 32 $199,031 0 $0 APPLICATIONS WITHDRAWN 1 $222,000 13 $145,154 36 $224,056 2 $220,000 0 $0 10 $206,400 0 $0 FILES CLOSED FOR INCOMPLETENESS 0 $0 5 $249,600 10 $243,100 3 $39,667 0 $0 3 $177,000 0 $0
Aggregated Statistics For Year 2007(Based on 4 full tracts) A) FHA, FSA/RHS & VA B) Conventional C) Refinancings D) Home Improvement Loans F) Non-occupant Loans on G) Loans On Manufactured Number Average Value Number Average Value Number Average Value Number Average Value Number Average Value Number Average Value
LOANS ORIGINATED 7 $207,714 140 $205,721 206 $195,850 67 $59,194 63 $221,206 1 $150,000 APPLICATIONS APPROVED, NOT ACCEPTED 0 $0 6 $338,333 49 $195,694 16 $54,500 11 $282,455 0 $0 APPLICATIONS DENIED 0 $0 22 $218,273 136 $212,500 41 $49,732 26 $225,808 0 $0 APPLICATIONS WITHDRAWN 0 $0 14 $264,214 51 $230,451 3 $87,000 14 $232,929 0 $0 FILES CLOSED FOR INCOMPLETENESS 0 $0 5 $184,200 18 $196,778 1 $30,000 4 $186,500 0 $0
Aggregated Statistics For Year 2006(Based on 4 full tracts) A) FHA, FSA/RHS & VA B) Conventional C) Refinancings D) Home Improvement Loans E) Loans on Dwellings For 5+ Families F) Non-occupant Loans on G) Loans On Manufactured Number Average Value Number Average Value Number Average Value Number Average Value Number Average Value Number Average Value Number Average Value
LOANS ORIGINATED 3 $218,667 147 $194,639 323 $181,356 97 $71,835 1 $757,000 91 $206,637 2 $39,000 APPLICATIONS APPROVED, NOT ACCEPTED 0 $0 12 $183,083 50 $170,680 15 $79,333 0 $0 5 $207,800 0 $0 APPLICATIONS DENIED 0 $0 34 $186,265 126 $198,381 46 $54,087 0 $0 19 $161,842 3 $71,333 APPLICATIONS WITHDRAWN 0 $0 18 $190,889 95 $213,547 5 $41,400 0 $0 12 $274,667 0 $0 FILES CLOSED FOR INCOMPLETENESS 0 $0 2 $88,000 30 $165,400 3 $76,000 0 $0 5 $187,600 1 $100,000
Aggregated Statistics For Year 2005(Based on 4 full tracts) A) FHA, FSA/RHS & VA B) Conventional C) Refinancings D) Home Improvement Loans E) Loans on Dwellings For 5+ Families F) Non-occupant Loans on G) Loans On Manufactured Number Average Value Number Average Value Number Average Value Number Average Value Number Average Value Number Average Value Number Average Value
LOANS ORIGINATED 3 $164,333 200 $206,525 376 $170,402 102 $52,176 1 $123,000 113 $221,796 0 $0 APPLICATIONS APPROVED, NOT ACCEPTED 0 $0 20 $191,000 54 $179,981 18 $38,611 0 $0 9 $188,222 0 $0 APPLICATIONS DENIED 0 $0 44 $206,886 117 $178,974 55 $85,764 0 $0 22 $196,091 1 $40,000 APPLICATIONS WITHDRAWN 2 $198,000 32 $168,656 156 $171,026 11 $129,545 0 $0 19 $225,789 2 $77,500 FILES CLOSED FOR INCOMPLETENESS 0 $0 5 $170,200 28 $182,607 3 $73,333 0 $0 6 $152,000 0 $0
Aggregated Statistics For Year 2004(Based on 4 full tracts) A) FHA, FSA/RHS & VA B) Conventional C) Refinancings D) Home Improvement Loans E) Loans on Dwellings For 5+ Families F) Non-occupant Loans on G) Loans On Manufactured Number Average Value Number Average Value Number Average Value Number Average Value Number Average Value Number Average Value Number Average Value
LOANS ORIGINATED 7 $165,000 227 $182,242 385 $142,818 83 $54,048 1 $222,000 126 $181,222 3 $77,000 APPLICATIONS APPROVED, NOT ACCEPTED 1 $19,000 28 $162,429 65 $126,123 16 $62,562 0 $0 19 $152,105 1 $26,000 APPLICATIONS DENIED 0 $0 28 $188,286 152 $132,658 54 $49,185 0 $0 23 $169,000 5 $42,200 APPLICATIONS WITHDRAWN 0 $0 37 $180,432 107 $121,598 10 $76,500 0 $0 12 $138,250 0 $0 FILES CLOSED FOR INCOMPLETENESS 0 $0 8 $216,375 20 $170,850 6 $84,167 0 $0 5 $103,200 0 $0
Aggregated Statistics For Year 2003(Based on 4 full tracts) A) FHA, FSA/RHS & VA B) Conventional C) Refinancings D) Home Improvement Loans E) Loans on Dwellings For 5+ Families F) Non-occupant Loans on Number Average Value Number Average Value Number Average Value Number Average Value Number Average Value Number Average Value
LOANS ORIGINATED 15 $132,867 223 $161,803 677 $111,461 52 $47,058 1 $338,000 135 $147,919 APPLICATIONS APPROVED, NOT ACCEPTED 0 $0 16 $159,562 129 $110,403 16 $23,250 0 $0 9 $172,333 APPLICATIONS DENIED 0 $0 18 $130,278 146 $115,815 37 $37,568 0 $0 16 $152,250 APPLICATIONS WITHDRAWN 0 $0 27 $179,222 135 $129,674 7 $39,143 0 $0 13 $155,154 FILES CLOSED FOR INCOMPLETENESS 1 $88,000 6 $161,833 22 $123,364 3 $25,000 0 $0 2 $106,000
Aggregated Statistics For Year 2002(Based on 4 full tracts) A) FHA, FSA/RHS & VA B) Conventional C) Refinancings D) Home Improvement Loans E) Loans on Dwellings For 5+ Families F) Non-occupant Loans on Number Average Value Number Average Value Number Average Value Number Average Value Number Average Value Number Average Value
LOANS ORIGINATED 17 $134,882 177 $121,672 480 $103,848 45 $40,289 1 $70,000 100 $116,380 APPLICATIONS APPROVED, NOT ACCEPTED 0 $0 14 $155,929 67 $99,970 18 $26,444 0 $0 9 $170,111 APPLICATIONS DENIED 2 $103,500 26 $102,692 150 $107,813 31 $30,516 0 $0 16 $116,000 APPLICATIONS WITHDRAWN 3 $120,333 29 $131,172 87 $108,333 7 $42,857 0 $0 13 $131,308 FILES CLOSED FOR INCOMPLETENESS 0 $0 7 $91,000 29 $112,172 1 $38,000 0 $0 3 $60,333
Aggregated Statistics For Year 2001(Based on 4 full tracts) A) FHA, FSA/RHS & VA B) Conventional C) Refinancings D) Home Improvement Loans E) Loans on Dwellings For 5+ Families F) Non-occupant Loans on Number Average Value Number Average Value Number Average Value Number Average Value Number Average Value Number Average Value
LOANS ORIGINATED 31 $123,161 176 $109,727 313 $97,307 49 $22,714 1 $6,720,000 68 $103,338 APPLICATIONS APPROVED, NOT ACCEPTED 3 $152,000 17 $153,882 52 $76,269 18 $22,444 0 $0 8 $131,250 APPLICATIONS DENIED 4 $136,750 14 $82,429 129 $87,775 37 $16,270 0 $0 8 $97,250 APPLICATIONS WITHDRAWN 2 $112,000 11 $107,000 100 $96,320 5 $19,600 0 $0 2 $54,500 FILES CLOSED FOR INCOMPLETENESS 0 $0 5 $145,200 30 $95,600 0 $0 0 $0 1 $156,000
Aggregated Statistics For Year 2000(Based on 4 full tracts) A) FHA, FSA/RHS & VA B) Conventional C) Refinancings D) Home Improvement Loans F) Non-occupant Loans on Number Average Value Number Average Value Number Average Value Number Average Value Number Average Value
LOANS ORIGINATED 26 $104,192 171 $153,216 104 $73,779 59 $25,864 36 $110,889 APPLICATIONS APPROVED, NOT ACCEPTED 2 $103,000 15 $96,400 35 $84,971 21 $23,286 0 $0 APPLICATIONS DENIED 4 $110,000 29 $108,517 85 $63,753 46 $24,674 9 $75,889 APPLICATIONS WITHDRAWN 4 $124,000 16 $73,500 72 $64,028 4 $29,750 3 $56,667 FILES CLOSED FOR INCOMPLETENESS 0 $0 3 $96,667 10 $94,200 0 $0 0 $0
Aggregated Statistics For Year 1999(Based on 4 full tracts) A) FHA, FSA/RHS & VA B) Conventional C) Refinancings D) Home Improvement Loans E) Loans on Dwellings For 5+ Families F) Non-occupant Loans on Number Average Value Number Average Value Number Average Value Number Average Value Number Average Value Number Average Value
LOANS ORIGINATED 46 $103,391 135 $102,416 173 $76,792 61 $24,657 1 $5,111,220 47 $92,346 APPLICATIONS APPROVED, NOT ACCEPTED 3 $91,650 12 $93,006 43 $72,828 8 $29,918 0 $0 6 $45,665 APPLICATIONS DENIED 1 $113,070 11 $92,034 96 $84,706 31 $24,250 0 $0 8 $48,689 APPLICATIONS WITHDRAWN 1 $54,350 12 $75,984 60 $79,664 7 $46,870 0 $0 2 $80,240 FILES CLOSED FOR INCOMPLETENESS 1 $168,610 7 $84,666 15 $87,665 0 $0 0 $0 1 $35,820
Detailed HMDA statistics for the following Tracts:
0127.01
, 0127.02 , 0128.01 , 0128.02
Private Mortgage Insurance Companies Aggregated Statistics For Year 2009(Based on 4 full tracts) A) Conventional B) Refinancings C) Non-occupant Loans on Number Average Value Number Average Value Number Average Value
LOANS ORIGINATED 3 $176,333 3 $195,000 1 $169,000 APPLICATIONS APPROVED, NOT ACCEPTED 2 $271,000 4 $222,250 1 $280,000 APPLICATIONS DENIED 0 $0 1 $203,000 0 $0 APPLICATIONS WITHDRAWN 0 $0 0 $0 0 $0 FILES CLOSED FOR INCOMPLETENESS 1 $334,000 0 $0 0 $0
Aggregated Statistics For Year 2008(Based on 4 full tracts) A) Conventional B) Refinancings C) Non-occupant Loans on Number Average Value Number Average Value Number Average Value
LOANS ORIGINATED 24 $224,625 13 $246,462 7 $191,857 APPLICATIONS APPROVED, NOT ACCEPTED 6 $265,833 6 $232,500 4 $208,500 APPLICATIONS DENIED 2 $227,500 3 $265,667 3 $245,333 APPLICATIONS WITHDRAWN 0 $0 1 $248,000 0 $0 FILES CLOSED FOR INCOMPLETENESS 0 $0 0 $0 0 $0
Aggregated Statistics For Year 2007(Based on 4 full tracts) A) Conventional B) Refinancings C) Non-occupant Loans on Number Average Value Number Average Value Number Average Value
LOANS ORIGINATED 32 $226,875 18 $275,444 5 $221,600 APPLICATIONS APPROVED, NOT ACCEPTED 0 $0 4 $261,500 0 $0 APPLICATIONS DENIED 2 $343,000 0 $0 0 $0 APPLICATIONS WITHDRAWN 2 $214,000 0 $0 1 $207,000 FILES CLOSED FOR INCOMPLETENESS 0 $0 0 $0 0 $0
Aggregated Statistics For Year 2006(Based on 4 full tracts) A) Conventional B) Refinancings C) Non-occupant Loans on Number Average Value Number Average Value Number Average Value
LOANS ORIGINATED 19 $231,474 6 $261,833 4 $194,750 APPLICATIONS APPROVED, NOT ACCEPTED 1 $315,000 2 $222,000 0 $0 APPLICATIONS DENIED 1 $245,000 0 $0 0 $0 APPLICATIONS WITHDRAWN 1 $225,000 2 $268,500 0 $0 FILES CLOSED FOR INCOMPLETENESS 0 $0 0 $0 0 $0
Aggregated Statistics For Year 2005(Based on 4 full tracts) A) Conventional B) Refinancings C) Non-occupant Loans on Number Average Value Number Average Value Number Average Value
LOANS ORIGINATED 19 $251,000 7 $216,143 5 $208,600 APPLICATIONS APPROVED, NOT ACCEPTED 1 $252,000 4 $239,000 2 $286,000 APPLICATIONS DENIED 0 $0 0 $0 0 $0 APPLICATIONS WITHDRAWN 1 $195,000 2 $292,500 0 $0 FILES CLOSED FOR INCOMPLETENESS 0 $0 0 $0 0 $0
Aggregated Statistics For Year 2004(Based on 4 full tracts) A) Conventional B) Refinancings C) Non-occupant Loans on D) Loans On Manufactured Number Average Value Number Average Value Number Average Value Number Average Value
LOANS ORIGINATED 47 $190,191 10 $161,200 14 $211,071 1 $166,000 APPLICATIONS APPROVED, NOT ACCEPTED 10 $168,200 5 $165,200 3 $195,667 0 $0 APPLICATIONS DENIED 0 $0 0 $0 0 $0 0 $0 APPLICATIONS WITHDRAWN 2 $188,000 0 $0 0 $0 0 $0 FILES CLOSED FOR INCOMPLETENESS 0 $0 0 $0 0 $0 0 $0
Aggregated Statistics For Year 2003(Based on 4 full tracts) A) Conventional B) Refinancings C) Non-occupant Loans on Number Average Value Number Average Value Number Average Value
LOANS ORIGINATED 60 $193,117 31 $149,839 25 $221,880 APPLICATIONS APPROVED, NOT ACCEPTED 8 $169,625 6 $158,500 1 $280,000 APPLICATIONS DENIED 0 $0 1 $128,000 0 $0 APPLICATIONS WITHDRAWN 2 $107,500 1 $187,000 1 $86,000 FILES CLOSED FOR INCOMPLETENESS 0 $0 0 $0 0 $0
Aggregated Statistics For Year 2002(Based on 4 full tracts) A) Conventional B) Refinancings C) Non-occupant Loans on Number Average Value Number Average Value Number Average Value
LOANS ORIGINATED 45 $124,444 20 $149,850 8 $125,875 APPLICATIONS APPROVED, NOT ACCEPTED 6 $134,500 8 $136,375 0 $0 APPLICATIONS DENIED 0 $0 1 $153,000 0 $0 APPLICATIONS WITHDRAWN 0 $0 1 $111,000 0 $0 FILES CLOSED FOR INCOMPLETENESS 0 $0 0 $0 0 $0
Aggregated Statistics For Year 2001(Based on 4 full tracts) A) Conventional B) Refinancings C) Non-occupant Loans on Number Average Value Number Average Value Number Average Value
LOANS ORIGINATED 55 $123,818 18 $119,944 10 $117,200 APPLICATIONS APPROVED, NOT ACCEPTED 6 $148,500 5 $120,800 1 $77,000 APPLICATIONS DENIED 0 $0 2 $125,000 0 $0 APPLICATIONS WITHDRAWN 0 $0 0 $0 0 $0 FILES CLOSED FOR INCOMPLETENESS 0 $0 0 $0 0 $0
Aggregated Statistics For Year 2000(Based on 4 full tracts) A) Conventional B) Refinancings C) Non-occupant Loans on Number Average Value Number Average Value Number Average Value
LOANS ORIGINATED 47 $103,426 7 $124,429 6 $84,167 APPLICATIONS APPROVED, NOT ACCEPTED 2 $102,500 0 $0 0 $0 APPLICATIONS DENIED 3 $117,333 1 $120,000 0 $0 APPLICATIONS WITHDRAWN 1 $99,000 1 $120,000 0 $0 FILES CLOSED FOR INCOMPLETENESS 1 $141,000 0 $0 0 $0
Aggregated Statistics For Year 1999(Based on 4 full tracts) A) Conventional B) Refinancings C) Non-occupant Loans on Number Average Value Number Average Value Number Average Value
LOANS ORIGINATED 38 $99,016 15 $93,861 4 $69,675 APPLICATIONS APPROVED, NOT ACCEPTED 1 $67,660 4 $95,960 0 $0 APPLICATIONS DENIED 2 $71,595 0 $0 2 $71,595 APPLICATIONS WITHDRAWN 0 $0 0 $0 0 $0 FILES CLOSED FOR INCOMPLETENESS 0 $0 1 $91,250 0 $0
Detailed PMIC statistics for the following Tracts:
0127.01
, 0127.02 , 0128.01 , 0128.02 Fire-safe hotels and motels in Somers Point, New Jersey:
Sonesta ES Suites, 900 Mays Lndg Rd, Somers Point, New Jersey 08244 Phone: (609) 927-6400, Fax: (609) 926-0145
Econo Lodge, 21 Macarthur Blvd, Somers Point, New Jersey 08244 Phone: (609) 927-3220
Economy Motel, 15 Macarthur Blvd, Somers Point, New Jersey 08244 Phone: (609) 927-2514, Fax: (609) 926-3156
All 3 fire-safe hotels and motels in Somers Point, New Jersey Somers Point compared to New Jersey state average:
Median house value below state average. Unemployed percentage below state average. Hispanic race population percentage below state average. Foreign-born population percentage below state average. Length of stay since moving in significantly above state average. Somers Point on our top lists :
#46 on the list of "Top 100 cities with strongest arts, entertainment, recreation, accommodation and food services industries (pop. 5,000+)"
#54 on the list of "Top 101 cities with largest percentage of females in industries: arts, entertainment, and recreation (population 5,000+)"
#63 on the list of "Top 101 cities with largest percentage of males in industries: arts, entertainment, and recreation (population 5,000+)"
#98 on the list of "Top 101 cities with largest percentage of males in occupations: food preparation and serving related occupations (population 5,000+)"
#11 on the list of "Top 101 counties with the lowest Sulfur Oxides Annual air pollution readings in 2012 (µg/m3 )"
#18 on the list of "Top 101 counties with the highest number of infant deaths per 1000 residents 2007-2013 (pop. 50,000+)"
#34 on the list of "Top 101 counties with the largest number of people moving out compared to moving in (pop. 50,000+)"
#42 on the list of "Top 101 counties with the lowest percentage of residents relocating from other counties between 2010 and 2011 (pop. 50,000+)"
#49 on the list of "Top 101 counties with the largest decrease in the number of deaths per 1000 residents 2000-2006 to 2007-2013 (pop. 50,000+)"
Top Patent Applicants
Daniel N. Mactiernan (5)
Jay Rappaport (3)
Louis G. Klause (1)
Emilie Deangelo (1)
Susan Gardner (1)
John M. Munyon (1)
Frank Albano (1)
Earle S. Collins, Iv (1)
Cathy Morgan (1)
Joshua Stroker (1)
Total of 16 patent applications in 2008-2024.
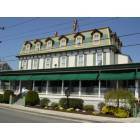
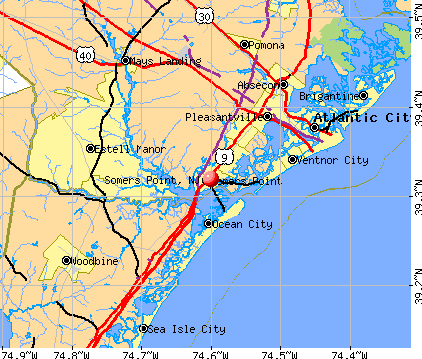


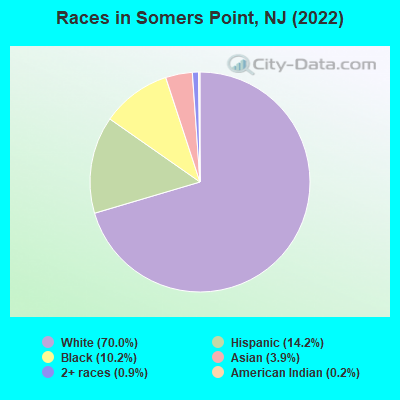
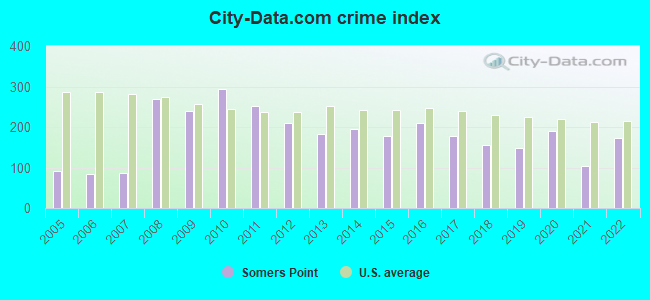
 Recent articles from our blog. Our writers, many of them Ph.D. graduates or candidates, create easy-to-read articles on a wide variety of topics.


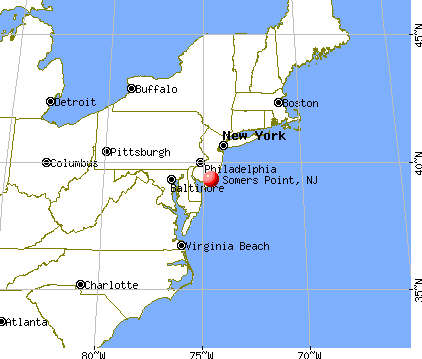
 (24.8 miles
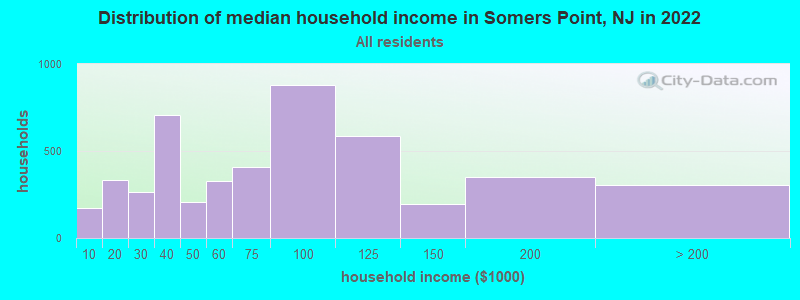
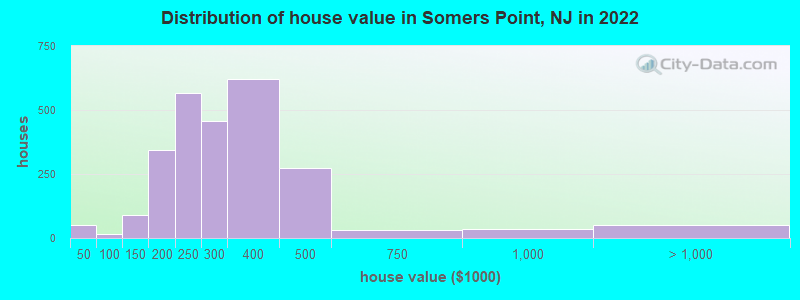
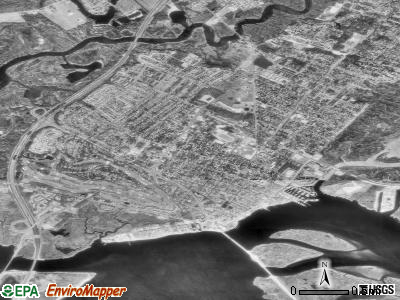
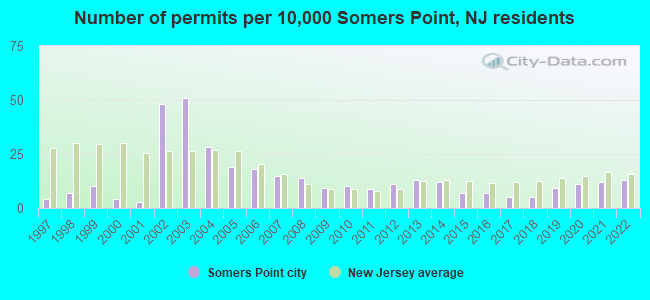
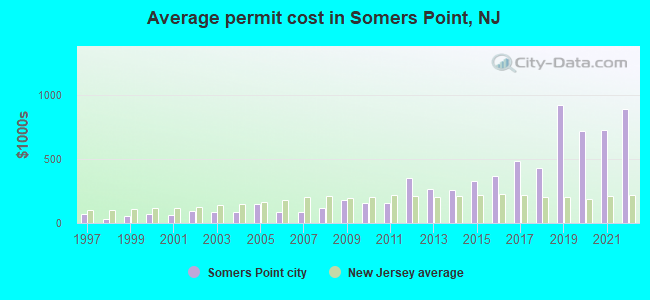
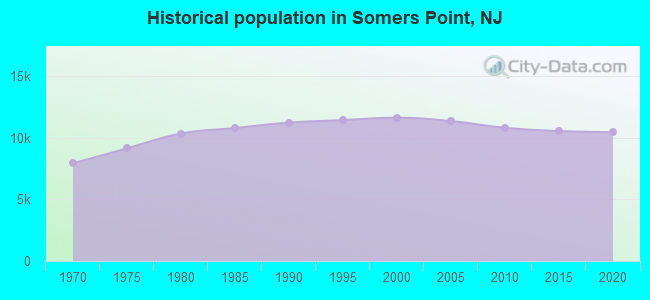
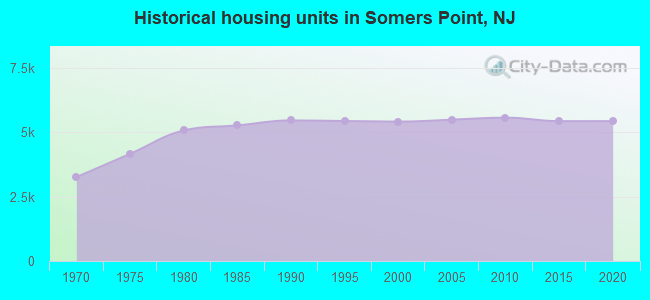
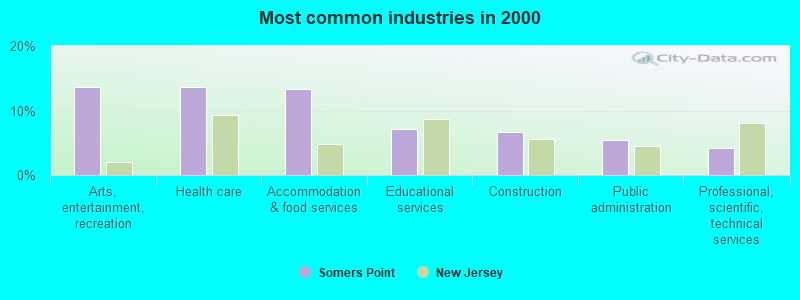
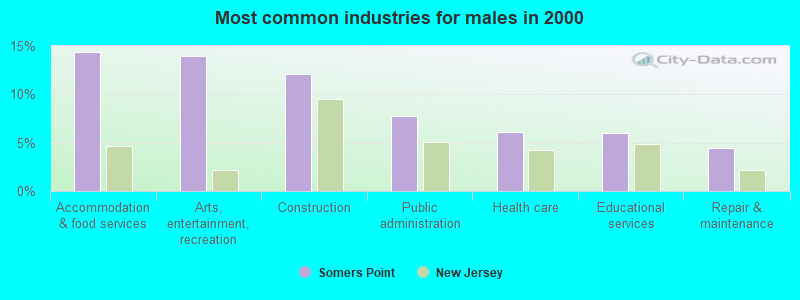
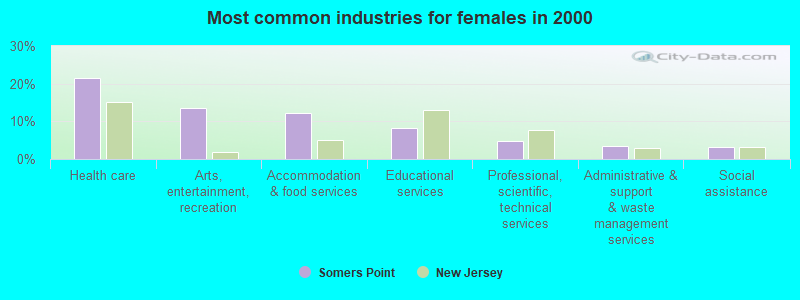
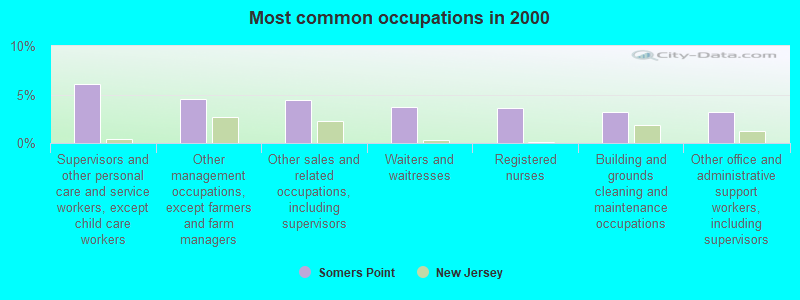
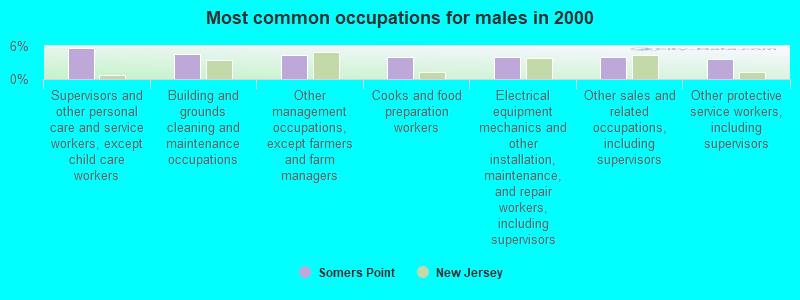
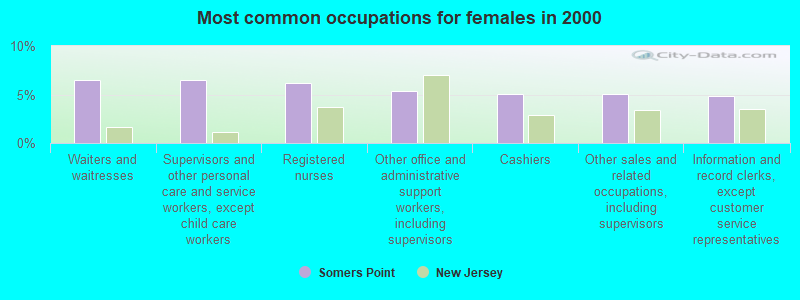
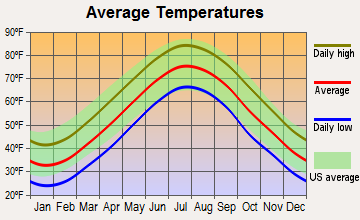
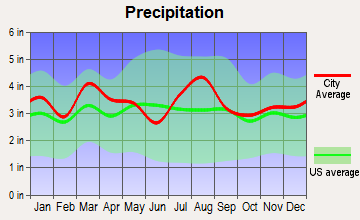
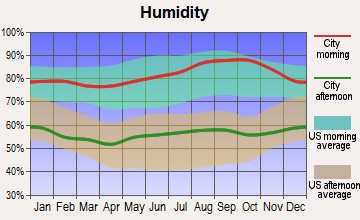
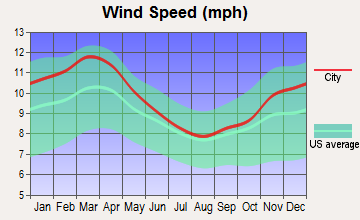
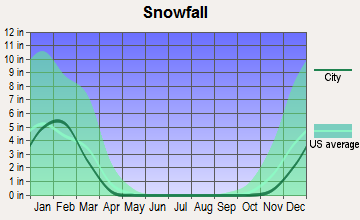
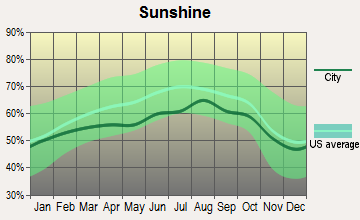
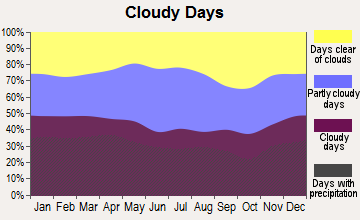
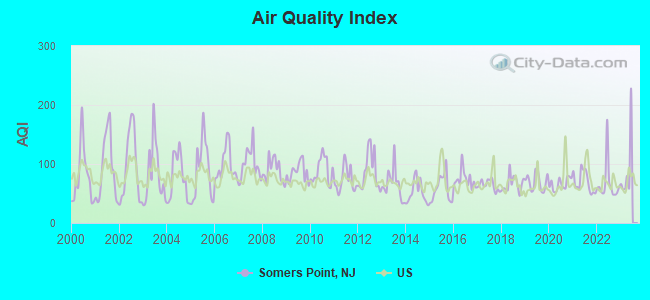
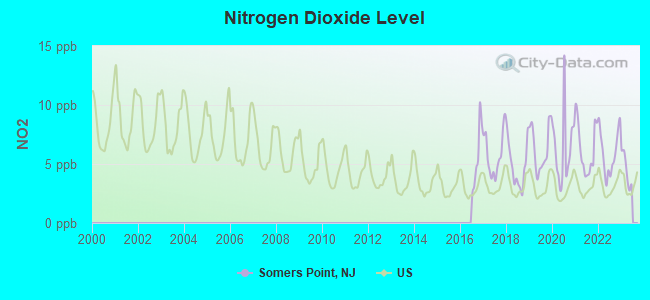
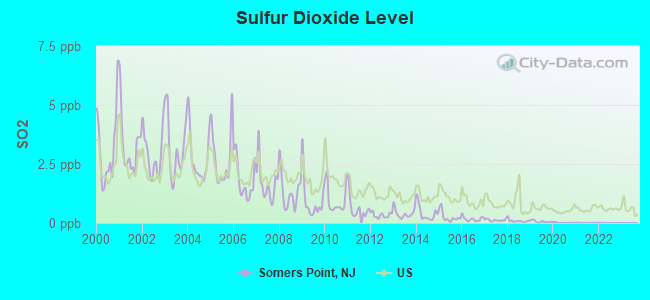
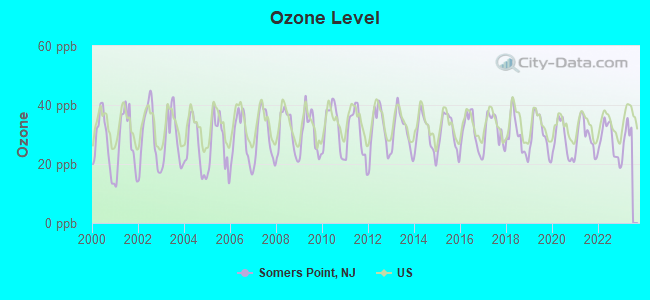
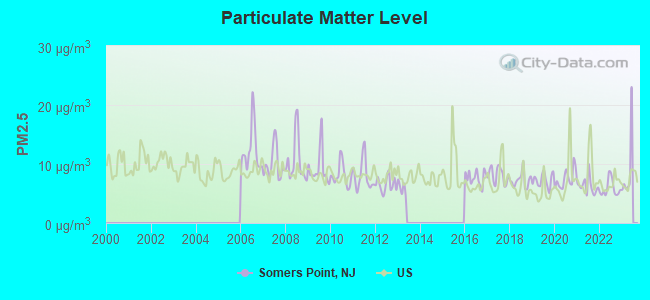

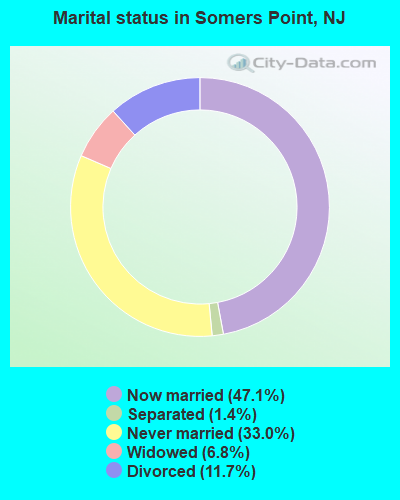
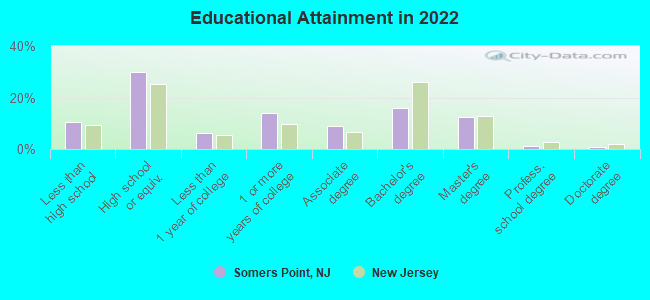
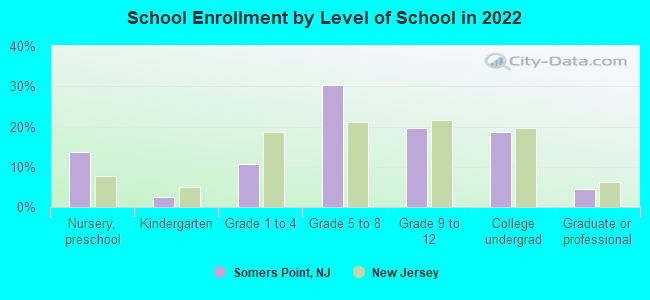
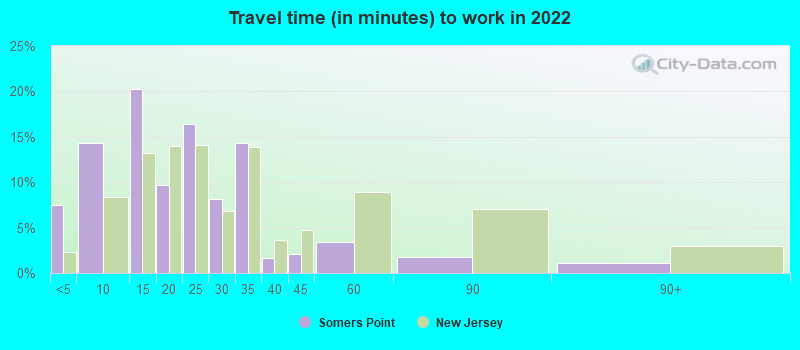
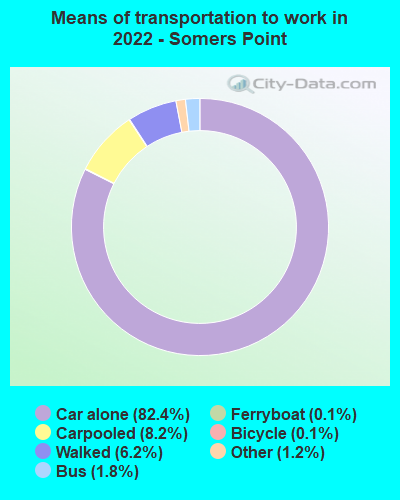
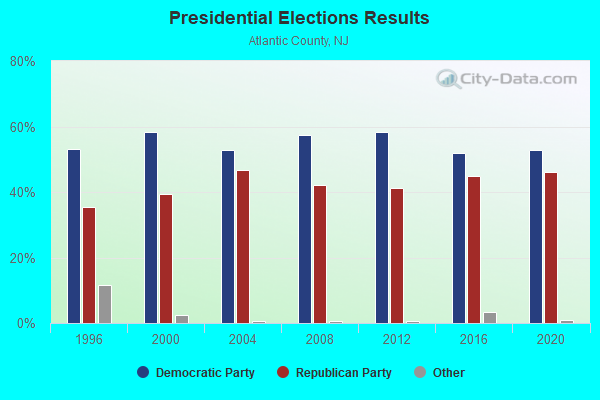
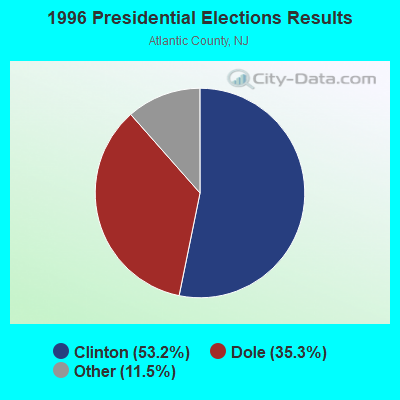
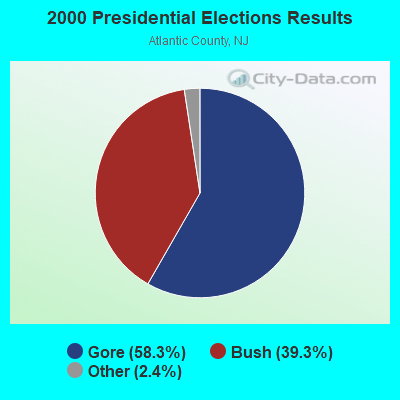
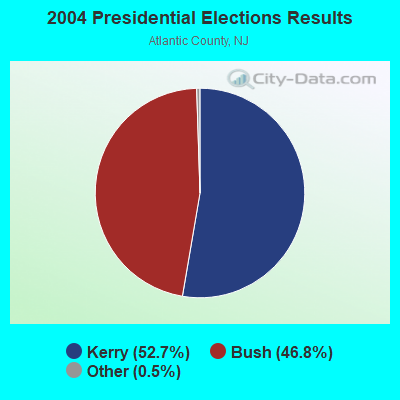
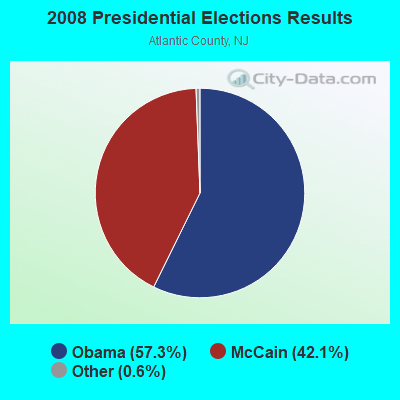

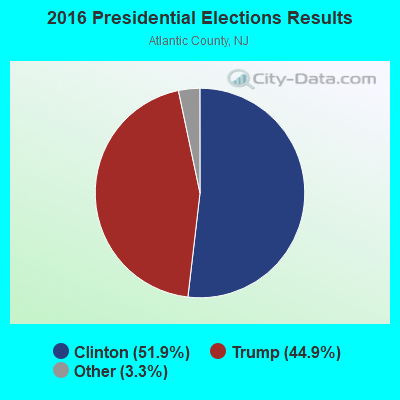
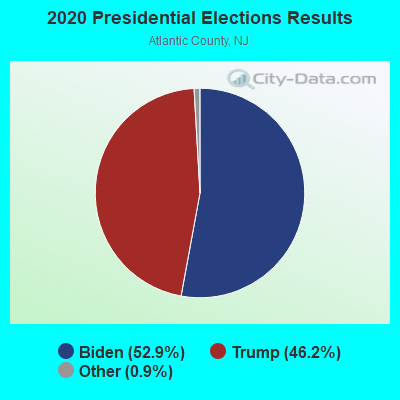
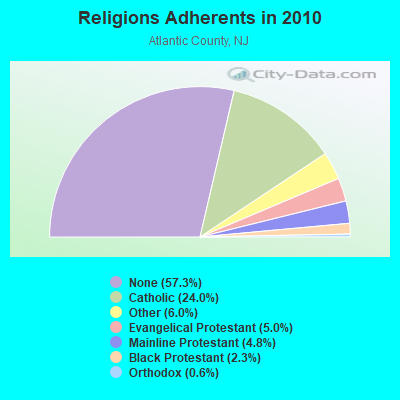
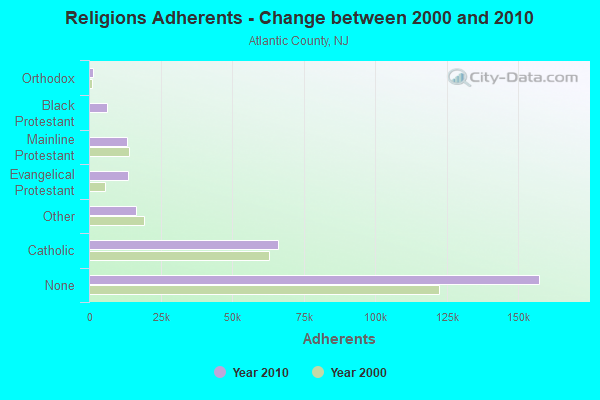
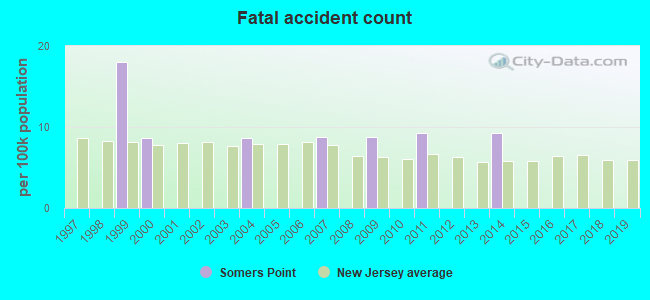
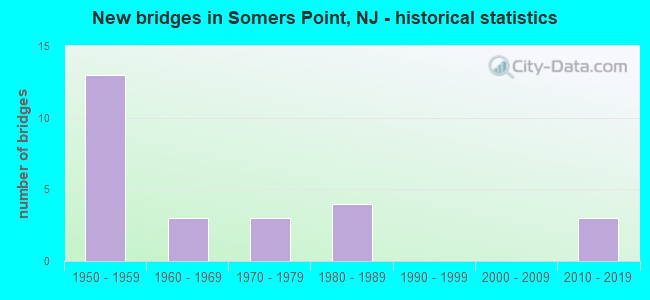
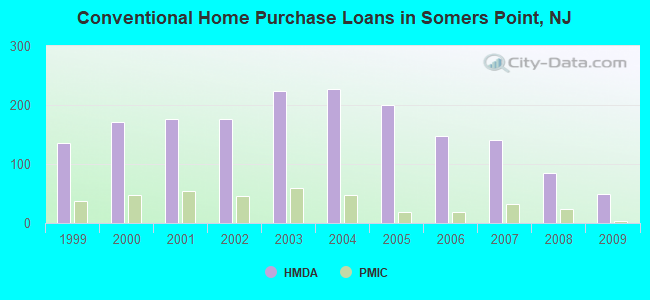
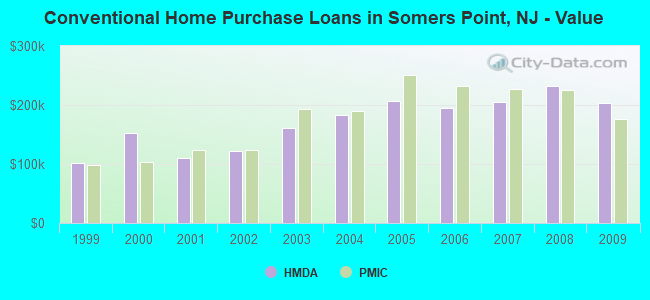
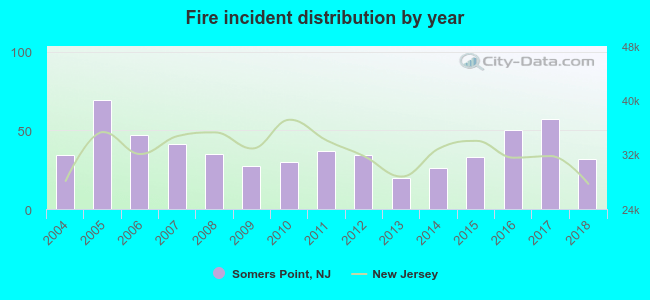 According to the data from the years 2004 - 2018 the average number of fire incidents per year is 38. The highest number of fire incidents - 69 took place in 2005, and the least - 20 in 2013. The data has a dropping trend.
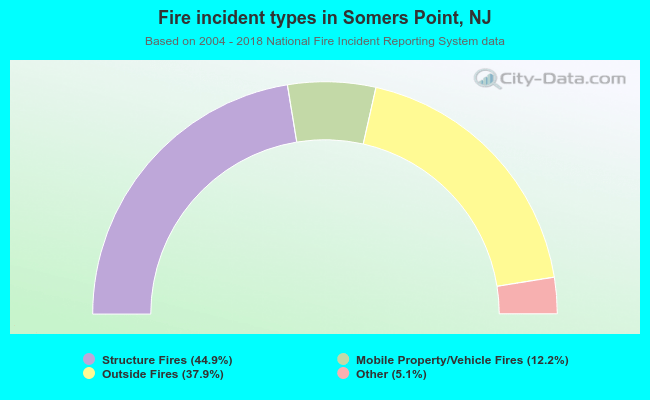 When looking into fire subcategories, the most reports belonged to: Structure Fires (44.9%), and Outside Fires (37.9%).