Pueblo West, Colorado Submit your own pictures of this place and show them to the world
OSM Map
General Map
Google Map
MSN Map
OSM Map
General Map
Google Map
MSN Map
OSM Map
General Map
Google Map
MSN Map
OSM Map
General Map
Google Map
MSN Map
Please wait while loading the map...
Population in 2010: 29,637. Population change since 2000: +75.4%Males: 14,724 Females: 14,913
March 2022 cost of living index in Pueblo West: 94.0 (less than average, U.S. average is 100) Percentage of residents living in poverty in 2022: 7.1%for White Non-Hispanic residents , 73.7% for Black residents , 7.3% for Hispanic or Latino residents , 30.7% for American Indian residents , 4.4% for other race residents , 4.3% for two or more races residents )
Profiles of local businesses
Business Search - 14 Million verified businesses
Data:
Median household income ($)
Median household income (% change since 2000)
Household income diversity
Ratio of average income to average house value (%)
Ratio of average income to average rent
Median household income ($) - White
Median household income ($) - Black or African American
Median household income ($) - Asian
Median household income ($) - Hispanic or Latino
Median household income ($) - American Indian and Alaska Native
Median household income ($) - Multirace
Median household income ($) - Other Race
Median household income for houses/condos with a mortgage ($)
Median household income for apartments without a mortgage ($)
Races - White alone (%)
Races - White alone (% change since 2000)
Races - Black alone (%)
Races - Black alone (% change since 2000)
Races - American Indian alone (%)
Races - American Indian alone (% change since 2000)
Races - Asian alone (%)
Races - Asian alone (% change since 2000)
Races - Hispanic (%)
Races - Hispanic (% change since 2000)
Races - Native Hawaiian and Other Pacific Islander alone (%)
Races - Native Hawaiian and Other Pacific Islander alone (% change since 2000)
Races - Two or more races (%)
Races - Two or more races (% change since 2000)
Races - Other race alone (%)
Races - Other race alone (% change since 2000)
Racial diversity
Unemployment (%)
Unemployment (% change since 2000)
Unemployment (%) - White
Unemployment (%) - Black or African American
Unemployment (%) - Asian
Unemployment (%) - Hispanic or Latino
Unemployment (%) - American Indian and Alaska Native
Unemployment (%) - Multirace
Unemployment (%) - Other Race
Population density (people per square mile)
Population - Males (%)
Population - Females (%)
Population - Males (%) - White
Population - Males (%) - Black or African American
Population - Males (%) - Asian
Population - Males (%) - Hispanic or Latino
Population - Males (%) - American Indian and Alaska Native
Population - Males (%) - Multirace
Population - Males (%) - Other Race
Population - Females (%) - White
Population - Females (%) - Black or African American
Population - Females (%) - Asian
Population - Females (%) - Hispanic or Latino
Population - Females (%) - American Indian and Alaska Native
Population - Females (%) - Multirace
Population - Females (%) - Other Race
Coronavirus confirmed cases (May 13, 2024)
Deaths caused by coronavirus (May 13, 2024)
Coronavirus confirmed cases (per 100k population) (May 13, 2024)
Deaths caused by coronavirus (per 100k population) (May 13, 2024)
Daily increase in number of cases (May 13, 2024)
Weekly increase in number of cases (May 13, 2024)
Cases doubled (in days) (May 13, 2024)
Hospitalized patients (Apr 18, 2022)
Negative test results (Apr 18, 2022)
Total test results (Apr 18, 2022)
COVID Vaccine doses distributed (per 100k population) (Sep 19, 2023)
COVID Vaccine doses administered (per 100k population) (Sep 19, 2023)
COVID Vaccine doses distributed (Sep 19, 2023)
COVID Vaccine doses administered (Sep 19, 2023)
Likely homosexual households (%)
Likely homosexual households (% change since 2000)
Likely homosexual households - Lesbian couples (%)
Likely homosexual households - Lesbian couples (% change since 2000)
Likely homosexual households - Gay men (%)
Likely homosexual households - Gay men (% change since 2000)
Cost of living index
Median gross rent ($)
Median contract rent ($)
Median monthly housing costs ($)
Median house or condo value ($)
Median house or condo value ($ change since 2000)
Mean house or condo value by units in structure - 1, detached ($)
Mean house or condo value by units in structure - 1, attached ($)
Mean house or condo value by units in structure - 2 ($)
Mean house or condo value by units in structure by units in structure - 3 or 4 ($)
Mean house or condo value by units in structure - 5 or more ($)
Mean house or condo value by units in structure - Boat, RV, van, etc. ($)
Mean house or condo value by units in structure - Mobile home ($)
Median house or condo value ($) - White
Median house or condo value ($) - Black or African American
Median house or condo value ($) - Asian
Median house or condo value ($) - Hispanic or Latino
Median house or condo value ($) - American Indian and Alaska Native
Median house or condo value ($) - Multirace
Median house or condo value ($) - Other Race
Median resident age
Resident age diversity
Median resident age - Males
Median resident age - Females
Median resident age - White
Median resident age - Black or African American
Median resident age - Asian
Median resident age - Hispanic or Latino
Median resident age - American Indian and Alaska Native
Median resident age - Multirace
Median resident age - Other Race
Median resident age - Males - White
Median resident age - Males - Black or African American
Median resident age - Males - Asian
Median resident age - Males - Hispanic or Latino
Median resident age - Males - American Indian and Alaska Native
Median resident age - Males - Multirace
Median resident age - Males - Other Race
Median resident age - Females - White
Median resident age - Females - Black or African American
Median resident age - Females - Asian
Median resident age - Females - Hispanic or Latino
Median resident age - Females - American Indian and Alaska Native
Median resident age - Females - Multirace
Median resident age - Females - Other Race
Commute - mean travel time to work (minutes)
Travel time to work - Less than 5 minutes (%)
Travel time to work - Less than 5 minutes (% change since 2000)
Travel time to work - 5 to 9 minutes (%)
Travel time to work - 5 to 9 minutes (% change since 2000)
Travel time to work - 10 to 19 minutes (%)
Travel time to work - 10 to 19 minutes (% change since 2000)
Travel time to work - 20 to 29 minutes (%)
Travel time to work - 20 to 29 minutes (% change since 2000)
Travel time to work - 30 to 39 minutes (%)
Travel time to work - 30 to 39 minutes (% change since 2000)
Travel time to work - 40 to 59 minutes (%)
Travel time to work - 40 to 59 minutes (% change since 2000)
Travel time to work - 60 to 89 minutes (%)
Travel time to work - 60 to 89 minutes (% change since 2000)
Travel time to work - 90 or more minutes (%)
Travel time to work - 90 or more minutes (% change since 2000)
Marital status - Never married (%)
Marital status - Now married (%)
Marital status - Separated (%)
Marital status - Widowed (%)
Marital status - Divorced (%)
Median family income ($)
Median family income (% change since 2000)
Median non-family income ($)
Median non-family income (% change since 2000)
Median per capita income ($)
Median per capita income (% change since 2000)
Median family income ($) - White
Median family income ($) - Black or African American
Median family income ($) - Asian
Median family income ($) - Hispanic or Latino
Median family income ($) - American Indian and Alaska Native
Median family income ($) - Multirace
Median family income ($) - Other Race
Median year house/condo built
Median year apartment built
Year house built - Built 2005 or later (%)
Year house built - Built 2000 to 2004 (%)
Year house built - Built 1990 to 1999 (%)
Year house built - Built 1980 to 1989 (%)
Year house built - Built 1970 to 1979 (%)
Year house built - Built 1960 to 1969 (%)
Year house built - Built 1950 to 1959 (%)
Year house built - Built 1940 to 1949 (%)
Year house built - Built 1939 or earlier (%)
Average household size
Household density (households per square mile)
Average household size - White
Average household size - Black or African American
Average household size - Asian
Average household size - Hispanic or Latino
Average household size - American Indian and Alaska Native
Average household size - Multirace
Average household size - Other Race
Occupied housing units (%)
Vacant housing units (%)
Owner occupied housing units (%)
Renter occupied housing units (%)
Vacancy status - For rent (%)
Vacancy status - For sale only (%)
Vacancy status - Rented or sold, not occupied (%)
Vacancy status - For seasonal, recreational, or occasional use (%)
Vacancy status - For migrant workers (%)
Vacancy status - Other vacant (%)
Residents with income below the poverty level (%)
Residents with income below 50% of the poverty level (%)
Children below poverty level (%)
Poor families by family type - Married-couple family (%)
Poor families by family type - Male, no wife present (%)
Poor families by family type - Female, no husband present (%)
Poverty status for native-born residents (%)
Poverty status for foreign-born residents (%)
Poverty among high school graduates not in families (%)
Poverty among people who did not graduate high school not in families (%)
Residents with income below the poverty level (%) - White
Residents with income below the poverty level (%) - Black or African American
Residents with income below the poverty level (%) - Asian
Residents with income below the poverty level (%) - Hispanic or Latino
Residents with income below the poverty level (%) - American Indian and Alaska Native
Residents with income below the poverty level (%) - Multirace
Residents with income below the poverty level (%) - Other Race
Air pollution - Air Quality Index (AQI)
Air pollution - CO
Air pollution - NO2
Air pollution - SO2
Air pollution - Ozone
Air pollution - PM10
Air pollution - PM25
Air pollution - Pb
Crime - Murders per 100,000 population
Crime - Rapes per 100,000 population
Crime - Robberies per 100,000 population
Crime - Assaults per 100,000 population
Crime - Burglaries per 100,000 population
Crime - Thefts per 100,000 population
Crime - Auto thefts per 100,000 population
Crime - Arson per 100,000 population
Crime - City-data.com crime index
Crime - Violent crime index
Crime - Property crime index
Crime - Murders per 100,000 population (5 year average)
Crime - Rapes per 100,000 population (5 year average)
Crime - Robberies per 100,000 population (5 year average)
Crime - Assaults per 100,000 population (5 year average)
Crime - Burglaries per 100,000 population (5 year average)
Crime - Thefts per 100,000 population (5 year average)
Crime - Auto thefts per 100,000 population (5 year average)
Crime - Arson per 100,000 population (5 year average)
Crime - City-data.com crime index (5 year average)
Crime - Violent crime index (5 year average)
Crime - Property crime index (5 year average)
1996 Presidential Elections Results (%) - Democratic Party (Clinton)
1996 Presidential Elections Results (%) - Republican Party (Dole)
1996 Presidential Elections Results (%) - Other
2000 Presidential Elections Results (%) - Democratic Party (Gore)
2000 Presidential Elections Results (%) - Republican Party (Bush)
2000 Presidential Elections Results (%) - Other
2004 Presidential Elections Results (%) - Democratic Party (Kerry)
2004 Presidential Elections Results (%) - Republican Party (Bush)
2004 Presidential Elections Results (%) - Other
2008 Presidential Elections Results (%) - Democratic Party (Obama)
2008 Presidential Elections Results (%) - Republican Party (McCain)
2008 Presidential Elections Results (%) - Other
2012 Presidential Elections Results (%) - Democratic Party (Obama)
2012 Presidential Elections Results (%) - Republican Party (Romney)
2012 Presidential Elections Results (%) - Other
2016 Presidential Elections Results (%) - Democratic Party (Clinton)
2016 Presidential Elections Results (%) - Republican Party (Trump)
2016 Presidential Elections Results (%) - Other
2020 Presidential Elections Results (%) - Democratic Party (Biden)
2020 Presidential Elections Results (%) - Republican Party (Trump)
2020 Presidential Elections Results (%) - Other
Ancestries Reported - Arab (%)
Ancestries Reported - Czech (%)
Ancestries Reported - Danish (%)
Ancestries Reported - Dutch (%)
Ancestries Reported - English (%)
Ancestries Reported - French (%)
Ancestries Reported - French Canadian (%)
Ancestries Reported - German (%)
Ancestries Reported - Greek (%)
Ancestries Reported - Hungarian (%)
Ancestries Reported - Irish (%)
Ancestries Reported - Italian (%)
Ancestries Reported - Lithuanian (%)
Ancestries Reported - Norwegian (%)
Ancestries Reported - Polish (%)
Ancestries Reported - Portuguese (%)
Ancestries Reported - Russian (%)
Ancestries Reported - Scotch-Irish (%)
Ancestries Reported - Scottish (%)
Ancestries Reported - Slovak (%)
Ancestries Reported - Subsaharan African (%)
Ancestries Reported - Swedish (%)
Ancestries Reported - Swiss (%)
Ancestries Reported - Ukrainian (%)
Ancestries Reported - United States (%)
Ancestries Reported - Welsh (%)
Ancestries Reported - West Indian (%)
Ancestries Reported - Other (%)
Educational Attainment - No schooling completed (%)
Educational Attainment - Less than high school (%)
Educational Attainment - High school or equivalent (%)
Educational Attainment - Less than 1 year of college (%)
Educational Attainment - 1 or more years of college (%)
Educational Attainment - Associate degree (%)
Educational Attainment - Bachelor's degree (%)
Educational Attainment - Master's degree (%)
Educational Attainment - Professional school degree (%)
Educational Attainment - Doctorate degree (%)
School Enrollment - Nursery, preschool (%)
School Enrollment - Kindergarten (%)
School Enrollment - Grade 1 to 4 (%)
School Enrollment - Grade 5 to 8 (%)
School Enrollment - Grade 9 to 12 (%)
School Enrollment - College undergrad (%)
School Enrollment - Graduate or professional (%)
School Enrollment - Not enrolled in school (%)
School enrollment - Public schools (%)
School enrollment - Private schools (%)
School enrollment - Not enrolled (%)
Median number of rooms in houses and condos
Median number of rooms in apartments
Housing units lacking complete plumbing facilities (%)
Housing units lacking complete kitchen facilities (%)
Density of houses
Urban houses (%)
Rural houses (%)
Households with people 60 years and over (%)
Households with people 65 years and over (%)
Households with people 75 years and over (%)
Households with one or more nonrelatives (%)
Households with no nonrelatives (%)
Population in households (%)
Family households (%)
Nonfamily households (%)
Population in families (%)
Family households with own children (%)
Median number of bedrooms in owner occupied houses
Mean number of bedrooms in owner occupied houses
Median number of bedrooms in renter occupied houses
Mean number of bedrooms in renter occupied houses
Median number of vehichles in owner occupied houses
Mean number of vehichles in owner occupied houses
Median number of vehichles in renter occupied houses
Mean number of vehichles in renter occupied houses
Mortgage status - with mortgage (%)
Mortgage status - with second mortgage (%)
Mortgage status - with home equity loan (%)
Mortgage status - with both second mortgage and home equity loan (%)
Mortgage status - without a mortgage (%)
Average family size
Average family size - White
Average family size - Black or African American
Average family size - Asian
Average family size - Hispanic or Latino
Average family size - American Indian and Alaska Native
Average family size - Multirace
Average family size - Other Race
Geographical mobility - Same house 1 year ago (%)
Geographical mobility - Moved within same county (%)
Geographical mobility - Moved from different county within same state (%)
Geographical mobility - Moved from different state (%)
Geographical mobility - Moved from abroad (%)
Place of birth - Born in state of residence (%)
Place of birth - Born in other state (%)
Place of birth - Native, outside of US (%)
Place of birth - Foreign born (%)
Housing units in structures - 1, detached (%)
Housing units in structures - 1, attached (%)
Housing units in structures - 2 (%)
Housing units in structures - 3 or 4 (%)
Housing units in structures - 5 to 9 (%)
Housing units in structures - 10 to 19 (%)
Housing units in structures - 20 to 49 (%)
Housing units in structures - 50 or more (%)
Housing units in structures - Mobile home (%)
Housing units in structures - Boat, RV, van, etc. (%)
House/condo owner moved in on average (years ago)
Renter moved in on average (years ago)
Year householder moved into unit - Moved in 1999 to March 2000 (%)
Year householder moved into unit - Moved in 1995 to 1998 (%)
Year householder moved into unit - Moved in 1990 to 1994 (%)
Year householder moved into unit - Moved in 1980 to 1989 (%)
Year householder moved into unit - Moved in 1970 to 1979 (%)
Year householder moved into unit - Moved in 1969 or earlier (%)
Means of transportation to work - Drove car alone (%)
Means of transportation to work - Carpooled (%)
Means of transportation to work - Public transportation (%)
Means of transportation to work - Bus or trolley bus (%)
Means of transportation to work - Streetcar or trolley car (%)
Means of transportation to work - Subway or elevated (%)
Means of transportation to work - Railroad (%)
Means of transportation to work - Ferryboat (%)
Means of transportation to work - Taxicab (%)
Means of transportation to work - Motorcycle (%)
Means of transportation to work - Bicycle (%)
Means of transportation to work - Walked (%)
Means of transportation to work - Other means (%)
Working at home (%)
Industry diversity
Most Common Industries - Agriculture, forestry, fishing and hunting, and mining (%)
Most Common Industries - Agriculture, forestry, fishing and hunting (%)
Most Common Industries - Mining, quarrying, and oil and gas extraction (%)
Most Common Industries - Construction (%)
Most Common Industries - Manufacturing (%)
Most Common Industries - Wholesale trade (%)
Most Common Industries - Retail trade (%)
Most Common Industries - Transportation and warehousing, and utilities (%)
Most Common Industries - Transportation and warehousing (%)
Most Common Industries - Utilities (%)
Most Common Industries - Information (%)
Most Common Industries - Finance and insurance, and real estate and rental and leasing (%)
Most Common Industries - Finance and insurance (%)
Most Common Industries - Real estate and rental and leasing (%)
Most Common Industries - Professional, scientific, and management, and administrative and waste management services (%)
Most Common Industries - Professional, scientific, and technical services (%)
Most Common Industries - Management of companies and enterprises (%)
Most Common Industries - Administrative and support and waste management services (%)
Most Common Industries - Educational services, and health care and social assistance (%)
Most Common Industries - Educational services (%)
Most Common Industries - Health care and social assistance (%)
Most Common Industries - Arts, entertainment, and recreation, and accommodation and food services (%)
Most Common Industries - Arts, entertainment, and recreation (%)
Most Common Industries - Accommodation and food services (%)
Most Common Industries - Other services, except public administration (%)
Most Common Industries - Public administration (%)
Occupation diversity
Most Common Occupations - Management, business, science, and arts occupations (%)
Most Common Occupations - Management, business, and financial occupations (%)
Most Common Occupations - Management occupations (%)
Most Common Occupations - Business and financial operations occupations (%)
Most Common Occupations - Computer, engineering, and science occupations (%)
Most Common Occupations - Computer and mathematical occupations (%)
Most Common Occupations - Architecture and engineering occupations (%)
Most Common Occupations - Life, physical, and social science occupations (%)
Most Common Occupations - Education, legal, community service, arts, and media occupations (%)
Most Common Occupations - Community and social service occupations (%)
Most Common Occupations - Legal occupations (%)
Most Common Occupations - Education, training, and library occupations (%)
Most Common Occupations - Arts, design, entertainment, sports, and media occupations (%)
Most Common Occupations - Healthcare practitioners and technical occupations (%)
Most Common Occupations - Health diagnosing and treating practitioners and other technical occupations (%)
Most Common Occupations - Health technologists and technicians (%)
Most Common Occupations - Service occupations (%)
Most Common Occupations - Healthcare support occupations (%)
Most Common Occupations - Protective service occupations (%)
Most Common Occupations - Fire fighting and prevention, and other protective service workers including supervisors (%)
Most Common Occupations - Law enforcement workers including supervisors (%)
Most Common Occupations - Food preparation and serving related occupations (%)
Most Common Occupations - Building and grounds cleaning and maintenance occupations (%)
Most Common Occupations - Personal care and service occupations (%)
Most Common Occupations - Sales and office occupations (%)
Most Common Occupations - Sales and related occupations (%)
Most Common Occupations - Office and administrative support occupations (%)
Most Common Occupations - Natural resources, construction, and maintenance occupations (%)
Most Common Occupations - Farming, fishing, and forestry occupations (%)
Most Common Occupations - Construction and extraction occupations (%)
Most Common Occupations - Installation, maintenance, and repair occupations (%)
Most Common Occupations - Production, transportation, and material moving occupations (%)
Most Common Occupations - Production occupations (%)
Most Common Occupations - Transportation occupations (%)
Most Common Occupations - Material moving occupations (%)
People in Group quarters - Institutionalized population (%)
People in Group quarters - Correctional institutions (%)
People in Group quarters - Federal prisons and detention centers (%)
People in Group quarters - Halfway houses (%)
People in Group quarters - Local jails and other confinement facilities (including police lockups) (%)
People in Group quarters - Military disciplinary barracks (%)
People in Group quarters - State prisons (%)
People in Group quarters - Other types of correctional institutions (%)
People in Group quarters - Nursing homes (%)
People in Group quarters - Hospitals/wards, hospices, and schools for the handicapped (%)
People in Group quarters - Hospitals/wards and hospices for chronically ill (%)
People in Group quarters - Hospices or homes for chronically ill (%)
People in Group quarters - Military hospitals or wards for chronically ill (%)
People in Group quarters - Other hospitals or wards for chronically ill (%)
People in Group quarters - Hospitals or wards for drug/alcohol abuse (%)
People in Group quarters - Mental (Psychiatric) hospitals or wards (%)
People in Group quarters - Schools, hospitals, or wards for the mentally retarded (%)
People in Group quarters - Schools, hospitals, or wards for the physically handicapped (%)
People in Group quarters - Institutions for the deaf (%)
People in Group quarters - Institutions for the blind (%)
People in Group quarters - Orthopedic wards and institutions for the physically handicapped (%)
People in Group quarters - Wards in general hospitals for patients who have no usual home elsewhere (%)
People in Group quarters - Wards in military hospitals for patients who have no usual home elsewhere (%)
People in Group quarters - Juvenile institutions (%)
People in Group quarters - Long-term care (%)
People in Group quarters - Homes for abused, dependent, and neglected children (%)
People in Group quarters - Residential treatment centers for emotionally disturbed children (%)
People in Group quarters - Training schools for juvenile delinquents (%)
People in Group quarters - Short-term care, detention or diagnostic centers for delinquent children (%)
People in Group quarters - Type of juvenile institution unknown (%)
People in Group quarters - Noninstitutionalized population (%)
People in Group quarters - College dormitories (includes college quarters off campus) (%)
People in Group quarters - Military quarters (%)
People in Group quarters - On base (%)
People in Group quarters - Barracks, unaccompanied personnel housing (UPH), (Enlisted/Officer), ;and similar group living quarters for military personnel (%)
People in Group quarters - Transient quarters for temporary residents (%)
People in Group quarters - Military ships (%)
People in Group quarters - Group homes (%)
People in Group quarters - Homes or halfway houses for drug/alcohol abuse (%)
People in Group quarters - Homes for the mentally ill (%)
People in Group quarters - Homes for the mentally retarded (%)
People in Group quarters - Homes for the physically handicapped (%)
People in Group quarters - Other group homes (%)
People in Group quarters - Religious group quarters (%)
People in Group quarters - Dormitories (%)
People in Group quarters - Agriculture workers' dormitories on farms (%)
People in Group quarters - Job Corps and vocational training facilities (%)
People in Group quarters - Other workers' dormitories (%)
People in Group quarters - Crews of maritime vessels (%)
People in Group quarters - Other nonhousehold living situations (%)
People in Group quarters - Other noninstitutional group quarters (%)
Residents speaking English at home (%)
Residents speaking English at home - Born in the United States (%)
Residents speaking English at home - Native, born elsewhere (%)
Residents speaking English at home - Foreign born (%)
Residents speaking Spanish at home (%)
Residents speaking Spanish at home - Born in the United States (%)
Residents speaking Spanish at home - Native, born elsewhere (%)
Residents speaking Spanish at home - Foreign born (%)
Residents speaking other language at home (%)
Residents speaking other language at home - Born in the United States (%)
Residents speaking other language at home - Native, born elsewhere (%)
Residents speaking other language at home - Foreign born (%)
Class of Workers - Employee of private company (%)
Class of Workers - Self-employed in own incorporated business (%)
Class of Workers - Private not-for-profit wage and salary workers (%)
Class of Workers - Local government workers (%)
Class of Workers - State government workers (%)
Class of Workers - Federal government workers (%)
Class of Workers - Self-employed workers in own not incorporated business and Unpaid family workers (%)
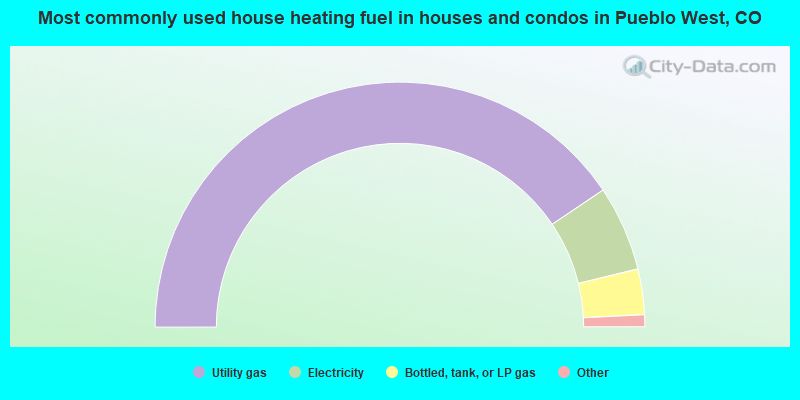
House heating fuel used in houses and condos - Utility gas (%)
House heating fuel used in houses and condos - Bottled, tank, or LP gas (%)
House heating fuel used in houses and condos - Electricity (%)
House heating fuel used in houses and condos - Fuel oil, kerosene, etc. (%)
House heating fuel used in houses and condos - Coal or coke (%)
House heating fuel used in houses and condos - Wood (%)
House heating fuel used in houses and condos - Solar energy (%)
House heating fuel used in houses and condos - Other fuel (%)
House heating fuel used in houses and condos - No fuel used (%)
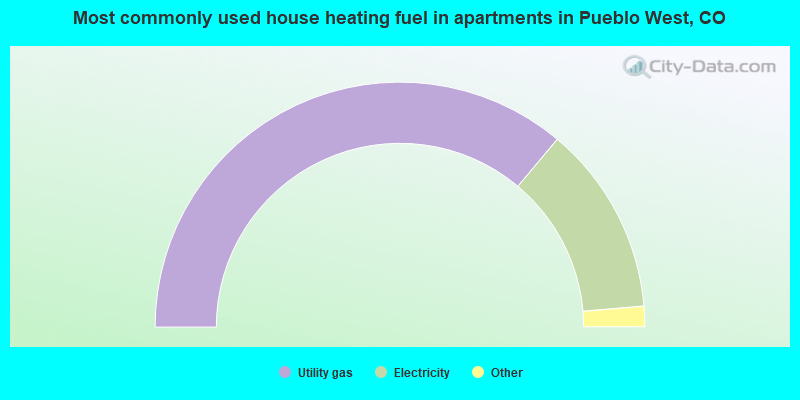
House heating fuel used in apartments - Utility gas (%)
House heating fuel used in apartments - Bottled, tank, or LP gas (%)
House heating fuel used in apartments - Electricity (%)
House heating fuel used in apartments - Fuel oil, kerosene, etc. (%)
House heating fuel used in apartments - Coal or coke (%)
House heating fuel used in apartments - Wood (%)
House heating fuel used in apartments - Solar energy (%)
House heating fuel used in apartments - Other fuel (%)
House heating fuel used in apartments - No fuel used (%)
Armed forces status - In Armed Forces (%)
Armed forces status - Civilian (%)
Armed forces status - Civilian - Veteran (%)
Armed forces status - Civilian - Nonveteran (%)
Fatal accidents locations in years 2005-2021
Fatal accidents locations in 2005
Fatal accidents locations in 2006
Fatal accidents locations in 2007
Fatal accidents locations in 2008
Fatal accidents locations in 2009
Fatal accidents locations in 2010
Fatal accidents locations in 2011
Fatal accidents locations in 2012
Fatal accidents locations in 2013
Fatal accidents locations in 2014
Fatal accidents locations in 2015
Fatal accidents locations in 2016
Fatal accidents locations in 2017
Fatal accidents locations in 2018
Fatal accidents locations in 2019
Fatal accidents locations in 2020
Fatal accidents locations in 2021
Alcohol use - People drinking some alcohol every month (%)
Alcohol use - People not drinking at all (%)
Alcohol use - Average days/month drinking alcohol
Alcohol use - Average drinks/week
Alcohol use - Average days/year people drink much
Audiometry - Average condition of hearing (%)
Audiometry - People that can hear a whisper from across a quiet room (%)
Audiometry - People that can hear normal voice from across a quiet room (%)
Audiometry - Ears ringing, roaring, buzzing (%)
Audiometry - Had a job exposure to loud noise (%)
Audiometry - Had off-work exposure to loud noise (%)
Blood Pressure & Cholesterol - Has high blood pressure (%)
Blood Pressure & Cholesterol - Checking blood pressure at home (%)
Blood Pressure & Cholesterol - Frequently checking blood cholesterol (%)
Blood Pressure & Cholesterol - Has high cholesterol level (%)
Consumer Behavior - Money monthly spent on food at supermarket/grocery store
Consumer Behavior - Money monthly spent on food at other stores
Consumer Behavior - Money monthly spent on eating out
Consumer Behavior - Money monthly spent on carryout/delivered foods
Consumer Behavior - Income spent on food at supermarket/grocery store (%)
Consumer Behavior - Income spent on food at other stores (%)
Consumer Behavior - Income spent on eating out (%)
Consumer Behavior - Income spent on carryout/delivered foods (%)
Current Health Status - General health condition (%)
Current Health Status - Blood donors (%)
Current Health Status - Has blood ever tested for HIV virus (%)
Current Health Status - Left-handed people (%)
Dermatology - People using sunscreen (%)
Diabetes - Diabetics (%)
Diabetes - Had a blood test for high blood sugar (%)
Diabetes - People taking insulin (%)
Diet Behavior & Nutrition - Diet health (%)
Diet Behavior & Nutrition - Milk product consumption (# of products/month)
Diet Behavior & Nutrition - Meals not home prepared (#/week)
Diet Behavior & Nutrition - Meals from fast food or pizza place (#/week)
Diet Behavior & Nutrition - Ready-to-eat foods (#/month)
Diet Behavior & Nutrition - Frozen meals/pizza (#/month)
Drug Use - People that ever used marijuana or hashish (%)
Drug Use - Ever used hard drugs (%)
Drug Use - Ever used any form of cocaine (%)
Drug Use - Ever used heroin (%)
Drug Use - Ever used methamphetamine (%)
Health Insurance - People covered by health insurance (%)
Kidney Conditions-Urology - Avg. # of times urinating at night
Medical Conditions - People with asthma (%)
Medical Conditions - People with anemia (%)
Medical Conditions - People with psoriasis (%)
Medical Conditions - People with overweight (%)
Medical Conditions - Elderly people having difficulties in thinking or remembering (%)
Medical Conditions - People who ever received blood transfusion (%)
Medical Conditions - People having trouble seeing even with glass/contacts (%)
Medical Conditions - People with arthritis (%)
Medical Conditions - People with gout (%)
Medical Conditions - People with congestive heart failure (%)
Medical Conditions - People with coronary heart disease (%)
Medical Conditions - People with angina pectoris (%)
Medical Conditions - People who ever had heart attack (%)
Medical Conditions - People who ever had stroke (%)
Medical Conditions - People with emphysema (%)
Medical Conditions - People with thyroid problem (%)
Medical Conditions - People with chronic bronchitis (%)
Medical Conditions - People with any liver condition (%)
Medical Conditions - People who ever had cancer or malignancy (%)
Mental Health - People who have little interest in doing things (%)
Mental Health - People feeling down, depressed, or hopeless (%)
Mental Health - People who have trouble sleeping or sleeping too much (%)
Mental Health - People feeling tired or having little energy (%)
Mental Health - People with poor appetite or overeating (%)
Mental Health - People feeling bad about themself (%)
Mental Health - People who have trouble concentrating on things (%)
Mental Health - People moving or speaking slowly or too fast (%)
Mental Health - People having thoughts they would be better off dead (%)
Oral Health - Average years since last visit a dentist
Oral Health - People embarrassed because of mouth (%)
Oral Health - People with gum disease (%)
Oral Health - General health of teeth and gums (%)
Oral Health - Average days a week using dental floss/device
Oral Health - Average days a week using mouthwash for dental problem
Oral Health - Average number of teeth
Pesticide Use - Households using pesticides to control insects (%)
Pesticide Use - Households using pesticides to kill weeds (%)
Physical Activity - People doing vigorous-intensity work activities (%)
Physical Activity - People doing moderate-intensity work activities (%)
Physical Activity - People walking or bicycling (%)
Physical Activity - People doing vigorous-intensity recreational activities (%)
Physical Activity - People doing moderate-intensity recreational activities (%)
Physical Activity - Average hours a day doing sedentary activities
Physical Activity - Average hours a day watching TV or videos
Physical Activity - Average hours a day using computer
Physical Functioning - People having limitations keeping them from working (%)
Physical Functioning - People limited in amount of work they can do (%)
Physical Functioning - People that need special equipment to walk (%)
Physical Functioning - People experiencing confusion/memory problems (%)
Physical Functioning - People requiring special healthcare equipment (%)
Prescription Medications - Average number of prescription medicines taking
Preventive Aspirin Use - Adults 40+ taking low-dose aspirin (%)
Reproductive Health - Vaginal deliveries (%)
Reproductive Health - Cesarean deliveries (%)
Reproductive Health - Deliveries resulted in a live birth (%)
Reproductive Health - Pregnancies resulted in a delivery (%)
Reproductive Health - Women breastfeeding newborns (%)
Reproductive Health - Women that had a hysterectomy (%)
Reproductive Health - Women that had both ovaries removed (%)
Reproductive Health - Women that have ever taken birth control pills (%)
Reproductive Health - Women taking birth control pills (%)
Reproductive Health - Women that have ever used Depo-Provera or injectables (%)
Reproductive Health - Women that have ever used female hormones (%)
Sexual Behavior - People 18+ that ever had sex (vaginal, anal, or oral) (%)
Sexual Behavior - Males 18+ that ever had vaginal sex with a woman (%)
Sexual Behavior - Males 18+ that ever performed oral sex on a woman (%)
Sexual Behavior - Males 18+ that ever had anal sex with a woman (%)
Sexual Behavior - Males 18+ that ever had any sex with a man (%)
Sexual Behavior - Females 18+ that ever had vaginal sex with a man (%)
Sexual Behavior - Females 18+ that ever performed oral sex on a man (%)
Sexual Behavior - Females 18+ that ever had anal sex with a man (%)
Sexual Behavior - Females 18+ that ever had any kind of sex with a woman (%)
Sexual Behavior - Average age people first had sex
Sexual Behavior - Average number of female sex partners in lifetime (males 18+)
Sexual Behavior - Average number of female vaginal sex partners in lifetime (males 18+)
Sexual Behavior - Average age people first performed oral sex on a woman (18+)
Sexual Behavior - Average number of woman performed oral sex on in lifetime (18+)
Sexual Behavior - Average number of male sex partners in lifetime (males 18+)
Sexual Behavior - Average number of male anal sex partners in lifetime (males 18+)
Sexual Behavior - Average age people first performed oral sex on a man (18+)
Sexual Behavior - Average number of male oral sex partners in lifetime (18+)
Sexual Behavior - People using protection when performing oral sex (%)
Sexual Behavior - Average number of times people have vaginal or anal sex a year
Sexual Behavior - People having sex without condom (%)
Sexual Behavior - Average number of male sex partners in lifetime (females 18+)
Sexual Behavior - Average number of male vaginal sex partners in lifetime (females 18+)
Sexual Behavior - Average number of female sex partners in lifetime (females 18+)
Sexual Behavior - Circumcised males 18+ (%)
Sleep Disorders - Average hours sleeping at night
Sleep Disorders - People that has trouble sleeping (%)
Smoking-Cigarette Use - People smoking cigarettes (%)
Taste & Smell - People 40+ having problems with smell (%)
Taste & Smell - People 40+ having problems with taste (%)
Taste & Smell - People 40+ that ever had wisdom teeth removed (%)
Taste & Smell - People 40+ that ever had tonsils teeth removed (%)
Taste & Smell - People 40+ that ever had a loss of consciousness because of a head injury (%)
Taste & Smell - People 40+ that ever had a broken nose or other serious injury to face or skull (%)
Taste & Smell - People 40+ that ever had two or more sinus infections (%)
Weight - Average height (inches)
Weight - Average weight (pounds)
Weight - Average BMI
Weight - People that are obese (%)
Weight - People that ever were obese (%)
Weight - People trying to lose weight (%)
21,347 61.7% White alone 11,076 32.0% Hispanic 1,160 3.4% Two or more races 407 1.2% Black alone 361 1.0% Asian alone 86 0.2% American Indian alone 49 0.1% Other race alone 13 0.04% Native Hawaiian and Other
Latest news from Pueblo West, CO collected exclusively by city-data.com from local newspapers, TV, and radio stations
Ancestries: German (17.6%), American (8.9%), English (7.4%), Irish (6.2%), Italian (4.8%), European (4.6%).
Current Local Time:
Land area: 77.5 square miles.
Population density: 383 people per square mile (very low).
1,201 residents are foreign born (2.2% Latin America , 0.6% Asia , 0.5% Europe ).
This place:
3.5%Colorado:
9.5%
Median real estate property taxes paid for housing units with mortgages in 2022: $2,044 (0.5%)Median real estate property taxes paid for housing units with no mortgage in 2022: $1,814 (0.5%)
Nearest city with pop. 50,000+: Pueblo, CO
Nearest city with pop. 200,000+: Colorado Springs, CO
Nearest city with pop. 1,000,000+: Phoenix, AZ
Nearest cities:
Latitude: 38.33 N, Longitude: 104.74 W
Daytime population change due to commuting: -8,694 (-25.1%)Workers who live and work in this place: 3,395 (21.6%)
Area code commonly used in this area: 719
Unemployment in December 2023:
Most common occupations in Pueblo West, CO (%)
Both Males Females
Other sales and related occupations, including supervisors (6.2%)
Law enforcement workers, including supervisors (4.6%)
Other management occupations, except farmers and farm managers (4.3%)
Other office and administrative support workers, including supervisors (3.8%)
Registered nurses (3.5%)
Secretaries and administrative assistants (2.8%)
Other production occupations, including supervisors (2.8%)
Law enforcement workers, including supervisors (6.9%)
Other sales and related occupations, including supervisors (6.4%)
Other management occupations, except farmers and farm managers (5.4%)
Other food preparation and serving workers, including supervisors (3.9%)
Other production occupations, including supervisors (3.9%)
Metal workers and plastic workers (3.7%)
Electrical equipment mechanics and other installation, maintenance, and repair workers, including supervisors (3.4%)
Other office and administrative support workers, including supervisors (6.4%)
Registered nurses (6.2%)
Secretaries and administrative assistants (6.0%)
Other sales and related occupations, including supervisors (6.0%)
Health technologists and technicians (5.0%)
Bookkeeping, accounting, and auditing clerks (3.5%)
Sales representatives, services, wholesale and manufacturing (3.3%)
Tornado activity:
Pueblo West-area historical tornado activity is below Colorado state average. It is 59% smaller than the overall U.S. average.
On 6/24/1979, a category F3 (max. wind speeds 158-206 mph) tornado 34.8 miles away from the Pueblo West place center injured one person and caused between $50,000 and $500,000 in damages.
On 8/21/1984, a category F2 (max. wind speeds 113-157 mph) tornado 9.5 miles away from the place center caused between $500 and $5000 in damages.
Earthquake activity:
Pueblo West-area historical earthquake activity is significantly above Colorado state average. It is 717% greater than the overall U.S. average. On 8/18/1959 at 06:37:13, a magnitude 7.7 (7.7 UK, Class: Major, Intensity: VIII - XII) earthquake occurred 528.8 miles away from the city center, causing $26,000,000 total damage On 8/23/2011 at 05:46:18, a magnitude 5.3 (5.3 MW, Depth: 2.5 mi, Class: Moderate, Intensity: VI - VII) earthquake occurred 87.8 miles away from the city center On 8/10/2005 at 22:08:22, a magnitude 5.0 (5.0 MW, Depth: 3.1 mi) earthquake occurred 95.9 miles away from the city center On 8/10/2005 at 22:08:22, a magnitude 5.0 (5.0 MB, 4.7 MS, 5.0 MW) earthquake occurred 97.7 miles away from Pueblo West center On 8/22/2011 at 23:30:19, a magnitude 4.7 (4.7 MW, Depth: 3.1 mi, Class: Light, Intensity: IV - V) earthquake occurred 90.5 miles away from the city center On 9/5/2001 at 10:52:07, a magnitude 4.5 (4.5 MB, Depth: 3.1 mi) earthquake occurred 82.5 miles away from Pueblo West center Magnitude types: body-wave magnitude (MB), surface-wave magnitude (MS), moment magnitude (MW) Natural disasters: The number of natural disasters in Pueblo County (14) is near the US average (15).Major Disasters (Presidential) Declared: 6Emergencies Declared: 6Floods: 5, Storms: 5, Landslides: 3, Mudslides: 3, Snows: 3, Fires: 2, Tornadoes: 2, Drought: 1, Flash Flood: 1, Heavy Rain: 1, Hurricane: 1, Snowstorm: 1, Other: 1 (Note: some incidents may be assigned to more than one category). Hospitals and medical centers in Pueblo West: PUEBLO WEST DIALYSIS (FMC) (73 N ASPEN SKI WAY)
Other hospitals and medical centers near Pueblo West: ANGELS CARE HOME HEALTH OF PUEBLO (Home Health Center, about 7 miles away; PUEBLO, CO)
CMHIP - GENERAL HOSPITAL (Hospital, about 7 miles away; PUEBLO, CO)
COLORADO MENTAL HEALTH INSTITUTE AT PUEBLO PSYCH (Hospital, about 7 miles away; PUEBLO, CO)
CENTURA HEALTH-ST MARY CORWIN HOME SERVICES (Home Health Center, about 7 miles away; PUEBLO, CO)
PARKVIEW HOMECARE (Home Health Center, about 7 miles away; PUEBLO, CO)
LIBERTY DIALYSIS - PUEBLO (Dialysis Facility, about 8 miles away; PUEBLO, CO)
SHARMAR VILLAGE CARE CENTER (Nursing Home, about 8 miles away; PUEBLO, CO)
Airports located in Pueblo West: Amtrak station near Pueblo West: 8 miles: PUEBLO (703 W. U.S. 50) - Bus Station Services: enclosed waiting area, free short-term parking, call for taxi service, public transit connection.
Colleges/universities with over 2000 students nearest to Pueblo West:
Pueblo Community College (about 8 miles; Pueblo, CO ; Full-time enrollment: 5,329)
Colorado State University-Pueblo (about 9 miles; Pueblo, CO ; FT enrollment: 5,993)
Pikes Peak Community College (about 31 miles; Colorado Springs, CO ; FT enrollment: 10,395)
Colorado College (about 36 miles; Colorado Springs, CO ; FT enrollment: 2,199)
University of Colorado Colorado Springs (about 39 miles; Colorado Springs, CO ; FT enrollment: 8,700)
Colorado Technical University-Online (about 40 miles; Colorado Springs, CO ; FT enrollment: 22,771)
Colorado Technical University-Colorado Springs (about 40 miles; Colorado Springs, CO ; FT enrollment: 2,049)
Public high schools in Pueblo West: PUEBLO WEST HIGH SCHOOL Students: 1,297, Location: 661 CAPISTRANO DRIVE, Grades: 9-12)SWALLOWS CHARTER ACADEMY HIGH SCHOOL Location: 101 CIVIC CENTER DRIVE, Grades: 9-12, Charter school )
Public elementary/middle schools in Pueblo West: SKY VIEW MIDDLE SCHOOL Students: 568, Location: 1047 CAMINO DE BRAVO, Grades: 6-8)SIERRA VISTA ELEMENTARY SCHOOL Students: 547, Location: 500 SOUTH SPAULDING, Grades: PK-5)PRAIRIE WINDS ELEMENTARY SCHOOL Students: 502, Location: 597 E EARL DRIVE, Grades: PK-5)DESERT SAGE ELEMENTARY SCHOOL Students: 478, Location: 935 SOUTH PALOMAR DRIVE, Grades: PK-5)CEDAR RIDGE ELEMENTARY SCHOOL Students: 396, Location: 1266 WEST ORO GRANDE DRIVE, Grades: PK-5)SWALLOWS CHARTER ACADEMY Students: 197, Location: 278 SOUTH MCCULLOCH BOULEVARD, Grades: KG-8, Charter school )LIBERTY POINT ELEMENTARY SCHOOL Location: 386 EAST HAHNS PEAK AVENUE, Grades: PK-5)
LIBERTY POINT INTERNATIONAL SCHOOL Location: 484 SOUTH MAHER DRIVE, Grades: 6-8)
Private elementary/middle school in Pueblo West: PUEBLO WEST CHRISTIAN ACADEMY Students: 36, Location: 1401 W MCCULLOCH BLVD, Grades: PK-8)
See full list of schools located in Pueblo West Pueblo County has a predicted average indoor radon screening level greater than 4 pCi/L (pico curies per liter) - Highest Potential Drinking water stations with addresses in Pueblo West and their reported violations in the past:
BEULAH WATER WORKS DISTRICT (Population served: 355, Surface water):
Past health violations:
MCL, Monthly (TCR) - In AUG-2014, Contaminant: Coliform. Follow-up actions: St Public Notif requested (SEP-02-2014), St Violation/Reminder Notice (SEP-02-2014), St Public Notif received (SEP-10-2014)
Past monitoring violations:
Monitoring and Reporting (DBP) - Between JAN-2010 and MAR-2010, Contaminant: TTHM. Follow-up actions: St Public Notif requested (MAY-12-2010), St Violation/Reminder Notice (MAY-12-2010), St Compliance achieved (SEP-16-2010), St Public Notif received (APR-14-2011)
Monitoring and Reporting (DBP) - Between JAN-2010 and MAR-2010, Contaminant: Total Haloacetic Acids (HAA5). Follow-up actions: St Public Notif requested (MAY-12-2010), St Violation/Reminder Notice (MAY-12-2010), St Compliance achieved (SEP-16-2010), St Public Notif received (APR-14-2011)
Monitoring of Treatment (SWTR-Filter) - In DEC-2009. Follow-up actions: St Public Notif requested (FEB-10-2010), St Violation/Reminder Notice (FEB-10-2010), St Compliance achieved (FEB-16-2010), St Public Notif received (JUN-07-2010)
Monitoring and Reporting (DBP) - Between OCT-2009 and DEC-2009, Contaminant: Chlorine. Follow-up actions: St Public Notif requested (FEB-10-2010), St Violation/Reminder Notice (FEB-10-2010), St Compliance achieved (FEB-16-2010), St Public Notif received (JUN-07-2010)
Monitoring and Reporting (DBP) - Between OCT-2009 and DEC-2009, Contaminant: CARBON, TOTAL. Follow-up actions: St Public Notif requested (FEB-11-2010), St Violation/Reminder Notice (FEB-11-2010), St Public Notif received (JUN-07-2010), St Compliance achieved (JUN-25-2010)
One routine major monitoring violation
4 regular monitoring violations
10 other older monitoring violations
Average household size: This place:
2.8 peopleColorado:
2.5 people
Percentage of family households: This place:
78.4%Whole state:
63.9%
Percentage of households with unmarried partners: This place:
5.5%Whole state:
6.5%
Likely homosexual households (counted as self-reported same-sex unmarried-partner households)
Lesbian couples: 0.3% of all households Gay men: 0.3% of all households
108 people in group homes intended for adults in 2010People in group quarters in Pueblo West in 2000:
89 people in homes for the mentally retarded
18 people in nursing homes
10 people in other group homes
4 people in homes for the physically handicapped
Banks with branches in Pueblo West (2011 data):
Canon National Bank: Pueblo West Branch at 76 South Dunlap Drive, branch established on 1999/05/03. Info updated 2006/11/03: Bank assets: $226.6 mil, Deposits: $201.0 mil, headquarters in Canon City, CO, positive income , Commercial Lending Specialization, 9 total offices , Holding Company: Canon Bank Corporation
Vectra Bank Colorado, National Association: Pueblo West at 154 South Mcculloch Boulevard, branch established on 1982/01/18. Info updated 2006/11/03: Bank assets: $2,356.9 mil, Deposits: $2,003.6 mil, headquarters in Farmington, NM, negative income in the last year , Commercial Lending Specialization, 39 total offices , Holding Company: Zions Bancorporation
Legacy Bank: Pueblo West Branch at 7 East Spaulding Avenue, branch established on 2005/01/03. Info updated 2009/10/05: Bank assets: $252.4 mil, Deposits: $213.1 mil, headquarters in Wiley, CO, positive income , Commercial Lending Specialization, 9 total offices
Frontier Bank: East Spaulding Branch at 18 East Spaulding Avenue, branch established on 2007/09/22. Info updated 2011/01/20: Bank assets: $209.0 mil, Deposits: $179.8 mil, headquarters in Lamar, CO, positive income , Agricultural Specialization, 6 total offices , Holding Company: Whitcorp Financial Company
Colorado East Bank & Trust: Pueblo West Branch at 94 S Tiffany, branch established on 2003/12/17. Info updated 2011/11/01: Bank assets: $798.2 mil, Deposits: $704.8 mil, headquarters in Lamar, CO, negative income in the last year , Agricultural Specialization, 18 total offices , Holding Company: Coloeast Bankshares, Inc.
For population 15 years and over in Pueblo West:
Never married: 26.3%Now married: 59.0%Separated: 1.1%Widowed: 3.9%Divorced: 9.7% For population 25 years and over in Pueblo West:
High school or higher: 92.3%Bachelor's degree or higher: 30.3%Graduate or professional degree: 9.7%Unemployed: 3.8%Mean travel time to work (commute): 26.9 minutes
Education Gini index (Inequality in education) Here:
10.1Colorado average:
11.1
Religion statistics for Pueblo West, CO (based on Pueblo County data)
Religion Adherents Congregations Catholic 72,405 18 Evangelical Protestant 14,339 88 Mainline Protestant 6,572 26 Other 4,946 20 Black Protestant 615 3 Orthodox 135 2 None 60,051 -
Source: Clifford Grammich, Kirk Hadaway, Richard Houseal, Dale E.Jones, Alexei Krindatch, Richie Stanley and Richard H.Taylor. 2012. 2010 U.S.Religion Census: Religious Congregations & Membership Study. Association of Statisticians of American Religious Bodies. Jones, Dale E., et al. 2002. Congregations and Membership in the United States 2000. Nashville, TN: Glenmary Research Center. Graphs represent county-level data
Food Environment Statistics: Number of grocery stores : 18Here :
1.16 / 10,000 pop.State :
1.50 / 10,000 pop.
Number of supercenters and club stores : 3This county :
0.19 / 10,000 pop.Colorado :
0.15 / 10,000 pop.
Number of convenience stores (no gas) : 3This county :
0.19 / 10,000 pop.State :
0.45 / 10,000 pop.
Number of convenience stores (with gas) : 66Pueblo County :
4.27 / 10,000 pop.Colorado :
3.13 / 10,000 pop.
Number of full-service restaurants : 119Pueblo County :
7.69 / 10,000 pop.State :
8.99 / 10,000 pop.
Adult obesity rate : Pueblo County :
23.3%Colorado :
18.4%
Low-income preschool obesity rate : Pueblo County :
10.5%Colorado :
9.6%
Health and Nutrition: Healthy diet rate : Pueblo West:
50.4%Colorado:
49.4%
Average overall health of teeth and gums : This city:
49.5%State:
47.8%
Average BMI : This city:
28.7Colorado:
28.5
People feeling badly about themselves : This city:
21.0%State:
20.7%
People not drinking alcohol at all : Pueblo West:
9.3%Colorado:
9.7%
Average hours sleeping at night : Pueblo West:
6.8Colorado:
6.8
Overweight people : This city:
35.6%Colorado:
33.3%
General health condition : Average condition of hearing : Pueblo West:
80.4%Colorado:
80.2%
More about Health and Nutrition of Pueblo West, CO Residents
Businesses in Pueblo West, CO
Name Count Name Count
Arby's 1 McDonald's 1 AutoZone 1 SONIC Drive-In 1 Carl\s Jr. 1 Starbucks 1 Comfort Inn 1 Subway 2 Cricket Wireless 1 T-Mobile 1 Curves 1 Taco Bell 1 Dairy Queen 1 U-Haul 1 FedEx 1 Walgreens 1 Kroger 1 Walmart 1 Little Caesars Pizza 1
Strongest AM radio stations in Pueblo West:
KGHF (1350 AM; 5 kW; PUEBLO, CO; Owner: CLEAR CHANNEL BROADCASTING LICENSES, INC.)
KFEL (970 AM; 3 kW; PUEBLO, CO; Owner: WELLSPRING HARVEST MINISTRIES, INC.)
KCSJ (590 AM; 1 kW; PUEBLO, CO; Owner: CLEAR CHANNEL BROADCASTING LICENSES, INC.)
KKPC (1230 AM; 1 kW; PUEBLO, CO; Owner: PUBLIC BROADCASTING OF COLORADO, INC.)
KAVA (1480 AM; 1 kW; PUEBLO, CO)
KCBR (1040 AM; daytime; 15 kW; MONUMENT, CO; Owner: KLZ RADIO, INC.)
KRMX (690 AM; 0 kW; PUEBLO, CO; Owner: METROPOLITAN RADIO GROUP, INC.)
KWYD (1580 AM; 10 kW; COLORADO SPRINGS, CO; Owner: PILGRIM COMMUNICATIONS, INC.)
KCMN (1530 AM; 15 kW; COLORADO SPRINGS, CO)
KOA (850 AM; 50 kW; DENVER, CO; Owner: JACOR BROADCASTING OF COLORADO, INC.)
KLTT (670 AM; 50 kW; COMMERCE CITY, CO; Owner: KLZ RADIO, INC.)
KMXA (1090 AM; 50 kW; AURORA, CO; Owner: ENTRAVISION HOLDINGS, LLC)
KKZN (760 AM; 50 kW; THORNTON, CO; Owner: JACOR BROADCASTING OF COLORADO, INC.)
Strongest FM radio stations in Pueblo West:
K252CT (98.3 FM; COALDALE, CO; Owner: COALDALE TV CLUB)
KKMG (98.9 FM; PUEBLO, CO; Owner: CITADEL BROADCASTING COMPANY)
K201CZ (88.1 FM; PUEBLO, CO; Owner: FAMILY STATIONS, INC.)
KKFM (98.1 FM; COLORADO SPRINGS, CO; Owner: CITADEL BROADCASTING COMPANY)
KKCS-FM (101.9 FM; COLORADO SPRINGS, CO; Owner: WALTON STATIONS - COLORADO, INC.)
KBIQ (102.7 FM; MANITOU SPRINGS, CO; Owner: BISON MEDIA, INC.)
K209ET (89.7 FM; PUEBLO WEST, CO; Owner: MAKE A DIFFERENCE FOUNDATION, INC.)
KRCC (91.5 FM; COLORADO SPRINGS, CO; Owner: THE COLORADO COLLEGE)
KSKX (105.5 FM; SECURITY, CO; Owner: OPTIMA COMMUNICATIONS, INC.)
KKLI (106.3 FM; WIDEFIELD, CO; Owner: CAPSTAR TX LIMITED PARTNERSHIP)
KGFT (100.7 FM; PUEBLO, CO; Owner: BISON MEDIA, INC)
KTLF (90.5 FM; COLORADO SPRINGS, CO; Owner: EDUCATIONAL COMMUNICATIONS OF COLORADO SPRINGS, INC.)
KCME (88.7 FM; MANITOU SPRINGS, CO; Owner: CHEYENNE MOUNTAIN PUBLIC BROADCAST HOUSE, INC)
KSPZ (92.9 FM; COLORADO SPRINGS, CO; Owner: CITADEL BROADCASTING COMPANY)
KVUU (99.9 FM; PUEBLO, CO; Owner: CAPSTAR TX LIMITED PARTNERSHIP)
KMOM (96.1 FM; FOUNTAIN, CO; Owner: AMFM TEXAS LICENSES LIMITED PARTNERSHIP)
KDZA-FM (107.9 FM; PUEBLO, CO; Owner: CAPSTAR TX LIMITED PARTNERSHIP)
KILO (94.3 FM; COLORADO SPRINGS, CO; Owner: COLORADO SPRINGS RADIO BCSTERS, INC.)
KRDO-FM (95.1 FM; COLORADO SPRINGS, CO; Owner: THE PIKES PEAK BROADCASTING CO.)
KEPC (89.7 FM; COLORADO SPRINGS, CO; Owner: PIKES PEAK COMMUNITY COLLEGE)
TV broadcast stations around Pueblo West:
K03FH (Channel 3; COALDALE, CO; Owner: COALDALE TV CLUB)
K10AR (Channel 10; COALDALE, CO; Owner: COALDALE TV CLUB)
K48CU (Channel 48; PUEBLO, CO; Owner: FULL GOSPEL OUTREACH, INC.)
K34FB (Channel 34; PUEBLO, CO; Owner: TELEMUNDO OF STEAMBOAT SPRINGS COLO. LIC. CORP.)
KOAA-TV (Channel 5; PUEBLO, CO; Owner: SANGRE DE CRISTO COMMUNICATIONS, INC.)
National Bridge Inventory (NBI) Statistics 16 Number of bridges177ft / 54.0m Total length $1,711,000 Total costs106,347 Total average daily traffic9,081 Total average daily truck traffic138,126 Total future (year 2038) average daily traffic
New bridges - historical statistics
1 1930-1939 2 1950-1959 1 1960-1969 7 1970-1979 2 1990-1999 3 2000-2009
See full National Bridge Inventory statistics for Pueblo West, CO
FCC Registered Antenna Towers: 6
Ronald J Horch, 201 Guffy Drive (Lat: 38.392194 Lon: -104.727917), Type: 79.2, Structure height: 08101 m, Overall height: 77.7 m, Registrant: Eco-Site, Jgeorge@eco-Site.Com, Suite 415, 240 LEIGH FARM RD, S Durha-m, Phone: (919) 636-6810 Ronald J Horch, 201 Guffy Drive, Type: 79.2, Structure height: 08101 m, Overall height: 77.7 m, Registrant: Eco-Site, Ithomas@eco-Site.Com, Suite 230, Durha-m, Phone: (919) 246-8639 Ronald J Horch, 201 Guffy Drive (Lat: 38.392194 Lon: -104.727917), Type: 79.2, Structure height: 08101 m, Overall height: 77.7 m, Registrant: Eco-Site, Ithomas@eco-Site.Com, Suite 230, Durha-m, Phone: (919) 246-8639 Richard J Brainerd, 200 Guffy Drive (Lat: 38.392194 Lon: -104.727917), Type: 80.8, Structure height: 08101 m, Overall height: 77.7 m, Registrant: Fdh Velocitel, Richard.Brainerd@fdhvelocitel.Com, , Ralei-gh, Phone: (919) 367-5245 Richard J Brainerd, 200 Guffy Drive (Lat: 38.392194 Lon: -104.727917), Type: 60.7, Structure height: 08101 m, Overall height: 59.4 m, Registrant: Fdh Velocitel, Richard.Brainerd@fdhvelocitel.Com, , Ralei-gh, Phone: (919) 367-5245 Richard J Brainerd, 200 Guffy Drive (Lat: 38.392194 Lon: -104.727917), Type: 60.7, Structure height: 08101 m, Overall height: 59.4 m, Registrant: Fdh Velocitel, Richard.Brainerd@fdhvelocitel.Com, , Ralei-gh, Phone: (919) 367-5245 FCC Registered Broadcast Land Mobile Towers: 7
Mccculloch Ave & Capistrano Ave (Lat: 38.402222 Lon: -104.694417), Call Sign: WNBT361, Assigned Frequencies: 173.203 MHz, Grant Date: 12/30/2014, Expiration Date: 02/01/2025, Registrant: Federal Licensing Inc, 1588 Fairfield Road, Gettysburg, PA 17325, Phone: (717) 334-9262, Fax: (717) 334-6440, Email:
Lat: 38.338333 Lon: -104.687500, Call Sign: WPYM565, Assigned Frequencies: 151.775 MHz, 151.895 MHz, Grant Date: 09/09/2003, Expiration Date: 09/09/2013, Cancellation Date: 11/09/2013, Certifier: Bill Johanssen, Registrant: Communication Solutions, Inc., 384 E Garden Of The Gods, Colorado Springs, CO 80907, Phone: (719) 578-8435, Fax: (719) 520-1274Hwy 50 & Mcculloch (Lat: 38.342611 Lon: -104.769556), Call Sign: WQFV818, Assigned Frequencies: 468.762 MHz, 468.837 MHz, 469.137 MHz, 469.462 MHz, 469.637 MHz, 469.662 MHz, 469.887 MHz, 457.512 MHz, 457.537 MHz, 457.562 MHz, 457.587 MHz, 457.612 MHz, Grant Date: 10/17/2006, Expiration Date: 10/17/2016, Cancellation Date: 12/17/2016, Certifier: Phyllis Jeffries, Registrant: Hm Electronics, Inc., 14110 Stowe Drive, Poway, CA 92064, Phone: (858) 535-6047, Fax: (858) 535-6047, Email:
MP 104.7, Mp 104.7 (Lat: 38.456389 Lon: -104.605500), Type: Bant, Structure height: 4 m, Call Sign: WQPU873, Assigned Frequencies: 160.650 MHz, 160.920 MHz, Grant Date: 07/16/2022, Expiration Date: 08/21/2032, Certifier: Thomas J Mcgovern, Registrant: Concentrix, 222 So 15th St. Suite 505 N, Omaha, NE 68102, Phone: (402) 522-5068, Email:
484 South Maher Drive (Lat: 38.317361 Lon: -104.729222), Type: Mast, Structure height: 4.6 m, Overall height: 6.2 m, Call Sign: WQTJ955, Assigned Frequencies: 72.2800 MHz, Grant Date: 02/20/2014, Expiration Date: 02/20/2024, Cancellation Date: 03/20/2014, Certifier: Kim Gorjance, Registrant: Primex Wireless, Inc., 965 Wells Street, Lake Geneva, WI 53147, Phone: (800) 537-0464 MOB, Lat: 38.322667 Lon: -104.665639, Call Sign: WRBM338, Assigned Frequencies: 451.387 MHz, 452.662 MHz, 456.387 MHz, 457.662 MHz, 462.462 MHz, Grant Date: 04/25/2018, Expiration Date: 04/25/2028, Certifier: Kymberly Smith, Registrant: Wildhorse Self Storage, 1720 Wildhorse Rd., Pueblo, CO 81007, Phone: (719) 545-9453, Email:
Lat: 38.348694 Lon: -104.649750, Call Sign: WRJG301, Assigned Frequencies: 462.437 MHz, 467.437 MHz, 462.287 MHz, 467.287 MHz, 467.312 MHz, Grant Date: 08/25/2020, Expiration Date: 08/25/2030, Certifier: John Schroeder, Registrant: Fit, 1565 Oak St, Eugene, OR 97401, Phone: (541) 485-8441, Fax: (541) 485-7556, Email:
FCC Registered Microwave Towers: 28 (
See the full list of FCC Registered Microwave Towers in this town )
FCC Registered Maritime Coast & Aviation Ground Towers: 1 (
See the full list of FCC Registered Maritime Coast & Aviation Ground Towers )
FCC Registered Amateur Radio Licenses: 134 (
See the full list of FCC Registered Amateur Radio Licenses in Pueblo West )
FAA Registered Aircraft Manufacturers and Dealers: 3 (
See the full list of FAA Registered Manufacturers and Dealers in Pueblo West )
FAA Registered Aircraft: 22 (
See the full list of FAA Registered Aircraft )
Home Mortgage Disclosure Act Aggregated Statistics For Year 2009(Based on 1 full and 4 partial tracts) A) FHA, FSA/RHS & VA B) Conventional C) Refinancings D) Home Improvement Loans E) Loans on Dwellings For 5+ Families F) Non-occupant Loans on G) Loans On Manufactured Number Average Value Number Average Value Number Average Value Number Average Value Number Average Value Number Average Value Number Average Value
LOANS ORIGINATED 170 $153,487 99 $146,659 608 $159,395 23 $70,593 1 $1,250,000 35 $144,104 11 $64,746 APPLICATIONS APPROVED, NOT ACCEPTED 10 $183,437 7 $166,389 44 $161,046 3 $49,780 0 $0 4 $162,270 1 $45,410 APPLICATIONS DENIED 16 $142,775 11 $101,465 154 $167,293 28 $50,866 0 $0 7 $118,794 11 $57,668 APPLICATIONS WITHDRAWN 12 $140,077 7 $120,087 111 $162,044 6 $90,705 0 $0 7 $135,966 2 $67,640 FILES CLOSED FOR INCOMPLETENESS 1 $226,230 1 $124,390 21 $143,634 0 $0 0 $0 0 $0 1 $45,610
Aggregated Statistics For Year 2008(Based on 1 full and 4 partial tracts) A) FHA, FSA/RHS & VA B) Conventional C) Refinancings D) Home Improvement Loans E) Loans on Dwellings For 5+ Families F) Non-occupant Loans on G) Loans On Manufactured Number Average Value Number Average Value Number Average Value Number Average Value Number Average Value Number Average Value Number Average Value
LOANS ORIGINATED 141 $152,951 183 $143,197 300 $158,417 45 $43,627 1 $170,520 50 $134,996 16 $63,998 APPLICATIONS APPROVED, NOT ACCEPTED 6 $164,250 15 $147,357 42 $153,963 11 $94,632 0 $0 4 $152,495 2 $55,975 APPLICATIONS DENIED 16 $165,664 33 $153,239 221 $159,793 37 $52,718 0 $0 18 $136,733 7 $58,473 APPLICATIONS WITHDRAWN 12 $141,582 19 $142,229 79 $159,052 13 $89,215 0 $0 9 $110,370 3 $57,877 FILES CLOSED FOR INCOMPLETENESS 3 $146,673 1 $213,810 19 $186,022 3 $73,927 0 $0 2 $125,265 0 $0
Aggregated Statistics For Year 2007(Based on 1 full and 4 partial tracts) A) FHA, FSA/RHS & VA B) Conventional C) Refinancings D) Home Improvement Loans E) Loans on Dwellings For 5+ Families F) Non-occupant Loans on G) Loans On Manufactured Number Average Value Number Average Value Number Average Value Number Average Value Number Average Value Number Average Value Number Average Value
LOANS ORIGINATED 90 $156,205 361 $138,019 383 $138,430 64 $50,484 0 $0 79 $126,055 15 $66,187 APPLICATIONS APPROVED, NOT ACCEPTED 5 $186,578 46 $124,311 78 $152,832 18 $67,169 0 $0 10 $139,571 3 $45,437 APPLICATIONS DENIED 12 $148,952 88 $139,946 343 $148,569 55 $53,351 1 $500,000 25 $135,281 14 $72,534 APPLICATIONS WITHDRAWN 6 $136,157 35 $125,115 133 $147,500 11 $57,573 0 $0 14 $129,494 3 $79,990 FILES CLOSED FOR INCOMPLETENESS 0 $0 14 $133,575 36 $167,308 3 $126,277 1 $135,000 2 $156,300 0 $0
Aggregated Statistics For Year 2006(Based on 1 full and 4 partial tracts) A) FHA, FSA/RHS & VA B) Conventional C) Refinancings D) Home Improvement Loans E) Loans on Dwellings For 5+ Families F) Non-occupant Loans on G) Loans On Manufactured Number Average Value Number Average Value Number Average Value Number Average Value Number Average Value Number Average Value Number Average Value
LOANS ORIGINATED 88 $150,681 607 $117,472 492 $122,170 46 $45,227 1 $1,250,000 122 $108,328 23 $64,492 APPLICATIONS APPROVED, NOT ACCEPTED 4 $133,208 61 $103,980 102 $131,055 13 $52,255 0 $0 9 $123,252 7 $46,763 APPLICATIONS DENIED 11 $149,332 132 $112,153 365 $136,728 51 $57,306 1 $1,000 30 $111,844 12 $69,594 APPLICATIONS WITHDRAWN 9 $136,594 89 $130,688 229 $150,465 5 $53,800 0 $0 20 $126,285 3 $77,017 FILES CLOSED FOR INCOMPLETENESS 0 $0 14 $98,275 48 $144,329 1 $100,480 0 $0 4 $147,492 1 $107,250
Aggregated Statistics For Year 2005(Based on 1 full and 4 partial tracts) A) FHA, FSA/RHS & VA B) Conventional C) Refinancings D) Home Improvement Loans E) Loans on Dwellings For 5+ Families F) Non-occupant Loans on G) Loans On Manufactured Number Average Value Number Average Value Number Average Value Number Average Value Number Average Value Number Average Value Number Average Value
LOANS ORIGINATED 83 $134,615 595 $111,476 581 $126,674 67 $54,000 1 $82,410 101 $119,361 20 $55,354 APPLICATIONS APPROVED, NOT ACCEPTED 3 $144,440 68 $119,972 96 $139,509 12 $31,407 0 $0 21 $137,642 5 $53,672 APPLICATIONS DENIED 7 $129,783 119 $105,073 350 $139,725 77 $39,573 0 $0 33 $113,662 17 $60,239 APPLICATIONS WITHDRAWN 6 $168,640 84 $135,577 278 $148,868 22 $133,054 0 $0 37 $148,311 6 $81,578 FILES CLOSED FOR INCOMPLETENESS 0 $0 23 $113,839 96 $166,183 3 $33,887 0 $0 7 $149,730 2 $36,340
Aggregated Statistics For Year 2004(Based on 1 full and 4 partial tracts) A) FHA, FSA/RHS & VA B) Conventional C) Refinancings D) Home Improvement Loans E) Loans on Dwellings For 5+ Families F) Non-occupant Loans on G) Loans On Manufactured Number Average Value Number Average Value Number Average Value Number Average Value Number Average Value Number Average Value Number Average Value
LOANS ORIGINATED 116 $131,831 515 $115,624 598 $130,247 42 $53,592 0 $0 124 $130,495 18 $57,051 APPLICATIONS APPROVED, NOT ACCEPTED 3 $185,113 52 $132,639 113 $145,708 8 $43,670 0 $0 10 $152,658 6 $59,847 APPLICATIONS DENIED 18 $129,777 95 $111,600 334 $136,240 57 $39,706 1 $42,900 39 $139,772 17 $72,310 APPLICATIONS WITHDRAWN 10 $150,103 67 $112,802 218 $139,751 8 $49,464 0 $0 19 $142,657 7 $103,887 FILES CLOSED FOR INCOMPLETENESS 2 $112,975 14 $142,384 63 $135,292 4 $45,765 0 $0 13 $137,157 1 $75,000
Aggregated Statistics For Year 2003(Based on 1 full and 4 partial tracts) A) FHA, FSA/RHS & VA B) Conventional C) Refinancings D) Home Improvement Loans E) Loans on Dwellings For 5+ Families F) Non-occupant Loans on Number Average Value Number Average Value Number Average Value Number Average Value Number Average Value Number Average Value
LOANS ORIGINATED 100 $130,222 382 $127,157 1,208 $124,874 48 $26,291 1 $4,000 143 $114,226 APPLICATIONS APPROVED, NOT ACCEPTED 7 $126,930 33 $121,948 157 $125,690 10 $27,936 0 $0 16 $119,376 APPLICATIONS DENIED 8 $118,956 47 $116,661 306 $120,990 37 $29,362 0 $0 37 $119,059 APPLICATIONS WITHDRAWN 11 $137,195 41 $124,240 252 $133,331 9 $41,673 0 $0 24 $138,772 FILES CLOSED FOR INCOMPLETENESS 0 $0 10 $90,043 43 $140,180 5 $37,890 0 $0 3 $118,123
Aggregated Statistics For Year 2001(Based on 1 partial tract) A) FHA, FSA/RHS & VA B) Conventional C) Refinancings D) Home Improvement Loans F) Non-occupant Loans on Number Average Value Number Average Value Number Average Value Number Average Value Number Average Value
LOANS ORIGINATED 7 $108,313 17 $127,935 27 $107,443 3 $14,883 2 $110,655 APPLICATIONS APPROVED, NOT ACCEPTED 1 $76,790 3 $125,107 5 $105,822 0 $0 1 $86,280 APPLICATIONS DENIED 0 $0 5 $122,820 15 $90,005 2 $13,480 1 $62,980 APPLICATIONS WITHDRAWN 1 $99,010 3 $103,607 12 $103,177 0 $0 0 $0 FILES CLOSED FOR INCOMPLETENESS 0 $0 1 $124,670 3 $95,557 0 $0 0 $0
Aggregated Statistics For Year 2000(Based on 1 partial tract) A) FHA, FSA/RHS & VA B) Conventional C) Refinancings D) Home Improvement Loans Number Average Value Number Average Value Number Average Value Number Average Value
LOANS ORIGINATED 5 $102,458 14 $98,960 13 $94,012 2 $20,600 APPLICATIONS APPROVED, NOT ACCEPTED 0 $0 2 $116,480 2 $101,595 0 $0 APPLICATIONS DENIED 1 $95,120 6 $110,367 8 $84,258 1 $14,670 APPLICATIONS WITHDRAWN 0 $0 4 $111,085 4 $95,500 0 $0 FILES CLOSED FOR INCOMPLETENESS 0 $0 1 $106,120 2 $96,420 0 $0
Aggregated Statistics For Year 1999(Based on 2 partial tracts) A) FHA, FSA/RHS & VA B) Conventional C) Refinancings D) Home Improvement Loans E) Loans on Dwellings For 5+ Families F) Non-occupant Loans on Number Average Value Number Average Value Number Average Value Number Average Value Number Average Value Number Average Value
LOANS ORIGINATED 77 $104,985 234 $101,578 277 $93,486 55 $21,423 0 $0 40 $96,377 APPLICATIONS APPROVED, NOT ACCEPTED 3 $94,547 36 $100,541 55 $88,619 14 $20,942 1 $110,190 4 $141,578 APPLICATIONS DENIED 5 $98,618 74 $86,130 141 $73,799 42 $15,995 0 $0 11 $102,919 APPLICATIONS WITHDRAWN 6 $102,307 37 $95,076 84 $99,433 4 $26,298 0 $0 7 $115,166 FILES CLOSED FOR INCOMPLETENESS 5 $89,426 7 $92,419 21 $107,830 2 $30,625 0 $0 3 $119,070
Detailed HMDA statistics for the following Tracts:
0029.05
, 0029.06 , 0029.07 , 0029.08 , 0029.09
Private Mortgage Insurance Companies Aggregated Statistics For Year 2009(Based on 1 full and 4 partial tracts) A) Conventional B) Refinancings C) Non-occupant Loans on Number Average Value Number Average Value Number Average Value
LOANS ORIGINATED 19 $187,625 23 $186,557 1 $174,980 APPLICATIONS APPROVED, NOT ACCEPTED 7 $136,789 7 $201,021 2 $153,875 APPLICATIONS DENIED 6 $113,870 9 $170,267 0 $0 APPLICATIONS WITHDRAWN 3 $142,317 4 $183,762 0 $0 FILES CLOSED FOR INCOMPLETENESS 2 $192,665 0 $0 1 $235,330
Aggregated Statistics For Year 2008(Based on 1 full and 4 partial tracts) A) Conventional B) Refinancings C) Non-occupant Loans on Number Average Value Number Average Value Number Average Value
LOANS ORIGINATED 71 $170,759 32 $188,776 8 $169,885 APPLICATIONS APPROVED, NOT ACCEPTED 21 $152,948 14 $174,284 6 $128,988 APPLICATIONS DENIED 6 $202,348 3 $261,420 2 $168,550 APPLICATIONS WITHDRAWN 5 $137,482 2 $169,265 0 $0 FILES CLOSED FOR INCOMPLETENESS 3 $175,717 0 $0 1 $145,140
Aggregated Statistics For Year 2007(Based on 1 full and 4 partial tracts) A) Conventional B) Refinancings C) Non-occupant Loans on D) Loans On Manufactured Number Average Value Number Average Value Number Average Value Number Average Value
LOANS ORIGINATED 118 $164,291 54 $178,658 15 $166,025 1 $43,020 APPLICATIONS APPROVED, NOT ACCEPTED 16 $172,854 11 $169,638 0 $0 1 $94,850 APPLICATIONS DENIED 2 $136,375 5 $202,616 2 $225,030 0 $0 APPLICATIONS WITHDRAWN 7 $151,819 1 $223,080 2 $124,770 0 $0 FILES CLOSED FOR INCOMPLETENESS 1 $73,430 1 $99,000 1 $99,000 1 $25,400
Aggregated Statistics For Year 2006(Based on 1 full and 4 partial tracts) A) Conventional B) Refinancings C) Non-occupant Loans on D) Loans On Manufactured Number Average Value Number Average Value Number Average Value Number Average Value
LOANS ORIGINATED 60 $153,794 34 $179,746 8 $164,815 1 $27,990 APPLICATIONS APPROVED, NOT ACCEPTED 10 $165,043 10 $158,192 1 $180,000 0 $0 APPLICATIONS DENIED 0 $0 1 $117,970 0 $0 0 $0 APPLICATIONS WITHDRAWN 1 $158,530 1 $109,400 0 $0 0 $0 FILES CLOSED FOR INCOMPLETENESS 0 $0 0 $0 0 $0 0 $0
Aggregated Statistics For Year 2005(Based on 1 full and 4 partial tracts) A) Conventional B) Refinancings C) Non-occupant Loans on D) Loans On Manufactured Number Average Value Number Average Value Number Average Value Number Average Value
LOANS ORIGINATED 63 $154,523 49 $156,801 9 $154,027 1 $62,710 APPLICATIONS APPROVED, NOT ACCEPTED 9 $187,901 10 $160,485 4 $147,788 0 $0 APPLICATIONS DENIED 0 $0 0 $0 0 $0 0 $0 APPLICATIONS WITHDRAWN 3 $163,913 5 $132,946 1 $90,000 0 $0 FILES CLOSED FOR INCOMPLETENESS 0 $0 0 $0 0 $0 0 $0
Aggregated Statistics For Year 2004(Based on 1 full and 4 partial tracts) A) Conventional B) Refinancings C) Non-occupant Loans on D) Loans On Manufactured Number Average Value Number Average Value Number Average Value Number Average Value
LOANS ORIGINATED 75 $144,686 61 $152,733 18 $143,170 1 $35,760 APPLICATIONS APPROVED, NOT ACCEPTED 13 $173,749 20 $148,059 2 $129,085 0 $0 APPLICATIONS DENIED 2 $200,390 0 $0 1 $231,660 0 $0 APPLICATIONS WITHDRAWN 5 $192,006 6 $160,472 2 $171,855 0 $0 FILES CLOSED FOR INCOMPLETENESS 0 $0 0 $0 0 $0 0 $0
Aggregated Statistics For Year 2003(Based on 1 full and 4 partial tracts) A) Conventional B) Refinancings C) Non-occupant Loans on Number Average Value Number Average Value Number Average Value
LOANS ORIGINATED 117 $153,474 167 $146,351 27 $135,893 APPLICATIONS APPROVED, NOT ACCEPTED 9 $158,624 35 $151,425 5 $195,932 APPLICATIONS DENIED 3 $108,957 4 $139,755 1 $67,900 APPLICATIONS WITHDRAWN 3 $141,007 10 $139,225 1 $78,650 FILES CLOSED FOR INCOMPLETENESS 0 $0 1 $154,530 0 $0
Aggregated Statistics For Year 2002(Based on 1 partial tract) A) Conventional B) Refinancings C) Non-occupant Loans on Number Average Value Number Average Value Number Average Value
LOANS ORIGINATED 7 $153,054 8 $147,000 1 $123,160 APPLICATIONS APPROVED, NOT ACCEPTED 0 $0 2 $104,720 0 $0 APPLICATIONS DENIED 0 $0 0 $0 0 $0 APPLICATIONS WITHDRAWN 0 $0 0 $0 0 $0 FILES CLOSED FOR INCOMPLETENESS 0 $0 0 $0 0 $0
Aggregated Statistics For Year 2001(Based on 1 partial tract) A) Conventional B) Refinancings Number Average Value Number Average Value
LOANS ORIGINATED 10 $128,298 5 $136,106 APPLICATIONS APPROVED, NOT ACCEPTED 2 $99,655 2 $104,075 APPLICATIONS DENIED 0 $0 0 $0 APPLICATIONS WITHDRAWN 0 $0 0 $0 FILES CLOSED FOR INCOMPLETENESS 0 $0 0 $0
Aggregated Statistics For Year 2000(Based on 1 partial tract) A) Conventional B) Refinancings Number Average Value Number Average Value
LOANS ORIGINATED 5 $129,980 3 $124,317 APPLICATIONS APPROVED, NOT ACCEPTED 1 $87,570 1 $90,810 APPLICATIONS DENIED 0 $0 0 $0 APPLICATIONS WITHDRAWN 0 $0 0 $0 FILES CLOSED FOR INCOMPLETENESS 0 $0 0 $0
Aggregated Statistics For Year 1999(Based on 2 partial tracts) A) Conventional B) Refinancings C) Non-occupant Loans on Number Average Value Number Average Value Number Average Value
LOANS ORIGINATED 79 $127,674 43 $126,577 4 $138,502 APPLICATIONS APPROVED, NOT ACCEPTED 7 $110,834 7 $134,717 1 $107,110 APPLICATIONS DENIED 4 $129,620 3 $106,257 1 $68,670 APPLICATIONS WITHDRAWN 3 $144,117 3 $123,340 0 $0 FILES CLOSED FOR INCOMPLETENESS 1 $110,700 1 $66,110 0 $0
Detailed PMIC statistics for the following Tracts:
0029.05
, 0029.06 , 0029.07 , 0029.08 , 0029.09 Pueblo West compared to Colorado state average:
Unemployed percentage significantly below state average. Hispanic race population percentage significantly above state average. Renting percentage below state average. House age significantly below state average. Pueblo West on our top lists :
#92 on the list of "Top 100 cities with newest houses (pop. 5,000+)"
#57 on the list of "Top 101 counties with the smallest number of children under 18 without health insurance coverage in 2000 (pop. 50,000+)"
#93 on the list of "Top 101 counties with the lowest Particulate Matter (PM2.5 ) Annual air pollution readings in 2012 (µg/m3 )"
Top Patent Applicants
Jeffrey B. Sampsell (49)
James L. Ratcliff (11)
Jeffrey Brian Sampsell (9)
Terrill J. Curtis (8)
Jean-Francois Le Costaouec (7)
Paul Perea (7)
Christopher T. Kirkpatrick (6)
Jean-Francois Lecostaouec (5)
William Niichel (4)
Peter Norman (4)
Total of 141 patent applications in 2008-2024.


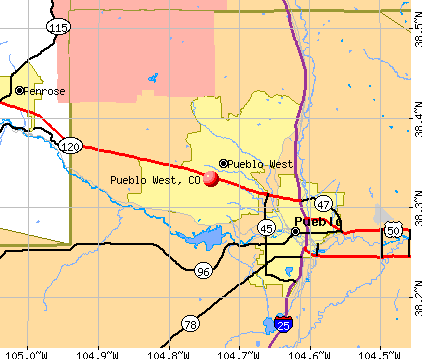


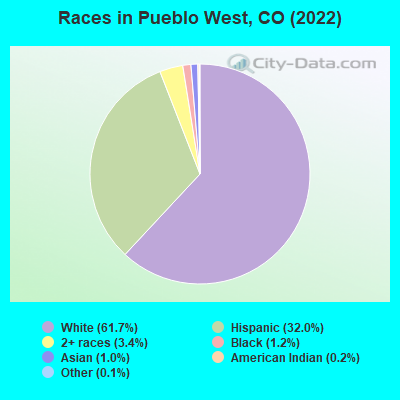
 Recent articles from our blog. Our writers, many of them Ph.D. graduates or candidates, create easy-to-read articles on a wide variety of topics.


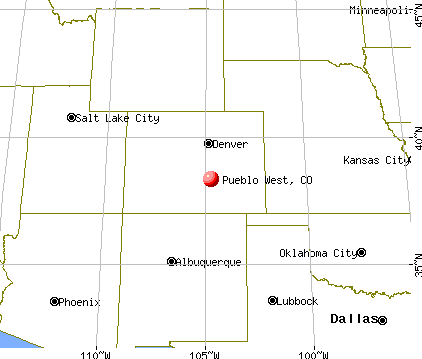
 (7.9 miles
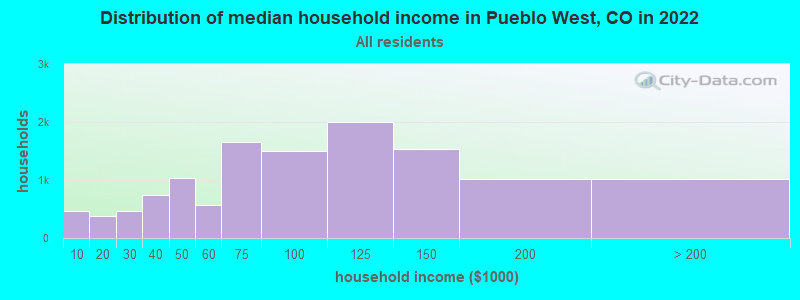
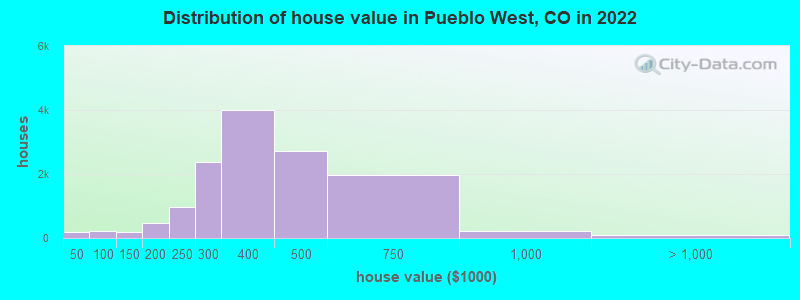
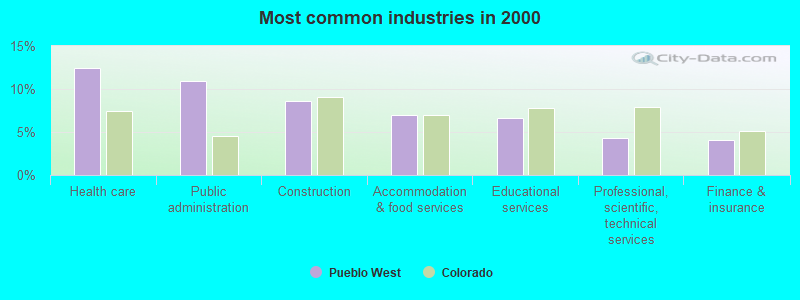
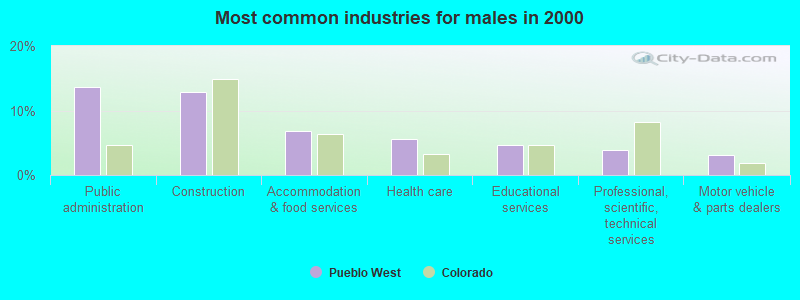
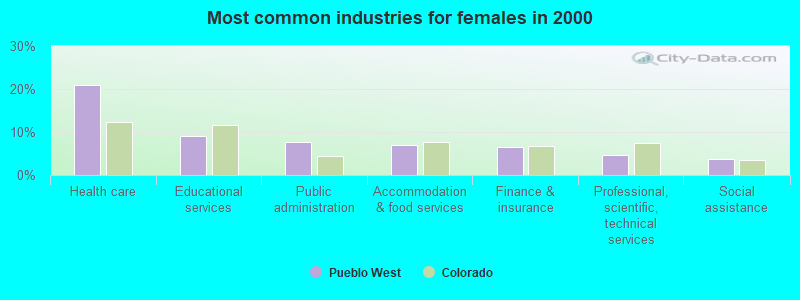
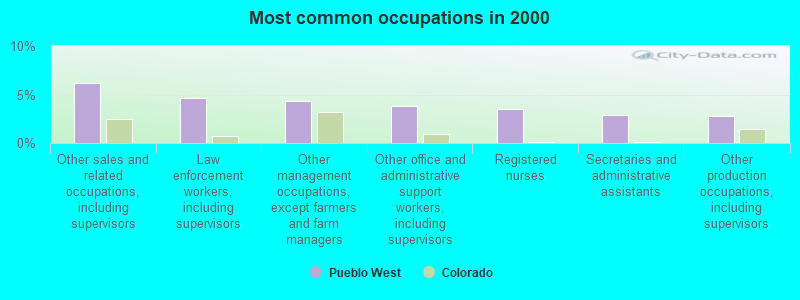
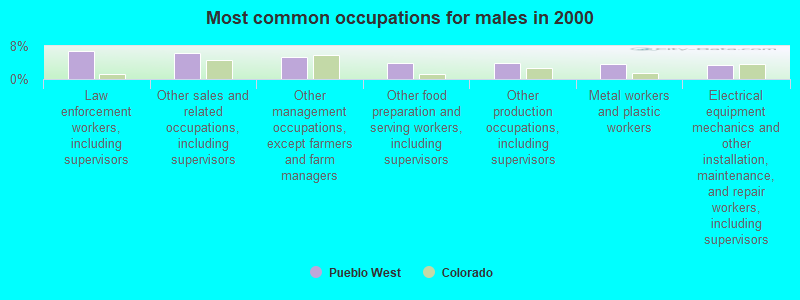
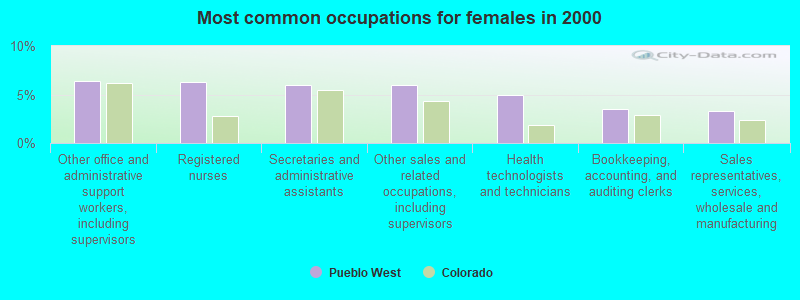
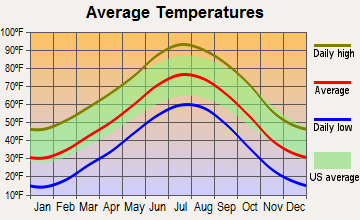
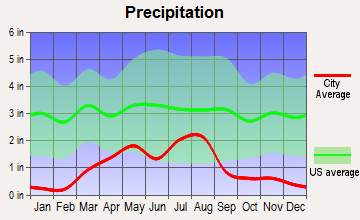
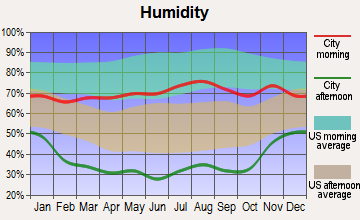
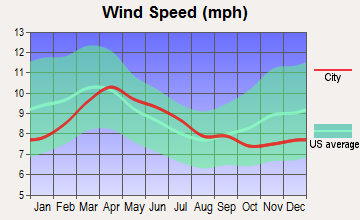
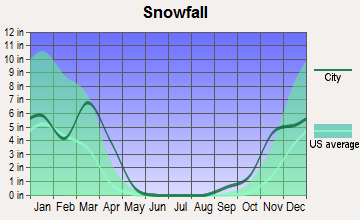
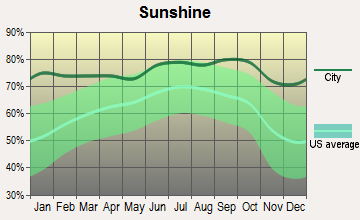
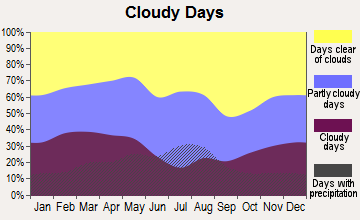
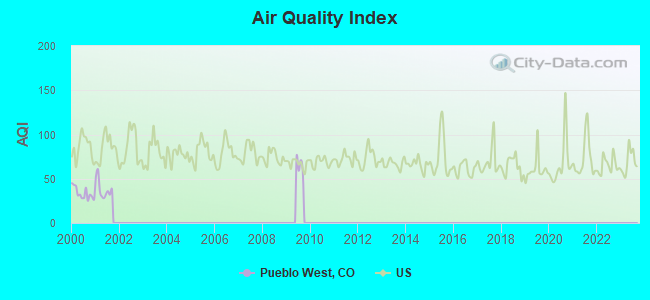
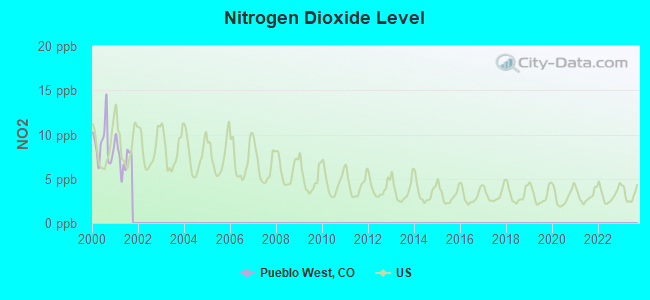
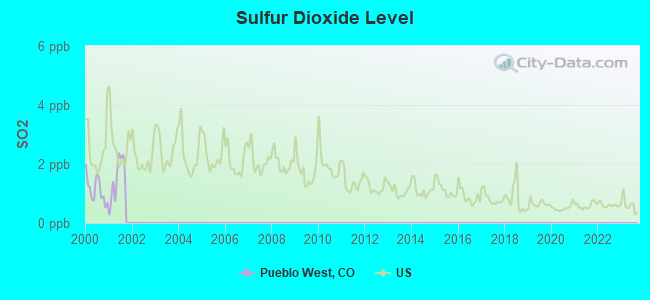
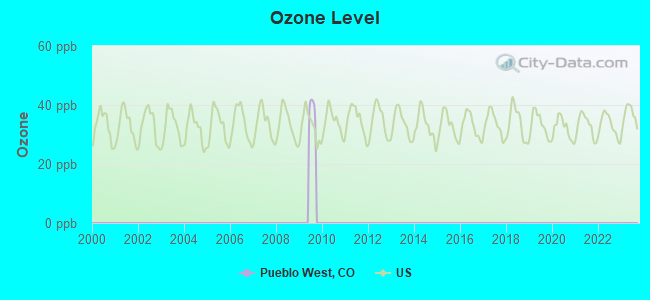
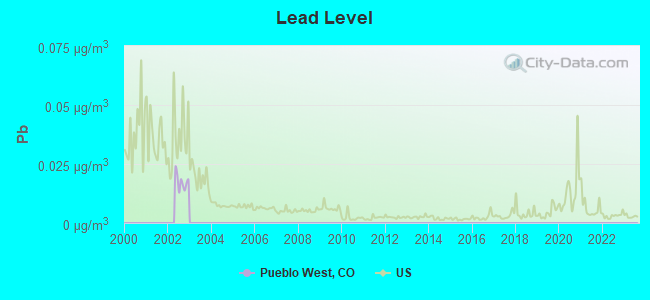
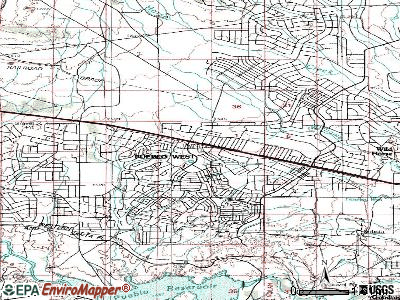
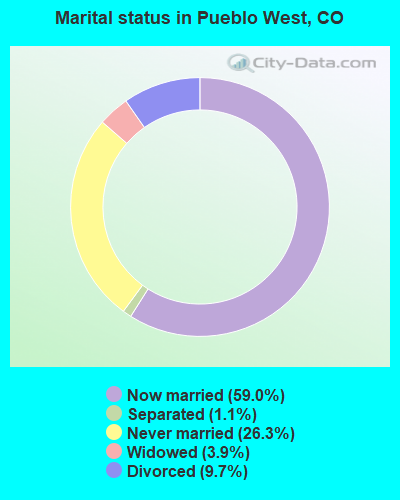
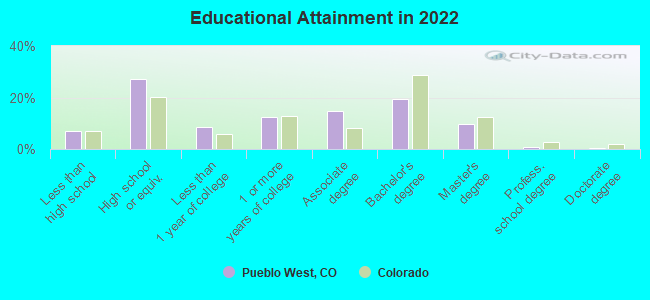
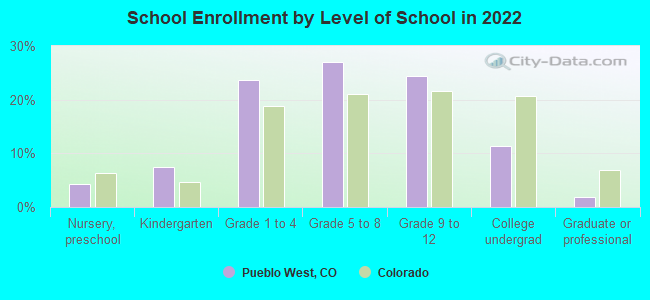
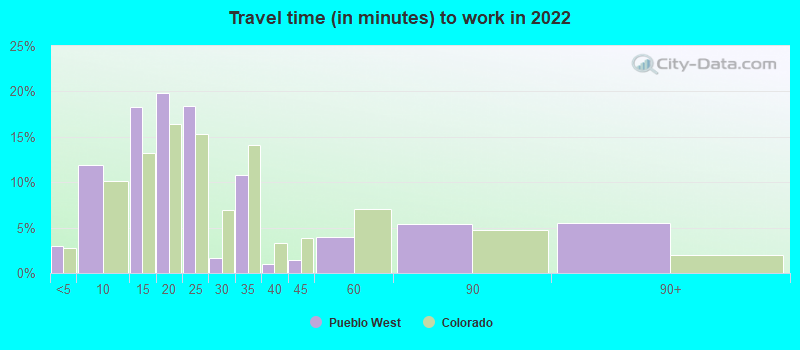
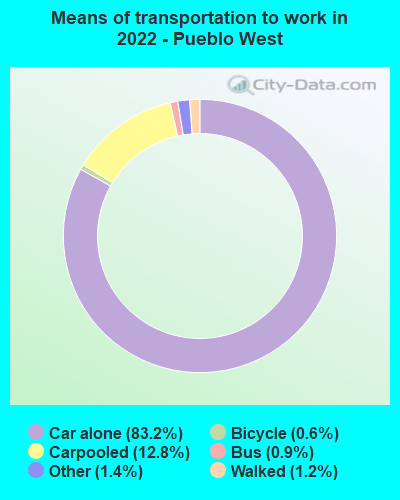
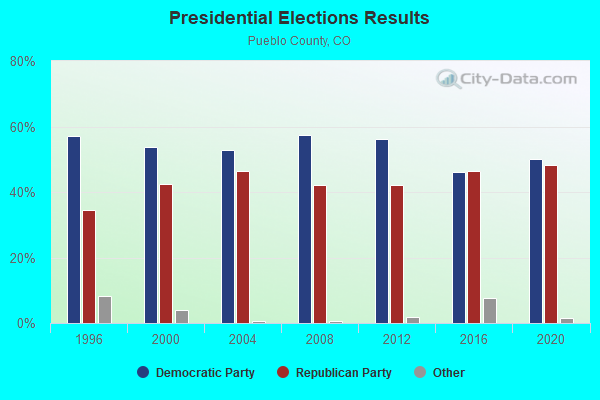
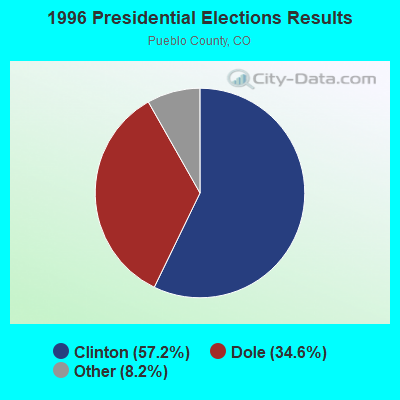
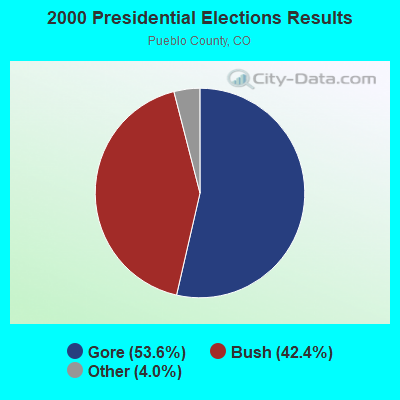
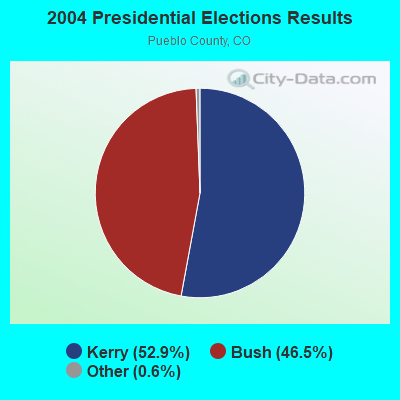

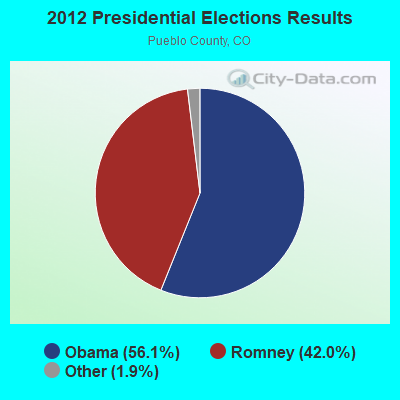
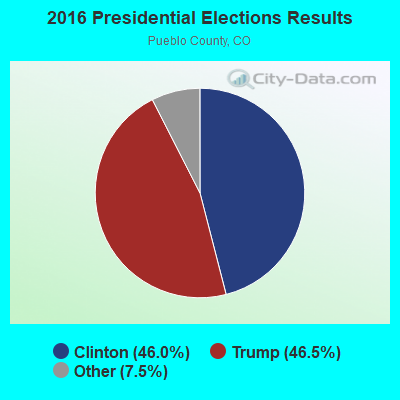
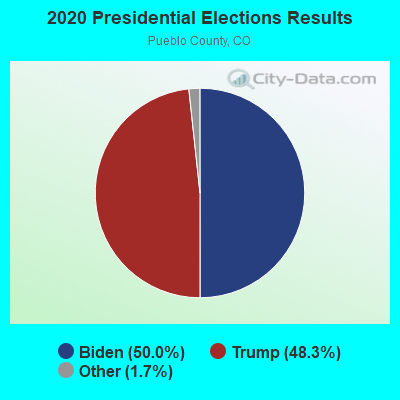
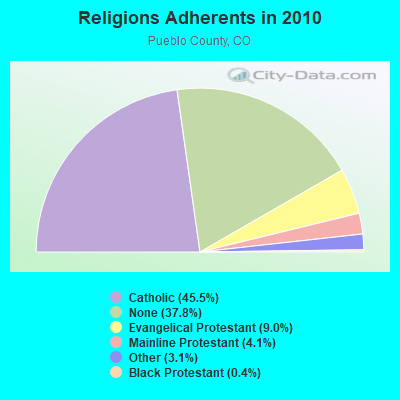
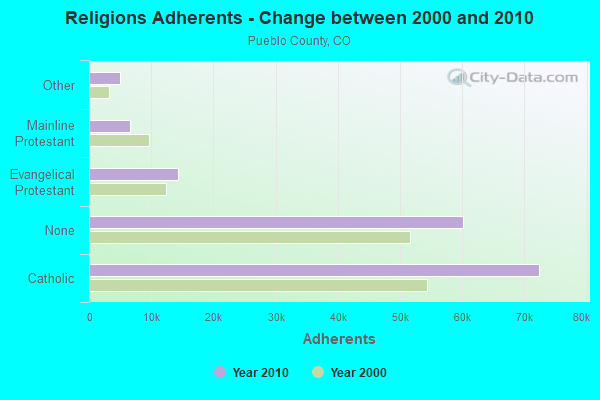
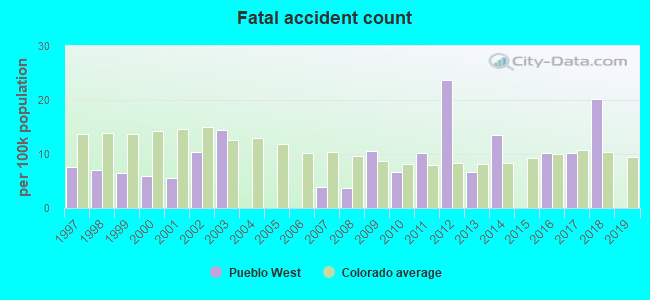
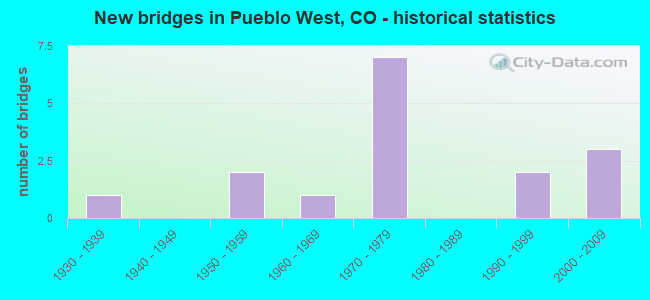
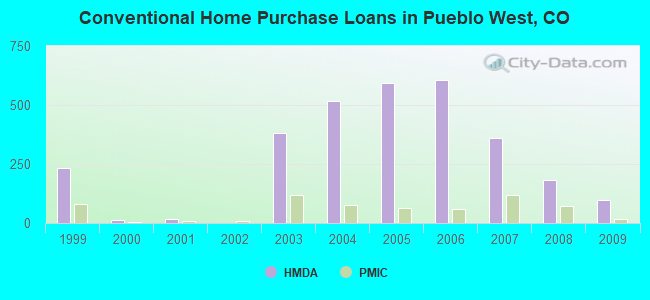
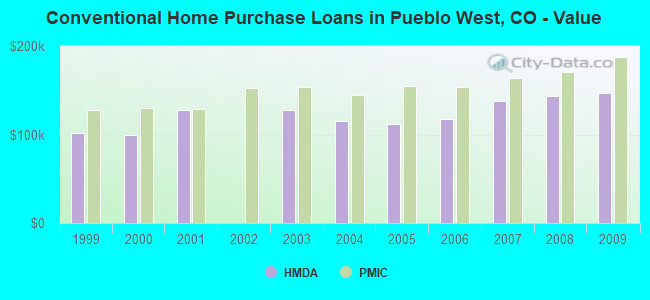
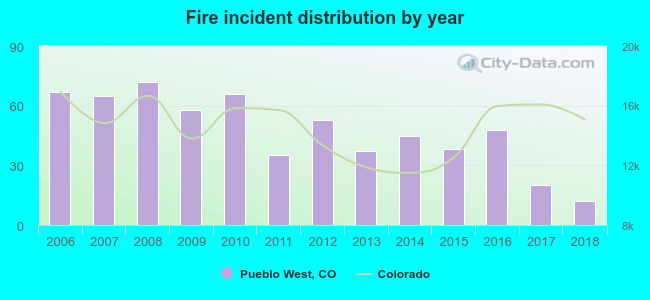 Based on the data from the years 2006 - 2018 the average number of fires per year is 47. The highest number of fire incidents - 72 took place in 2008, and the least - 12 in 2018. The data has a dropping trend.
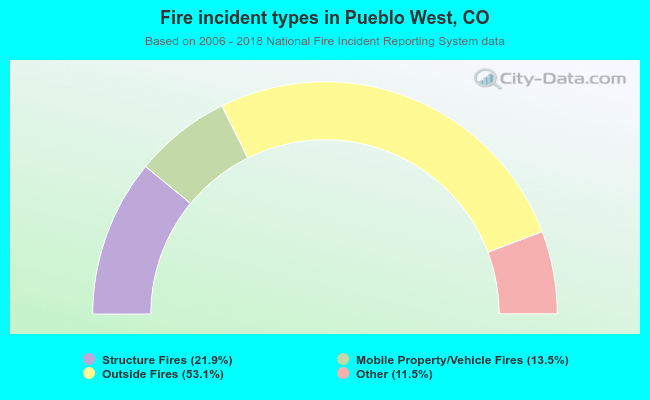 When looking into fire subcategories, the most incidents belonged to: Outside Fires (53.1%), and Structure Fires (21.9%).