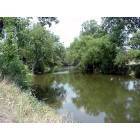
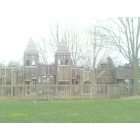
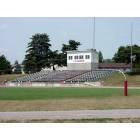
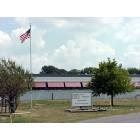
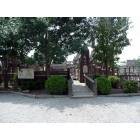
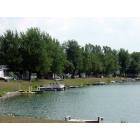
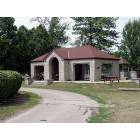
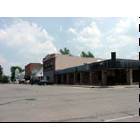
Pandora, Ohio Submit your own pictures of this village and show them to the world
OSM Map
General Map
Google Map
MSN Map
OSM Map
General Map
Google Map
MSN Map
OSM Map
General Map
Google Map
MSN Map
OSM Map
General Map
Google Map
MSN Map
Please wait while loading the map...
Population in 2022: 1,198 (0% urban, 100% rural). Population change since 2000: +0.8%Males: 616 Females: 582
March 2022 cost of living index in Pandora: 83.2 (low, U.S. average is 100) Percentage of residents living in poverty in 2022: 1.8%for White Non-Hispanic residents , 14.3% for two or more races residents )Business Search - 14 Million verified businesses
Data:
Median household income ($)
Median household income (% change since 2000)
Household income diversity
Ratio of average income to average house value (%)
Ratio of average income to average rent
Median household income ($) - White
Median household income ($) - Black or African American
Median household income ($) - Asian
Median household income ($) - Hispanic or Latino
Median household income ($) - American Indian and Alaska Native
Median household income ($) - Multirace
Median household income ($) - Other Race
Median household income for houses/condos with a mortgage ($)
Median household income for apartments without a mortgage ($)
Races - White alone (%)
Races - White alone (% change since 2000)
Races - Black alone (%)
Races - Black alone (% change since 2000)
Races - American Indian alone (%)
Races - American Indian alone (% change since 2000)
Races - Asian alone (%)
Races - Asian alone (% change since 2000)
Races - Hispanic (%)
Races - Hispanic (% change since 2000)
Races - Native Hawaiian and Other Pacific Islander alone (%)
Races - Native Hawaiian and Other Pacific Islander alone (% change since 2000)
Races - Two or more races (%)
Races - Two or more races (% change since 2000)
Races - Other race alone (%)
Races - Other race alone (% change since 2000)
Racial diversity
Unemployment (%)
Unemployment (% change since 2000)
Unemployment (%) - White
Unemployment (%) - Black or African American
Unemployment (%) - Asian
Unemployment (%) - Hispanic or Latino
Unemployment (%) - American Indian and Alaska Native
Unemployment (%) - Multirace
Unemployment (%) - Other Race
Population density (people per square mile)
Population - Males (%)
Population - Females (%)
Population - Males (%) - White
Population - Males (%) - Black or African American
Population - Males (%) - Asian
Population - Males (%) - Hispanic or Latino
Population - Males (%) - American Indian and Alaska Native
Population - Males (%) - Multirace
Population - Males (%) - Other Race
Population - Females (%) - White
Population - Females (%) - Black or African American
Population - Females (%) - Asian
Population - Females (%) - Hispanic or Latino
Population - Females (%) - American Indian and Alaska Native
Population - Females (%) - Multirace
Population - Females (%) - Other Race
Coronavirus confirmed cases (Jun 08, 2024)
Deaths caused by coronavirus (Jun 08, 2024)
Coronavirus confirmed cases (per 100k population) (Jun 08, 2024)
Deaths caused by coronavirus (per 100k population) (Jun 08, 2024)
Daily increase in number of cases (Jun 08, 2024)
Weekly increase in number of cases (Jun 08, 2024)
Cases doubled (in days) (Jun 08, 2024)
Hospitalized patients (Apr 18, 2022)
Negative test results (Apr 18, 2022)
Total test results (Apr 18, 2022)
COVID Vaccine doses distributed (per 100k population) (Sep 19, 2023)
COVID Vaccine doses administered (per 100k population) (Sep 19, 2023)
COVID Vaccine doses distributed (Sep 19, 2023)
COVID Vaccine doses administered (Sep 19, 2023)
Likely homosexual households (%)
Likely homosexual households (% change since 2000)
Likely homosexual households - Lesbian couples (%)
Likely homosexual households - Lesbian couples (% change since 2000)
Likely homosexual households - Gay men (%)
Likely homosexual households - Gay men (% change since 2000)
Cost of living index
Median gross rent ($)
Median contract rent ($)
Median monthly housing costs ($)
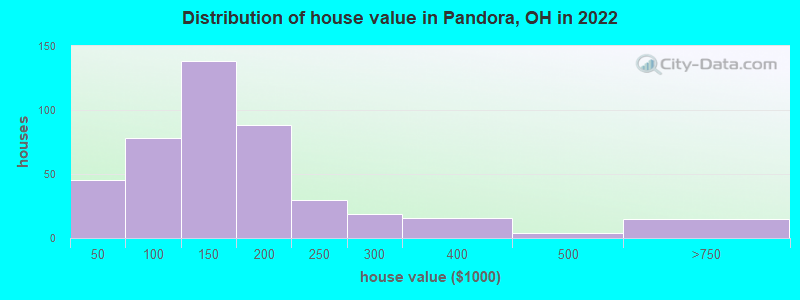
Median house or condo value ($)
Median house or condo value ($ change since 2000)
Mean house or condo value by units in structure - 1, detached ($)
Mean house or condo value by units in structure - 1, attached ($)
Mean house or condo value by units in structure - 2 ($)
Mean house or condo value by units in structure by units in structure - 3 or 4 ($)
Mean house or condo value by units in structure - 5 or more ($)
Mean house or condo value by units in structure - Boat, RV, van, etc. ($)
Mean house or condo value by units in structure - Mobile home ($)
Median house or condo value ($) - White
Median house or condo value ($) - Black or African American
Median house or condo value ($) - Asian
Median house or condo value ($) - Hispanic or Latino
Median house or condo value ($) - American Indian and Alaska Native
Median house or condo value ($) - Multirace
Median house or condo value ($) - Other Race
Median resident age
Resident age diversity
Median resident age - Males
Median resident age - Females
Median resident age - White
Median resident age - Black or African American
Median resident age - Asian
Median resident age - Hispanic or Latino
Median resident age - American Indian and Alaska Native
Median resident age - Multirace
Median resident age - Other Race
Median resident age - Males - White
Median resident age - Males - Black or African American
Median resident age - Males - Asian
Median resident age - Males - Hispanic or Latino
Median resident age - Males - American Indian and Alaska Native
Median resident age - Males - Multirace
Median resident age - Males - Other Race
Median resident age - Females - White
Median resident age - Females - Black or African American
Median resident age - Females - Asian
Median resident age - Females - Hispanic or Latino
Median resident age - Females - American Indian and Alaska Native
Median resident age - Females - Multirace
Median resident age - Females - Other Race
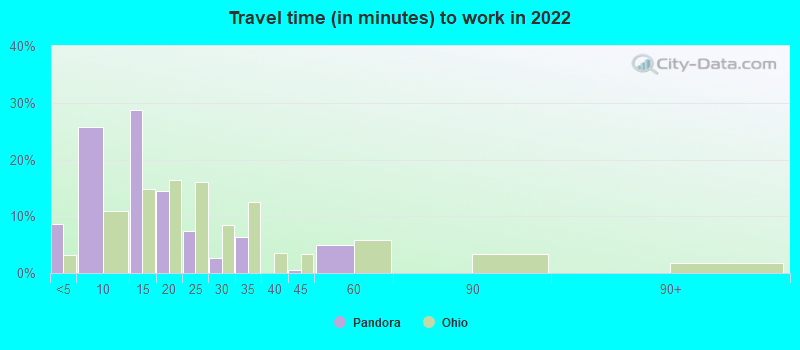
Commute - mean travel time to work (minutes)
Travel time to work - Less than 5 minutes (%)
Travel time to work - Less than 5 minutes (% change since 2000)
Travel time to work - 5 to 9 minutes (%)
Travel time to work - 5 to 9 minutes (% change since 2000)
Travel time to work - 10 to 19 minutes (%)
Travel time to work - 10 to 19 minutes (% change since 2000)
Travel time to work - 20 to 29 minutes (%)
Travel time to work - 20 to 29 minutes (% change since 2000)
Travel time to work - 30 to 39 minutes (%)
Travel time to work - 30 to 39 minutes (% change since 2000)
Travel time to work - 40 to 59 minutes (%)
Travel time to work - 40 to 59 minutes (% change since 2000)
Travel time to work - 60 to 89 minutes (%)
Travel time to work - 60 to 89 minutes (% change since 2000)
Travel time to work - 90 or more minutes (%)
Travel time to work - 90 or more minutes (% change since 2000)
Marital status - Never married (%)
Marital status - Now married (%)
Marital status - Separated (%)
Marital status - Widowed (%)
Marital status - Divorced (%)
Median family income ($)
Median family income (% change since 2000)
Median non-family income ($)
Median non-family income (% change since 2000)
Median per capita income ($)
Median per capita income (% change since 2000)
Median family income ($) - White
Median family income ($) - Black or African American
Median family income ($) - Asian
Median family income ($) - Hispanic or Latino
Median family income ($) - American Indian and Alaska Native
Median family income ($) - Multirace
Median family income ($) - Other Race
Median year house/condo built
Median year apartment built
Year house built - Built 2005 or later (%)
Year house built - Built 2000 to 2004 (%)
Year house built - Built 1990 to 1999 (%)
Year house built - Built 1980 to 1989 (%)
Year house built - Built 1970 to 1979 (%)
Year house built - Built 1960 to 1969 (%)
Year house built - Built 1950 to 1959 (%)
Year house built - Built 1940 to 1949 (%)
Year house built - Built 1939 or earlier (%)
Average household size
Household density (households per square mile)
Average household size - White
Average household size - Black or African American
Average household size - Asian
Average household size - Hispanic or Latino
Average household size - American Indian and Alaska Native
Average household size - Multirace
Average household size - Other Race
Occupied housing units (%)
Vacant housing units (%)
Owner occupied housing units (%)
Renter occupied housing units (%)
Vacancy status - For rent (%)
Vacancy status - For sale only (%)
Vacancy status - Rented or sold, not occupied (%)
Vacancy status - For seasonal, recreational, or occasional use (%)
Vacancy status - For migrant workers (%)
Vacancy status - Other vacant (%)
Residents with income below the poverty level (%)
Residents with income below 50% of the poverty level (%)
Children below poverty level (%)
Poor families by family type - Married-couple family (%)
Poor families by family type - Male, no wife present (%)
Poor families by family type - Female, no husband present (%)
Poverty status for native-born residents (%)
Poverty status for foreign-born residents (%)
Poverty among high school graduates not in families (%)
Poverty among people who did not graduate high school not in families (%)
Residents with income below the poverty level (%) - White
Residents with income below the poverty level (%) - Black or African American
Residents with income below the poverty level (%) - Asian
Residents with income below the poverty level (%) - Hispanic or Latino
Residents with income below the poverty level (%) - American Indian and Alaska Native
Residents with income below the poverty level (%) - Multirace
Residents with income below the poverty level (%) - Other Race
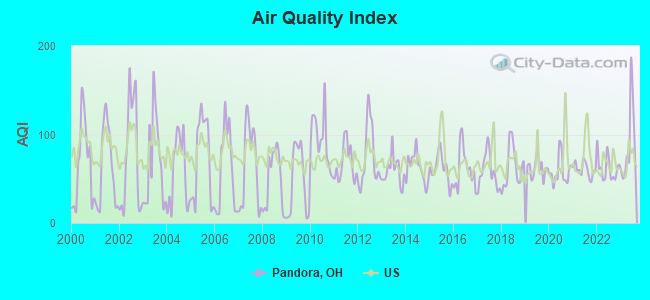
Air pollution - Air Quality Index (AQI)
Air pollution - CO
Air pollution - NO2
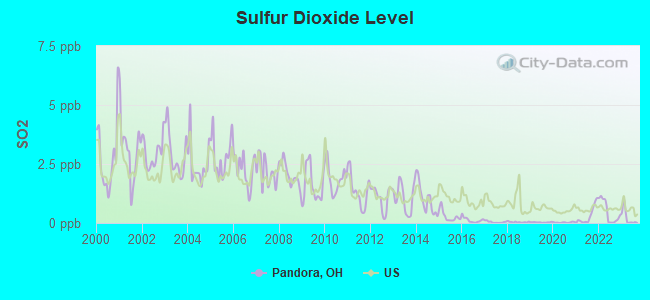
Air pollution - SO2
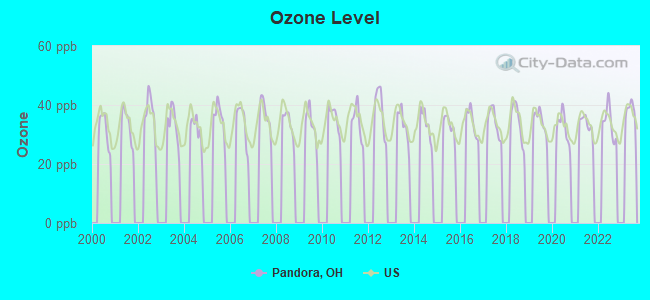
Air pollution - Ozone
Air pollution - PM10
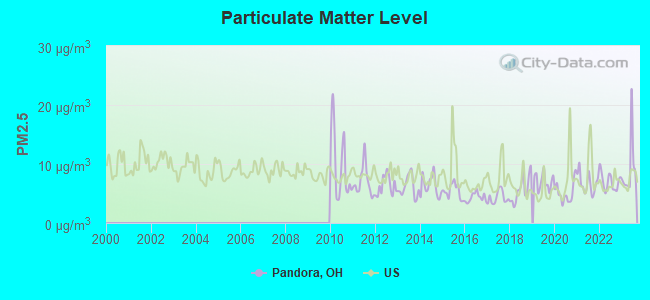
Air pollution - PM25
Air pollution - Pb
Crime - Murders per 100,000 population
Crime - Rapes per 100,000 population
Crime - Robberies per 100,000 population
Crime - Assaults per 100,000 population
Crime - Burglaries per 100,000 population
Crime - Thefts per 100,000 population
Crime - Auto thefts per 100,000 population
Crime - Arson per 100,000 population
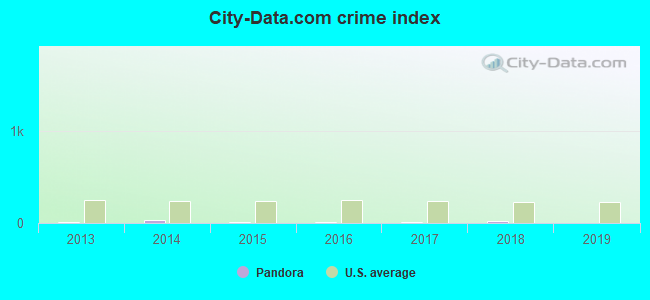
Crime - City-data.com crime index
Crime - Violent crime index
Crime - Property crime index
Crime - Murders per 100,000 population (5 year average)
Crime - Rapes per 100,000 population (5 year average)
Crime - Robberies per 100,000 population (5 year average)
Crime - Assaults per 100,000 population (5 year average)
Crime - Burglaries per 100,000 population (5 year average)
Crime - Thefts per 100,000 population (5 year average)
Crime - Auto thefts per 100,000 population (5 year average)
Crime - Arson per 100,000 population (5 year average)
Crime - City-data.com crime index (5 year average)
Crime - Violent crime index (5 year average)
Crime - Property crime index (5 year average)
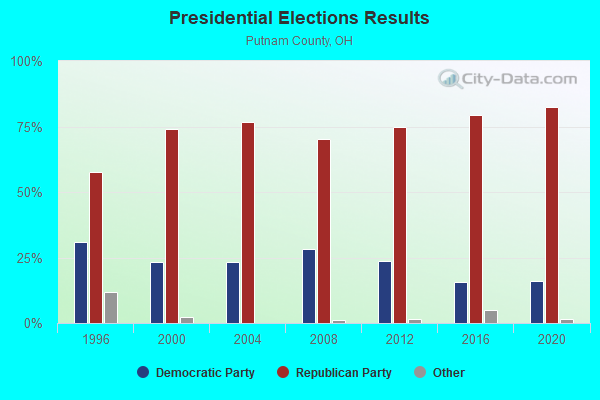
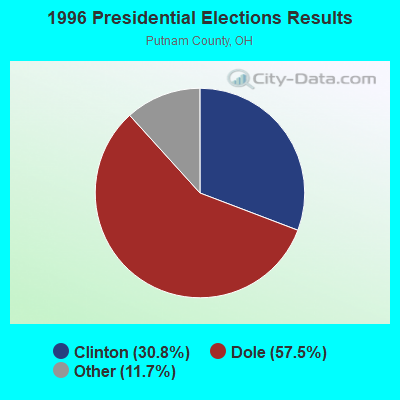
1996 Presidential Elections Results (%) - Democratic Party (Clinton)
1996 Presidential Elections Results (%) - Republican Party (Dole)
1996 Presidential Elections Results (%) - Other
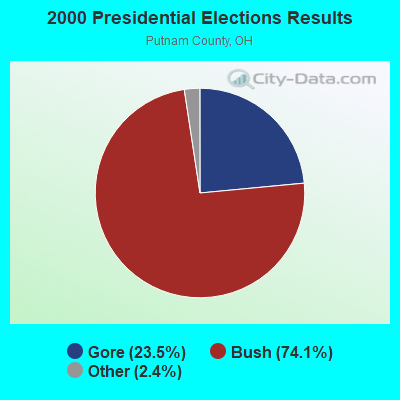
2000 Presidential Elections Results (%) - Democratic Party (Gore)
2000 Presidential Elections Results (%) - Republican Party (Bush)
2000 Presidential Elections Results (%) - Other
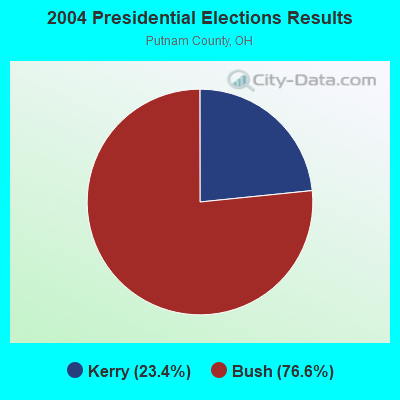
2004 Presidential Elections Results (%) - Democratic Party (Kerry)
2004 Presidential Elections Results (%) - Republican Party (Bush)
2004 Presidential Elections Results (%) - Other
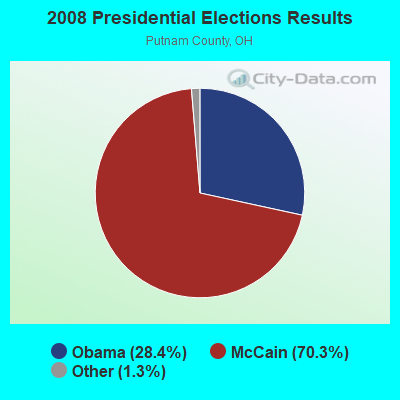
2008 Presidential Elections Results (%) - Democratic Party (Obama)
2008 Presidential Elections Results (%) - Republican Party (McCain)
2008 Presidential Elections Results (%) - Other
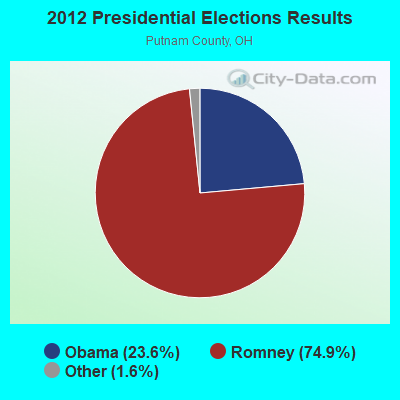
2012 Presidential Elections Results (%) - Democratic Party (Obama)
2012 Presidential Elections Results (%) - Republican Party (Romney)
2012 Presidential Elections Results (%) - Other
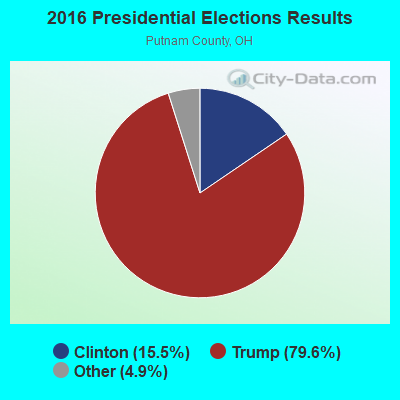
2016 Presidential Elections Results (%) - Democratic Party (Clinton)
2016 Presidential Elections Results (%) - Republican Party (Trump)
2016 Presidential Elections Results (%) - Other
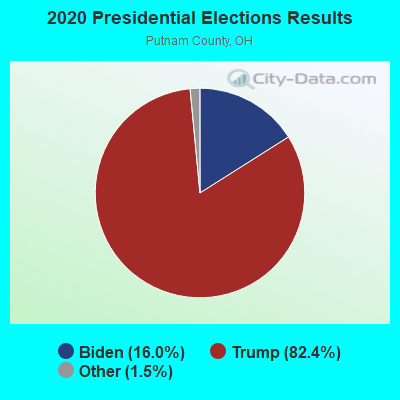
2020 Presidential Elections Results (%) - Democratic Party (Biden)
2020 Presidential Elections Results (%) - Republican Party (Trump)
2020 Presidential Elections Results (%) - Other
Ancestries Reported - Arab (%)
Ancestries Reported - Czech (%)
Ancestries Reported - Danish (%)
Ancestries Reported - Dutch (%)
Ancestries Reported - English (%)
Ancestries Reported - French (%)
Ancestries Reported - French Canadian (%)
Ancestries Reported - German (%)
Ancestries Reported - Greek (%)
Ancestries Reported - Hungarian (%)
Ancestries Reported - Irish (%)
Ancestries Reported - Italian (%)
Ancestries Reported - Lithuanian (%)
Ancestries Reported - Norwegian (%)
Ancestries Reported - Polish (%)
Ancestries Reported - Portuguese (%)
Ancestries Reported - Russian (%)
Ancestries Reported - Scotch-Irish (%)
Ancestries Reported - Scottish (%)
Ancestries Reported - Slovak (%)
Ancestries Reported - Subsaharan African (%)
Ancestries Reported - Swedish (%)
Ancestries Reported - Swiss (%)
Ancestries Reported - Ukrainian (%)
Ancestries Reported - United States (%)
Ancestries Reported - Welsh (%)
Ancestries Reported - West Indian (%)
Ancestries Reported - Other (%)
Educational Attainment - No schooling completed (%)
Educational Attainment - Less than high school (%)
Educational Attainment - High school or equivalent (%)
Educational Attainment - Less than 1 year of college (%)
Educational Attainment - 1 or more years of college (%)
Educational Attainment - Associate degree (%)
Educational Attainment - Bachelor's degree (%)
Educational Attainment - Master's degree (%)
Educational Attainment - Professional school degree (%)
Educational Attainment - Doctorate degree (%)
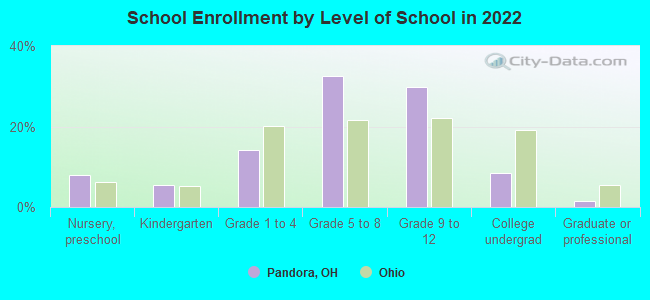
School Enrollment - Nursery, preschool (%)
School Enrollment - Kindergarten (%)
School Enrollment - Grade 1 to 4 (%)
School Enrollment - Grade 5 to 8 (%)
School Enrollment - Grade 9 to 12 (%)
School Enrollment - College undergrad (%)
School Enrollment - Graduate or professional (%)
School Enrollment - Not enrolled in school (%)
School enrollment - Public schools (%)
School enrollment - Private schools (%)
School enrollment - Not enrolled (%)
Median number of rooms in houses and condos
Median number of rooms in apartments
Housing units lacking complete plumbing facilities (%)
Housing units lacking complete kitchen facilities (%)
Density of houses
Urban houses (%)
Rural houses (%)
Households with people 60 years and over (%)
Households with people 65 years and over (%)
Households with people 75 years and over (%)
Households with one or more nonrelatives (%)
Households with no nonrelatives (%)
Population in households (%)
Family households (%)
Nonfamily households (%)
Population in families (%)
Family households with own children (%)
Median number of bedrooms in owner occupied houses
Mean number of bedrooms in owner occupied houses
Median number of bedrooms in renter occupied houses
Mean number of bedrooms in renter occupied houses
Median number of vehichles in owner occupied houses
Mean number of vehichles in owner occupied houses
Median number of vehichles in renter occupied houses
Mean number of vehichles in renter occupied houses
Mortgage status - with mortgage (%)
Mortgage status - with second mortgage (%)
Mortgage status - with home equity loan (%)
Mortgage status - with both second mortgage and home equity loan (%)
Mortgage status - without a mortgage (%)
Average family size
Average family size - White
Average family size - Black or African American
Average family size - Asian
Average family size - Hispanic or Latino
Average family size - American Indian and Alaska Native
Average family size - Multirace
Average family size - Other Race
Geographical mobility - Same house 1 year ago (%)
Geographical mobility - Moved within same county (%)
Geographical mobility - Moved from different county within same state (%)
Geographical mobility - Moved from different state (%)
Geographical mobility - Moved from abroad (%)
Place of birth - Born in state of residence (%)
Place of birth - Born in other state (%)
Place of birth - Native, outside of US (%)
Place of birth - Foreign born (%)
Housing units in structures - 1, detached (%)
Housing units in structures - 1, attached (%)
Housing units in structures - 2 (%)
Housing units in structures - 3 or 4 (%)
Housing units in structures - 5 to 9 (%)
Housing units in structures - 10 to 19 (%)
Housing units in structures - 20 to 49 (%)
Housing units in structures - 50 or more (%)
Housing units in structures - Mobile home (%)
Housing units in structures - Boat, RV, van, etc. (%)
House/condo owner moved in on average (years ago)
Renter moved in on average (years ago)
Year householder moved into unit - Moved in 1999 to March 2000 (%)
Year householder moved into unit - Moved in 1995 to 1998 (%)
Year householder moved into unit - Moved in 1990 to 1994 (%)
Year householder moved into unit - Moved in 1980 to 1989 (%)
Year householder moved into unit - Moved in 1970 to 1979 (%)
Year householder moved into unit - Moved in 1969 or earlier (%)
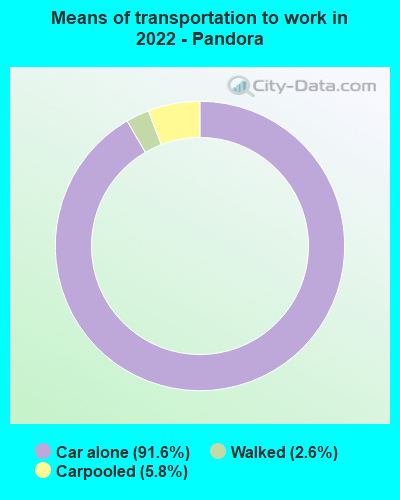
Means of transportation to work - Drove car alone (%)
Means of transportation to work - Carpooled (%)
Means of transportation to work - Public transportation (%)
Means of transportation to work - Bus or trolley bus (%)
Means of transportation to work - Streetcar or trolley car (%)
Means of transportation to work - Subway or elevated (%)
Means of transportation to work - Railroad (%)
Means of transportation to work - Ferryboat (%)
Means of transportation to work - Taxicab (%)
Means of transportation to work - Motorcycle (%)
Means of transportation to work - Bicycle (%)
Means of transportation to work - Walked (%)
Means of transportation to work - Other means (%)
Working at home (%)
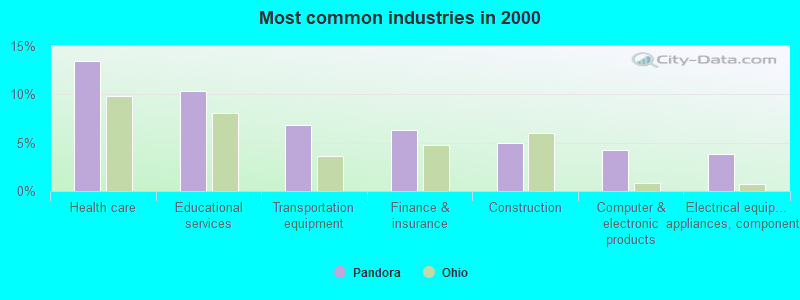
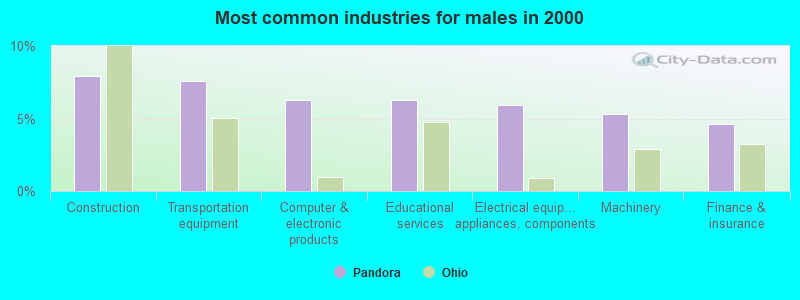
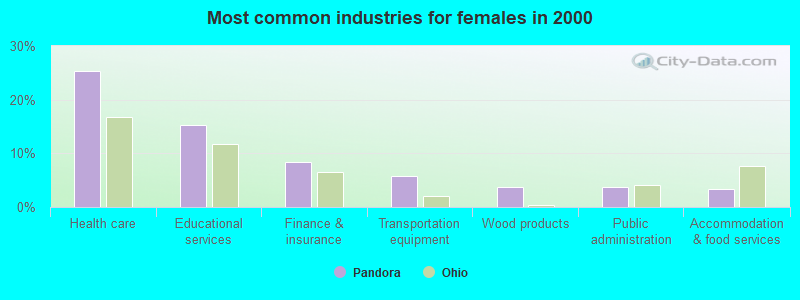
Industry diversity
Most Common Industries - Agriculture, forestry, fishing and hunting, and mining (%)
Most Common Industries - Agriculture, forestry, fishing and hunting (%)
Most Common Industries - Mining, quarrying, and oil and gas extraction (%)
Most Common Industries - Construction (%)
Most Common Industries - Manufacturing (%)
Most Common Industries - Wholesale trade (%)
Most Common Industries - Retail trade (%)
Most Common Industries - Transportation and warehousing, and utilities (%)
Most Common Industries - Transportation and warehousing (%)
Most Common Industries - Utilities (%)
Most Common Industries - Information (%)
Most Common Industries - Finance and insurance, and real estate and rental and leasing (%)
Most Common Industries - Finance and insurance (%)
Most Common Industries - Real estate and rental and leasing (%)
Most Common Industries - Professional, scientific, and management, and administrative and waste management services (%)
Most Common Industries - Professional, scientific, and technical services (%)
Most Common Industries - Management of companies and enterprises (%)
Most Common Industries - Administrative and support and waste management services (%)
Most Common Industries - Educational services, and health care and social assistance (%)
Most Common Industries - Educational services (%)
Most Common Industries - Health care and social assistance (%)
Most Common Industries - Arts, entertainment, and recreation, and accommodation and food services (%)
Most Common Industries - Arts, entertainment, and recreation (%)
Most Common Industries - Accommodation and food services (%)
Most Common Industries - Other services, except public administration (%)
Most Common Industries - Public administration (%)
Occupation diversity
Most Common Occupations - Management, business, science, and arts occupations (%)
Most Common Occupations - Management, business, and financial occupations (%)
Most Common Occupations - Management occupations (%)
Most Common Occupations - Business and financial operations occupations (%)
Most Common Occupations - Computer, engineering, and science occupations (%)
Most Common Occupations - Computer and mathematical occupations (%)
Most Common Occupations - Architecture and engineering occupations (%)
Most Common Occupations - Life, physical, and social science occupations (%)
Most Common Occupations - Education, legal, community service, arts, and media occupations (%)
Most Common Occupations - Community and social service occupations (%)
Most Common Occupations - Legal occupations (%)
Most Common Occupations - Education, training, and library occupations (%)
Most Common Occupations - Arts, design, entertainment, sports, and media occupations (%)
Most Common Occupations - Healthcare practitioners and technical occupations (%)
Most Common Occupations - Health diagnosing and treating practitioners and other technical occupations (%)
Most Common Occupations - Health technologists and technicians (%)
Most Common Occupations - Service occupations (%)
Most Common Occupations - Healthcare support occupations (%)
Most Common Occupations - Protective service occupations (%)
Most Common Occupations - Fire fighting and prevention, and other protective service workers including supervisors (%)
Most Common Occupations - Law enforcement workers including supervisors (%)
Most Common Occupations - Food preparation and serving related occupations (%)
Most Common Occupations - Building and grounds cleaning and maintenance occupations (%)
Most Common Occupations - Personal care and service occupations (%)
Most Common Occupations - Sales and office occupations (%)
Most Common Occupations - Sales and related occupations (%)
Most Common Occupations - Office and administrative support occupations (%)
Most Common Occupations - Natural resources, construction, and maintenance occupations (%)
Most Common Occupations - Farming, fishing, and forestry occupations (%)
Most Common Occupations - Construction and extraction occupations (%)
Most Common Occupations - Installation, maintenance, and repair occupations (%)
Most Common Occupations - Production, transportation, and material moving occupations (%)
Most Common Occupations - Production occupations (%)
Most Common Occupations - Transportation occupations (%)
Most Common Occupations - Material moving occupations (%)
People in Group quarters - Institutionalized population (%)
People in Group quarters - Correctional institutions (%)
People in Group quarters - Federal prisons and detention centers (%)
People in Group quarters - Halfway houses (%)
People in Group quarters - Local jails and other confinement facilities (including police lockups) (%)
People in Group quarters - Military disciplinary barracks (%)
People in Group quarters - State prisons (%)
People in Group quarters - Other types of correctional institutions (%)
People in Group quarters - Nursing homes (%)
People in Group quarters - Hospitals/wards, hospices, and schools for the handicapped (%)
People in Group quarters - Hospitals/wards and hospices for chronically ill (%)
People in Group quarters - Hospices or homes for chronically ill (%)
People in Group quarters - Military hospitals or wards for chronically ill (%)
People in Group quarters - Other hospitals or wards for chronically ill (%)
People in Group quarters - Hospitals or wards for drug/alcohol abuse (%)
People in Group quarters - Mental (Psychiatric) hospitals or wards (%)
People in Group quarters - Schools, hospitals, or wards for the mentally retarded (%)
People in Group quarters - Schools, hospitals, or wards for the physically handicapped (%)
People in Group quarters - Institutions for the deaf (%)
People in Group quarters - Institutions for the blind (%)
People in Group quarters - Orthopedic wards and institutions for the physically handicapped (%)
People in Group quarters - Wards in general hospitals for patients who have no usual home elsewhere (%)
People in Group quarters - Wards in military hospitals for patients who have no usual home elsewhere (%)
People in Group quarters - Juvenile institutions (%)
People in Group quarters - Long-term care (%)
People in Group quarters - Homes for abused, dependent, and neglected children (%)
People in Group quarters - Residential treatment centers for emotionally disturbed children (%)
People in Group quarters - Training schools for juvenile delinquents (%)
People in Group quarters - Short-term care, detention or diagnostic centers for delinquent children (%)
People in Group quarters - Type of juvenile institution unknown (%)
People in Group quarters - Noninstitutionalized population (%)
People in Group quarters - College dormitories (includes college quarters off campus) (%)
People in Group quarters - Military quarters (%)
People in Group quarters - On base (%)
People in Group quarters - Barracks, unaccompanied personnel housing (UPH), (Enlisted/Officer), ;and similar group living quarters for military personnel (%)
People in Group quarters - Transient quarters for temporary residents (%)
People in Group quarters - Military ships (%)
People in Group quarters - Group homes (%)
People in Group quarters - Homes or halfway houses for drug/alcohol abuse (%)
People in Group quarters - Homes for the mentally ill (%)
People in Group quarters - Homes for the mentally retarded (%)
People in Group quarters - Homes for the physically handicapped (%)
People in Group quarters - Other group homes (%)
People in Group quarters - Religious group quarters (%)
People in Group quarters - Dormitories (%)
People in Group quarters - Agriculture workers' dormitories on farms (%)
People in Group quarters - Job Corps and vocational training facilities (%)
People in Group quarters - Other workers' dormitories (%)
People in Group quarters - Crews of maritime vessels (%)
People in Group quarters - Other nonhousehold living situations (%)
People in Group quarters - Other noninstitutional group quarters (%)
Residents speaking English at home (%)
Residents speaking English at home - Born in the United States (%)
Residents speaking English at home - Native, born elsewhere (%)
Residents speaking English at home - Foreign born (%)
Residents speaking Spanish at home (%)
Residents speaking Spanish at home - Born in the United States (%)
Residents speaking Spanish at home - Native, born elsewhere (%)
Residents speaking Spanish at home - Foreign born (%)
Residents speaking other language at home (%)
Residents speaking other language at home - Born in the United States (%)
Residents speaking other language at home - Native, born elsewhere (%)
Residents speaking other language at home - Foreign born (%)
Class of Workers - Employee of private company (%)
Class of Workers - Self-employed in own incorporated business (%)
Class of Workers - Private not-for-profit wage and salary workers (%)
Class of Workers - Local government workers (%)
Class of Workers - State government workers (%)
Class of Workers - Federal government workers (%)
Class of Workers - Self-employed workers in own not incorporated business and Unpaid family workers (%)
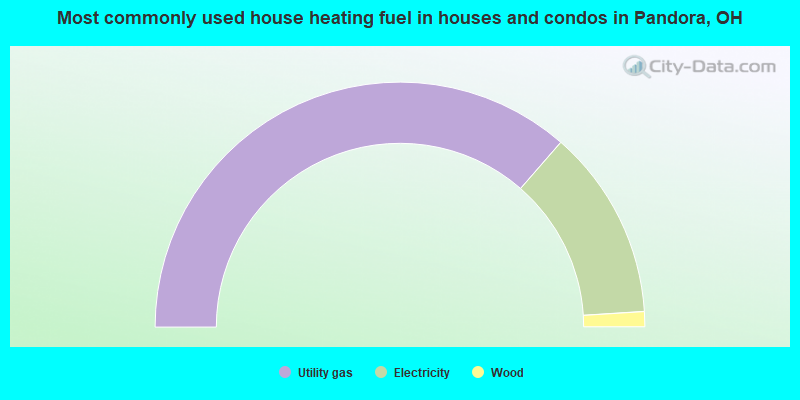
House heating fuel used in houses and condos - Utility gas (%)
House heating fuel used in houses and condos - Bottled, tank, or LP gas (%)
House heating fuel used in houses and condos - Electricity (%)
House heating fuel used in houses and condos - Fuel oil, kerosene, etc. (%)
House heating fuel used in houses and condos - Coal or coke (%)
House heating fuel used in houses and condos - Wood (%)
House heating fuel used in houses and condos - Solar energy (%)
House heating fuel used in houses and condos - Other fuel (%)
House heating fuel used in houses and condos - No fuel used (%)
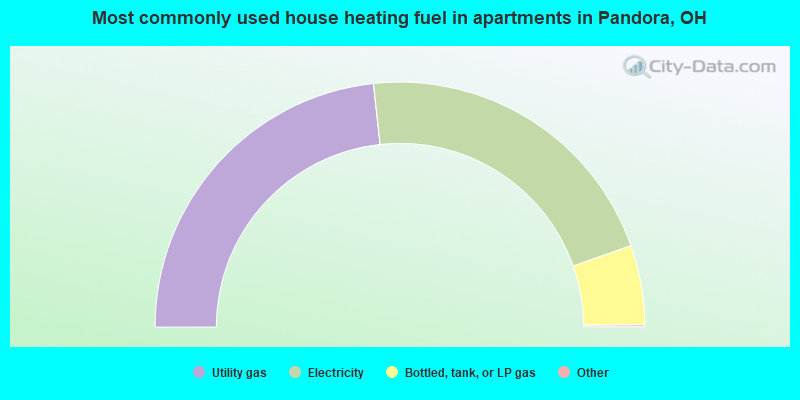
House heating fuel used in apartments - Utility gas (%)
House heating fuel used in apartments - Bottled, tank, or LP gas (%)
House heating fuel used in apartments - Electricity (%)
House heating fuel used in apartments - Fuel oil, kerosene, etc. (%)
House heating fuel used in apartments - Coal or coke (%)
House heating fuel used in apartments - Wood (%)
House heating fuel used in apartments - Solar energy (%)
House heating fuel used in apartments - Other fuel (%)
House heating fuel used in apartments - No fuel used (%)
Armed forces status - In Armed Forces (%)
Armed forces status - Civilian (%)
Armed forces status - Civilian - Veteran (%)
Armed forces status - Civilian - Nonveteran (%)
Fatal accidents locations in years 2005-2021
Fatal accidents locations in 2005
Fatal accidents locations in 2006
Fatal accidents locations in 2007
Fatal accidents locations in 2008
Fatal accidents locations in 2009
Fatal accidents locations in 2010
Fatal accidents locations in 2011
Fatal accidents locations in 2012
Fatal accidents locations in 2013
Fatal accidents locations in 2014
Fatal accidents locations in 2015
Fatal accidents locations in 2016
Fatal accidents locations in 2017
Fatal accidents locations in 2018
Fatal accidents locations in 2019
Fatal accidents locations in 2020
Fatal accidents locations in 2021
Alcohol use - People drinking some alcohol every month (%)
Alcohol use - People not drinking at all (%)
Alcohol use - Average days/month drinking alcohol
Alcohol use - Average drinks/week
Alcohol use - Average days/year people drink much
Audiometry - Average condition of hearing (%)
Audiometry - People that can hear a whisper from across a quiet room (%)
Audiometry - People that can hear normal voice from across a quiet room (%)
Audiometry - Ears ringing, roaring, buzzing (%)
Audiometry - Had a job exposure to loud noise (%)
Audiometry - Had off-work exposure to loud noise (%)
Blood Pressure & Cholesterol - Has high blood pressure (%)
Blood Pressure & Cholesterol - Checking blood pressure at home (%)
Blood Pressure & Cholesterol - Frequently checking blood cholesterol (%)
Blood Pressure & Cholesterol - Has high cholesterol level (%)
Consumer Behavior - Money monthly spent on food at supermarket/grocery store
Consumer Behavior - Money monthly spent on food at other stores
Consumer Behavior - Money monthly spent on eating out
Consumer Behavior - Money monthly spent on carryout/delivered foods
Consumer Behavior - Income spent on food at supermarket/grocery store (%)
Consumer Behavior - Income spent on food at other stores (%)
Consumer Behavior - Income spent on eating out (%)
Consumer Behavior - Income spent on carryout/delivered foods (%)
Current Health Status - General health condition (%)
Current Health Status - Blood donors (%)
Current Health Status - Has blood ever tested for HIV virus (%)
Current Health Status - Left-handed people (%)
Dermatology - People using sunscreen (%)
Diabetes - Diabetics (%)
Diabetes - Had a blood test for high blood sugar (%)
Diabetes - People taking insulin (%)
Diet Behavior & Nutrition - Diet health (%)
Diet Behavior & Nutrition - Milk product consumption (# of products/month)
Diet Behavior & Nutrition - Meals not home prepared (#/week)
Diet Behavior & Nutrition - Meals from fast food or pizza place (#/week)
Diet Behavior & Nutrition - Ready-to-eat foods (#/month)
Diet Behavior & Nutrition - Frozen meals/pizza (#/month)
Drug Use - People that ever used marijuana or hashish (%)
Drug Use - Ever used hard drugs (%)
Drug Use - Ever used any form of cocaine (%)
Drug Use - Ever used heroin (%)
Drug Use - Ever used methamphetamine (%)
Health Insurance - People covered by health insurance (%)
Kidney Conditions-Urology - Avg. # of times urinating at night
Medical Conditions - People with asthma (%)
Medical Conditions - People with anemia (%)
Medical Conditions - People with psoriasis (%)
Medical Conditions - People with overweight (%)
Medical Conditions - Elderly people having difficulties in thinking or remembering (%)
Medical Conditions - People who ever received blood transfusion (%)
Medical Conditions - People having trouble seeing even with glass/contacts (%)
Medical Conditions - People with arthritis (%)
Medical Conditions - People with gout (%)
Medical Conditions - People with congestive heart failure (%)
Medical Conditions - People with coronary heart disease (%)
Medical Conditions - People with angina pectoris (%)
Medical Conditions - People who ever had heart attack (%)
Medical Conditions - People who ever had stroke (%)
Medical Conditions - People with emphysema (%)
Medical Conditions - People with thyroid problem (%)
Medical Conditions - People with chronic bronchitis (%)
Medical Conditions - People with any liver condition (%)
Medical Conditions - People who ever had cancer or malignancy (%)
Mental Health - People who have little interest in doing things (%)
Mental Health - People feeling down, depressed, or hopeless (%)
Mental Health - People who have trouble sleeping or sleeping too much (%)
Mental Health - People feeling tired or having little energy (%)
Mental Health - People with poor appetite or overeating (%)
Mental Health - People feeling bad about themself (%)
Mental Health - People who have trouble concentrating on things (%)
Mental Health - People moving or speaking slowly or too fast (%)
Mental Health - People having thoughts they would be better off dead (%)
Oral Health - Average years since last visit a dentist
Oral Health - People embarrassed because of mouth (%)
Oral Health - People with gum disease (%)
Oral Health - General health of teeth and gums (%)
Oral Health - Average days a week using dental floss/device
Oral Health - Average days a week using mouthwash for dental problem
Oral Health - Average number of teeth
Pesticide Use - Households using pesticides to control insects (%)
Pesticide Use - Households using pesticides to kill weeds (%)
Physical Activity - People doing vigorous-intensity work activities (%)
Physical Activity - People doing moderate-intensity work activities (%)
Physical Activity - People walking or bicycling (%)
Physical Activity - People doing vigorous-intensity recreational activities (%)
Physical Activity - People doing moderate-intensity recreational activities (%)
Physical Activity - Average hours a day doing sedentary activities
Physical Activity - Average hours a day watching TV or videos
Physical Activity - Average hours a day using computer
Physical Functioning - People having limitations keeping them from working (%)
Physical Functioning - People limited in amount of work they can do (%)
Physical Functioning - People that need special equipment to walk (%)
Physical Functioning - People experiencing confusion/memory problems (%)
Physical Functioning - People requiring special healthcare equipment (%)
Prescription Medications - Average number of prescription medicines taking
Preventive Aspirin Use - Adults 40+ taking low-dose aspirin (%)
Reproductive Health - Vaginal deliveries (%)
Reproductive Health - Cesarean deliveries (%)
Reproductive Health - Deliveries resulted in a live birth (%)
Reproductive Health - Pregnancies resulted in a delivery (%)
Reproductive Health - Women breastfeeding newborns (%)
Reproductive Health - Women that had a hysterectomy (%)
Reproductive Health - Women that had both ovaries removed (%)
Reproductive Health - Women that have ever taken birth control pills (%)
Reproductive Health - Women taking birth control pills (%)
Reproductive Health - Women that have ever used Depo-Provera or injectables (%)
Reproductive Health - Women that have ever used female hormones (%)
Sexual Behavior - People 18+ that ever had sex (vaginal, anal, or oral) (%)
Sexual Behavior - Males 18+ that ever had vaginal sex with a woman (%)
Sexual Behavior - Males 18+ that ever performed oral sex on a woman (%)
Sexual Behavior - Males 18+ that ever had anal sex with a woman (%)
Sexual Behavior - Males 18+ that ever had any sex with a man (%)
Sexual Behavior - Females 18+ that ever had vaginal sex with a man (%)
Sexual Behavior - Females 18+ that ever performed oral sex on a man (%)
Sexual Behavior - Females 18+ that ever had anal sex with a man (%)
Sexual Behavior - Females 18+ that ever had any kind of sex with a woman (%)
Sexual Behavior - Average age people first had sex
Sexual Behavior - Average number of female sex partners in lifetime (males 18+)
Sexual Behavior - Average number of female vaginal sex partners in lifetime (males 18+)
Sexual Behavior - Average age people first performed oral sex on a woman (18+)
Sexual Behavior - Average number of woman performed oral sex on in lifetime (18+)
Sexual Behavior - Average number of male sex partners in lifetime (males 18+)
Sexual Behavior - Average number of male anal sex partners in lifetime (males 18+)
Sexual Behavior - Average age people first performed oral sex on a man (18+)
Sexual Behavior - Average number of male oral sex partners in lifetime (18+)
Sexual Behavior - People using protection when performing oral sex (%)
Sexual Behavior - Average number of times people have vaginal or anal sex a year
Sexual Behavior - People having sex without condom (%)
Sexual Behavior - Average number of male sex partners in lifetime (females 18+)
Sexual Behavior - Average number of male vaginal sex partners in lifetime (females 18+)
Sexual Behavior - Average number of female sex partners in lifetime (females 18+)
Sexual Behavior - Circumcised males 18+ (%)
Sleep Disorders - Average hours sleeping at night
Sleep Disorders - People that has trouble sleeping (%)
Smoking-Cigarette Use - People smoking cigarettes (%)
Taste & Smell - People 40+ having problems with smell (%)
Taste & Smell - People 40+ having problems with taste (%)
Taste & Smell - People 40+ that ever had wisdom teeth removed (%)
Taste & Smell - People 40+ that ever had tonsils teeth removed (%)
Taste & Smell - People 40+ that ever had a loss of consciousness because of a head injury (%)
Taste & Smell - People 40+ that ever had a broken nose or other serious injury to face or skull (%)
Taste & Smell - People 40+ that ever had two or more sinus infections (%)
Weight - Average height (inches)
Weight - Average weight (pounds)
Weight - Average BMI
Weight - People that are obese (%)
Weight - People that ever were obese (%)
Weight - People trying to lose weight (%)
Officers per 1,000 residents here:
1.82Ohio average:
2.31
Latest news from Pandora, OH collected exclusively by city-data.com from local newspapers, TV, and radio stations
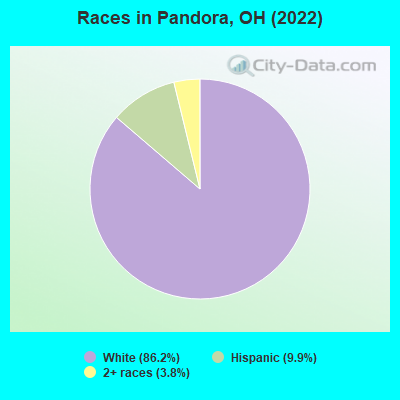
Ancestries: German (40.5%), Irish (12.3%), American (12.2%), English (7.8%), Swiss (6.1%).
Current Local Time:
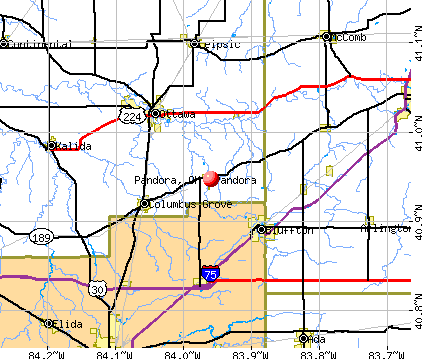
Land area: 0.81 square miles.
Population density: 1,474 people per square mile (low).
2 residents are foreign born
This village:
0.1%Ohio:
4.9%
Median real estate property taxes paid for housing units with mortgages in 2022: $1,298 (0.9%)Median real estate property taxes paid for housing units with no mortgage in 2022: $1,268 (0.9%)
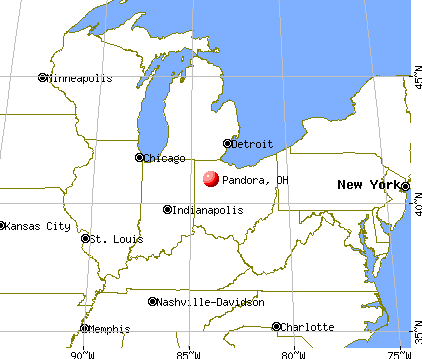
Nearest city with pop. 50,000+: Toledo, OH
Nearest city with pop. 1,000,000+: Chicago, IL
Nearest cities:
Gilboa, OH (2.3 miles),
Latitude: 40.95 N, Longitude: 83.96 W
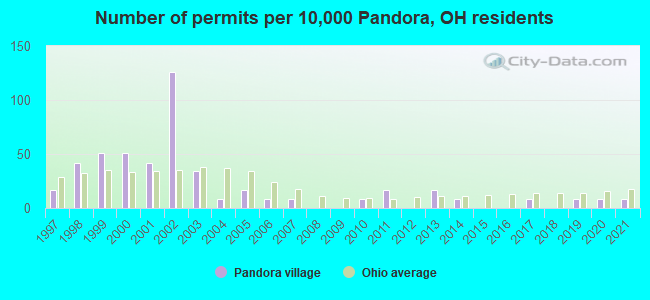
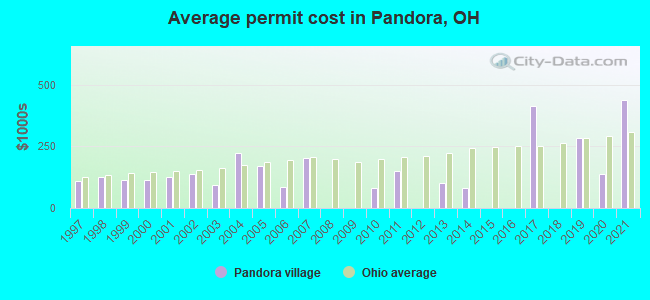
Single-family new house construction building permits:
2021: 1 building , cost: $439,0002020: 1 building , cost: $140,0002019: 1 building , cost: $285,8002017: 1 building , cost: $413,0002014: 1 building , cost: $80,0002013: 2 buildings , average cost: $100,0002011: 2 buildings , average cost: $150,7002010: 1 building , cost: $80,0002007: 1 building , cost: $202,2002006: 1 building , cost: $85,0002005: 2 buildings , average cost: $170,5002004: 1 building , cost: $225,0002003: 4 buildings , average cost: $91,9002002: 15 buildings , average cost: $138,3002001: 5 buildings , average cost: $124,6002000: 6 buildings , average cost: $112,2001999: 6 buildings , average cost: $113,7001998: 5 buildings , average cost: $125,8001997: 2 buildings , average cost: $111,000Unemployment in December 2023: Population change in the 1990s: +184 (+18.3%).
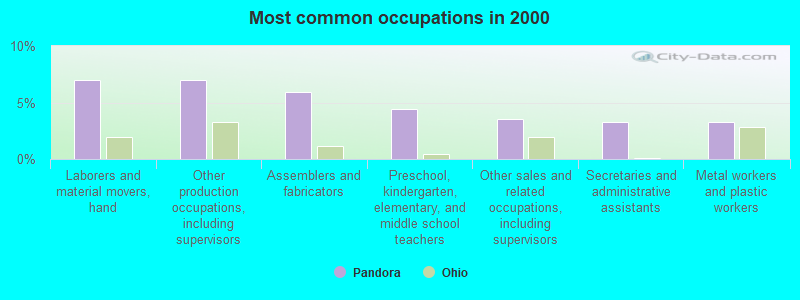
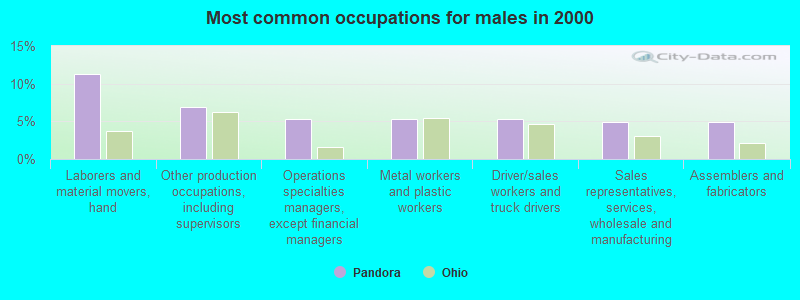
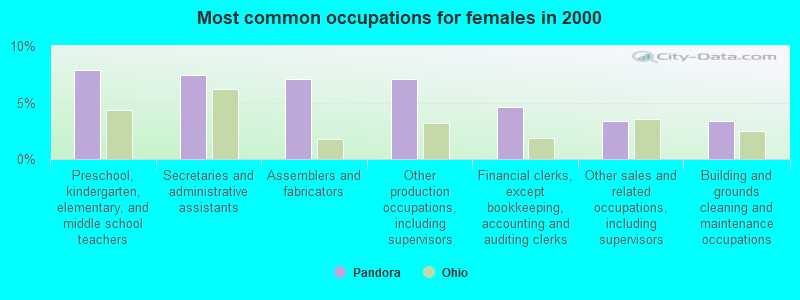
Most common occupations in Pandora, OH (%)
Both Males Females
Laborers and material movers, hand (7.0%)
Other production occupations, including supervisors (7.0%)
Assemblers and fabricators (5.9%)
Preschool, kindergarten, elementary, and middle school teachers (4.4%)
Other sales and related occupations, including supervisors (3.5%)
Secretaries and administrative assistants (3.3%)
Metal workers and plastic workers (3.3%)
Laborers and material movers, hand (11.3%)
Other production occupations, including supervisors (7.0%)
Operations specialties managers, except financial managers (5.3%)
Metal workers and plastic workers (5.3%)
Driver/sales workers and truck drivers (5.3%)
Sales representatives, services, wholesale and manufacturing (5.0%)
Assemblers and fabricators (5.0%)
Preschool, kindergarten, elementary, and middle school teachers (7.9%)
Secretaries and administrative assistants (7.5%)
Assemblers and fabricators (7.1%)
Other production occupations, including supervisors (7.1%)
Financial clerks, except bookkeeping, accounting and auditing clerks (4.6%)
Other sales and related occupations, including supervisors (3.3%)
Building and grounds cleaning and maintenance occupations (3.3%)
Tornado activity:
Pandora-area historical tornado activity is slightly above Ohio state average. It is 46% greater than the overall U.S. average.
On 4/11/1965, a category F4 (max. wind speeds 207-260 mph) tornado 16.2 miles away from the Pandora village center killed 13 people and injured 104 people and caused between $500,000 and $5,000,000 in damages.
On 6/8/1953, a category F4 tornado 19.1 miles away from the village center killed 17 people and injured 379 people .
Earthquake activity:
Pandora-area historical earthquake activity is significantly above Ohio state average. It is 16% smaller than the overall U.S. average. On 7/12/1986 at 08:19:37, a magnitude 4.5 (4.5 MB, Class: Light, Intensity: IV - V) earthquake occurred 35.6 miles away from the city center On 9/25/1998 at 19:52:52, a magnitude 5.2 (4.8 MB, 4.3 MS, 5.2 LG, 4.5 MW, Depth: 3.1 mi, Class: Moderate, Intensity: VI - VII) earthquake occurred 189.2 miles away from the city center On 7/27/1980 at 18:52:21, a magnitude 5.2 (5.1 MB, 4.7 MS, 5.0 UK, 5.2 UK) earthquake occurred 189.7 miles away from Pandora center On 1/31/1986 at 16:46:43, a magnitude 5.0 (5.0 MB) earthquake occurred 152.4 miles away from the city center On 4/18/2008 at 09:36:59, a magnitude 5.4 (5.1 MB, 4.8 MS, 5.4 MW, 5.2 MW) earthquake occurred 270.9 miles away from the city center On 4/18/2008 at 09:36:59, a magnitude 5.2 (5.2 MW, Depth: 8.9 mi) earthquake occurred 271.0 miles away from Pandora center Magnitude types: regional Lg-wave magnitude (LG), body-wave magnitude (MB), surface-wave magnitude (MS), moment magnitude (MW) Natural disasters: The number of natural disasters in Putnam County (10) is smaller than the US average (15).Major Disasters (Presidential) Declared: 6Emergencies Declared: 3Storms: 4, Tornadoes: 4, Floods: 3, Snowstorms: 2, Blizzard: 1, Hurricane: 1, Mudslide: 1, Wind: 1, Winter Storm: 1, Other: 1 (Note: some incidents may be assigned to more than one category). Hospitals and medical centers in Pandora: HILTY MEMORIAL HOME INC (304 HILTY DRIVE)
Other hospitals and medical centers near Pandora: MENNONITE MEMORIAL HOME (Nursing Home, about 5 miles away; BLUFFTON, OH)
BLUFFTON HOSPITAL (about 6 miles away; BLUFFTON, OH)
PUTNAM COUNTY HOMECARE (Home Health Center, about 7 miles away; OTTAWA, OH)
RICHLAND MANOR NURSING HOME (Nursing Home, about 8 miles away; BLUFFTON, OH)
MEADOWS OF OTTAWA-GLANDORF (Nursing Home, about 8 miles away; OTTAWA, OH)
MEADOWS OF LEIPSIC (Nursing Home, about 11 miles away; LEIPSIC, OH)
MEADOWS OF KALIDA (Nursing Home, about 13 miles away; KALIDA, OH)
Airports located in Pandora: Colleges/universities with over 2000 students nearest to Pandora:
Ohio Northern University (about 15 miles; Ada, OH ; Full-time enrollment: 2,474)
James A Rhodes State College (about 15 miles; Lima, OH ; FT enrollment: 2,689)
University of Northwestern Ohio (about 17 miles; Lima, OH ; FT enrollment: 4,231)
The University of Findlay (about 18 miles; Findlay, OH ; FT enrollment: 3,649)
Bowling Green State University-Main Campus (about 35 miles; Bowling Green, OH ; FT enrollment: 16,357)
Northwest State Community College (about 40 miles; Archbold, OH ; FT enrollment: 2,406)
Tiffin University (about 43 miles; Tiffin, OH ; FT enrollment: 4,927)
Public high school in Pandora:
Public elementary/middle schools in Pandora:
See full list of schools located in Pandora User-submitted facts and corrections:
Pandora recently built a new K-12 school. The address is 410 Rocket Ridge. Thank you! I love your site!
Birthplace of: Arthur H. Day - Politician.
Putnam County has a predicted average indoor radon screening level between 2 and 4 pCi/L (pico curies per liter) - Moderate Potential Drinking water stations with addresses in Pandora and their reported violations in the past:
SCHULTE AMLC (Population served: 30, Groundwater):
Past health violations:
MCL, Monthly (TCR) - Between JUL-2010 and SEP-2010, Contaminant: Coliform. Follow-up actions: St Public Notif requested (AUG-10-2010), St Violation/Reminder Notice (AUG-10-2010), St Public Notif received (AUG-16-2010), St Compliance achieved (APR-27-2011)
Past monitoring violations:
One routine major monitoring violation
Drinking water stations with addresses in Pandora that have no violations reported:
S AND A PRODUCE AMLC (Population served: 25, Primary Water Source Type: Groundwater)
Average household size: This village:
2.4 peopleOhio:
2.4 people
Percentage of family households: This village:
70.8%Whole state:
65.0%
Percentage of households with unmarried partners: This village:
2.9%Whole state:
6.8%
No gay or lesbian households reported
46 people in nursing facilities/skilled-nursing facilities in 2010people in group homes intended for adults in 2010people in nursing homes in 2000people in homes for the mentally retarded in 2000
Banks with branches in Pandora (2011 data):
The First National Bank of Pandora: The First National Bank Of Pandora at 102 East Main Street, branch established on 1919/06/21. Info updated 2006/11/03: Bank assets: $132.1 mil, Deposits: $111.3 mil, local headquarters , positive income , Commercial Lending Specialization, 3 total offices , Holding Company: Pandora Bancshares, Incorporated
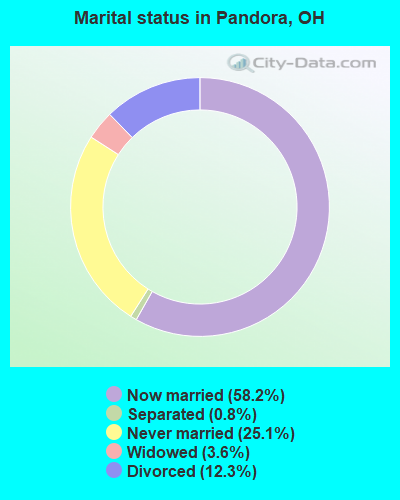
For population 15 years and over in Pandora:
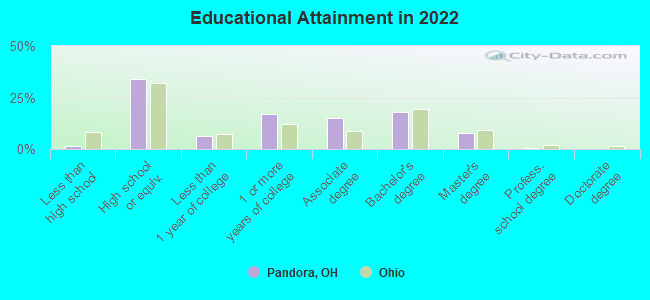
Never married: 25.1%Now married: 58.2%Separated: 0.8%Widowed: 3.6%Divorced: 12.3% For population 25 years and over in Pandora:
High school or higher: 98.2%Bachelor's degree or higher: 24.8%Graduate or professional degree: 7.8%Unemployed: 2.0%Mean travel time to work (commute): 14.4 minutes
Education Gini index (Inequality in education) Here:
7.8Ohio average:
11.0
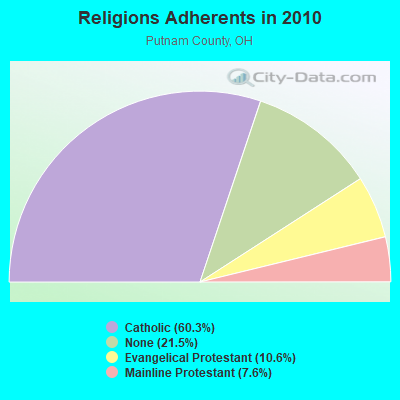
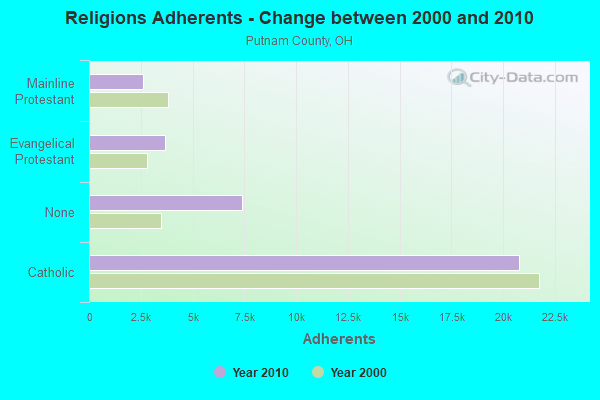
Religion statistics for Pandora, OH (based on Putnam County data)
Religion Adherents Congregations Catholic 20,794 11 Evangelical Protestant 3,661 22 Mainline Protestant 2,631 16 None 7,413 -
Source: Clifford Grammich, Kirk Hadaway, Richard Houseal, Dale E.Jones, Alexei Krindatch, Richie Stanley and Richard H.Taylor. 2012. 2010 U.S.Religion Census: Religious Congregations & Membership Study. Association of Statisticians of American Religious Bodies. Jones, Dale E., et al. 2002. Congregations and Membership in the United States 2000. Nashville, TN: Glenmary Research Center. Graphs represent county-level data
Food Environment Statistics: Number of grocery stores : 8Putnam County :
2.31 / 10,000 pop.Ohio :
1.89 / 10,000 pop.
Number of supercenters and club stores : 1This county :
0.29 / 10,000 pop.Ohio :
0.13 / 10,000 pop.
Number of convenience stores (no gas) : 4This county :
1.16 / 10,000 pop.Ohio :
1.25 / 10,000 pop.
Number of convenience stores (with gas) : 13Here :
3.76 / 10,000 pop.Ohio :
2.93 / 10,000 pop.
Number of full-service restaurants : 23Here :
6.64 / 10,000 pop.Ohio :
6.25 / 10,000 pop.
Adult diabetes rate : Putnam County :
10.9%Ohio :
10.3%
Adult obesity rate : Putnam County :
29.9%Ohio :
29.1%
Low-income preschool obesity rate : This county :
12.6%Ohio :
11.9%
Health and Nutrition:
Average overall health of teeth and gums : People feeling badly about themselves : People not drinking alcohol at all : Average hours sleeping at night : General health condition : Average condition of hearing : This city:
79.4%Ohio:
79.1%
More about Health and Nutrition of Pandora, OH Residents
Local government employment and payroll (March 2022)
Function
Full-time employees
Monthly full-time payroll
Average yearly full-time wage
Part-time employees
Monthly part-time payroll
Sewerage
4 $4,679 $14,037 0 $0 Water Supply
4 $4,679 $14,037 0 $0 Streets and Highways
4 $4,522 $13,566 0 $0 Police Protection - Officers
2 $9,916 $59,496 4 $4,181 Other Government Administration
1 $9,034 $108,408 0 $0
Totals for Government
15 $32,829 $26,263 4 $4,181
Pandora government finances - Expenditure in 2017 (per resident):
Construction - Water Utilities: $19,000 ($15.86)
Regular Highways: $11,000 ($9.18)Sewerage: $1,000 ($0.83)Current Operations - General - Other: $174,000 ($145.24)
Police Protection: $127,000 ($106.01)Sewerage: $96,000 ($80.13)Central Staff Services: $83,000 ($69.28)Regular Highways: $72,000 ($60.10)Water Utilities: $49,000 ($40.90)Parks and Recreation: $15,000 ($12.52)Financial Administration: $2,000 ($1.67)General - Interest on Debt: $30,000 ($25.04)
Intergovernmental to Local - Other - Local Fire Protection: $21,000 ($17.53)
Total Salaries and Wages: $264,000 ($220.37)
Pandora government finances - Revenue in 2017 (per resident):
Charges - Sewerage: $228,000 ($190.32)
Parks and Recreation: $1,000 ($0.83)Local Intergovernmental - Highways: $11,000 ($9.18)
Other: $9,000 ($7.51)Miscellaneous - Rents: $35,000 ($29.22)
General Revenue - Other: $15,000 ($12.52)Interest Earnings: $5,000 ($4.17)Revenue - Water Utilities: $103,000 ($85.98)
State Intergovernmental - Highways: $22,000 ($18.36)
General Local Government Support: $19,000 ($15.86)Tax - Individual Income: $443,000 ($369.78)
Property: $49,000 ($40.90)Death and Gift: $33,000 ($27.55)Corporation Net Income: $11,000 ($9.18)Other License: $1,000 ($0.83)
Pandora government finances - Debt in 2017 (per resident):
Long Term Debt - Beginning Outstanding - Unspecified Public Purpose: $744,000 ($621.04)
Outstanding Unspecified Public Purpose: $718,000 ($599.33)Retired Unspecified Public Purpose: $26,000 ($21.70)
Pandora government finances - Cash and Securities in 2017 (per resident):
Other Funds - Cash and Securities: $460,000 ($383.97)
Strongest AM radio stations in Pandora:
WOWO (1190 AM; 50 kW; FORT WAYNE, IN; Owner: PATHFINDER COMMUNICATIONS CORPORATION)
WFDF (910 AM; 50 kW; FLINT, MI; Owner: ABC, INC.)
WJR (760 AM; 50 kW; DETROIT, MI; Owner: ABC, INC.)
WTVN (610 AM; 50 kW; COLUMBUS, OH; Owner: CITICASTERS LICENSES, L.P.)
WDFN (1130 AM; 50 kW; DETROIT, MI; Owner: AMFM RADIO LICENSES, L.L.C.)
WLW (700 AM; 50 kW; CINCINNATI, OH; Owner: JACOR BROADCASTING CORPORATION)
WCHB (1200 AM; 50 kW; TAYLOR, MI; Owner: RADIO ONE OF DETROIT, LLC)
WWJ (950 AM; 50 kW; DETROIT, MI; Owner: INFINITY BROADCASTING OPERATIONS, INC.)
WKNR (850 AM; 50 kW; CLEVELAND, OH; Owner: CARON BROADCASTING, INC.)
WRFD (880 AM; daytime; 23 kW; COLUMBUS-WORTHINGTON, OH; Owner: SALEM MEDIA OF OHIO, INC.)
WXYT (1270 AM; 50 kW; DETROIT, MI; Owner: INFINITY BROADCASTING CORP. OF DETROIT)
WTAM (1100 AM; 50 kW; CLEVELAND, OH; Owner: JACOR BROADCASTING CORPORATION)
WHK (1220 AM; 50 kW; CLEVELAND, OH; Owner: CARON BROADCASTING, INC.)
Strongest FM radio stations in Pandora:
WBUK (106.3 FM; OTTAWA, OH; Owner: CITICASTERS LICENSES, L.P.)
WLWD (93.9 FM; COLUMBUS GROVE, OH; Owner: CLEAR CHANNEL BROADCASTING LICENSES, INC.)
WIMT (102.1 FM; LIMA, OH; Owner: JACOR BROADCASTING CORPORATION)
W205AT (88.9 FM; HAMLER, OH; Owner: CALVARY CHAPEL OF TWIN FALLS, INC.)
WONB (94.9 FM; ADA, OH; Owner: OHIO NORTHERN UNIVERSITY)
WMLX (103.3 FM; ST. MARYS, OH; Owner: JACOR BROADCASTING CORPORATION)
WZRX-FM (107.5 FM; FORT SHAWNEE, OH; Owner: JACOR BROADCASTING CORPORATION)
WKXA-FM (100.5 FM; FINDLAY, OH; Owner: BLANCHARD RIVER BROADCASTING COMPANY)
WBIE (91.5 FM; DELPHOS, OH; Owner: AMERICAN FAMILY ASSOCIATION)
WTGN (97.7 FM; LIMA, OH; Owner: ASSOCIATED CHRISTIAN BROADCASTERS)
WFGF (93.1 FM; LIMA, OH; Owner: FOREVER OF OHIO, LLC)
WGLE (90.7 FM; LIMA, OH; Owner: PUBLIC B/C FOUNDATION OF NW OHIO)
WUZZ-FM (104.9 FM; LIMA, OH; Owner: FOREVER BROADCASTING, LLC)
WBCJ (88.1 FM; SPENCERVILLE, OH; Owner: TAYLOR UNIVERSITY BROADCASTING, INC)
WZOQ (92.1 FM; WAPAKONETA, OH; Owner: FOREVER OF OHIO, LLC)
WDOH (107.1 FM; DELPHOS, OH; Owner: VOGEL ROACH CORPORATION)
WPFX-FM (107.7 FM; NORTH BALTIMORE, OH; Owner: CITICASTERS LICENSES, L.P.)
WBWH-LP (99.3 FM; BLUFFTON, OH; Owner: BLUFFTON COLLEGE)
W254CD (98.7 FM; FINDLAY, OH; Owner: ASSOCIATED CHRISTIAN B/CASTERS, INC.)
W231AJ (94.1 FM; FINDLAY, OH; Owner: CLYDE EDUCATIONAL BROADCASTING FOUND)
TV broadcast stations around Pandora:
WBGU-TV (Channel 27; BOWLING GREEN, OH; Owner: BOWLING GREEN STATE UNIVERSITY)
WTLW (Channel 44; LIMA, OH; Owner: AMERICAN CHRISTIAN TELEVISION SERVICES, INC.)
WOHL-CA (Channel 25; LIMA, OH; Owner: TV-67, INC.)
WLMO-LP (Channel 65; LIMA, OH; Owner: METRO VIDEO PRODUCTIONS, INC.)
WLQP-LP (Channel 18; LIMA, OH; Owner: METRO VIDEO PRODUCTIONS, INC.)
WLIO (Channel 35; LIMA, OH; Owner: LIMA COMMUNICATIONS CORPORATION)
W09CG (Channel 9; FINDLAY, OH; Owner: NATIONAL MINORITY T.V., INC.)
W61CZ (Channel 61; LIMA, OH; Owner: YONEIDE S. DINZEY)
W55CH (Channel 55; HOUGHTON LAKE, MI; Owner: MS COMMUNICATIONS, LLC)
WFND-LP (Channel 22; FINDLAY, OH; Owner: METRO VIDEO PRODUCTIONS, INC.)
Pandora fatal accident list:
Jan 14, 2001 03:38 PM, Sr-12, Vehicles: 2, Persons: 6, Fatalities: 1, Drunk persons involved: 1
National Bridge Inventory (NBI) Statistics 25 Number of bridges148ft / 45.1m Total length $132,000 Total costs17,977 Total average daily traffic1,430 Total average daily truck traffic24,950 Total future (year 2011) average daily traffic
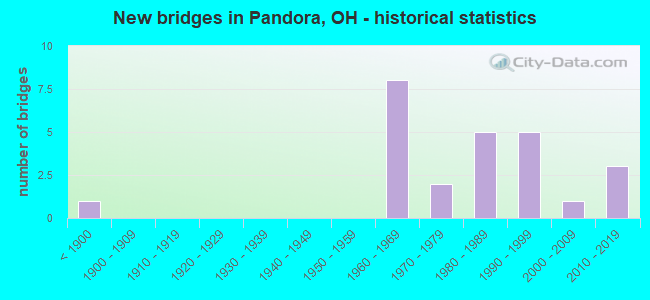
New bridges - historical statistics
1 Before 1900 8 1960-1969 2 1970-1979 5 1980-1989 5 1990-1999 1 2000-2009 3 2010-2019
See full National Bridge Inventory statistics for Pandora, OH
FCC Registered Antenna Towers: 19 (
See the full list of FCC Registered Antenna Towers in Pandora )
FCC Registered Commercial Land Mobile Towers: 2
2620 Rd P (Lat: 40.955889 Lon: -83.911611), Overall height: 151 m, Call Sign: KPM535, Assigned Frequencies: 450.650 MHz, Grant Date: 12/29/1993, Expiration Date: 10/01/2028, Registrant: Booth, Freret, Imlay & Tepper, P.C., 14356 Cape May Road, Silver Spring, MD 20904-6011, Phone: (301) 384-5525, Fax: (301) 384-6384, Email:
2620 Rd P (Lat: 40.955889 Lon: -83.911611), Overall height: 151 m, Call Sign: KPM536, Assigned Frequencies: 455.990 MHz, Grant Date: 12/29/1993, Expiration Date: 10/01/2028, Registrant: Booth, Freret, Imlay & Tepper. P.C., 14356 Cape May Road, Silver Spring, MD 20904-6011, Phone: (301) 384-5525, Fax: (301) 384-6384, Email:
FCC Registered Broadcast Land Mobile Towers: 5
Lat: 40.947833 Lon: -83.962167, Call Sign: WPGJ474, Assigned Frequencies: 155.130 MHz, Grant Date: 11/18/2014, Expiration Date: 01/27/2025, Registrant: Radio Hospital Inc, 829 Tiffin Avenue, Findlay, OH 45840, Phone: (419) 423-3607, Fax: (419) 423-7910, Email:
Rt 1 (Lat: 40.973389 Lon: -83.956611), Call Sign: KYM708, Assigned Frequencies: 152.885 MHz, Grant Date: 11/29/2011, Expiration Date: 01/07/2022, Cancellation Date: 09/13/2016, Registrant: Federal Licensing Inc, 1588 Fairfield Road, Gettysburg, PA 17325, Phone: (717) 334-9262, Fax: (717) 334-6440 305 S. Jefferson St. (Lat: 40.947833 Lon: -83.962167), Call Sign: WPVB306, Assigned Frequencies: 452.150 MHz, Grant Date: 06/11/2002, Expiration Date: 06/11/2012, Cancellation Date: 08/11/2012, Certifier: Gary Luginbill, Registrant: Radio Hospital, 440 East Main Cross, Findlay, OH 45840, Phone: (419) 423-3607, Fax: (419) 423-7910 Lat: 40.944500 Lon: -83.956333, Call Sign: WPZR840, Assigned Frequencies: 451.325 MHz, 461.325 MHz, 467.250 MHz, Grant Date: 03/01/2004, Expiration Date: 03/01/2014, Cancellation Date: 05/03/2014, Certifier: Dave Roper, Registrant: Mcafees Communications Inc, 7678 Weitz Road, Celina, OH 45822, Phone: (419) 586-3413, Fax: (419) 586-5246Lat: 40.951278 Lon: -83.972139, Call Sign: WPZS965, Licensee ID: L00332487, Assigned Frequencies: 72.1000 MHz, Grant Date: 12/10/2013, Expiration Date: 03/08/2024, Certifier: Jeanne Kerekes, Registrant: Pandora-Gilboa Local SchoolFCC Registered Microwave Towers: 4
Pandora Station, Lat: 40.946139 Lon: -83.956917, Type: Mtower, Structure height: 24 m, Call Sign: WQKM631, Assigned Frequencies: 3650.00 MHz, Grant Date: 06/05/2019, Expiration Date: 10/17/2020, Cancellation Date: 12/19/2020, Certifier: Jason D Griffith, Registrant: American Electric Power Service Corporation, 850 Tech Center Drive, Gahanna, OH 43230, Phone: (614) 883-7265, Fax: (614) 883-6917, Email:
PANDORA, Basinger Rd. (Stc269-Oh) (Lat: 40.947111 Lon: -83.955833), Type: Ltower, Structure height: 53.3 m, Overall height: 54.9 m, Call Sign: WQVL899, Assigned Frequencies: 11155.0 MHz, 11155.0 MHz, 11155.0 MHz, 11155.0 MHz, 11155.0 MHz, 11155.0 MHz, 11155.0 MHz, Grant Date: 03/24/2015, Expiration Date: 03/24/2025, Certifier: Gregory M Romano, Registrant: Verizon, 5055 Northpointe Pkwy, Alpharetta, GA 30022, Phone: (770) 797-1070, Email:
Basinger, 7440 Rd R (Lat: 40.918250 Lon: -83.966472), Type: Silo, Structure height: 29 m, Overall height: 30 m, Call Sign: WRDM499, Assigned Frequencies: 10835.0 MHz, 10835.0 MHz, 10835.0 MHz, 10835.0 MHz, 10835.0 MHz, 11075.0 MHz, 11075.0 MHz, 11075.0 MHz, 11075.0 MHz, 11075.0 MHz... (+4 more), Grant Date: 06/04/2019, Expiration Date: 06/04/2029, Certifier: Todd Harpest, Registrant: Metalink Technologies, Inc., 417 Wayne Avenue, Defiance, OH 43512, Phone: (419) 990-0666, Email:
MLOHPNDRJEF195, 403 S High St (Lat: 40.945500 Lon: -83.960333), Type: Silo, Structure height: 36.6 m, Call Sign: WRJK689, Assigned Frequencies: 10995.0 MHz, 10995.0 MHz, 10995.0 MHz, 10995.0 MHz, 10995.0 MHz, 10995.0 MHz, 10995.0 MHz, 10995.0 MHz, 11075.0 MHz, 11075.0 MHz... (+7 more), Grant Date: 09/16/2020, Expiration Date: 09/16/2030, Certifier: Todd Harpest, Registrant: Metalink Technologies, Inc., 417 Wayne Avenue, Defiance, OH 43512, Phone: (419) 990-0666, Email:
FCC Registered Amateur Radio Licenses: 14 (
See the full list of FCC Registered Amateur Radio Licenses in Pandora )
FAA Registered Aircraft: 2
Aircraft: PITTS SPECIAL S-1 (Category: Land, Weight: Up to 12,499 Pounds, Speed: 108 mph), Engine: LYCOMING 0-360-A1D (180 HP) (Reciprocating)N-Number: 11RE, N11RE, N-11RE, Serial Number: 305H, Year manufactured: 1972, Airworthiness Date: 10/17/1980, Certificate Issue Date: 08/22/1995Registrant (Co-Owned): Gerald G Grismore, 6590 Rd 0-6, Pandora, OH 45877, Other Owners: Karen GrismoreAircraft: ALON A2 (Category: Land, Seats: 2, Weight: Up to 12,499 Pounds, Speed: 93 mph), Engine: CONT MOTOR C90 SERIES (95 HP) (Reciprocating)N-Number: 6513Q, N6513Q, N-6513Q, Serial Number: A-113, Year manufactured: 1966, Airworthiness Date: 03/01/1966, Certificate Issue Date: 08/26/2013Registrant (Individual): Gerald G Grismore, 6590 Rd 06, Pandora, OH 45877Deregistered: Cancel Date: 03/06/2018
Most common first names in Pandora, OH among deceased individuals Name Count Lived (average)
Mary 15 82.1 years Robert 12 74.0 years John 12 74.6 years Alice 10 81.5 years Charles 9 83.3 years Ruth 8 88.6 years Harry 7 79.3 years William 7 80.3 years Margaret 7 83.3 years Elizabeth 6 88.2 years
Most common last names in Pandora, OH among deceased individuals Last name Count Lived (average)
Basinger 30 80.6 years Hilty 22 80.8 years Schumacher 22 82.8 years Lehman 16 76.8 years Steiner 16 86.2 years Amstutz 13 86.6 years Lugibihl 11 76.4 years Suter 11 79.9 years Welty 10 78.6 years Diller 10 81.8 years
Pandora compared to Ohio state average:
Unemployed percentage significantly below state average. Black race population percentage significantly below state average. Hispanic race population percentage above state average. Foreign-born population percentage significantly below state average. Renting percentage below state average. Length of stay since moving in above state average. Institutionalized population percentage above state average.


 Recent articles from our blog. Our writers, many of them Ph.D. graduates or candidates, create easy-to-read articles on a wide variety of topics.

 (53.6 miles
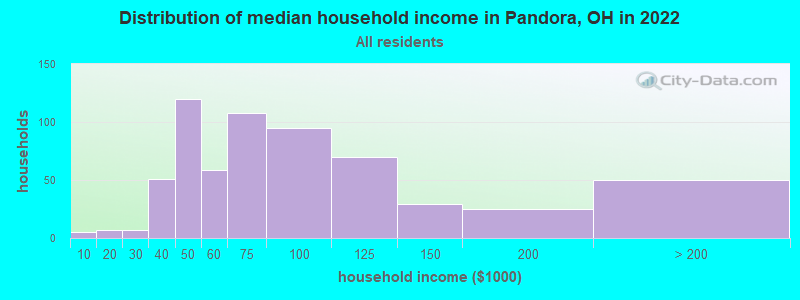


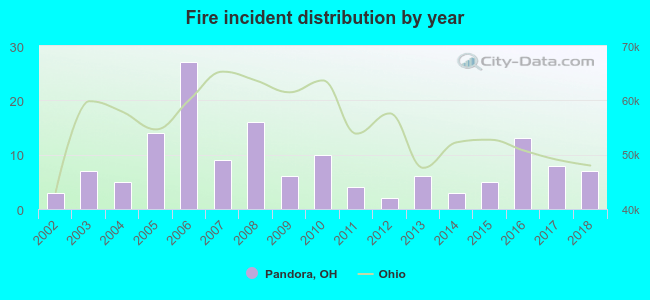 Based on the data from the years 2002 - 2018 the average number of fire incidents per year is 9. The highest number of fire incidents - 27 took place in 2006, and the least - 2 in 2012. The data has a rising trend.
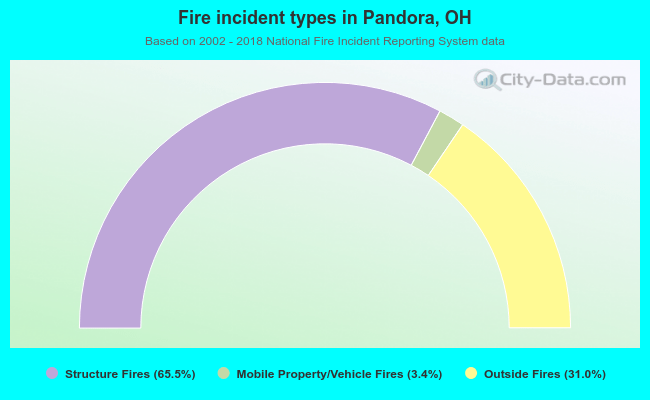 When looking into fire subcategories, the most incidents belonged to: Structure Fires (65.5%), and Outside Fires (31.0%).