Oregon City, Oregon Submit your own pictures of this city and show them to the world
OSM Map
General Map
Google Map
MSN Map
OSM Map
General Map
Google Map
MSN Map
OSM Map
General Map
Google Map
MSN Map
OSM Map
General Map
Google Map
MSN Map
Please wait while loading the map...
Population in 2022: 37,327 (100% urban, 0% rural). Population change since 2000: +44.9%Males: 18,524 Females: 18,803
March 2022 cost of living index in Oregon City: 103.7 (near average, U.S. average is 100) Percentage of residents living in poverty in 2022: 7.8%for White Non-Hispanic residents , 71.6% for Black residents , 5.9% for Hispanic or Latino residents , 4.7% for American Indian residents , 7.0% for other race residents , 3.0% for two or more races residents )
Profiles of local businesses
Business Search - 14 Million verified businesses
Data:
Median household income ($)
Median household income (% change since 2000)
Household income diversity
Ratio of average income to average house value (%)
Ratio of average income to average rent
Median household income ($) - White
Median household income ($) - Black or African American
Median household income ($) - Asian
Median household income ($) - Hispanic or Latino
Median household income ($) - American Indian and Alaska Native
Median household income ($) - Multirace
Median household income ($) - Other Race
Median household income for houses/condos with a mortgage ($)
Median household income for apartments without a mortgage ($)
Races - White alone (%)
Races - White alone (% change since 2000)
Races - Black alone (%)
Races - Black alone (% change since 2000)
Races - American Indian alone (%)
Races - American Indian alone (% change since 2000)
Races - Asian alone (%)
Races - Asian alone (% change since 2000)
Races - Hispanic (%)
Races - Hispanic (% change since 2000)
Races - Native Hawaiian and Other Pacific Islander alone (%)
Races - Native Hawaiian and Other Pacific Islander alone (% change since 2000)
Races - Two or more races (%)
Races - Two or more races (% change since 2000)
Races - Other race alone (%)
Races - Other race alone (% change since 2000)
Racial diversity
Unemployment (%)
Unemployment (% change since 2000)
Unemployment (%) - White
Unemployment (%) - Black or African American
Unemployment (%) - Asian
Unemployment (%) - Hispanic or Latino
Unemployment (%) - American Indian and Alaska Native
Unemployment (%) - Multirace
Unemployment (%) - Other Race
Population density (people per square mile)
Population - Males (%)
Population - Females (%)
Population - Males (%) - White
Population - Males (%) - Black or African American
Population - Males (%) - Asian
Population - Males (%) - Hispanic or Latino
Population - Males (%) - American Indian and Alaska Native
Population - Males (%) - Multirace
Population - Males (%) - Other Race
Population - Females (%) - White
Population - Females (%) - Black or African American
Population - Females (%) - Asian
Population - Females (%) - Hispanic or Latino
Population - Females (%) - American Indian and Alaska Native
Population - Females (%) - Multirace
Population - Females (%) - Other Race
Coronavirus confirmed cases (May 09, 2024)
Deaths caused by coronavirus (May 09, 2024)
Coronavirus confirmed cases (per 100k population) (May 09, 2024)
Deaths caused by coronavirus (per 100k population) (May 09, 2024)
Daily increase in number of cases (May 09, 2024)
Weekly increase in number of cases (May 09, 2024)
Cases doubled (in days) (May 09, 2024)
Hospitalized patients (Apr 18, 2022)
Negative test results (Apr 18, 2022)
Total test results (Apr 18, 2022)
COVID Vaccine doses distributed (per 100k population) (Sep 19, 2023)
COVID Vaccine doses administered (per 100k population) (Sep 19, 2023)
COVID Vaccine doses distributed (Sep 19, 2023)
COVID Vaccine doses administered (Sep 19, 2023)
Likely homosexual households (%)
Likely homosexual households (% change since 2000)
Likely homosexual households - Lesbian couples (%)
Likely homosexual households - Lesbian couples (% change since 2000)
Likely homosexual households - Gay men (%)
Likely homosexual households - Gay men (% change since 2000)
Cost of living index
Median gross rent ($)
Median contract rent ($)
Median monthly housing costs ($)
Median house or condo value ($)
Median house or condo value ($ change since 2000)
Mean house or condo value by units in structure - 1, detached ($)
Mean house or condo value by units in structure - 1, attached ($)
Mean house or condo value by units in structure - 2 ($)
Mean house or condo value by units in structure by units in structure - 3 or 4 ($)
Mean house or condo value by units in structure - 5 or more ($)
Mean house or condo value by units in structure - Boat, RV, van, etc. ($)
Mean house or condo value by units in structure - Mobile home ($)
Median house or condo value ($) - White
Median house or condo value ($) - Black or African American
Median house or condo value ($) - Asian
Median house or condo value ($) - Hispanic or Latino
Median house or condo value ($) - American Indian and Alaska Native
Median house or condo value ($) - Multirace
Median house or condo value ($) - Other Race
Median resident age
Resident age diversity
Median resident age - Males
Median resident age - Females
Median resident age - White
Median resident age - Black or African American
Median resident age - Asian
Median resident age - Hispanic or Latino
Median resident age - American Indian and Alaska Native
Median resident age - Multirace
Median resident age - Other Race
Median resident age - Males - White
Median resident age - Males - Black or African American
Median resident age - Males - Asian
Median resident age - Males - Hispanic or Latino
Median resident age - Males - American Indian and Alaska Native
Median resident age - Males - Multirace
Median resident age - Males - Other Race
Median resident age - Females - White
Median resident age - Females - Black or African American
Median resident age - Females - Asian
Median resident age - Females - Hispanic or Latino
Median resident age - Females - American Indian and Alaska Native
Median resident age - Females - Multirace
Median resident age - Females - Other Race
Commute - mean travel time to work (minutes)
Travel time to work - Less than 5 minutes (%)
Travel time to work - Less than 5 minutes (% change since 2000)
Travel time to work - 5 to 9 minutes (%)
Travel time to work - 5 to 9 minutes (% change since 2000)
Travel time to work - 10 to 19 minutes (%)
Travel time to work - 10 to 19 minutes (% change since 2000)
Travel time to work - 20 to 29 minutes (%)
Travel time to work - 20 to 29 minutes (% change since 2000)
Travel time to work - 30 to 39 minutes (%)
Travel time to work - 30 to 39 minutes (% change since 2000)
Travel time to work - 40 to 59 minutes (%)
Travel time to work - 40 to 59 minutes (% change since 2000)
Travel time to work - 60 to 89 minutes (%)
Travel time to work - 60 to 89 minutes (% change since 2000)
Travel time to work - 90 or more minutes (%)
Travel time to work - 90 or more minutes (% change since 2000)
Marital status - Never married (%)
Marital status - Now married (%)
Marital status - Separated (%)
Marital status - Widowed (%)
Marital status - Divorced (%)
Median family income ($)
Median family income (% change since 2000)
Median non-family income ($)
Median non-family income (% change since 2000)
Median per capita income ($)
Median per capita income (% change since 2000)
Median family income ($) - White
Median family income ($) - Black or African American
Median family income ($) - Asian
Median family income ($) - Hispanic or Latino
Median family income ($) - American Indian and Alaska Native
Median family income ($) - Multirace
Median family income ($) - Other Race
Median year house/condo built
Median year apartment built
Year house built - Built 2005 or later (%)
Year house built - Built 2000 to 2004 (%)
Year house built - Built 1990 to 1999 (%)
Year house built - Built 1980 to 1989 (%)
Year house built - Built 1970 to 1979 (%)
Year house built - Built 1960 to 1969 (%)
Year house built - Built 1950 to 1959 (%)
Year house built - Built 1940 to 1949 (%)
Year house built - Built 1939 or earlier (%)
Average household size
Household density (households per square mile)
Average household size - White
Average household size - Black or African American
Average household size - Asian
Average household size - Hispanic or Latino
Average household size - American Indian and Alaska Native
Average household size - Multirace
Average household size - Other Race
Occupied housing units (%)
Vacant housing units (%)
Owner occupied housing units (%)
Renter occupied housing units (%)
Vacancy status - For rent (%)
Vacancy status - For sale only (%)
Vacancy status - Rented or sold, not occupied (%)
Vacancy status - For seasonal, recreational, or occasional use (%)
Vacancy status - For migrant workers (%)
Vacancy status - Other vacant (%)
Residents with income below the poverty level (%)
Residents with income below 50% of the poverty level (%)
Children below poverty level (%)
Poor families by family type - Married-couple family (%)
Poor families by family type - Male, no wife present (%)
Poor families by family type - Female, no husband present (%)
Poverty status for native-born residents (%)
Poverty status for foreign-born residents (%)
Poverty among high school graduates not in families (%)
Poverty among people who did not graduate high school not in families (%)
Residents with income below the poverty level (%) - White
Residents with income below the poverty level (%) - Black or African American
Residents with income below the poverty level (%) - Asian
Residents with income below the poverty level (%) - Hispanic or Latino
Residents with income below the poverty level (%) - American Indian and Alaska Native
Residents with income below the poverty level (%) - Multirace
Residents with income below the poverty level (%) - Other Race
Air pollution - Air Quality Index (AQI)
Air pollution - CO
Air pollution - NO2
Air pollution - SO2
Air pollution - Ozone
Air pollution - PM10
Air pollution - PM25
Air pollution - Pb
Crime - Murders per 100,000 population
Crime - Rapes per 100,000 population
Crime - Robberies per 100,000 population
Crime - Assaults per 100,000 population
Crime - Burglaries per 100,000 population
Crime - Thefts per 100,000 population
Crime - Auto thefts per 100,000 population
Crime - Arson per 100,000 population
Crime - City-data.com crime index
Crime - Violent crime index
Crime - Property crime index
Crime - Murders per 100,000 population (5 year average)
Crime - Rapes per 100,000 population (5 year average)
Crime - Robberies per 100,000 population (5 year average)
Crime - Assaults per 100,000 population (5 year average)
Crime - Burglaries per 100,000 population (5 year average)
Crime - Thefts per 100,000 population (5 year average)
Crime - Auto thefts per 100,000 population (5 year average)
Crime - Arson per 100,000 population (5 year average)
Crime - City-data.com crime index (5 year average)
Crime - Violent crime index (5 year average)
Crime - Property crime index (5 year average)
1996 Presidential Elections Results (%) - Democratic Party (Clinton)
1996 Presidential Elections Results (%) - Republican Party (Dole)
1996 Presidential Elections Results (%) - Other
2000 Presidential Elections Results (%) - Democratic Party (Gore)
2000 Presidential Elections Results (%) - Republican Party (Bush)
2000 Presidential Elections Results (%) - Other
2004 Presidential Elections Results (%) - Democratic Party (Kerry)
2004 Presidential Elections Results (%) - Republican Party (Bush)
2004 Presidential Elections Results (%) - Other
2008 Presidential Elections Results (%) - Democratic Party (Obama)
2008 Presidential Elections Results (%) - Republican Party (McCain)
2008 Presidential Elections Results (%) - Other
2012 Presidential Elections Results (%) - Democratic Party (Obama)
2012 Presidential Elections Results (%) - Republican Party (Romney)
2012 Presidential Elections Results (%) - Other
2016 Presidential Elections Results (%) - Democratic Party (Clinton)
2016 Presidential Elections Results (%) - Republican Party (Trump)
2016 Presidential Elections Results (%) - Other
2020 Presidential Elections Results (%) - Democratic Party (Biden)
2020 Presidential Elections Results (%) - Republican Party (Trump)
2020 Presidential Elections Results (%) - Other
Ancestries Reported - Arab (%)
Ancestries Reported - Czech (%)
Ancestries Reported - Danish (%)
Ancestries Reported - Dutch (%)
Ancestries Reported - English (%)
Ancestries Reported - French (%)
Ancestries Reported - French Canadian (%)
Ancestries Reported - German (%)
Ancestries Reported - Greek (%)
Ancestries Reported - Hungarian (%)
Ancestries Reported - Irish (%)
Ancestries Reported - Italian (%)
Ancestries Reported - Lithuanian (%)
Ancestries Reported - Norwegian (%)
Ancestries Reported - Polish (%)
Ancestries Reported - Portuguese (%)
Ancestries Reported - Russian (%)
Ancestries Reported - Scotch-Irish (%)
Ancestries Reported - Scottish (%)
Ancestries Reported - Slovak (%)
Ancestries Reported - Subsaharan African (%)
Ancestries Reported - Swedish (%)
Ancestries Reported - Swiss (%)
Ancestries Reported - Ukrainian (%)
Ancestries Reported - United States (%)
Ancestries Reported - Welsh (%)
Ancestries Reported - West Indian (%)
Ancestries Reported - Other (%)
Educational Attainment - No schooling completed (%)
Educational Attainment - Less than high school (%)
Educational Attainment - High school or equivalent (%)
Educational Attainment - Less than 1 year of college (%)
Educational Attainment - 1 or more years of college (%)
Educational Attainment - Associate degree (%)
Educational Attainment - Bachelor's degree (%)
Educational Attainment - Master's degree (%)
Educational Attainment - Professional school degree (%)
Educational Attainment - Doctorate degree (%)
School Enrollment - Nursery, preschool (%)
School Enrollment - Kindergarten (%)
School Enrollment - Grade 1 to 4 (%)
School Enrollment - Grade 5 to 8 (%)
School Enrollment - Grade 9 to 12 (%)
School Enrollment - College undergrad (%)
School Enrollment - Graduate or professional (%)
School Enrollment - Not enrolled in school (%)
School enrollment - Public schools (%)
School enrollment - Private schools (%)
School enrollment - Not enrolled (%)
Median number of rooms in houses and condos
Median number of rooms in apartments
Housing units lacking complete plumbing facilities (%)
Housing units lacking complete kitchen facilities (%)
Density of houses
Urban houses (%)
Rural houses (%)
Households with people 60 years and over (%)
Households with people 65 years and over (%)
Households with people 75 years and over (%)
Households with one or more nonrelatives (%)
Households with no nonrelatives (%)
Population in households (%)
Family households (%)
Nonfamily households (%)
Population in families (%)
Family households with own children (%)
Median number of bedrooms in owner occupied houses
Mean number of bedrooms in owner occupied houses
Median number of bedrooms in renter occupied houses
Mean number of bedrooms in renter occupied houses
Median number of vehichles in owner occupied houses
Mean number of vehichles in owner occupied houses
Median number of vehichles in renter occupied houses
Mean number of vehichles in renter occupied houses
Mortgage status - with mortgage (%)
Mortgage status - with second mortgage (%)
Mortgage status - with home equity loan (%)
Mortgage status - with both second mortgage and home equity loan (%)
Mortgage status - without a mortgage (%)
Average family size
Average family size - White
Average family size - Black or African American
Average family size - Asian
Average family size - Hispanic or Latino
Average family size - American Indian and Alaska Native
Average family size - Multirace
Average family size - Other Race
Geographical mobility - Same house 1 year ago (%)
Geographical mobility - Moved within same county (%)
Geographical mobility - Moved from different county within same state (%)
Geographical mobility - Moved from different state (%)
Geographical mobility - Moved from abroad (%)
Place of birth - Born in state of residence (%)
Place of birth - Born in other state (%)
Place of birth - Native, outside of US (%)
Place of birth - Foreign born (%)
Housing units in structures - 1, detached (%)
Housing units in structures - 1, attached (%)
Housing units in structures - 2 (%)
Housing units in structures - 3 or 4 (%)
Housing units in structures - 5 to 9 (%)
Housing units in structures - 10 to 19 (%)
Housing units in structures - 20 to 49 (%)
Housing units in structures - 50 or more (%)
Housing units in structures - Mobile home (%)
Housing units in structures - Boat, RV, van, etc. (%)
House/condo owner moved in on average (years ago)
Renter moved in on average (years ago)
Year householder moved into unit - Moved in 1999 to March 2000 (%)
Year householder moved into unit - Moved in 1995 to 1998 (%)
Year householder moved into unit - Moved in 1990 to 1994 (%)
Year householder moved into unit - Moved in 1980 to 1989 (%)
Year householder moved into unit - Moved in 1970 to 1979 (%)
Year householder moved into unit - Moved in 1969 or earlier (%)
Means of transportation to work - Drove car alone (%)
Means of transportation to work - Carpooled (%)
Means of transportation to work - Public transportation (%)
Means of transportation to work - Bus or trolley bus (%)
Means of transportation to work - Streetcar or trolley car (%)
Means of transportation to work - Subway or elevated (%)
Means of transportation to work - Railroad (%)
Means of transportation to work - Ferryboat (%)
Means of transportation to work - Taxicab (%)
Means of transportation to work - Motorcycle (%)
Means of transportation to work - Bicycle (%)
Means of transportation to work - Walked (%)
Means of transportation to work - Other means (%)
Working at home (%)
Industry diversity
Most Common Industries - Agriculture, forestry, fishing and hunting, and mining (%)
Most Common Industries - Agriculture, forestry, fishing and hunting (%)
Most Common Industries - Mining, quarrying, and oil and gas extraction (%)
Most Common Industries - Construction (%)
Most Common Industries - Manufacturing (%)
Most Common Industries - Wholesale trade (%)
Most Common Industries - Retail trade (%)
Most Common Industries - Transportation and warehousing, and utilities (%)
Most Common Industries - Transportation and warehousing (%)
Most Common Industries - Utilities (%)
Most Common Industries - Information (%)
Most Common Industries - Finance and insurance, and real estate and rental and leasing (%)
Most Common Industries - Finance and insurance (%)
Most Common Industries - Real estate and rental and leasing (%)
Most Common Industries - Professional, scientific, and management, and administrative and waste management services (%)
Most Common Industries - Professional, scientific, and technical services (%)
Most Common Industries - Management of companies and enterprises (%)
Most Common Industries - Administrative and support and waste management services (%)
Most Common Industries - Educational services, and health care and social assistance (%)
Most Common Industries - Educational services (%)
Most Common Industries - Health care and social assistance (%)
Most Common Industries - Arts, entertainment, and recreation, and accommodation and food services (%)
Most Common Industries - Arts, entertainment, and recreation (%)
Most Common Industries - Accommodation and food services (%)
Most Common Industries - Other services, except public administration (%)
Most Common Industries - Public administration (%)
Occupation diversity
Most Common Occupations - Management, business, science, and arts occupations (%)
Most Common Occupations - Management, business, and financial occupations (%)
Most Common Occupations - Management occupations (%)
Most Common Occupations - Business and financial operations occupations (%)
Most Common Occupations - Computer, engineering, and science occupations (%)
Most Common Occupations - Computer and mathematical occupations (%)
Most Common Occupations - Architecture and engineering occupations (%)
Most Common Occupations - Life, physical, and social science occupations (%)
Most Common Occupations - Education, legal, community service, arts, and media occupations (%)
Most Common Occupations - Community and social service occupations (%)
Most Common Occupations - Legal occupations (%)
Most Common Occupations - Education, training, and library occupations (%)
Most Common Occupations - Arts, design, entertainment, sports, and media occupations (%)
Most Common Occupations - Healthcare practitioners and technical occupations (%)
Most Common Occupations - Health diagnosing and treating practitioners and other technical occupations (%)
Most Common Occupations - Health technologists and technicians (%)
Most Common Occupations - Service occupations (%)
Most Common Occupations - Healthcare support occupations (%)
Most Common Occupations - Protective service occupations (%)
Most Common Occupations - Fire fighting and prevention, and other protective service workers including supervisors (%)
Most Common Occupations - Law enforcement workers including supervisors (%)
Most Common Occupations - Food preparation and serving related occupations (%)
Most Common Occupations - Building and grounds cleaning and maintenance occupations (%)
Most Common Occupations - Personal care and service occupations (%)
Most Common Occupations - Sales and office occupations (%)
Most Common Occupations - Sales and related occupations (%)
Most Common Occupations - Office and administrative support occupations (%)
Most Common Occupations - Natural resources, construction, and maintenance occupations (%)
Most Common Occupations - Farming, fishing, and forestry occupations (%)
Most Common Occupations - Construction and extraction occupations (%)
Most Common Occupations - Installation, maintenance, and repair occupations (%)
Most Common Occupations - Production, transportation, and material moving occupations (%)
Most Common Occupations - Production occupations (%)
Most Common Occupations - Transportation occupations (%)
Most Common Occupations - Material moving occupations (%)
People in Group quarters - Institutionalized population (%)
People in Group quarters - Correctional institutions (%)
People in Group quarters - Federal prisons and detention centers (%)
People in Group quarters - Halfway houses (%)
People in Group quarters - Local jails and other confinement facilities (including police lockups) (%)
People in Group quarters - Military disciplinary barracks (%)
People in Group quarters - State prisons (%)
People in Group quarters - Other types of correctional institutions (%)
People in Group quarters - Nursing homes (%)
People in Group quarters - Hospitals/wards, hospices, and schools for the handicapped (%)
People in Group quarters - Hospitals/wards and hospices for chronically ill (%)
People in Group quarters - Hospices or homes for chronically ill (%)
People in Group quarters - Military hospitals or wards for chronically ill (%)
People in Group quarters - Other hospitals or wards for chronically ill (%)
People in Group quarters - Hospitals or wards for drug/alcohol abuse (%)
People in Group quarters - Mental (Psychiatric) hospitals or wards (%)
People in Group quarters - Schools, hospitals, or wards for the mentally retarded (%)
People in Group quarters - Schools, hospitals, or wards for the physically handicapped (%)
People in Group quarters - Institutions for the deaf (%)
People in Group quarters - Institutions for the blind (%)
People in Group quarters - Orthopedic wards and institutions for the physically handicapped (%)
People in Group quarters - Wards in general hospitals for patients who have no usual home elsewhere (%)
People in Group quarters - Wards in military hospitals for patients who have no usual home elsewhere (%)
People in Group quarters - Juvenile institutions (%)
People in Group quarters - Long-term care (%)
People in Group quarters - Homes for abused, dependent, and neglected children (%)
People in Group quarters - Residential treatment centers for emotionally disturbed children (%)
People in Group quarters - Training schools for juvenile delinquents (%)
People in Group quarters - Short-term care, detention or diagnostic centers for delinquent children (%)
People in Group quarters - Type of juvenile institution unknown (%)
People in Group quarters - Noninstitutionalized population (%)
People in Group quarters - College dormitories (includes college quarters off campus) (%)
People in Group quarters - Military quarters (%)
People in Group quarters - On base (%)
People in Group quarters - Barracks, unaccompanied personnel housing (UPH), (Enlisted/Officer), ;and similar group living quarters for military personnel (%)
People in Group quarters - Transient quarters for temporary residents (%)
People in Group quarters - Military ships (%)
People in Group quarters - Group homes (%)
People in Group quarters - Homes or halfway houses for drug/alcohol abuse (%)
People in Group quarters - Homes for the mentally ill (%)
People in Group quarters - Homes for the mentally retarded (%)
People in Group quarters - Homes for the physically handicapped (%)
People in Group quarters - Other group homes (%)
People in Group quarters - Religious group quarters (%)
People in Group quarters - Dormitories (%)
People in Group quarters - Agriculture workers' dormitories on farms (%)
People in Group quarters - Job Corps and vocational training facilities (%)
People in Group quarters - Other workers' dormitories (%)
People in Group quarters - Crews of maritime vessels (%)
People in Group quarters - Other nonhousehold living situations (%)
People in Group quarters - Other noninstitutional group quarters (%)
Residents speaking English at home (%)
Residents speaking English at home - Born in the United States (%)
Residents speaking English at home - Native, born elsewhere (%)
Residents speaking English at home - Foreign born (%)
Residents speaking Spanish at home (%)
Residents speaking Spanish at home - Born in the United States (%)
Residents speaking Spanish at home - Native, born elsewhere (%)
Residents speaking Spanish at home - Foreign born (%)
Residents speaking other language at home (%)
Residents speaking other language at home - Born in the United States (%)
Residents speaking other language at home - Native, born elsewhere (%)
Residents speaking other language at home - Foreign born (%)
Class of Workers - Employee of private company (%)
Class of Workers - Self-employed in own incorporated business (%)
Class of Workers - Private not-for-profit wage and salary workers (%)
Class of Workers - Local government workers (%)
Class of Workers - State government workers (%)
Class of Workers - Federal government workers (%)
Class of Workers - Self-employed workers in own not incorporated business and Unpaid family workers (%)
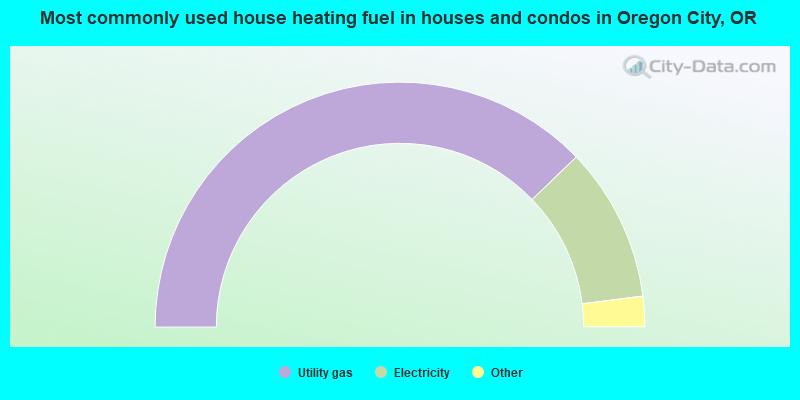
House heating fuel used in houses and condos - Utility gas (%)
House heating fuel used in houses and condos - Bottled, tank, or LP gas (%)
House heating fuel used in houses and condos - Electricity (%)
House heating fuel used in houses and condos - Fuel oil, kerosene, etc. (%)
House heating fuel used in houses and condos - Coal or coke (%)
House heating fuel used in houses and condos - Wood (%)
House heating fuel used in houses and condos - Solar energy (%)
House heating fuel used in houses and condos - Other fuel (%)
House heating fuel used in houses and condos - No fuel used (%)
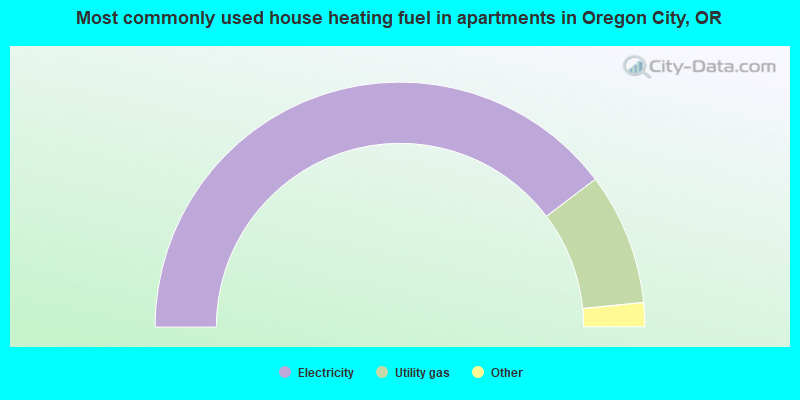
House heating fuel used in apartments - Utility gas (%)
House heating fuel used in apartments - Bottled, tank, or LP gas (%)
House heating fuel used in apartments - Electricity (%)
House heating fuel used in apartments - Fuel oil, kerosene, etc. (%)
House heating fuel used in apartments - Coal or coke (%)
House heating fuel used in apartments - Wood (%)
House heating fuel used in apartments - Solar energy (%)
House heating fuel used in apartments - Other fuel (%)
House heating fuel used in apartments - No fuel used (%)
Armed forces status - In Armed Forces (%)
Armed forces status - Civilian (%)
Armed forces status - Civilian - Veteran (%)
Armed forces status - Civilian - Nonveteran (%)
Fatal accidents locations in years 2005-2021
Fatal accidents locations in 2005
Fatal accidents locations in 2006
Fatal accidents locations in 2007
Fatal accidents locations in 2008
Fatal accidents locations in 2009
Fatal accidents locations in 2010
Fatal accidents locations in 2011
Fatal accidents locations in 2012
Fatal accidents locations in 2013
Fatal accidents locations in 2014
Fatal accidents locations in 2015
Fatal accidents locations in 2016
Fatal accidents locations in 2017
Fatal accidents locations in 2018
Fatal accidents locations in 2019
Fatal accidents locations in 2020
Fatal accidents locations in 2021
Alcohol use - People drinking some alcohol every month (%)
Alcohol use - People not drinking at all (%)
Alcohol use - Average days/month drinking alcohol
Alcohol use - Average drinks/week
Alcohol use - Average days/year people drink much
Audiometry - Average condition of hearing (%)
Audiometry - People that can hear a whisper from across a quiet room (%)
Audiometry - People that can hear normal voice from across a quiet room (%)
Audiometry - Ears ringing, roaring, buzzing (%)
Audiometry - Had a job exposure to loud noise (%)
Audiometry - Had off-work exposure to loud noise (%)
Blood Pressure & Cholesterol - Has high blood pressure (%)
Blood Pressure & Cholesterol - Checking blood pressure at home (%)
Blood Pressure & Cholesterol - Frequently checking blood cholesterol (%)
Blood Pressure & Cholesterol - Has high cholesterol level (%)
Consumer Behavior - Money monthly spent on food at supermarket/grocery store
Consumer Behavior - Money monthly spent on food at other stores
Consumer Behavior - Money monthly spent on eating out
Consumer Behavior - Money monthly spent on carryout/delivered foods
Consumer Behavior - Income spent on food at supermarket/grocery store (%)
Consumer Behavior - Income spent on food at other stores (%)
Consumer Behavior - Income spent on eating out (%)
Consumer Behavior - Income spent on carryout/delivered foods (%)
Current Health Status - General health condition (%)
Current Health Status - Blood donors (%)
Current Health Status - Has blood ever tested for HIV virus (%)
Current Health Status - Left-handed people (%)
Dermatology - People using sunscreen (%)
Diabetes - Diabetics (%)
Diabetes - Had a blood test for high blood sugar (%)
Diabetes - People taking insulin (%)
Diet Behavior & Nutrition - Diet health (%)
Diet Behavior & Nutrition - Milk product consumption (# of products/month)
Diet Behavior & Nutrition - Meals not home prepared (#/week)
Diet Behavior & Nutrition - Meals from fast food or pizza place (#/week)
Diet Behavior & Nutrition - Ready-to-eat foods (#/month)
Diet Behavior & Nutrition - Frozen meals/pizza (#/month)
Drug Use - People that ever used marijuana or hashish (%)
Drug Use - Ever used hard drugs (%)
Drug Use - Ever used any form of cocaine (%)
Drug Use - Ever used heroin (%)
Drug Use - Ever used methamphetamine (%)
Health Insurance - People covered by health insurance (%)
Kidney Conditions-Urology - Avg. # of times urinating at night
Medical Conditions - People with asthma (%)
Medical Conditions - People with anemia (%)
Medical Conditions - People with psoriasis (%)
Medical Conditions - People with overweight (%)
Medical Conditions - Elderly people having difficulties in thinking or remembering (%)
Medical Conditions - People who ever received blood transfusion (%)
Medical Conditions - People having trouble seeing even with glass/contacts (%)
Medical Conditions - People with arthritis (%)
Medical Conditions - People with gout (%)
Medical Conditions - People with congestive heart failure (%)
Medical Conditions - People with coronary heart disease (%)
Medical Conditions - People with angina pectoris (%)
Medical Conditions - People who ever had heart attack (%)
Medical Conditions - People who ever had stroke (%)
Medical Conditions - People with emphysema (%)
Medical Conditions - People with thyroid problem (%)
Medical Conditions - People with chronic bronchitis (%)
Medical Conditions - People with any liver condition (%)
Medical Conditions - People who ever had cancer or malignancy (%)
Mental Health - People who have little interest in doing things (%)
Mental Health - People feeling down, depressed, or hopeless (%)
Mental Health - People who have trouble sleeping or sleeping too much (%)
Mental Health - People feeling tired or having little energy (%)
Mental Health - People with poor appetite or overeating (%)
Mental Health - People feeling bad about themself (%)
Mental Health - People who have trouble concentrating on things (%)
Mental Health - People moving or speaking slowly or too fast (%)
Mental Health - People having thoughts they would be better off dead (%)
Oral Health - Average years since last visit a dentist
Oral Health - People embarrassed because of mouth (%)
Oral Health - People with gum disease (%)
Oral Health - General health of teeth and gums (%)
Oral Health - Average days a week using dental floss/device
Oral Health - Average days a week using mouthwash for dental problem
Oral Health - Average number of teeth
Pesticide Use - Households using pesticides to control insects (%)
Pesticide Use - Households using pesticides to kill weeds (%)
Physical Activity - People doing vigorous-intensity work activities (%)
Physical Activity - People doing moderate-intensity work activities (%)
Physical Activity - People walking or bicycling (%)
Physical Activity - People doing vigorous-intensity recreational activities (%)
Physical Activity - People doing moderate-intensity recreational activities (%)
Physical Activity - Average hours a day doing sedentary activities
Physical Activity - Average hours a day watching TV or videos
Physical Activity - Average hours a day using computer
Physical Functioning - People having limitations keeping them from working (%)
Physical Functioning - People limited in amount of work they can do (%)
Physical Functioning - People that need special equipment to walk (%)
Physical Functioning - People experiencing confusion/memory problems (%)
Physical Functioning - People requiring special healthcare equipment (%)
Prescription Medications - Average number of prescription medicines taking
Preventive Aspirin Use - Adults 40+ taking low-dose aspirin (%)
Reproductive Health - Vaginal deliveries (%)
Reproductive Health - Cesarean deliveries (%)
Reproductive Health - Deliveries resulted in a live birth (%)
Reproductive Health - Pregnancies resulted in a delivery (%)
Reproductive Health - Women breastfeeding newborns (%)
Reproductive Health - Women that had a hysterectomy (%)
Reproductive Health - Women that had both ovaries removed (%)
Reproductive Health - Women that have ever taken birth control pills (%)
Reproductive Health - Women taking birth control pills (%)
Reproductive Health - Women that have ever used Depo-Provera or injectables (%)
Reproductive Health - Women that have ever used female hormones (%)
Sexual Behavior - People 18+ that ever had sex (vaginal, anal, or oral) (%)
Sexual Behavior - Males 18+ that ever had vaginal sex with a woman (%)
Sexual Behavior - Males 18+ that ever performed oral sex on a woman (%)
Sexual Behavior - Males 18+ that ever had anal sex with a woman (%)
Sexual Behavior - Males 18+ that ever had any sex with a man (%)
Sexual Behavior - Females 18+ that ever had vaginal sex with a man (%)
Sexual Behavior - Females 18+ that ever performed oral sex on a man (%)
Sexual Behavior - Females 18+ that ever had anal sex with a man (%)
Sexual Behavior - Females 18+ that ever had any kind of sex with a woman (%)
Sexual Behavior - Average age people first had sex
Sexual Behavior - Average number of female sex partners in lifetime (males 18+)
Sexual Behavior - Average number of female vaginal sex partners in lifetime (males 18+)
Sexual Behavior - Average age people first performed oral sex on a woman (18+)
Sexual Behavior - Average number of woman performed oral sex on in lifetime (18+)
Sexual Behavior - Average number of male sex partners in lifetime (males 18+)
Sexual Behavior - Average number of male anal sex partners in lifetime (males 18+)
Sexual Behavior - Average age people first performed oral sex on a man (18+)
Sexual Behavior - Average number of male oral sex partners in lifetime (18+)
Sexual Behavior - People using protection when performing oral sex (%)
Sexual Behavior - Average number of times people have vaginal or anal sex a year
Sexual Behavior - People having sex without condom (%)
Sexual Behavior - Average number of male sex partners in lifetime (females 18+)
Sexual Behavior - Average number of male vaginal sex partners in lifetime (females 18+)
Sexual Behavior - Average number of female sex partners in lifetime (females 18+)
Sexual Behavior - Circumcised males 18+ (%)
Sleep Disorders - Average hours sleeping at night
Sleep Disorders - People that has trouble sleeping (%)
Smoking-Cigarette Use - People smoking cigarettes (%)
Taste & Smell - People 40+ having problems with smell (%)
Taste & Smell - People 40+ having problems with taste (%)
Taste & Smell - People 40+ that ever had wisdom teeth removed (%)
Taste & Smell - People 40+ that ever had tonsils teeth removed (%)
Taste & Smell - People 40+ that ever had a loss of consciousness because of a head injury (%)
Taste & Smell - People 40+ that ever had a broken nose or other serious injury to face or skull (%)
Taste & Smell - People 40+ that ever had two or more sinus infections (%)
Weight - Average height (inches)
Weight - Average weight (pounds)
Weight - Average BMI
Weight - People that are obese (%)
Weight - People that ever were obese (%)
Weight - People trying to lose weight (%)
According to our research of Oregon and other state lists, there were 15 registered sex offenders living in Oregon City, Oregon as of May 09, 2024 . The ratio of all residents to sex offenders in Oregon City is 2,415 to 1.The ratio of registered sex offenders to all residents in this city is near the state average.
Officers per 1,000 residents here:
1.14Oregon average:
1.48
Latest news from Oregon City, OR collected exclusively by city-data.com from local newspapers, TV, and radio stations
Oregon City, OR City Guides: Ancestries: German (18.2%), American (10.0%), English (9.4%), Ukrainian (7.2%), European (7.1%), Irish (4.7%).
Current Local Time:
Land area: 8.14 square miles.
Population density: 4,586 people per square mile (average).
1,977 residents are foreign born (2.9% Europe , 1.1% Asia , 0.8% Latin America ).
This city:
5.3%Oregon:
9.8%
Median real estate property taxes paid for housing units with mortgages in 2022: $4,847 (0.9%)Median real estate property taxes paid for housing units with no mortgage in 2022: $4,567 (0.9%)
Nearest city with pop. 50,000+: Northwest Clackamas, OR (3.6 miles
Nearest city with pop. 1,000,000+: Los Angeles, CA
Nearest cities:
Latitude: 45.35 N, Longitude: 122.60 W
Daytime population change due to commuting: -1,303 (-3.5%)Workers who live and work in this city: 7,587 (38.9%)
Area code commonly used in this area: 503
Property values in Oregon City, OR
Single-family new house construction building permits:
2022: 39 buildings , average cost: $349,5002021: 51 buildings , average cost: $339,0002020: 86 buildings , average cost: $271,6002019: 118 buildings , average cost: $328,8002018: 100 buildings , average cost: $330,9002017: 120 buildings , average cost: $320,8002016: 151 buildings , average cost: $312,1002015: 130 buildings , average cost: $285,2002014: 79 buildings , average cost: $262,4002013: 173 buildings , average cost: $234,7002012: 293 buildings , average cost: $196,4002011: 137 buildings , average cost: $213,1002010: 109 buildings , average cost: $185,7002009: 103 buildings , average cost: $194,5002008: 95 buildings , average cost: $195,1002007: 237 buildings , average cost: $229,6002006: 267 buildings , average cost: $200,3002005: 214 buildings , average cost: $249,5002004: 208 buildings , average cost: $238,9002003: 259 buildings , average cost: $228,8002002: 250 buildings , average cost: $197,0002001: 311 buildings , average cost: $190,7002000: 334 buildings , average cost: $162,3001999: 465 buildings , average cost: $150,6001998: 287 buildings , average cost: $165,6001997: 232 buildings , average cost: $161,500Unemployment in December 2023:
Population change in the 1990s: +7,839 (+43.8%).
Most common occupations in Oregon City, OR (%)
Both Males Females
Other management occupations, except farmers and farm managers (4.3%)
Secretaries and administrative assistants (4.2%)
Other office and administrative support workers, including supervisors (4.0%)
Retail sales workers, except cashiers (3.7%)
Other production occupations, including supervisors (3.6%)
Electrical equipment mechanics and other installation, maintenance, and repair workers, including supervisors (3.1%)
Material recording, scheduling, dispatching, and distributing workers (3.0%)
Other management occupations, except farmers and farm managers (5.8%)
Electrical equipment mechanics and other installation, maintenance, and repair workers, including supervisors (5.7%)
Other production occupations, including supervisors (5.4%)
Driver/sales workers and truck drivers (4.5%)
Retail sales workers, except cashiers (4.3%)
Building and grounds cleaning and maintenance occupations (3.5%)
Carpenters (3.4%)
Secretaries and administrative assistants (8.7%)
Other office and administrative support workers, including supervisors (5.8%)
Information and record clerks, except customer service representatives (4.8%)
Child care workers (3.9%)
Registered nurses (3.7%)
Cashiers (3.6%)
Preschool, kindergarten, elementary, and middle school teachers (3.1%)
Earthquake activity:
Oregon City-area historical earthquake activity is significantly above Oregon state average. It is 1464% greater than the overall U.S. average. On 4/13/1949 at 19:55:42, a magnitude 7.0 (7.0 UK, Class: Major, Intensity: VIII - XII) earthquake occurred 131.7 miles away from Oregon City center, causing $80,000,000 total damage On 2/28/2001 at 18:54:32, a magnitude 6.8 (6.5 MB, 6.6 MS, 6.8 MW, Class: Strong, Intensity: VII - IX) earthquake occurred 120.5 miles away from Oregon City center, causing $2,000,000,000 total damage and $305,000,000 insured lossesOn 2/28/2001 at 18:54:32, a magnitude 6.8 (6.8 MD, Depth: 32.2 mi) earthquake occurred 124.8 miles away from Oregon City center On 1/31/1922 at 13:17:28, a magnitude 7.6 (7.6 UK) earthquake occurred 354.4 miles away from the city center On 4/29/1965 at 15:28:43, a magnitude 6.6 (6.6 UK) earthquake occurred 136.8 miles away from the city center, causing $28,000,000 total damage On 11/8/1980 at 10:27:34, a magnitude 7.2 (6.2 MB, 7.2 MS, 7.2 MW, 7.0 ML) earthquake occurred 305.4 miles away from the city center Magnitude types: body-wave magnitude (MB), duration magnitude (MD), local magnitude (ML), surface-wave magnitude (MS), moment magnitude (MW) Natural disasters: The number of natural disasters in Clackamas County (13) is near the US average (15).Major Disasters (Presidential) Declared: 11Emergencies Declared: 1Floods: 7, Landslides: 4, Mudslides: 4, Storms: 4, Winter Storms: 4, Snows: 2, Winds: 2, Earthquake: 1, Fire: 1, Heavy Rain: 1, Hurricane: 1, Other: 1 (Note: some incidents may be assigned to more than one category). Hospitals and medical centers in Oregon City: PROVIDENCE WILLAMETTE FALLS MEDICAL CENTER (Voluntary non-profit - Private, 1500 DIVISION STREET) WILLAMETTE FALLS HOSPICE (1404 DIVISION STREET, SUITE 7) AVAMERE REHABILITATION OF OREGON CITY (1400 DIVISION STREET)
GOLDEN AGE CARE CENTER (1506 DIVISION ST)
MARQUIS CARE AT OREGON CITY (1680 MOLALLA AVENUE)
OREGON CITY HEALTH CARE CENTER (148 HOOD STREET)
DSI WILLAMETTE VALLEY RENAL CENTER (1510 DIVISION ST STE 90)
Amtrak station: OREGON CITY (1757 WASHINGTON ST.)
College/University in Oregon City: Clackamas Community College Full-time enrollment: 4,261; Location: 19600 Molalla Ave; Public; Website: www.clackamas.edu)
Other colleges/universities with over 2000 students near Oregon City:
Lewis & Clark College (about 9 miles; Portland, OR ; Full-time enrollment: 2,864)
Pioneer Pacific College (about 9 miles; Wilsonville, OR ; FT enrollment: 2,194)
Portland Community College (about 10 miles; Portland, OR ; FT enrollment: 23,600)
Portland State University (about 13 miles; Portland, OR ; FT enrollment: 21,450)
Mt Hood Community College (about 16 miles; Gresham, OR ; FT enrollment: 11,847)
Concordia University-Portland (about 16 miles; Portland, OR ; FT enrollment: 3,996)
University of Portland (about 17 miles; Portland, OR ; FT enrollment: 4,030)
Public high schools in Oregon City: OREGON CITY SENIOR HIGH SCHOOL Students: 2,213, Location: 19761 S BEAVERCREEK RD, Grades: 9-12)ALLIANCE CHARTER ACADEMY Students: 263, Location: 16075 S FRONT AVE, Grades: 1-12, Charter school )OREGON CITY SERVICE LEARNING ACADEMY Students: 104, Location: 995 SOUTH END RD, Grades: 7-12, Charter school )CLACKAMAS ACADEMY OF INDUSTRIAL SCIENCES Location: 1306 12TH ST, Grades: 8-12, Charter school )
Private high schools in Oregon City: NORTH CLACKAMAS CHRISTIAN SCHOOL Students: 222, Location: 19575 SEBASTIAN WAY, Grades: PK-12)
HERA COMMUNITY SCHOOL Students: 31, Location: 903 VAN BUREN ST, Grades: 9-12)
KING'S ACADEMY CHRISTIAN SCHOOL Students: 10, Location: 1201 JQ ADAMS ST, Grades: 8-12, Boys only )
CHRISTIE CARE - CLACKAMAS RIVER CAMPUS Students: 7, Location: 15544 CLACKAMAS RIVER DR, Grades: 10-12)
Public elementary/middle schools in Oregon City: OGDEN MIDDLE SCHOOL Students: 663, Location: 14133 S DONOVAN RD, Grades: 6-8)JOHN MCLOUGHLIN ELEMENTARY SCHOOL Students: 580, Location: 19230 S END RD, Grades: KG-5)GARDINER MIDDLE SCHOOL Students: 578, Location: 180 ETHEL ST, Grades: 6-8)GAFFNEY LANE ELEMENTARY SCHOOL Students: 574, Location: 13521 S GAFFNEY LN, Grades: KG-5)REDLAND ELEMENTARY SCHOOL Students: 522, Location: 18131 S REDLAND RD, Grades: KG-5)HOLCOMB ELEMENTARY SCHOOL Students: 455, Location: 14625 S HOLCOMB BLVD, Grades: KG-5)CARUS SCHOOL Students: 393, Location: 14412 S CARUS RD, Grades: KG-6)SPRINGWATER ENVIRONMENTAL SCIENCES SCHOOL Students: 128, Location: 16491 S SPRINGWATER RD, Grades: KG-8, Charter school )Private elementary/middle school in Oregon City: ST JOHN THE APOSTLE CATHOLIC SCHOOL Students: 236, Location: 516 5TH ST, Grades: KG-8)
See full list of schools located in Oregon City Library in Oregon City: OREGON CITY PUBLIC LIBRARY Operating income: $881,443; Location: 362 WARNER MILNE RD; 99,558 books ; 13,227 audio materials ; 12,732 video materials ; 1 local licensed databases ; 27 state licensed databases ; 12 other licensed databases ; 208 print serial subscriptions ; 6 electronic serial subscriptions )
Notable locations in Oregon City: (A) , Maple Lane (B) , South Fork Water Board Treatment Plant (C) , Sportcraft Landing (D) , Oregon City Transit Center (E) , First Presbyterian Church Park and Ride (F) , Tri - City Service District Biomass Facility (G) , Clackamette Park Boat Ramp (H) , Clackamas Community College Park and Ride (I) , South Fork Water Board (J) , Tri - City Service District (K) , End of the Trail Interpretive Center (L) , Ermatinger House (M) , Barclay Community Theater (N) , Oregon City Public Works (O) , Oregon City Public Library (P) , Oregon City Municipal Court (Q) , Oregon City Town Hall (R) , Clackamas County Circuit Court (S) , Clackamas County Family Court (T) . Display/hide their locations on the map
Shopping Centers: (1) , Berry Hill Center Shopping Center (2) . Display/hide their locations on the map
Churches in Oregon City include: (A) , Crossroads Christian Center (B) , First Church of God (C) , First Presbyterian Church of Oregon City (D) , Foursquare Gospel Church (E) , Abernethy Center (F) , Maranatha Baptist Church (G) , Oregon City Assembly of God (H) , Oregon City Christian Church (I) . Display/hide their locations on the map
Cemeteries: (1) , Masonic Cemetery (2) , Canema Cemetery (3) , Saint Pauls Cemetery (4) , Mountain View Cemetery (5) . Display/hide their locations on the map
Reservoir: (A) . Display/hide its location on the map
Creeks: (A) , Singer Creek (B) . Display/hide their locations on the map
Parks in Oregon City include: (1) , Dement Park (2) , Jon Storm Park (3) , Oak Tree Park (4) , Senior Citizen Park (5) , Shenandoah Park (6) , Water Board Park (7) , Rivercrest Park (8) , Jacobs Square (9) . Display/hide their locations on the map
Tourist attractions:
Hotels:
Courts:
Birthplace of: Matt Lindland - Olympic wrestler, Drew Struzan - Illustrator, Kenneth Scott Latourette - Historian, Brad Tinsley - Basketball player, Earl C. Latourette - Judge, Edwin Markham - Poet, Lewis Hanke - Historian, Larry G. Dahl - Army Medal of Honor recipient, Meredith Brooks - musician, Bobby Preston - Actor.
Clackamas County has a predicted average indoor radon screening level less than 2 pCi/L (pico curies per liter) - Low Potential Drinking water stations with addresses in Oregon City and their reported violations in the past:
EXCALIBUR VILLAGE (Population served: 150, Groundwater):
Past monitoring violations:
Follow-up Or Routine LCR Tap M/R - In JAN-01-2011, Contaminant: Lead and Copper Rule. Follow-up actions: St Violation/Reminder Notice (FEB-22-2011), St Compliance achieved (OCT-10-2011)
Monitoring, Repeat Major (TCR) - In OCT-2007, Contaminant: Coliform (TCR). Follow-up actions: St Compliance achieved (DEC-10-2007)
51 regular monitoring violations
Population served: 84, Groundwater):
Past health violations:
MCL, Monthly (TCR) - In DEC-2008, Contaminant: Coliform. Follow-up actions: St Compliance achieved (FEB-09-2009)
MCL, Monthly (TCR) - In NOV-2008, Contaminant: Coliform. Follow-up actions: St Compliance achieved (JAN-08-2009)
MCL, Monthly (TCR) - In OCT-2008, Contaminant: Coliform. Follow-up actions: St Compliance achieved (NOV-25-2008)
Past monitoring violations:
Follow-up Or Routine LCR Tap M/R - In JAN-01-2011, Contaminant: Lead and Copper Rule. Follow-up actions: St Violation/Reminder Notice (FEB-22-2011)
Monitoring, Repeat Major (TCR) - In SEP-2008, Contaminant: Coliform (TCR). Follow-up actions: St Compliance achieved (MAR-03-2009)
2 routine major monitoring violations
One minor monitoring violation
One regular monitoring violation
Population served: 50, Groundwater):
Past monitoring violations:
Monitoring, Repeat Major (TCR) - Between OCT-2013 and DEC-2013, Contaminant: Coliform (TCR). Follow-up actions: St Public Notif requested (NOV-22-2013), St Compliance achieved (MAR-21-2014)
2 routine major monitoring violations
Population served: 40, Groundwater):
Past monitoring violations:
2 routine major monitoring violations
One minor monitoring violation
3 regular monitoring violations
Drinking water stations with addresses in Oregon City that have no violations reported:
NORTH CLACKAMAS COUNTY WC (Population served: 0, Primary Water Source Type: Surface water)
Average household size: This city:
2.6 peopleOregon:
2.5 people
Percentage of family households: This city:
68.5%Whole state:
63.4%
Percentage of households with unmarried partners: This city:
7.6%Whole state:
8.0%
Likely homosexual households (counted as self-reported same-sex unmarried-partner households)
Lesbian couples: 0.5% of all households Gay men: 0.3% of all households
People in group quarters in Oregon City in 2010:
398 people in local jails and other municipal confinement facilities
157 people in nursing facilities/skilled-nursing facilities
49 people in group homes intended for adults
35 people in residential treatment centers for adults
11 people in workers' group living quarters and job corps centers
People in group quarters in Oregon City in 2000:
322 people in nursing homes
266 people in local jails and other confinement facilities (including police lockups)
235 people in state prisons
29 people in homes for the mentally retarded
28 people in homes for the mentally ill
17 people in other noninstitutional group quarters
4 people in other group homes
2 people in other nonhousehold living situations
Banks with most branches in Oregon City (2011 data):
U.S. Bank National Association: Oregon City Branch, Hilltop Branch, South Beaverton Road Albertsons. Info updated 2012/01/30: Bank assets: $330,470.8 mil, Deposits: $236,091.5 mil, headquarters in Cincinnati, OH, positive income , 3121 total offices , Holding Company: U.S. Bancorp
Lewis & Clark Bank: at 1900 Mcloughlin Blvd Ste 67, branch established on 2006/12/15. Info updated 2008/12/02: Bank assets: $120.5 mil, Deposits: $106.4 mil, local headquarters , positive income , Commercial Lending Specialization, 1 total offices
JPMorgan Chase Bank, National Association: Oregon City Hilltop at 1839 Molalla Avenue, branch established on 1923/01/01. Info updated 2011/11/10: Bank assets: $1,811,678.0 mil, Deposits: $1,190,738.0 mil, headquarters in Columbus, OH, positive income , International Specialization, 5577 total offices , Holding Company: Jpmorgan Chase & Co.
Bank of America, National Association: Oregon City Branch at 1841 Mollala Ave, branch established on 1960/12/30. Info updated 2009/11/18: Bank assets: $1,451,969.3 mil, Deposits: $1,077,176.8 mil, headquarters in Charlotte, NC, positive income , 5782 total offices , Holding Company: Bank Of America Corporation
Wells Fargo Bank, National Association: Oregon City Branch at 1751 Molalla Avenue, branch established on 1977/06/03. Info updated 2011/04/05: Bank assets: $1,161,490.0 mil, Deposits: $905,653.0 mil, headquarters in Sioux Falls, SD, positive income , 6395 total offices , Holding Company: Wells Fargo & Company
Bank of the West: Oregon City Branch at 1301 Molalla Avenue, branch established on 1958/01/01. Info updated 2009/11/16: Bank assets: $62,408.3 mil, Deposits: $43,995.2 mil, headquarters in San Francisco, CA, positive income , 647 total offices , Holding Company: Bnp Paribas
West Coast Bank: Oregon City Branch at 19550 Molalla Avenue, Suite 139, branch established on 2007/12/03. Info updated 2010/09/16: Bank assets: $2,424.8 mil, Deposits: $1,925.6 mil, headquarters in Lake Oswego, OR, positive income , Commercial Lending Specialization, 63 total offices , Holding Company: West Coast Bancorp
KeyBank National Association: Hilltop Branch at 1400 South Molalla Avenue, branch established on 1977/03/14. Info updated 2008/03/03: Bank assets: $86,198.8 mil, Deposits: $64,214.8 mil, headquarters in Cleveland, OH, positive income , Commercial Lending Specialization, 1067 total offices , Holding Company: Keycorp
Citizens Bank: Oregon City Branch at 19245 South Molalla Avenue, branch established on 2005/02/01. Info updated 2009/02/23: Bank assets: $448.2 mil, Deposits: $356.5 mil, headquarters in Corvallis, OR, positive income , Commercial Lending Specialization, 14 total offices , Holding Company: Citizens Bancorp
For population 15 years and over in Oregon City:
Never married: 33.3%Now married: 50.5%Separated: 0.8%Widowed: 4.8%Divorced: 10.5% For population 25 years and over in Oregon City:
High school or higher: 94.8%Bachelor's degree or higher: 30.2%Graduate or professional degree: 7.6%Unemployed: 5.9%Mean travel time to work (commute): 20.8 minutes
Education Gini index (Inequality in education) Here:
9.0Oregon average:
11.6
Religion statistics for Oregon City, OR (based on Clackamas County data)
Religion Adherents Congregations Evangelical Protestant 49,829 194 Catholic 27,128 13 Other 15,447 51 Mainline Protestant 15,118 49 Orthodox 2,275 5 None 266,195 -
Source: Clifford Grammich, Kirk Hadaway, Richard Houseal, Dale E.Jones, Alexei Krindatch, Richie Stanley and Richard H.Taylor. 2012. 2010 U.S.Religion Census: Religious Congregations & Membership Study. Association of Statisticians of American Religious Bodies. Jones, Dale E., et al. 2002. Congregations and Membership in the United States 2000. Nashville, TN: Glenmary Research Center. Graphs represent county-level data
Food Environment Statistics: Number of grocery stores : 56Clackamas County :
1.49 / 10,000 pop.Oregon :
2.03 / 10,000 pop.
Number of supercenters and club stores : 10Here :
0.27 / 10,000 pop.Oregon :
0.33 / 10,000 pop.
Number of convenience stores (no gas) : 55Here :
1.47 / 10,000 pop.Oregon :
2.01 / 10,000 pop.
Number of convenience stores (with gas) : 59Clackamas County :
1.57 / 10,000 pop.State :
1.69 / 10,000 pop.
Number of full-service restaurants : 284Clackamas County :
7.57 / 10,000 pop.Oregon :
9.93 / 10,000 pop.
Adult obesity rate : This county :
25.7%State :
25.6%
Low-income preschool obesity rate : Health and Nutrition: Healthy diet rate : Oregon City:
48.9%Oregon:
49.6%
Average overall health of teeth and gums : Oregon City:
46.6%State:
46.8%
Average BMI : Oregon City:
28.7Oregon:
28.5
People feeling badly about themselves : People not drinking alcohol at all : Oregon City:
9.7%Oregon:
10.1%
Average hours sleeping at night : Oregon City:
6.8Oregon:
6.8
Overweight people : This city:
33.5%Oregon:
33.3%
General health condition : Average condition of hearing : Oregon City:
79.7%Oregon:
78.7%
More about Health and Nutrition of Oregon City, OR Residents
Local government employment and payroll (March 2022)
Function
Full-time employees
Monthly full-time payroll
Average yearly full-time wage
Part-time employees
Monthly part-time payroll
Police Protection - Officers
44 $381,091 $103,934 0 $0 Streets and Highways
21 $152,811 $87,321 5 $13,667 Parks and Recreation
19 $117,275 $74,068 40 $33,052 Financial Administration
16 $108,954 $81,716 1 $4,661 Other and Unallocable
15 $86,374 $69,099 0 $0 Other Government Administration
13 $108,741 $100,376 0 $0 Water Supply
9 $57,733 $76,977 0 $0 Sewerage
9 $53,828 $71,771 1 $2,128 Local Libraries
8 $53,265 $79,898 25 $22,530 Police - Other
7 $40,740 $69,840 1 $2,640 Judicial and Legal
4 $21,266 $63,798 4 $12,514 Solid Waste Management
1 $6,603 $79,236 0 $0 Health
1 $8,140 $97,680 0 $0 Welfare
0 $0 2 $4,828
Totals for Government
167 $1,196,821 $85,999 79 $96,020
Oregon City government finances - Expenditure in 2021 (per resident):
Construction - Regular Highways: $5,912,000 ($158.38)
Water Utilities: $2,432,000 ($65.15)Sewerage: $1,857,000 ($49.75)Police Protection: $1,583,000 ($42.41)Parks and Recreation: $603,000 ($16.15)Central Staff Services: $432,000 ($11.57)Libraries: $85,000 ($2.28)General Public Buildings: $67,000 ($1.79)General - Other: $19,000 ($0.51)Protective Inspection and Regulation - Other: $14,000 ($0.38)Current Operations - Police Protection: $10,554,000 ($282.74)
Sewerage: $9,581,000 ($256.68)Water Utilities: $5,067,000 ($135.75)Parks and Recreation: $4,103,000 ($109.92)Central Staff Services: $3,523,000 ($94.38)Regular Highways: $3,242,000 ($86.85)Protective Inspection and Regulation - Other: $2,921,000 ($78.25)Financial Administration: $2,207,000 ($59.13)General - Other: $1,925,000 ($51.57)Libraries: $1,784,000 ($47.79)Judicial and Legal Services: $1,180,000 ($31.61)Parking Facilities: $897,000 ($24.03)General Public Buildings: $735,000 ($19.69)Natural Resources - Other: $90,000 ($2.41)General - Interest on Debt: $1,645,000 ($44.07)
Other Capital Outlay - Police Protection: $302,000 ($8.09)
Parks and Recreation: $247,000 ($6.62)Regular Highways: $194,000 ($5.20)Water Utilities: $47,000 ($1.26)Central Staff Services: $21,000 ($0.56)Sewerage: $19,000 ($0.51)General Public Building: $19,000 ($0.51)Total Salaries and Wages: $15,654,000 ($419.37)
Oregon City government finances - Revenue in 2021 (per resident):
Charges - Sewerage: $14,163,000 ($379.43)
Other: $2,581,000 ($69.15)Regular Highways: $2,579,000 ($69.09)Parks and Recreation: $945,000 ($25.32)Parking Facilities: $455,000 ($12.19)Federal Intergovernmental - Other: $3,000 ($0.08)
Local Intergovernmental - Other: $3,122,000 ($83.64)
Public Welfare: $40,000 ($1.07)Miscellaneous - Interest Earnings: $1,916,000 ($51.33)
Fines and Forfeits: $1,461,000 ($39.14)General Revenue - Other: $636,000 ($17.04)Donations From Private Sources: $131,000 ($3.51)Sale of Property: $37,000 ($0.99)Revenue - Water Utilities: $8,354,000 ($223.81)
State Intergovernmental - Highways: $3,838,000 ($102.82)
General Local Government Support: $1,561,000 ($41.82)Public Welfare: $193,000 ($5.17)Other: $92,000 ($2.46)Tax - Property: $17,542,000 ($469.95)
Other License: $6,506,000 ($174.30)Public Utilities Sales: $4,429,000 ($118.65)Other: $263,000 ($7.05)Occupation and Business License - Other: $239,000 ($6.40)
Oregon City government finances - Debt in 2021 (per resident):
Long Term Debt - Beginning Outstanding - Unspecified Public Purpose: $35,494,000 ($950.89)
Outstanding Unspecified Public Purpose: $33,089,000 ($886.46)Retired Unspecified Public Purpose: $2,405,000 ($64.43)
Oregon City government finances - Cash and Securities in 2021 (per resident):
Bond Funds - Cash and Securities: $17,796,000 ($476.76)
Other Funds - Cash and Securities: $91,145,000 ($2441.80)
Sinking Funds - Cash and Securities: $2,114,000 ($56.63)
9.10% of this county's 2021 resident taxpayers lived in other counties in 2020 ($99,084 average adjusted gross income )
Here:
9.10%Oregon average:
8.20%
0.01% of residents moved from foreign countries ($71 average AGI )Clackamas County:
0.01%Oregon average:
0.01%
Top counties from which taxpayers relocated into this county between 2020 and 2021:
Businesses in Oregon City, OR
Name Count Name Count
7-Eleven 1 Little Caesars Pizza 1 AT&T 2 McDonald's 2 Albertsons 1 New Balance 1 AutoZone 1 Nike 2 Baskin-Robbins 1 Panda Express 1 Best Western 1 Payless 1 Blockbuster 1 Pizza Hut 1 Burger King 1 Quiznos 1 Carl\s Jr. 1 RadioShack 1 Cricket Wireless 1 Rite Aid 1 Curves 1 Safeway 1 Dairy Queen 1 Sears 1 Domino's Pizza 1 Starbucks 4 FedEx 3 Subaru 1 Firestone Complete Auto Care 1 Subway 2 GNC 2 Taco Bell 1 H&R Block 2 The Room Place 1 Home Depot 1 True Value 1 Jones New York 1 U-Haul 2 KFC 2 UPS 3 Kmart 1 Vons 1 Kroger 2 Walgreens 1 Lane Furniture 1 Wendy's 1
Strongest AM radio stations in Oregon City:
KPOJ (620 AM; 50 kW; PORTLAND, OR; Owner: CITICASTERS LICENSES, L.P.)
KKSN (1520 AM; 50 kW; OREGON CITY, OR; Owner: ENTERCOM PORTLAND LICENSE, LLC)
KEX (1190 AM; 50 kW; PORTLAND, OR; Owner: CITICASTERS LICENSES, L.P.)
KXL (750 AM; 50 kW; PORTLAND, OR; Owner: ROSE CITY RADIO CORPORATION)
KKSL (1290 AM; 10 kW; LAKE OSWEGO, OR; Owner: ABC, INC.)
KOTK (1080 AM; 50 kW; PORTLAND, OR; Owner: FISHER BROADCASTING - PORTLAND RADIO, L.L.C.)
KPAM (860 AM; 50 kW; TROUTDALE, OR; Owner: PAMPLIN BROADCASTING-OREGON, INC.)
KDZR (1640 AM; 10 kW; LAKE OSWEGO, OR; Owner: ABC, INC.)
KKAD (1550 AM; 50 kW; VANCOUVER, WA; Owner: PAMPLIN BROADCASTING-WASHINGTON, INC)
KKPZ (1330 AM; 5 kW; PORTLAND, OR; Owner: KPHP RADIO, INC.)
KFXX (910 AM; 10 kW; VANCOUVER, WA; Owner: ENTERCOM PORTLAND LICENSE, LLC (DE))
KBNP (1410 AM; 5 kW; PORTLAND, OR; Owner: KBNP RADIO, INC.)
KUPL (970 AM; 5 kW; PORTLAND, OR; Owner: INFINITY RADIO OPERATIONS INC.)
Strongest FM radio stations in Oregon City:
K242AF (96.3 FM; PORTLAND, OR; Owner: EDUCATIONAL MEDIA FOUNDATION)
KNRK (94.7 FM; CAMAS, WA; Owner: ENTERCOM PORTLAND LICENSE, LLC (DE))
KGON (92.3 FM; PORTLAND, OR; Owner: ENTERCOM PORTLAND LICENSE, LLC (DE))
KKSN-FM (97.1 FM; PORTLAND, OR; Owner: ENTERCOM PORTLAND LICENSE, LLC (DE))
KXJM (95.5 FM; PORTLAND, OR; Owner: ROSE CITY RADIO CORPORATION)
KBOO (90.7 FM; PORTLAND, OR; Owner: THE KBOO FOUNDATION)
KWJJ-FM (99.5 FM; PORTLAND, OR; Owner: FISHER BROADCASTING - PORTLAND RADIO, L.L.C.)
KFIS (104.1 FM; SCAPPOOSE, OR; Owner: CARON BROADCASTING, INC.)
K274AR (102.7 FM; GRESHAM, OR; Owner: EDUCATIONAL MEDIA FOUNDATION)
KRRC (104.1 FM; PORTLAND, OR; Owner: THE REED INSTITUTE)
KINK (101.9 FM; PORTLAND, OR; Owner: INFINITY RADIO OPERATIONS INC.)
KKCW (103.3 FM; BEAVERTON, OR; Owner: CITICASTERS LICENSES, L.P.)
KOPB-FM (91.5 FM; PORTLAND, OR; Owner: OREGON PUBLIC BROADCASTING)
KUFO-FM (101.1 FM; PORTLAND, OR; Owner: INFINITY RADIO OPERATIONS INC.)
KPDQ-FM (93.7 FM; PORTLAND, OR; Owner: SALEM MEDIA OF OREGON, INC.)
KMHD (89.1 FM; GRESHAM, OR; Owner: MT. HOOD COMMUNITY COLLEGE DISTRICT)
KVMX (107.5 FM; BANKS, OR; Owner: INFINITY RADIO OPERATIONS INC.)
KLTH (106.7 FM; LAKE OSWEGO, OR; Owner: INIFINITY RADIO OF PORTLAND INC.)
KUPL-FM (98.7 FM; PORTLAND, OR; Owner: INFINITY RADIO OF PORTLAND INC.)
KKRZ (100.3 FM; PORTLAND, OR; Owner: CITICASTERS LICENSES, L.P.)
TV broadcast stations around Oregon City:
KATU (Channel 2; PORTLAND, OR; Owner: FISHER BROADCASTING - PORTLAND TV, L.L.C.)
KPDX (Channel 49; VANCOUVER, WA; Owner: MEREDITH CORPORATION)
KPTV (Channel 12; PORTLAND, OR; Owner: MEREDITH CORPORATION)
KOIN (Channel 6; PORTLAND, OR; Owner: EMMIS TELEVISION LICENSE CORPORATION)
KNMT (Channel 24; PORTLAND, OR; Owner: NATIONAL MINORITY T.V., INC.)
K57IF (Channel 57; SALEM, OR; Owner: LaGRANDE BROADCASTING, INC.)
KGW (Channel 8; PORTLAND, OR; Owner: KING BROADCASTING COMPANY)
KOPB-TV (Channel 10; PORTLAND, OR; Owner: OREGON PUBLIC BROADCASTING)
KPXG-LP (Channel 54; PORTLAND, OR; Owner: PAXSON COMMUNICATIONS LICENSE COMPANY, LLC)
KWBP-LP (Channel 4; PORTLAND, OR; Owner: TRIBUNE BROADCASTING HOLDINGS, INC.)
K14HN (Channel 14; VANCOUVER/CAMAS, WA; Owner: MEREDITH CORPORATION)
KPXG (Channel 22; SALEM, OR; Owner: PAXSON SALEM LICENSE, INC.)
KWBP (Channel 32; SALEM, OR; Owner: TRIBUNE BROADCAST HOLDINGS, INC.)
K58CO (Channel 58; PORTLAND, OR; Owner: NORTHWEST CHRISTIAN BROADCASTING)
K18EL (Channel 18; NEWBERG/TIGARD, OR; Owner: MEREDITH CORPORATION)
K16CB (Channel 16; HAPPY VALLEY, OR; Owner: MEREDITH CORPORATION)
KKEI-CA (Channel 56; PORTLAND, OR; Owner: WATCHTV, INC.)
KORK-CA (Channel 35; PORTLAND, OR; Owner: WATCHTV, INC.)
Medal of Honor Recipients
Medal of Honor Recipient born in Oregon City: Larry G. Dahl.
National Bridge Inventory (NBI) Statistics 26 Number of bridges433ft / 132m Total length $14,124,000 Total costs1,010,405 Total average daily traffic83,626 Total average daily truck traffic
New bridges - historical statistics
2 1920-1929 2 1930-1939 3 1940-1949 2 1950-1959 2 1960-1969 7 1970-1979 4 1980-1989 2 1990-1999 2 2000-2009
See full National Bridge Inventory statistics for Oregon City, OR
Home Mortgage Disclosure Act Aggregated Statistics For Year 2009(Based on 6 partial tracts) A) FHA, FSA/RHS & VA B) Conventional C) Refinancings D) Home Improvement Loans E) Loans on Dwellings For 5+ Families F) Non-occupant Loans on G) Loans On Manufactured Number Average Value Number Average Value Number Average Value Number Average Value Number Average Value Number Average Value Number Average Value
LOANS ORIGINATED 102 $225,303 73 $197,495 522 $208,619 25 $103,906 4 $541,628 22 $171,882 5 $121,508 APPLICATIONS APPROVED, NOT ACCEPTED 8 $240,506 8 $205,791 68 $213,422 1 $68,350 0 $0 5 $172,220 1 $53,710 APPLICATIONS DENIED 19 $219,985 16 $173,536 155 $220,258 10 $97,343 0 $0 10 $158,585 5 $47,026 APPLICATIONS WITHDRAWN 10 $214,033 10 $215,714 107 $236,567 5 $169,160 1 $407,300 7 $221,374 2 $134,340 FILES CLOSED FOR INCOMPLETENESS 0 $0 3 $357,457 21 $224,649 2 $103,700 0 $0 4 $197,780 0 $0
Aggregated Statistics For Year 2008(Based on 6 partial tracts) A) FHA, FSA/RHS & VA B) Conventional C) Refinancings D) Home Improvement Loans E) Loans on Dwellings For 5+ Families F) Non-occupant Loans on G) Loans On Manufactured Number Average Value Number Average Value Number Average Value Number Average Value Number Average Value Number Average Value Number Average Value
LOANS ORIGINATED 51 $247,091 137 $229,663 331 $217,052 33 $95,496 2 $3,161,650 38 $182,210 9 $130,163 APPLICATIONS APPROVED, NOT ACCEPTED 4 $235,920 20 $233,374 58 $222,262 5 $122,282 0 $0 5 $183,454 2 $139,495 APPLICATIONS DENIED 13 $255,408 38 $228,335 184 $233,832 29 $92,569 0 $0 17 $169,110 5 $56,654 APPLICATIONS WITHDRAWN 4 $287,042 11 $269,184 87 $241,794 12 $173,810 0 $0 3 $178,500 0 $0 FILES CLOSED FOR INCOMPLETENESS 2 $227,270 4 $203,538 16 $241,878 4 $146,675 0 $0 1 $324,550 0 $0
Aggregated Statistics For Year 2007(Based on 6 partial tracts) A) FHA, FSA/RHS & VA B) Conventional C) Refinancings D) Home Improvement Loans E) Loans on Dwellings For 5+ Families F) Non-occupant Loans on G) Loans On Manufactured Number Average Value Number Average Value Number Average Value Number Average Value Number Average Value Number Average Value Number Average Value
LOANS ORIGINATED 13 $247,402 339 $195,144 479 $200,698 59 $107,294 7 $1,368,940 81 $178,131 7 $90,346 APPLICATIONS APPROVED, NOT ACCEPTED 1 $279,560 49 $195,390 103 $211,448 13 $116,534 0 $0 16 $212,033 3 $115,133 APPLICATIONS DENIED 1 $263,460 76 $194,919 231 $220,286 42 $104,176 1 $1,291,650 27 $198,475 9 $47,008 APPLICATIONS WITHDRAWN 0 $0 39 $194,721 106 $214,347 12 $126,930 0 $0 17 $195,858 2 $198,450 FILES CLOSED FOR INCOMPLETENESS 0 $0 11 $231,339 31 $217,289 2 $119,520 0 $0 4 $171,822 0 $0
Aggregated Statistics For Year 2006(Based on 6 partial tracts) A) FHA, FSA/RHS & VA B) Conventional C) Refinancings D) Home Improvement Loans E) Loans on Dwellings For 5+ Families F) Non-occupant Loans on G) Loans On Manufactured Number Average Value Number Average Value Number Average Value Number Average Value Number Average Value Number Average Value Number Average Value
LOANS ORIGINATED 8 $202,318 489 $164,573 567 $170,631 59 $67,825 8 $897,068 101 $150,185 10 $121,629 APPLICATIONS APPROVED, NOT ACCEPTED 1 $208,010 85 $150,371 113 $169,621 8 $69,414 0 $0 17 $145,474 3 $70,293 APPLICATIONS DENIED 5 $171,932 95 $159,803 223 $172,468 40 $110,438 0 $0 25 $156,537 7 $69,447 APPLICATIONS WITHDRAWN 1 $296,640 57 $155,829 150 $178,681 5 $151,002 1 $913,890 15 $148,020 0 $0 FILES CLOSED FOR INCOMPLETENESS 1 $187,240 13 $160,182 40 $217,052 4 $59,790 0 $0 3 $136,167 0 $0
Aggregated Statistics For Year 2005(Based on 6 partial tracts) A) FHA, FSA/RHS & VA B) Conventional C) Refinancings D) Home Improvement Loans E) Loans on Dwellings For 5+ Families F) Non-occupant Loans on G) Loans On Manufactured Number Average Value Number Average Value Number Average Value Number Average Value Number Average Value Number Average Value Number Average Value
LOANS ORIGINATED 17 $203,176 670 $142,582 669 $152,828 49 $83,525 7 $1,139,799 136 $131,976 8 $111,362 APPLICATIONS APPROVED, NOT ACCEPTED 3 $180,737 105 $121,351 121 $145,274 7 $79,803 0 $0 16 $142,556 5 $65,836 APPLICATIONS DENIED 2 $230,315 102 $131,755 249 $160,662 42 $74,607 1 $151,570 24 $143,735 13 $67,824 APPLICATIONS WITHDRAWN 1 $149,790 110 $134,327 225 $167,557 21 $162,507 0 $0 19 $154,009 1 $149,090 FILES CLOSED FOR INCOMPLETENESS 1 $175,860 11 $128,915 72 $184,976 2 $46,430 0 $0 1 $151,120 0 $0
Aggregated Statistics For Year 2004(Based on 6 partial tracts) A) FHA, FSA/RHS & VA B) Conventional C) Refinancings D) Home Improvement Loans E) Loans on Dwellings For 5+ Families F) Non-occupant Loans on G) Loans On Manufactured Number Average Value Number Average Value Number Average Value Number Average Value Number Average Value Number Average Value Number Average Value
LOANS ORIGINATED 23 $160,887 423 $140,032 557 $147,874 31 $78,947 7 $1,416,367 86 $131,889 7 $133,096 APPLICATIONS APPROVED, NOT ACCEPTED 2 $201,055 69 $118,026 107 $148,193 9 $49,472 0 $0 12 $153,462 7 $56,294 APPLICATIONS DENIED 5 $154,988 98 $115,891 224 $150,102 26 $72,923 0 $0 27 $132,363 17 $66,064 APPLICATIONS WITHDRAWN 4 $140,610 37 $133,258 161 $148,725 11 $82,880 0 $0 14 $149,106 1 $268,420 FILES CLOSED FOR INCOMPLETENESS 1 $109,370 10 $118,055 33 $148,171 1 $77,500 0 $0 4 $103,692 0 $0
Aggregated Statistics For Year 2003(Based on 6 partial tracts) A) FHA, FSA/RHS & VA B) Conventional C) Refinancings D) Home Improvement Loans E) Loans on Dwellings For 5+ Families F) Non-occupant Loans on Number Average Value Number Average Value Number Average Value Number Average Value Number Average Value Number Average Value
LOANS ORIGINATED 67 $154,627 373 $131,827 1,189 $136,727 45 $27,796 2 $344,555 122 $117,955 APPLICATIONS APPROVED, NOT ACCEPTED 2 $132,485 49 $123,407 180 $142,113 8 $19,855 0 $0 19 $149,619 APPLICATIONS DENIED 8 $131,830 56 $113,408 254 $136,216 34 $25,696 0 $0 25 $139,413 APPLICATIONS WITHDRAWN 4 $156,198 32 $158,827 184 $140,742 8 $23,295 0 $0 18 $182,809 FILES CLOSED FOR INCOMPLETENESS 2 $164,525 8 $112,795 26 $140,142 2 $28,650 0 $0 4 $149,008
Aggregated Statistics For Year 2002(Based on 3 partial tracts) A) FHA, FSA/RHS & VA B) Conventional C) Refinancings D) Home Improvement Loans E) Loans on Dwellings For 5+ Families F) Non-occupant Loans on Number Average Value Number Average Value Number Average Value Number Average Value Number Average Value Number Average Value
LOANS ORIGINATED 53 $148,674 174 $119,968 428 $129,342 28 $22,725 4 $557,882 69 $110,756 APPLICATIONS APPROVED, NOT ACCEPTED 1 $105,920 23 $109,161 65 $128,814 4 $19,970 0 $0 6 $141,825 APPLICATIONS DENIED 5 $142,396 42 $78,025 100 $126,695 20 $12,088 0 $0 18 $98,800 APPLICATIONS WITHDRAWN 2 $166,975 16 $139,153 109 $140,353 5 $19,396 0 $0 8 $126,412 FILES CLOSED FOR INCOMPLETENESS 3 $128,883 4 $91,358 21 $135,048 1 $3,570 0 $0 1 $99,860
Aggregated Statistics For Year 2001(Based on 3 partial tracts) A) FHA, FSA/RHS & VA B) Conventional C) Refinancings D) Home Improvement Loans E) Loans on Dwellings For 5+ Families F) Non-occupant Loans on Number Average Value Number Average Value Number Average Value Number Average Value Number Average Value Number Average Value
LOANS ORIGINATED 63 $136,532 146 $118,239 356 $129,320 32 $25,080 3 $1,208,983 54 $105,870 APPLICATIONS APPROVED, NOT ACCEPTED 4 $112,470 17 $124,027 51 $120,376 2 $40,910 0 $0 5 $109,804 APPLICATIONS DENIED 2 $105,145 43 $101,957 115 $112,374 27 $26,635 2 $435,715 10 $165,971 APPLICATIONS WITHDRAWN 4 $123,888 13 $107,970 87 $116,351 7 $44,071 1 $435,720 5 $111,834 FILES CLOSED FOR INCOMPLETENESS 0 $0 5 $85,164 22 $115,739 2 $78,340 0 $0 0 $0
Aggregated Statistics For Year 2000(Based on 3 partial tracts) A) FHA, FSA/RHS & VA B) Conventional C) Refinancings D) Home Improvement Loans F) Non-occupant Loans on Number Average Value Number Average Value Number Average Value Number Average Value Number Average Value
LOANS ORIGINATED 53 $139,062 181 $115,910 117 $102,090 41 $24,179 34 $103,367 APPLICATIONS APPROVED, NOT ACCEPTED 5 $121,356 29 $112,320 30 $95,954 8 $34,309 7 $109,403 APPLICATIONS DENIED 7 $140,223 34 $83,133 67 $116,579 28 $22,365 4 $190,015 APPLICATIONS WITHDRAWN 6 $101,187 21 $120,103 40 $91,791 6 $50,567 1 $77,500 FILES CLOSED FOR INCOMPLETENESS 0 $0 4 $113,722 17 $105,523 3 $24,550 1 $89,160
Aggregated Statistics For Year 1999(Based on 5 partial tracts) A) FHA, FSA/RHS & VA B) Conventional C) Refinancings D) Home Improvement Loans E) Loans on Dwellings For 5+ Families F) Non-occupant Loans on Number Average Value Number Average Value Number Average Value Number Average Value Number Average Value Number Average Value
LOANS ORIGINATED 61 $144,163 254 $125,406 331 $113,669 50 $21,613 3 $593,647 53 $109,921 APPLICATIONS APPROVED, NOT ACCEPTED 5 $134,182 34 $111,859 59 $102,455 14 $22,331 0 $0 4 $111,095 APPLICATIONS DENIED 7 $100,509 76 $102,097 154 $108,501 32 $25,487 3 $341,120 18 $121,441 APPLICATIONS WITHDRAWN 8 $127,230 34 $120,112 63 $120,144 9 $78,452 1 $65,480 7 $122,350 FILES CLOSED FOR INCOMPLETENESS 0 $0 11 $120,720 36 $110,821 2 $16,915 0 $0 4 $116,240
Detailed HMDA statistics for the following Tracts:
0223.00
, 0224.00 , 0225.00 , 0226.01 , 0226.02
Private Mortgage Insurance Companies Aggregated Statistics For Year 2009(Based on 6 partial tracts) A) Conventional B) Refinancings C) Non-occupant Loans on Number Average Value Number Average Value Number Average Value
LOANS ORIGINATED 11 $225,125 12 $233,057 0 $0 APPLICATIONS APPROVED, NOT ACCEPTED 5 $332,148 6 $277,762 0 $0 APPLICATIONS DENIED 1 $210,420 4 $225,748 0 $0 APPLICATIONS WITHDRAWN 1 $325,250 1 $174,140 0 $0 FILES CLOSED FOR INCOMPLETENESS 1 $232,500 1 $223,890 1 $232,500
Aggregated Statistics For Year 2008(Based on 6 partial tracts) A) Conventional B) Refinancings C) Non-occupant Loans on Number Average Value Number Average Value Number Average Value
LOANS ORIGINATED 49 $270,574 40 $270,731 5 $289,840 APPLICATIONS APPROVED, NOT ACCEPTED 20 $268,230 13 $271,943 1 $180,990 APPLICATIONS DENIED 6 $249,752 3 $301,380 3 $288,473 APPLICATIONS WITHDRAWN 1 $256,660 4 $189,570 0 $0 FILES CLOSED FOR INCOMPLETENESS 2 $275,310 1 $160,490 0 $0
Aggregated Statistics For Year 2007(Based on 6 partial tracts) A) Conventional B) Refinancings C) Non-occupant Loans on Number Average Value Number Average Value Number Average Value
LOANS ORIGINATED 71 $249,493 28 $262,675 4 $247,925 APPLICATIONS APPROVED, NOT ACCEPTED 8 $257,312 11 $289,902 0 $0 APPLICATIONS DENIED 0 $0 0 $0 0 $0 APPLICATIONS WITHDRAWN 6 $292,598 1 $347,900 0 $0 FILES CLOSED FOR INCOMPLETENESS 0 $0 0 $0 0 $0
Aggregated Statistics For Year 2006(Based on 6 partial tracts) A) Conventional B) Refinancings D) Loans On Manufactured Number Average Value Number Average Value Number Average Value
LOANS ORIGINATED 25 $230,655 12 $209,023 1 $151,550 APPLICATIONS APPROVED, NOT ACCEPTED 3 $258,497 9 $215,147 0 $0 APPLICATIONS DENIED 0 $0 0 $0 0 $0 APPLICATIONS WITHDRAWN 2 $253,510 6 $212,962 0 $0 FILES CLOSED FOR INCOMPLETENESS 0 $0 0 $0 0 $0
Aggregated Statistics For Year 2005(Based on 6 partial tracts) A) Conventional B) Refinancings C) Non-occupant Loans on Number Average Value Number Average Value Number Average Value
LOANS ORIGINATED 25 $204,480 19 $211,546 1 $173,280 APPLICATIONS APPROVED, NOT ACCEPTED 7 $209,909 6 $215,403 1 $188,040 APPLICATIONS DENIED 0 $0 0 $0 0 $0 APPLICATIONS WITHDRAWN 2 $230,930 3 $169,577 0 $0 FILES CLOSED FOR INCOMPLETENESS 0 $0 0 $0 0 $0
Aggregated Statistics For Year 2004(Based on 6 partial tracts) A) Conventional B) Refinancings C) Non-occupant Loans on D) Loans On Manufactured Number Average Value Number Average Value Number Average Value Number Average Value
LOANS ORIGINATED 43 $185,180 38 $175,267 3 $134,320 2 $118,700 APPLICATIONS APPROVED, NOT ACCEPTED 9 $170,339 9 $170,679 1 $92,510 0 $0 APPLICATIONS DENIED 0 $0 0 $0 0 $0 0 $0 APPLICATIONS WITHDRAWN 2 $151,530 3 $163,037 2 $123,885 0 $0 FILES CLOSED FOR INCOMPLETENESS 1 $132,850 0 $0 0 $0 0 $0
Aggregated Statistics For Year 2003(Based on 6 partial tracts) A) Conventional B) Refinancings C) Non-occupant Loans on Number Average Value Number Average Value Number Average Value
LOANS ORIGINATED 55 $166,913 101 $165,985 7 $139,667 APPLICATIONS APPROVED, NOT ACCEPTED 10 $138,349 28 $153,796 0 $0 APPLICATIONS DENIED 1 $156,060 0 $0 0 $0 APPLICATIONS WITHDRAWN 1 $194,800 5 $171,200 1 $153,710 FILES CLOSED FOR INCOMPLETENESS 0 $0 0 $0 0 $0
Aggregated Statistics For Year 2002(Based on 3 partial tracts) A) Conventional B) Refinancings C) Non-occupant Loans on Number Average Value Number Average Value Number Average Value
LOANS ORIGINATED 40 $157,588 40 $149,690 11 $126,504 APPLICATIONS APPROVED, NOT ACCEPTED 5 $142,070 14 $155,472 1 $77,500 APPLICATIONS DENIED 0 $0 2 $168,380 1 $178,320 APPLICATIONS WITHDRAWN 0 $0 1 $157,580 0 $0 FILES CLOSED FOR INCOMPLETENESS 0 $0 1 $90,420 0 $0
Aggregated Statistics For Year 2001(Based on 3 partial tracts) A) Conventional B) Refinancings C) Non-occupant Loans on Number Average Value Number Average Value Number Average Value
LOANS ORIGINATED 34 $147,854 38 $153,658 0 $0 APPLICATIONS APPROVED, NOT ACCEPTED 7 $144,967 13 $155,685 1 $219,330 APPLICATIONS DENIED 1 $110,080 3 $188,073 0 $0 APPLICATIONS WITHDRAWN 0 $0 3 $128,157 0 $0 FILES CLOSED FOR INCOMPLETENESS 2 $97,185 0 $0 0 $0
Aggregated Statistics For Year 2000(Based on 3 partial tracts) A) Conventional B) Refinancings C) Non-occupant Loans on Number Average Value Number Average Value Number Average Value
LOANS ORIGINATED 52 $132,074 10 $136,376 6 $113,282 APPLICATIONS APPROVED, NOT ACCEPTED 4 $129,890 2 $100,530 1 $111,940 APPLICATIONS DENIED 2 $115,260 3 $130,147 0 $0 APPLICATIONS WITHDRAWN 2 $120,920 1 $112,800 0 $0 FILES CLOSED FOR INCOMPLETENESS 0 $0 0 $0 0 $0
Aggregated Statistics For Year 1999(Based on 5 partial tracts) A) Conventional B) Refinancings C) Non-occupant Loans on Number Average Value Number Average Value Number Average Value
LOANS ORIGINATED 94 $153,226 33 $148,639 1 $173,470 APPLICATIONS APPROVED, NOT ACCEPTED 7 $143,101 8 $132,746 0 $0 APPLICATIONS DENIED 5 $167,904 2 $153,610 1 $112,550 APPLICATIONS WITHDRAWN 2 $154,225 1 $110,430 1 $122,480 FILES CLOSED FOR INCOMPLETENESS 3 $148,387 1 $240,260 1 $96,000
Detailed PMIC statistics for the following Tracts:
0223.00
, 0224.00 , 0225.00 , 0226.01 , 0226.02 Fire-safe hotels and motels in Oregon City, Oregon:
Rivershore Hotel, 1900 Clackamette Dr, Oregon City, Oregon 97045 Phone: (503) 655-7141, Fax: (503) 655-1927
Quality Inn, 11460 SW Pacific Hwy, Oregon city, Oregon 97045 Phone: (503) 245-6421, Fax: (503) 245-6421
All 2 fire-safe hotels and motels in Oregon City, Oregon
Most common first names in Oregon City, OR among deceased individuals Name Count Lived (average)
William 187 75.7 years John 181 73.6 years Mary 172 79.6 years Robert 164 70.7 years James 159 71.0 years Charles 115 75.6 years Dorothy 100 77.8 years Helen 92 79.7 years George 90 76.5 years Richard 89 68.9 years
Most common last names in Oregon City, OR among deceased individuals Last name Count Lived (average)
Smith 115 71.0 years Johnson 90 76.6 years Miller 54 76.4 years Brown 45 76.5 years Jones 38 77.6 years Williams 36 76.0 years Wilson 33 75.9 years Anderson 33 75.2 years Moore 31 74.4 years Morris 30 72.9 years
Oregon City compared to Oregon state average:
Unemployed percentage below state average. Hispanic race population percentage below state average. Length of stay since moving in above state average.
Top Patent Applicants
Jeffrey C. Pisciotta (13)
Paul H. Stasiewicz (8)
Neil H.a. Boyette (6)
Wes Duey (6)
Evan Waymire (6)
Thomas J. Schneider (5)
Brian C. Stewart (5)
Brian W. Baird (5)
Northon Rodrigues (5)
Kirsti A. Golgotiu (5)
Total of 289 patent applications in 2008-2024.
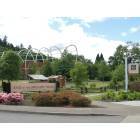
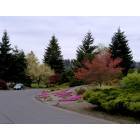
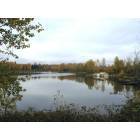


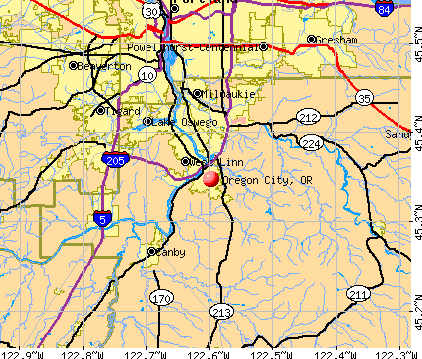


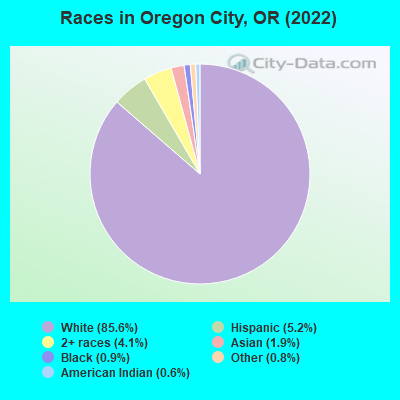
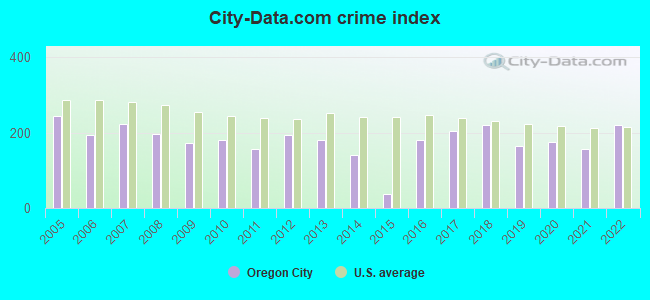
 Recent articles from our blog. Our writers, many of them Ph.D. graduates or candidates, create easy-to-read articles on a wide variety of topics.


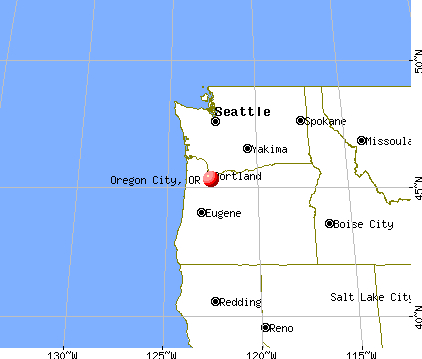
 , pop. 224,220).
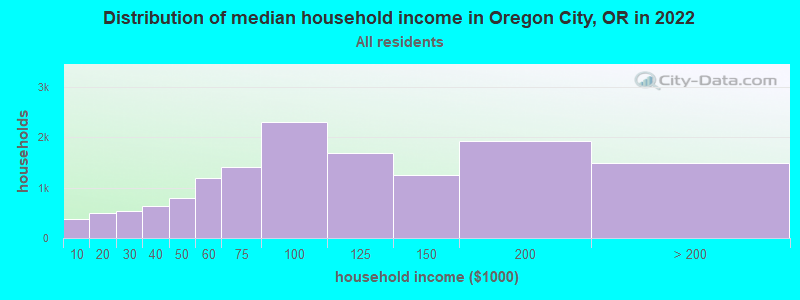
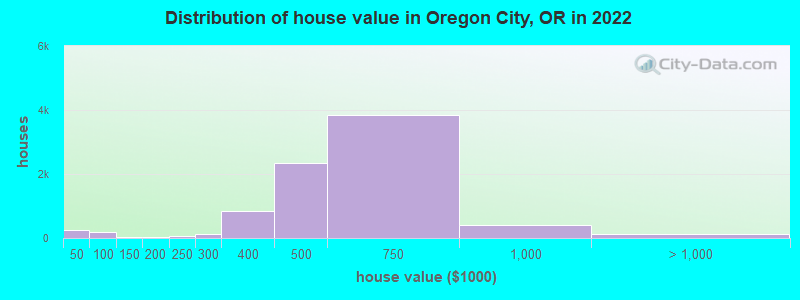
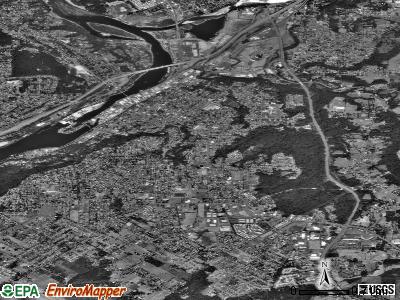
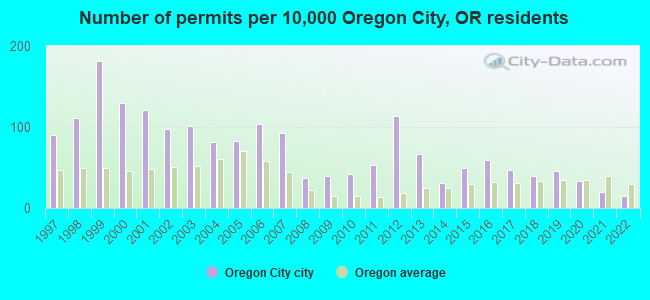
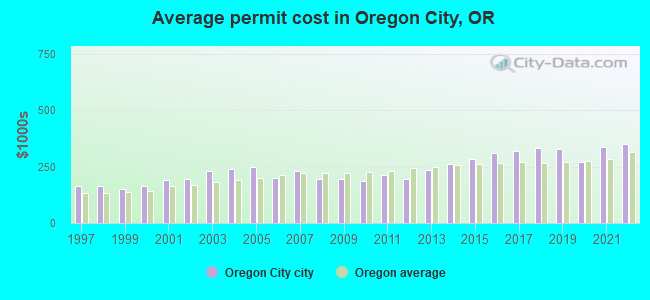
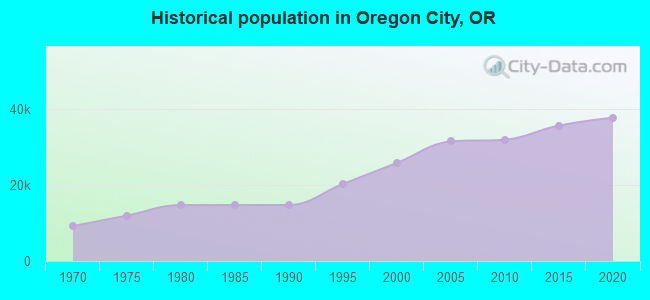
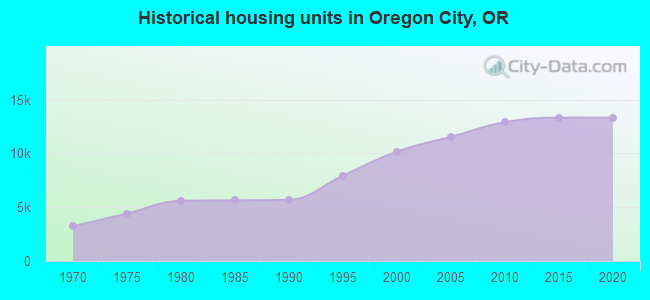
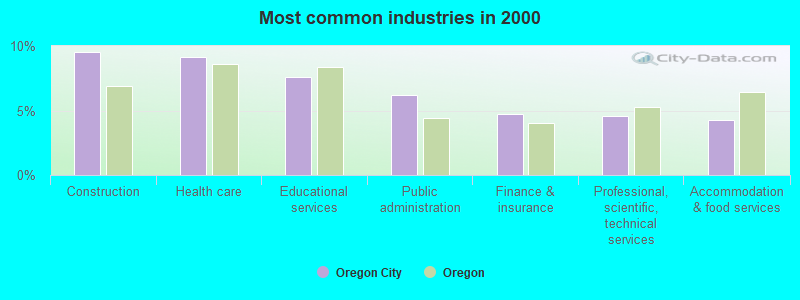
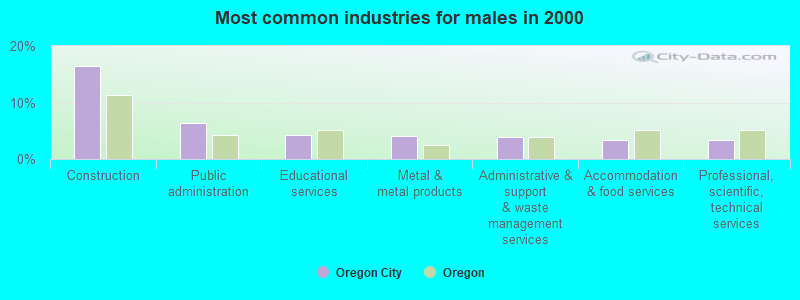
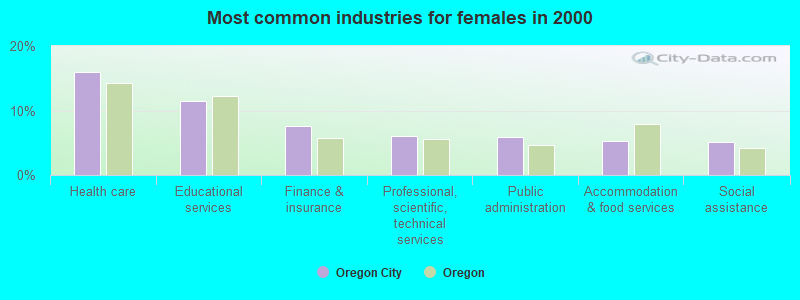
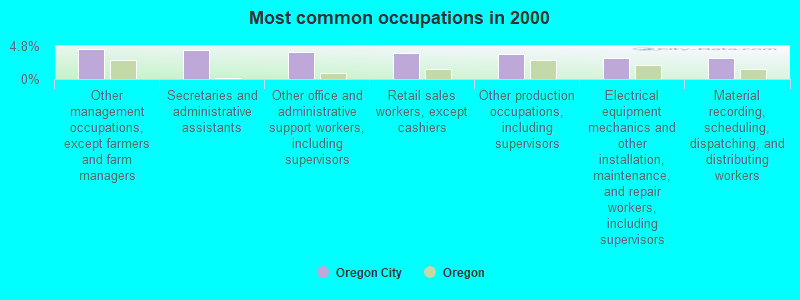
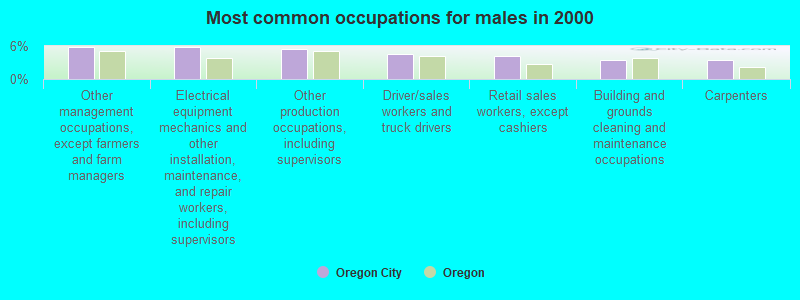
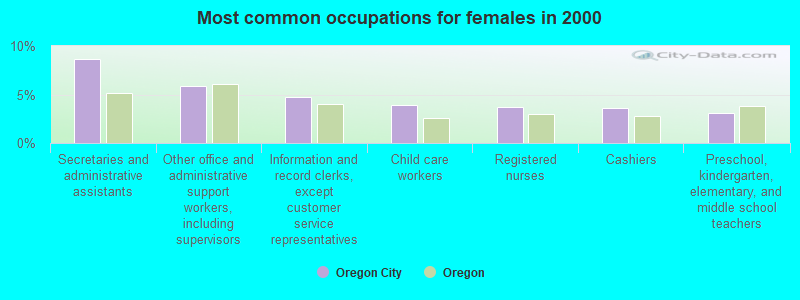
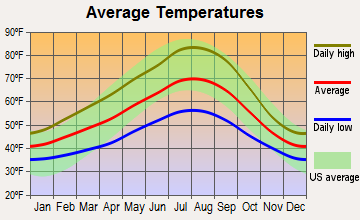
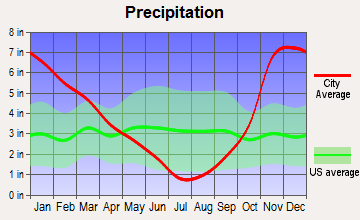
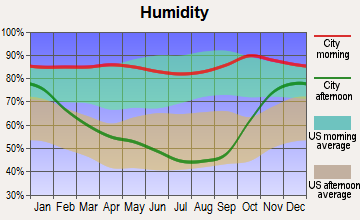

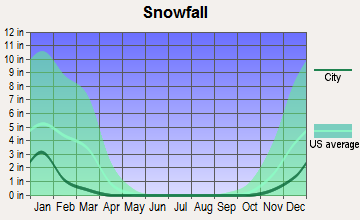
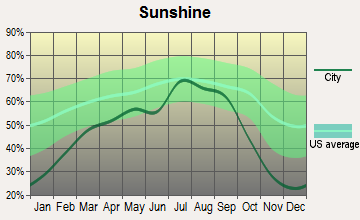
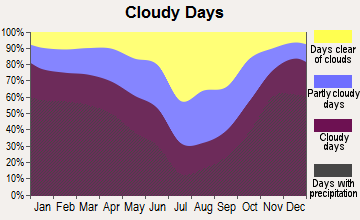
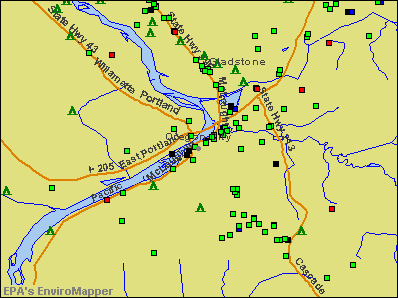

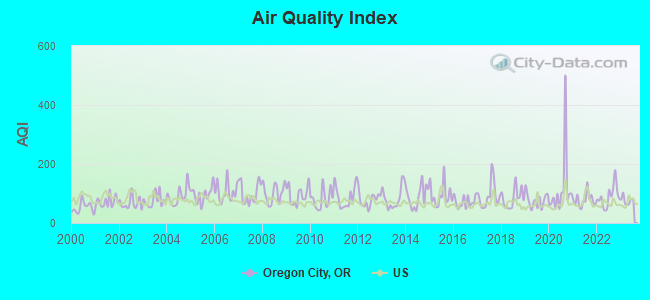
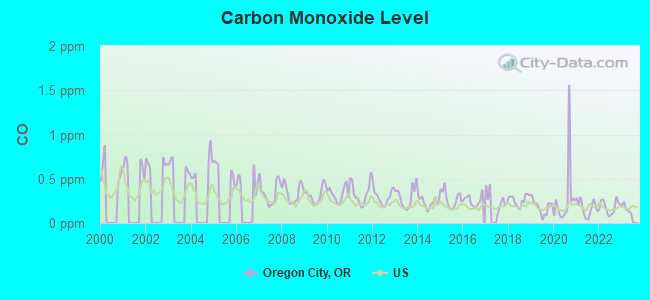
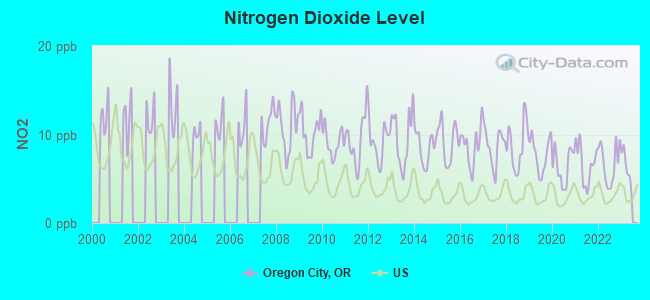
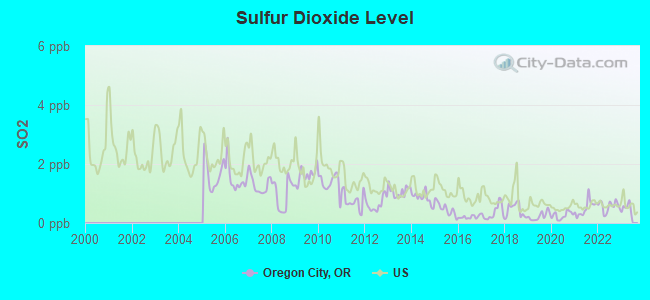
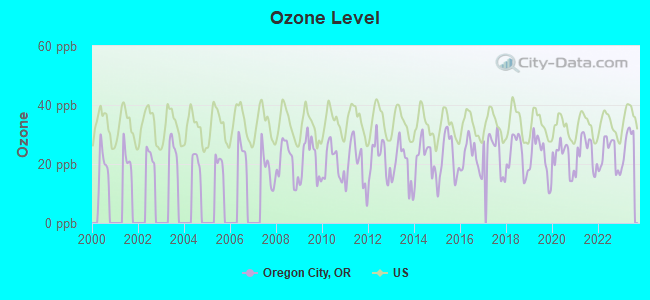
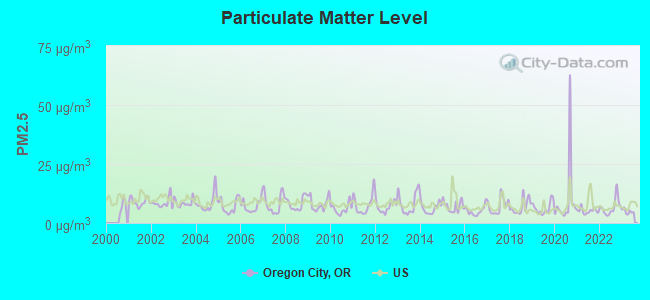
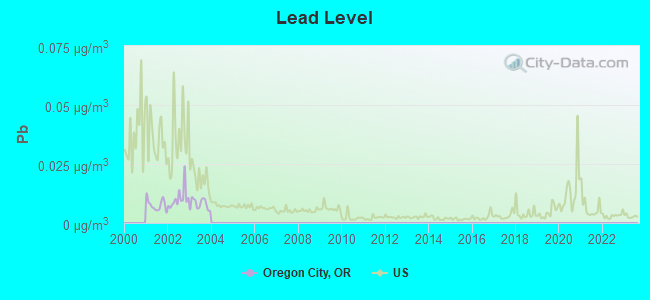
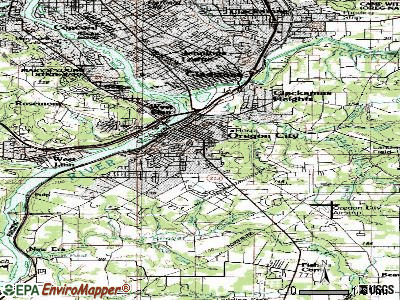
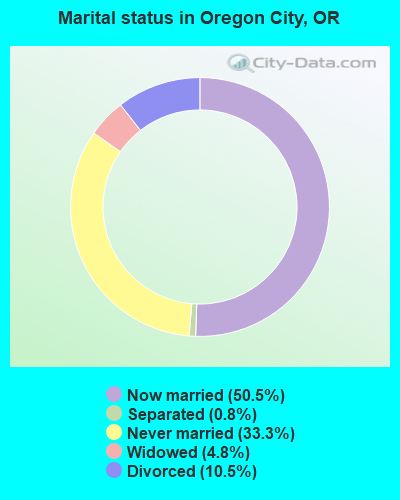
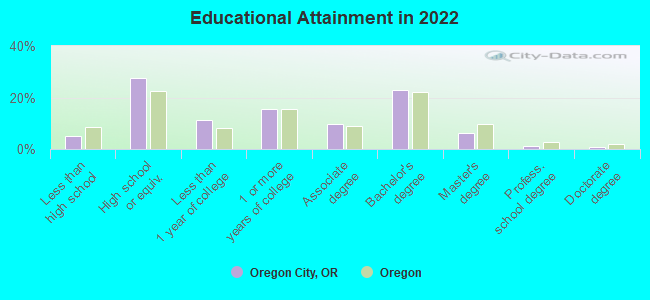
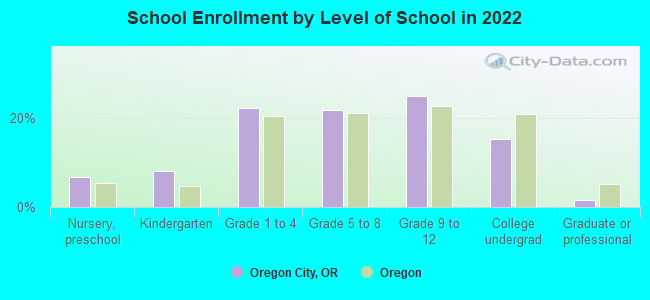
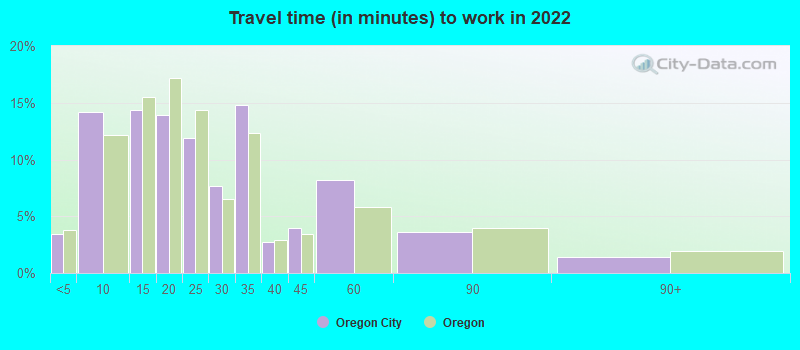
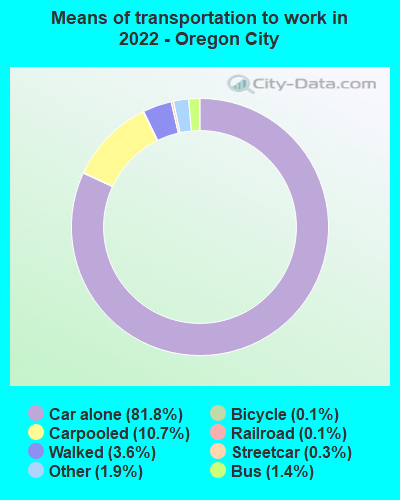
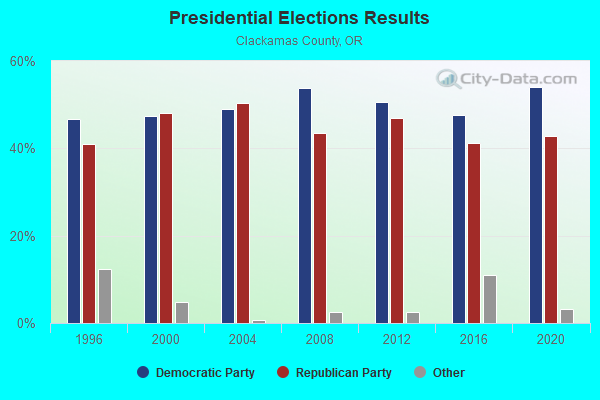
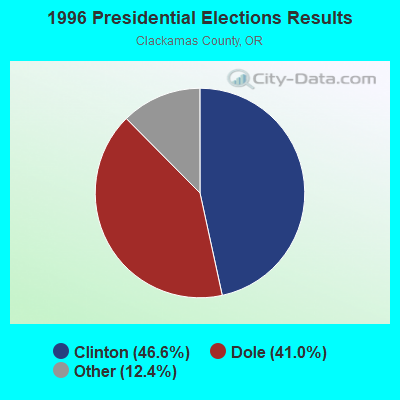
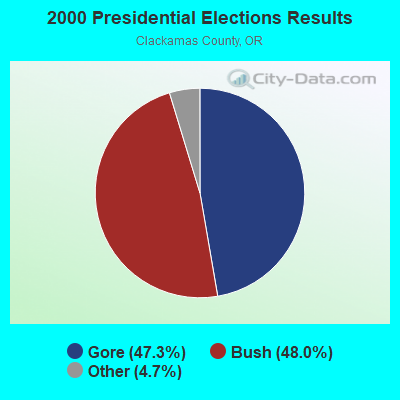
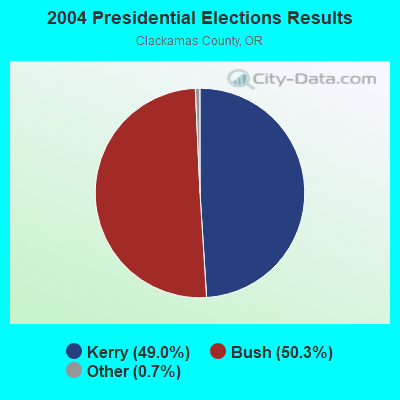

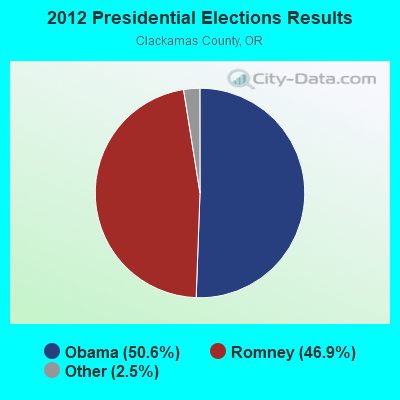
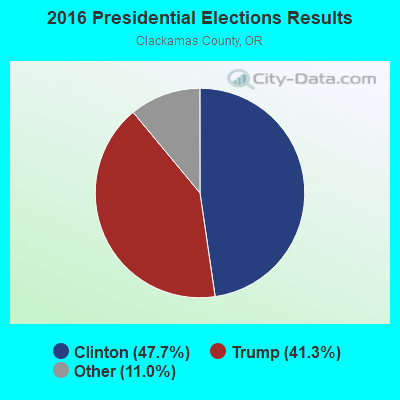
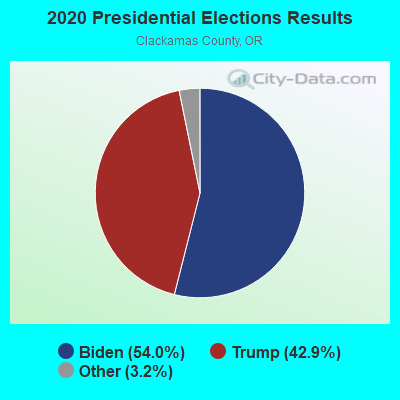
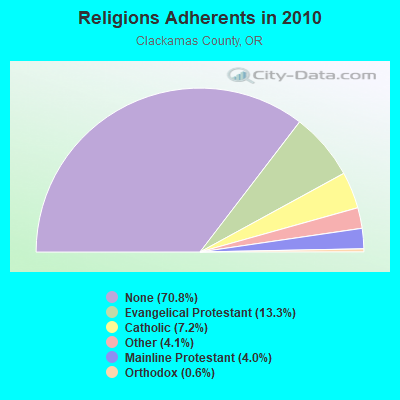
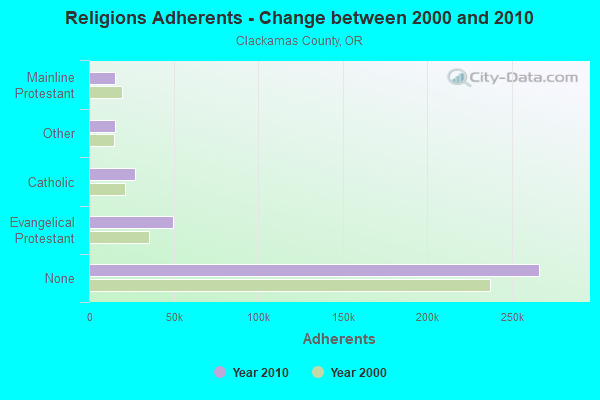
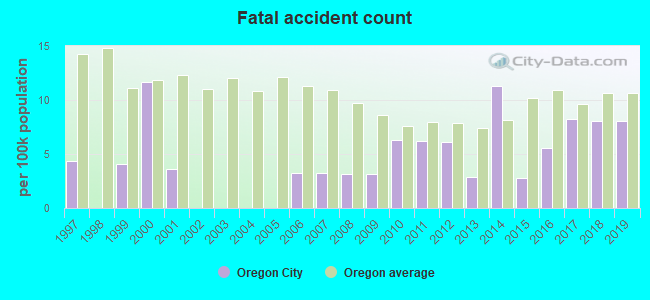
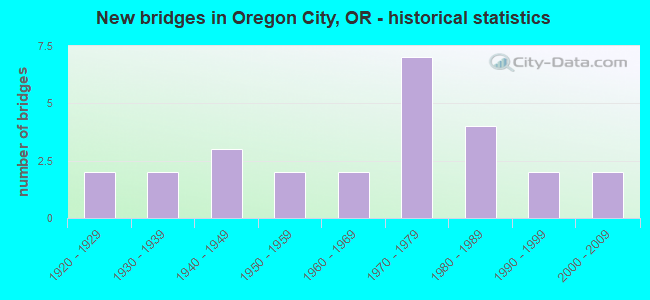
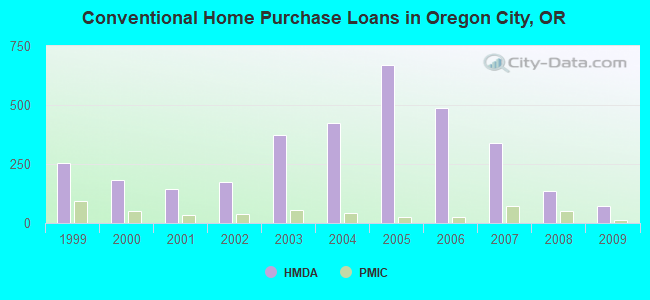
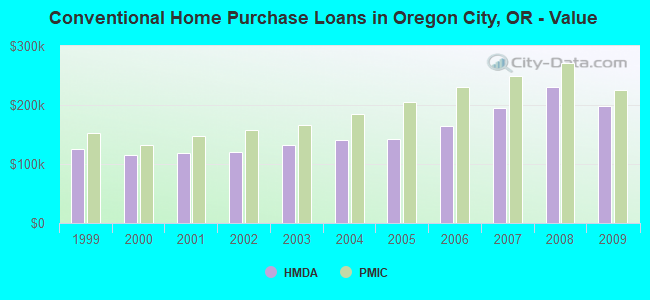
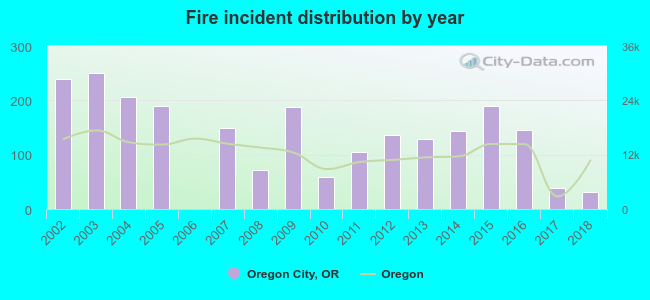 Based on the data from the years 2002 - 2018 the average number of fires per year is 134. The highest number of fire incidents - 250 took place in 2003, and the least - 0 in 2006. The data has a dropping trend.
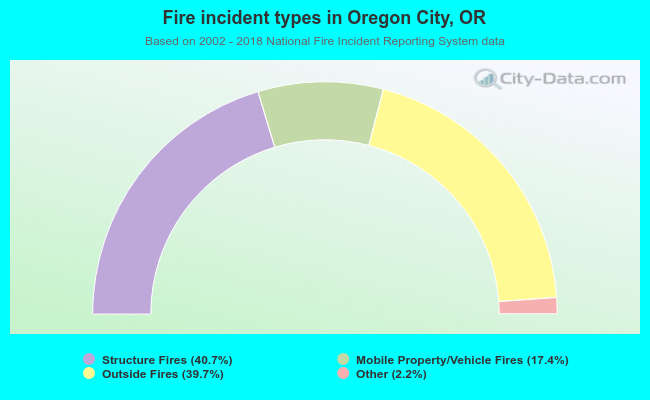 When looking into fire subcategories, the most reports belonged to: Structure Fires (40.7%), and Outside Fires (39.7%).