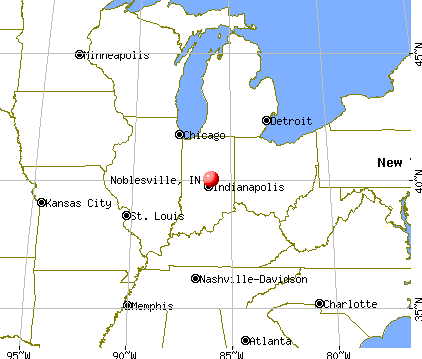
Noblesville, Indiana
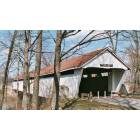
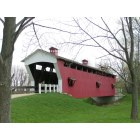
Noblesville: Potters Bridge Noblesville, Indiana
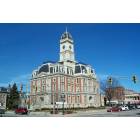
Noblesville: Hamilton County Court House Noblesville, Indiana

Noblesville: Noblesvile, Indiana's Morse Reservour Dam. The reservour services Hamilton County and other surrounding counties year round!

Noblesville: Noblesvile, Indiana's Morse Reservour is great place to boat, fish and swim! Just ask the geese!
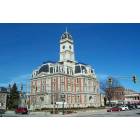
Noblesville: Hamilton County Court House Noblesville, Indiana

Noblesville: Noblesville from the air.

Noblesville: Potter's Bridge & White River in the Summer

Noblesville: Potter's Bridge & White River in the Fall
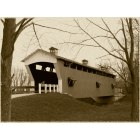
Noblesville: Covered bridge at Conner Prairie
Noblesville: Covered bridge at Conner Prairie

Noblesville: Potter's Bridge & White River in the Spring
- see
14
more - add
your
Submit your own pictures of this city and show them to the world
- OSM Map
- General Map
- Google Map
- MSN Map
Population change since 2000: +154.5%
| Males: 35,119 | |
| Females: 37,629 |
| Median resident age: | 35.1 years |
| Indiana median age: | 38.2 years |
Zip codes: 46060.
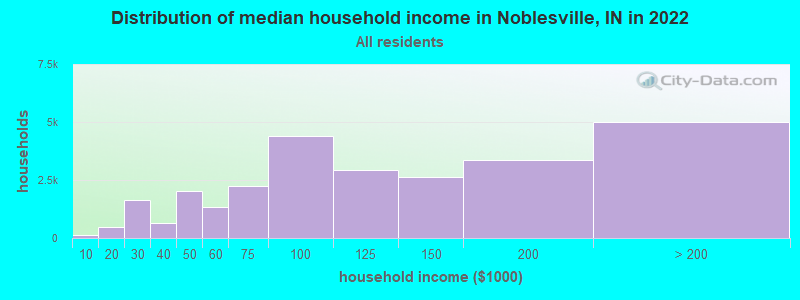
| Noblesville: | $106,025 |
| IN: | $66,785 |
Estimated per capita income in 2022: $50,258 (it was $28,813 in 2000)
Noblesville city income, earnings, and wages data
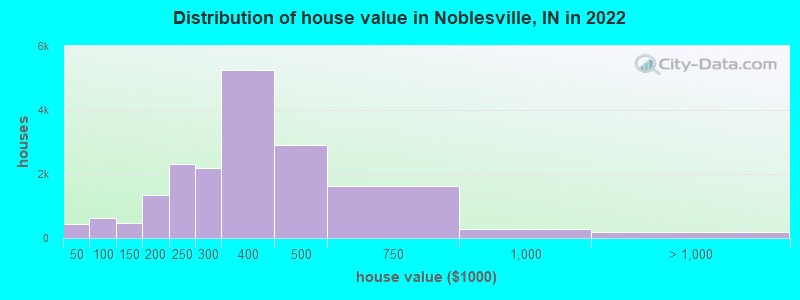
Estimated median house or condo value in 2022: $349,800 (it was $140,600 in 2000)
| Noblesville: | $349,800 |
| IN: | $208,700 |
Mean prices in 2022: all housing units: $334,885; detached houses: $346,901; townhouses or other attached units: $269,233; in 2-unit structures: $204,880; in 3-to-4-unit structures: $170,108; in 5-or-more-unit structures: $162,221; mobile homes: $77,047
Median gross rent in 2022: $1,307.
(4.9% for White Non-Hispanic residents, 5.3% for Black residents, 2.0% for Hispanic or Latino residents, 26.3% for American Indian residents, 9.3% for other race residents, 17.2% for two or more races residents)
Detailed information about poverty and poor residents in Noblesville, IN


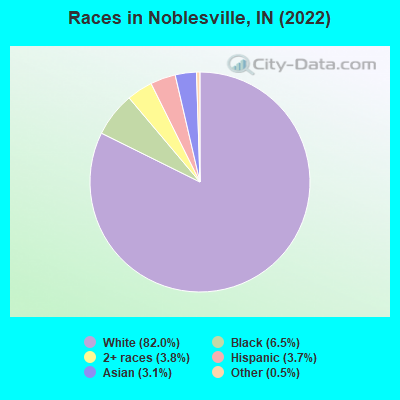
- 60,27482.0%White alone
- 4,8156.5%Black alone
- 2,7843.8%Two or more races
- 2,7563.7%Hispanic
- 2,2893.1%Asian alone
- 3400.5%Other race alone
- 430.06%American Indian alone
Races in Noblesville detailed stats: ancestries, foreign born residents, place of birth
According to our research of Indiana and other state lists, there were 6 registered sex offenders living in Noblesville, Indiana as of May 23, 2024.
The ratio of all residents to sex offenders in Noblesville is 9,851 to 1.
The ratio of registered sex offenders to all residents in this city is much lower than the state average.
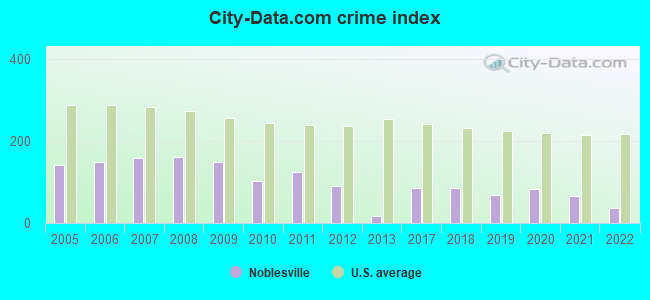
The City-Data.com crime index weighs serious crimes and violent crimes more heavily. Higher means more crime, U.S. average is 246.1. It adjusts for the number of visitors and daily workers commuting into cities.
- means the value is smaller than the state average.- means the value is about the same as the state average.
Crime rate in Noblesville detailed stats: murders, rapes, robberies, assaults, burglaries, thefts, arson
Full-time law enforcement employees in 2021, including police officers: 106 (96 officers - 88 male; 8 female).
| Officers per 1,000 residents here: | 1.43 |
| Indiana average: | 2.16 |
 Recent articles from our blog. Our writers, many of them Ph.D. graduates or candidates, create easy-to-read articles on a wide variety of topics.

 | Going to see Pearl Jam in Noblesville, sights in Indy? (2 replies) |
| Moving: Fishers vs Noblesville vs Westfield (12 replies) |
| Bike repair shop in Westfield, Noblesville, Carmel, North side Indy (3 replies) |
| Noblesville, Indiana??? (11 replies) |
| Noblesville - Tell me about it! (6 replies) |
| Considering Indiana for a potential relocation (122 replies) |
Latest news from Noblesville, IN collected exclusively by city-data.com from local newspapers, TV, and radio stations
Ancestries: German (20.8%), English (14.6%), American (10.4%), Irish (5.3%), Italian (4.0%), European (2.9%).
Current Local Time: EST time zone
Incorporated on 05/06/1887
Elevation: 772 feet
Land area: 17.9 square miles.
Population density: 4,060 people per square mile (average).
5,150 residents are foreign born (2.8% Asia, 1.5% Latin America, 1.5% Africa, 0.8% Europe).
| This city: | 7.0% |
| Indiana: | 5.6% |
Median real estate property taxes paid for housing units with mortgages in 2022: $3,110 (0.9%)
Median real estate property taxes paid for housing units with no mortgage in 2022: $2,726 (0.9%)
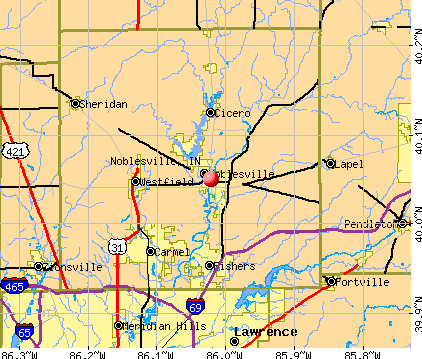
Nearest city with pop. 50,000+: Anderson, IN  (18.3 miles , pop. 59,734).
Nearest city with pop. 200,000+: Indianapolis, IN (19.1 miles , pop. 781,870).
Nearest city with pop. 1,000,000+: Chicago, IL (151.1 miles , pop. 2,896,016).
Nearest cities:
)Latitude: 40.05 N, Longitude: 86.02 W
Daytime population change due to commuting: -11,419 (-15.4%)
Workers who live and work in this city: 14,114 (33.3%)
Area code: 317

Noblesville tourist attractions:
Noblesville, Indiana accommodation & food services, waste management - Economy and Business Data
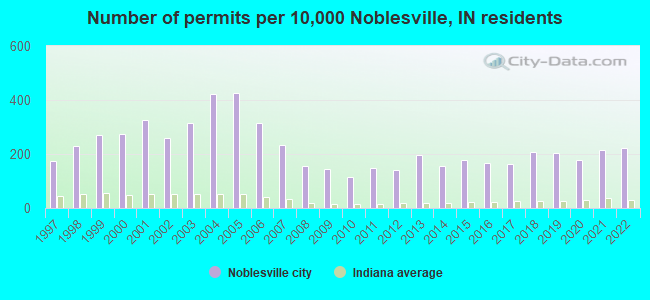
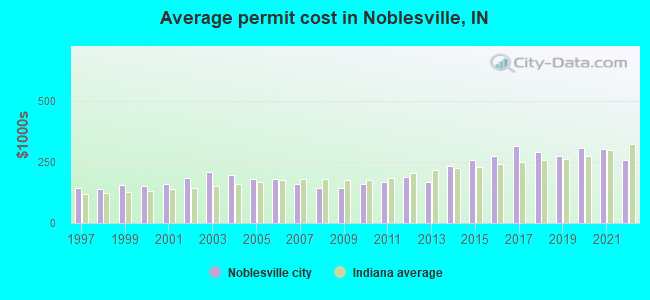
Single-family new house construction building permits:
- 2022: 641 buildings, average cost: $257,500
- 2021: 615 buildings, average cost: $304,400
- 2020: 511 buildings, average cost: $308,300
- 2019: 583 buildings, average cost: $276,400
- 2018: 597 buildings, average cost: $289,600
- 2017: 467 buildings, average cost: $314,700
- 2016: 480 buildings, average cost: $276,800
- 2015: 508 buildings, average cost: $260,300
- 2014: 443 buildings, average cost: $234,100
- 2013: 562 buildings, average cost: $170,000
- 2012: 398 buildings, average cost: $187,800
- 2011: 420 buildings, average cost: $169,200
- 2010: 331 buildings, average cost: $161,200
- 2009: 412 buildings, average cost: $143,300
- 2008: 439 buildings, average cost: $141,500
- 2007: 669 buildings, average cost: $160,400
- 2006: 902 buildings, average cost: $181,000
- 2005: 1218 buildings, average cost: $179,400
- 2004: 1212 buildings, average cost: $196,800
- 2003: 900 buildings, average cost: $209,900
- 2002: 743 buildings, average cost: $183,700
- 2001: 934 buildings, average cost: $160,100
- 2000: 787 buildings, average cost: $152,600
- 1999: 770 buildings, average cost: $157,200
- 1998: 651 buildings, average cost: $139,600
- 1997: 494 buildings, average cost: $143,100
| Here: | 2.1% |
| Indiana: | 2.8% |
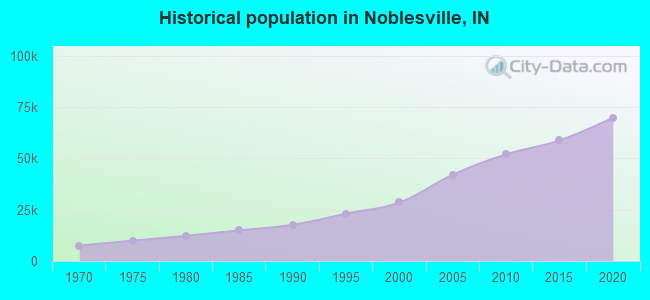
Population change in the 1990s: +9,943 (+53.3%).
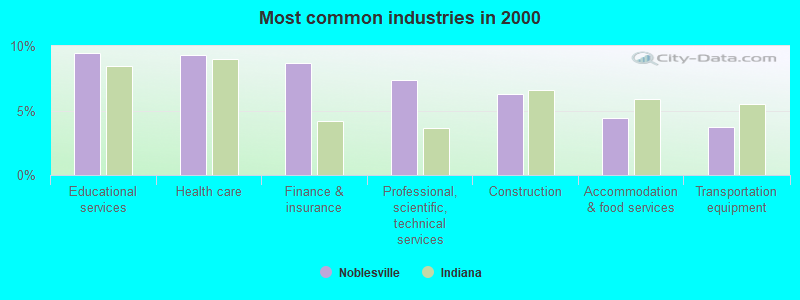
- Educational services (9.4%)
- Health care (9.3%)
- Finance & insurance (8.7%)
- Professional, scientific, technical services (7.4%)
- Construction (6.3%)
- Accommodation & food services (4.4%)
- Transportation equipment (3.7%)
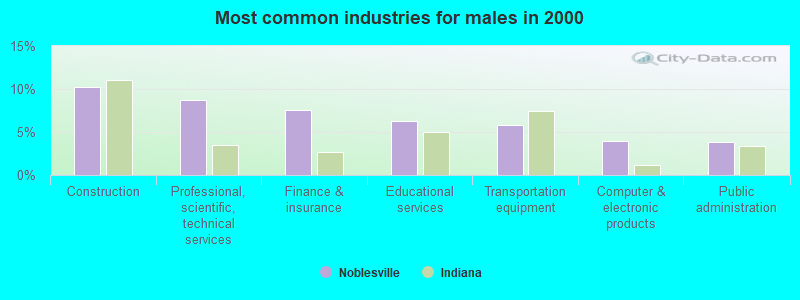
- Construction (10.2%)
- Professional, scientific, technical services (8.7%)
- Finance & insurance (7.6%)
- Educational services (6.3%)
- Transportation equipment (5.8%)
- Computer & electronic products (4.0%)
- Public administration (3.9%)
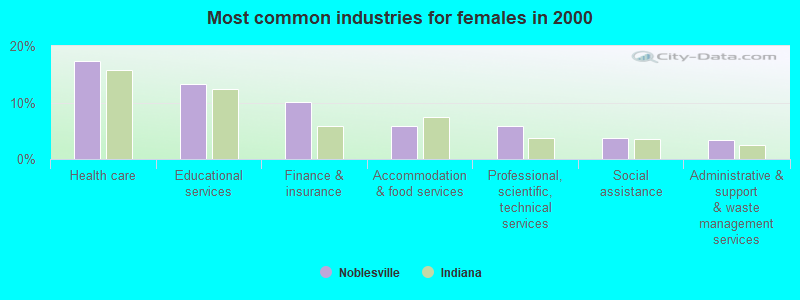
- Health care (17.3%)
- Educational services (13.3%)
- Finance & insurance (10.0%)
- Accommodation & food services (5.9%)
- Professional, scientific, technical services (5.8%)
- Social assistance (3.7%)
- Administrative & support & waste management services (3.3%)
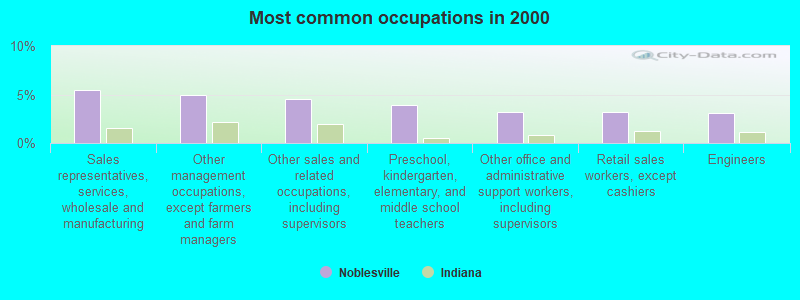
- Sales representatives, services, wholesale and manufacturing (5.4%)
- Other management occupations, except farmers and farm managers (4.9%)
- Other sales and related occupations, including supervisors (4.6%)
- Preschool, kindergarten, elementary, and middle school teachers (3.9%)
- Other office and administrative support workers, including supervisors (3.2%)
- Retail sales workers, except cashiers (3.2%)
- Engineers (3.1%)
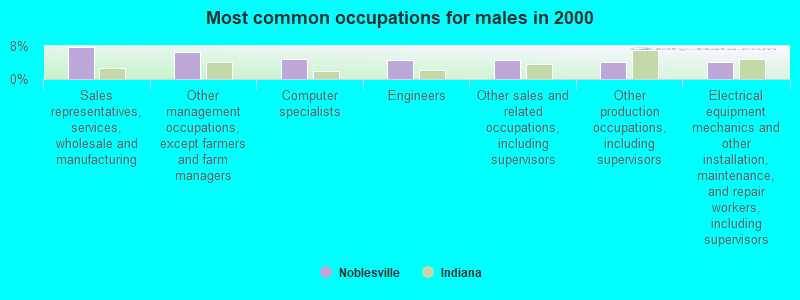
- Sales representatives, services, wholesale and manufacturing (7.7%)
- Other management occupations, except farmers and farm managers (6.6%)
- Computer specialists (4.8%)
- Engineers (4.7%)
- Other sales and related occupations, including supervisors (4.7%)
- Other production occupations, including supervisors (4.2%)
- Electrical equipment mechanics and other installation, maintenance, and repair workers, including supervisors (4.0%)
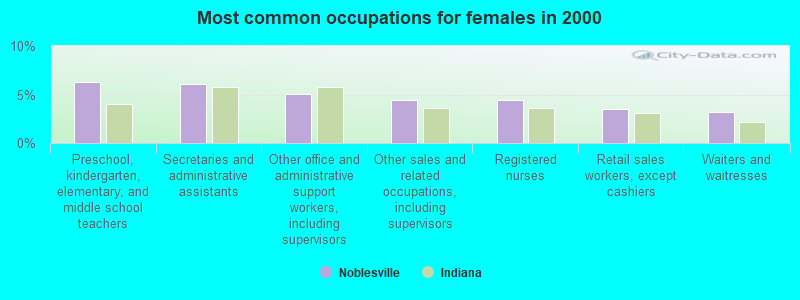
- Preschool, kindergarten, elementary, and middle school teachers (6.3%)
- Secretaries and administrative assistants (6.1%)
- Other office and administrative support workers, including supervisors (5.1%)
- Other sales and related occupations, including supervisors (4.5%)
- Registered nurses (4.4%)
- Retail sales workers, except cashiers (3.5%)
- Waiters and waitresses (3.2%)
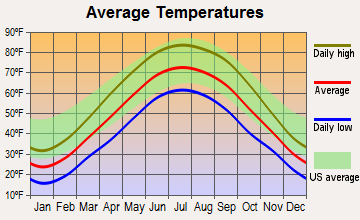
Average climate in Noblesville, Indiana
Based on data reported by over 4,000 weather stations


|
|


(lower is better)
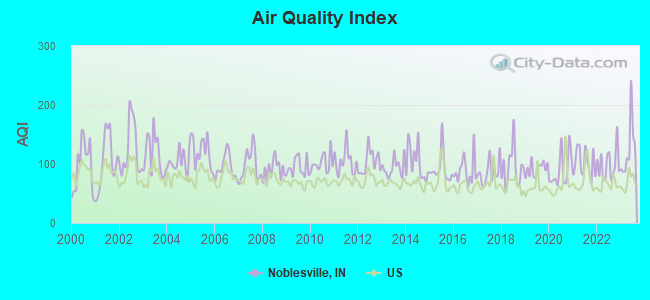
Air Quality Index (AQI) level in 2023 was 125. This is significantly worse than average.
| City: | 125 |
| U.S.: | 73 |
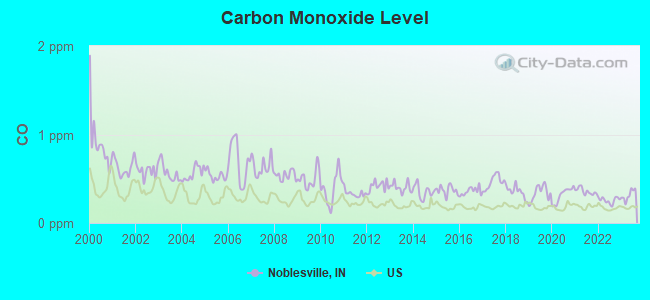
Carbon Monoxide (CO) [ppm] level in 2023 was 0.315. This is worse than average. Closest monitor was 12.6 miles away from the city center.
| City: | 0.315 |
| U.S.: | 0.251 |
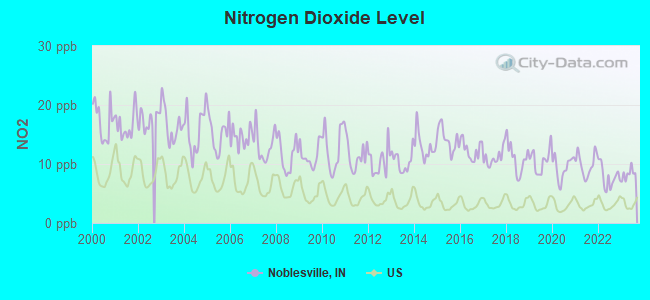
Nitrogen Dioxide (NO2) [ppb] level in 2023 was 8.29. This is significantly worse than average. Closest monitor was 13.2 miles away from the city center.
| City: | 8.29 |
| U.S.: | 5.11 |
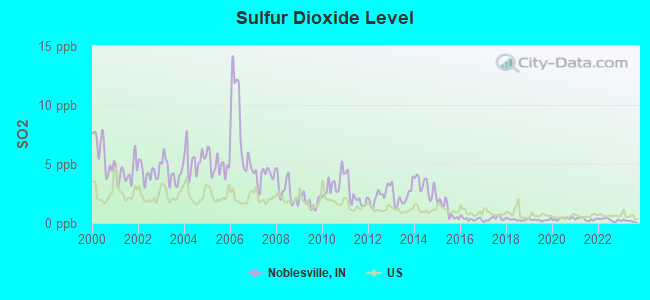
Sulfur Dioxide (SO2) [ppb] level in 2023 was 0.165. This is significantly better than average. Closest monitor was 12.6 miles away from the city center.
| City: | 0.165 |
| U.S.: | 1.515 |
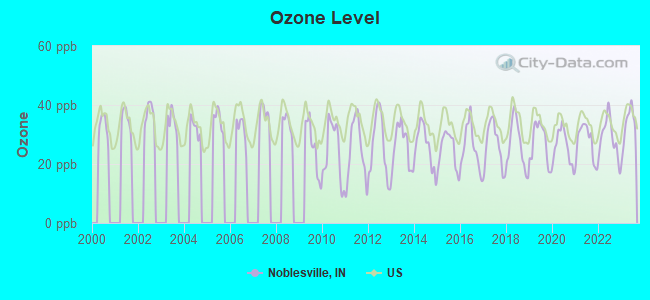
Ozone [ppb] level in 2023 was 33.0. This is about average. Closest monitor was 12.0 miles away from the city center.
| City: | 33.0 |
| U.S.: | 33.3 |
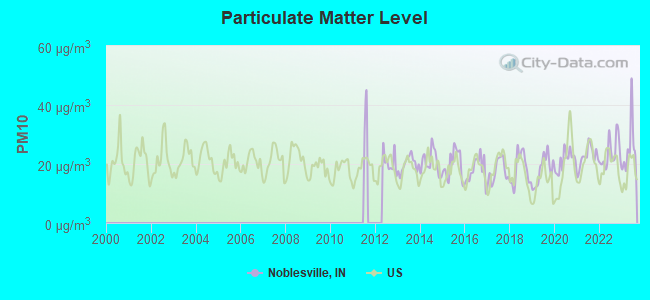
Particulate Matter (PM10) [µg/m3] level in 2023 was 25.4. This is worse than average. Closest monitor was 17.3 miles away from the city center.
| City: | 25.4 |
| U.S.: | 19.2 |
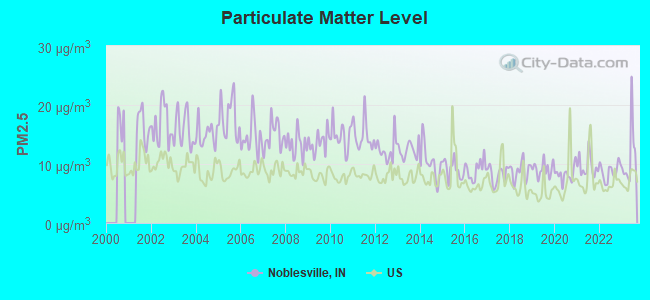
Particulate Matter (PM2.5) [µg/m3] level in 2023 was 11.4. This is significantly worse than average. Closest monitor was 7.5 miles away from the city center.
| City: | 11.4 |
| U.S.: | 8.1 |
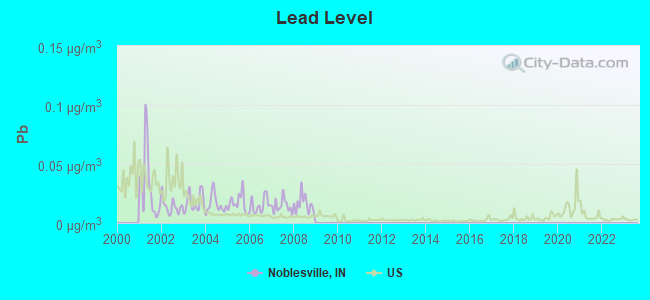
Lead (Pb) [µg/m3] level in 2008 was 0.0160. This is significantly worse than average. Closest monitor was 15.8 miles away from the city center.
| City: | 0.0160 |
| U.S.: | 0.0093 |
Tornado activity:
Noblesville-area historical tornado activity is slightly above Indiana state average. It is 127% greater than the overall U.S. average.
On 4/11/1965, a category F4 (max. wind speeds 207-260 mph) tornado 8.3 miles away from the Noblesville city center killed 28 people and injured 123 people and caused between $5,000,000 and $50,000,000 in damages.
On 6/11/1998, a category F4 tornado 19.1 miles away from the city center injured 4 people and caused $2 million in damages.
Earthquake activity:
Noblesville-area historical earthquake activity is significantly above Indiana state average. It is 67% greater than the overall U.S. average.On 4/18/2008 at 09:36:59, a magnitude 5.4 (5.1 MB, 4.8 MS, 5.4 MW, 5.2 MW, Class: Moderate, Intensity: VI - VII) earthquake occurred 149.0 miles away from the city center
On 4/18/2008 at 09:36:59, a magnitude 5.2 (5.2 MW, Depth: 8.9 mi) earthquake occurred 149.0 miles away from the city center
On 6/10/1987 at 23:48:54, a magnitude 5.1 (4.9 MB, 4.4 MS, 4.6 MS, 5.1 LG) earthquake occurred 130.9 miles away from Noblesville center
On 7/27/1980 at 18:52:21, a magnitude 5.2 (5.1 MB, 4.7 MS, 5.0 UK, 5.2 UK) earthquake occurred 169.5 miles away from Noblesville center
On 6/18/2002 at 17:37:15, a magnitude 5.0 (4.3 MB, 4.6 MW, 5.0 LG) earthquake occurred 171.1 miles away from the city center
On 4/18/2008 at 15:14:16, a magnitude 4.8 (4.5 MB, 4.8 MW, 4.6 MW, Class: Light, Intensity: IV - V) earthquake occurred 146.3 miles away from Noblesville center
Magnitude types: regional Lg-wave magnitude (LG), body-wave magnitude (MB), surface-wave magnitude (MS), moment magnitude (MW)
Natural disasters:
The number of natural disasters in Hamilton County (17) is near the US average (15).Major Disasters (Presidential) Declared: 12
Emergencies Declared: 4
Causes of natural disasters: Storms: 9, Floods: 7, Tornadoes: 6, Winter Storms: 3, Snows: 2, Blizzard: 1, Hurricane: 1, Ice Storm: 1, Snowstorm: 1, Other: 1 (Note: some incidents may be assigned to more than one category).

Hospitals and medical centers in Noblesville:
- RIVERVIEW HOSPITAL (Government - Local, 395 WESTFIELD RD)
- ST VINCENT NEW HOPE INC (515 SOUTH 10TH ST)
- HARBOUR MANOR HEALTH AND LIVING COMMUNITY (1667 SHERIDAN RD)
- MANOR HOUSE AT RIVERVIEW, THE (395 WESTFIELD ROAD)
- PRAIRIE LAKES HEALTH CAMPUS (9730 PRAIRIE LAKES BLVD E)
- RIVERVIEW TCU (395 WESTFIELD RD TCU)
- RIVERWALK VILLAGE (295 WESTFIELD RD)
- WALNUT CREEK AT NOBLESVILLE (1391 GREENFIELD PIKE)
- FMC - NOBLESVILLE DIALYSIS (165 SHERIDAN ROAD)
- RELIANT AT HOME LTD (341 LOGAN ST STE L110)
Airports located in Noblesville:
- Noblesville Airport (I80) (Runways: 1, Itinerant Ops: 2,000, Local Ops: 5,000)
- Creekside Farm Airport (II42) (Runways: 1)
- Galloway Airport (2IN6) (Runways: 1)
- Irion Airport (II94) (Runways: 1)
College/University in Noblesville:
Colleges/universities with over 2000 students nearest to Noblesville:
- ITT Technical Institute-Indianapolis (about 14 miles; Indianapolis, IN; Full-time enrollment: 4,765)
- Butler University (about 17 miles; Indianapolis, IN; FT enrollment: 4,388)
- Ivy Tech Community College (about 19 miles; Indianapolis, IN; FT enrollment: 71,493)
- Marian University (about 19 miles; Indianapolis, IN; FT enrollment: 2,476)
- Anderson University (about 20 miles; Anderson, IN; FT enrollment: 2,378)
- Harrison College-Indianapolis (about 21 miles; Indianapolis, IN; FT enrollment: 4,244)
- American College of Education (about 21 miles; Indianapolis, IN; FT enrollment: 2,718)
Public high schools in Noblesville:
- NOBLESVILLE HIGH SCHOOL (Students: 2,241, Location: 18111 CUMBERLAND RD, Grades: 9-12)
- OPTIONS CHARTER SCHOOL NOBLESVILLE (Students: 109, Location: 9945 CUMBERLAND POINTE BLVD, Grades: 9-12, Charter school)
- MOSAICS SCHOOL (Students: 53, Location: 1625 FIELD DR, Grades: 7-12)
Private high schools in Noblesville:
Biggest public elementary/middle schools in Noblesville:
- NOBLESVILLE EAST MIDDLE SCHOOL (Students: 1,334, Location: 1625 FIELD DR, Grades: 6-8)
- NOBLESVILLE WEST MIDDLE SCHOOL (Students: 1,222, Location: 19900 HAGUE RD, Grades: 6-8)
- HAZEL DELL ELEMENTARY SCHOOL (Students: 762, Location: 3025 WESTFIELD RD, Grades: PK-5)
- WHITE RIVER ELEMENTARY SCHOOL (Students: 665, Location: 19000 CUMBERLAND RD, Grades: PK-5)
- HINKLE CREEK ELEMENTARY SCH (Students: 606, Location: 595 S HARBOUR DR, Grades: PK-5)
- STONY CREEK ELEMENTARY SCHOOL (Students: 574, Location: 1350 GREENFIELD PIKE, Grades: PK-5)
- DURBIN ELEMENTARY SCHOOL (Students: 360, Location: 18000 DURBIN RD, Grades: KG-4)
- NORTH ELEMENTARY SCHOOL (Location: 440 N 10TH ST, Grades: KG-5)
- NOBLE CROSSING ELEMENTARY SCHOOL (Location: 5670 NOBLE CROSSING PKY, Grades: PK-5)
- PROMISE ROAD ELEMENTARY (Location: 14975 PROMISE RD, Grades: KG-5)
Private elementary/middle schools in Noblesville:
- OUR LADY OF GRACE SCHOOL (Students: 431, Location: 9900 E 191ST ST, Grades: PK-8)
- LEGACY CHRISTIAN SCHOOL (Students: 176, Location: 470 LAKEVIEW DR, Grades: PK-8)
User-submitted facts and corrections:
- new zip code: 46062 existing zip code: 46061 (post office boxes)
- 1. Noblesville also has zip code 46061 for post office boxes, and 46062 was added for the northern part of the city. 2. Noblesville Christian School is located at 1685 N. 10th St (phone: 317-776-4186) and offers grades K-7 (as of the 2005-2006 school year).
Points of interest:
Notable locations in Noblesville: First Indiana Commerce Park (A), Fox Prairie Golf Course (B), Morse Marina (C), Noblesville Municipal Sewage Treatment Plant (D), Stony Creek Business Park (E), Noblesville Fire Department Station 73 (F), Noblesville Fire Department Station 71 Headquarters (G), Noblesville City Hall (H), Hamilton County Courthouse (I), Noblesville Fire Department Station 74 (J), Noblesville Fire Department Station 72 (K), Noblesville Fire Department Station 75 (L). Display/hide their locations on the map
Shopping Centers: Noblesville Commons Shopping Center (1), Noblesville Creek Shoppes Shopping Center (2), Town And Country Plaza Shopping Center (3), Western Plaza Shopping Center (4), Noblesville Square Shopping Center (5). Display/hide their locations on the map
Churches in Noblesville include: Eastview Baptist Church (A), Bethel African Methodist Episcopal Church (B), Bible Holiness Church (C), Calvary Apostolic Church (D), Calvary Baptist Church (E), Christ Community Church (F), Community Baptist Church (G), First Church of God (H), First Presbyterian Church (I). Display/hide their locations on the map
Cemeteries: Hurlock Cemetery (1), Riverside Cemetery (2), Crownland Cemetery (3), Thorp Cemetery (4), Gascho-Trissel Cemetery (5). Display/hide their locations on the map
Reservoirs: Valley Forge Lake (A), Swan Lake (B). Display/hide their locations on the map
Streams, rivers, and creeks: West Fork Sly Run (A), Stony Creek (B), Hinkle Creek (C). Display/hide their locations on the map
Parks in Noblesville include: Seminary Park (1), Morse Park (2), Forest Park (3). Display/hide their locations on the map
Tourist attractions: Hamilton County Historical Society (Museums; 810 Conner Street) (1), Noblesville Golf & Batting Center (Amusement & Theme Parks; 17400 Willow View Road) (2), Ogden Entertainment (Amusement & Theme Parks; 12880 East 146th Street) (3), Noblesville City Of (1 Library Plaza) (4). Display/hide their approximate locations on the map
Hotels: Fairfield Inn and Suites Ind Noblesville (17960 Foundation Drive) (1), Fairfield Inn and Suites by Marriot (17960 Foundation Drive) (2), SE Noblesville Indianapolis (17070 Dragonfly Lane) (3). Display/hide their approximate locations on the map
Courts: Indiana State - Bureau Of Motor Vehicles- License Branches- Branches In Other Counties- Hamilto (1101 South 10th Street) (1), License Branch-Bmv-Auto - Hamilton Co (1950 Conner) (2), Noblesville City - City Court (135 South 9th Street) (3), Noblesville City - City Court- Probation (135 South 9th) (4). Display/hide their approximate locations on the map
Birthplace of: Rex Stout - Writer, Roger Stern - Writer, Conor Daly - Racing driver, Chris Hartley - College basketball player (Purdue Boilermakers), Drew Powell - Actor, Lillian Albertson - Actress, Ralph W. Gwinn - Politician.
Drinking water stations with addresses in Noblesville and their reported violations in the past:
PURGATORY GOLF CLUB (Population served: 200, Groundwater):Past health violations:PEBBLE BROOK GOLF COURSE (Population served: 150, Groundwater):Past monitoring violations:
- MCL, Monthly (TCR) - In OCT-2013, Contaminant: Coliform. Follow-up actions: St Public Notif requested (OCT-21-2013), St Violation/Reminder Notice (OCT-21-2013), St Boil Water Order (OCT-21-2013), St Compliance achieved (NOV-05-2013)
- MCL, Monthly (TCR) - In SEP-2012, Contaminant: Coliform. Follow-up actions: St Public Notif requested (OCT-02-2012), St Boil Water Order (OCT-02-2012), St Violation/Reminder Notice (OCT-02-2012), St Compliance achieved (NOV-26-2012)
- 2 routine major monitoring violations
- One minor monitoring violation
Past health violations:RIVERBEND CAMPGROUND (Population served: 104, Groundwater):Past monitoring violations:
- MCL, Acute (TCR) - In SEP-2011, Contaminant: Coliform. Follow-up actions: St Public Notif requested (OCT-17-2011), St Violation/Reminder Notice (OCT-17-2011), St Boil Water Order (OCT-17-2011), St Compliance achieved (JUL-25-2012)
- One routine major monitoring violation
Past monitoring violations:OPEN DOOR FREE METHODIST CHURCH (Population served: 63, Groundwater):
- 4 routine major monitoring violations
Past monitoring violations:PIZZA HUT (Population served: 58, Groundwater):
- 3 routine major monitoring violations
Past monitoring violations:GRAYLAN PLACE (Population served: 40, Groundwater):
- One routine major monitoring violation
- One regular monitoring violation
Past health violations:Past monitoring violations:
- MCL, Average - Between APR-2008 and JUN-2008, Contaminant: Arsenic. Follow-up actions: St Violation/Reminder Notice (JUL-17-2008), St Public Notif requested (JUL-17-2008), St Public Notif received (FEB-10-2009), St Compliance achieved (SEP-21-2010)
- MCL, Average - Between JAN-2008 and MAR-2008, Contaminant: Arsenic. Follow-up actions: St Violation/Reminder Notice (FEB-05-2008), St Public Notif requested (FEB-05-2008), St Public Notif received (FEB-21-2008), St Compliance achieved (SEP-21-2010)
- MCL, Average - Between OCT-2007 and DEC-2007, Contaminant: Arsenic. Follow-up actions: St Violation/Reminder Notice (NOV-13-2007), St Public Notif requested (NOV-13-2007), St Public Notif received (NOV-26-2007), St Compliance achieved (SEP-21-2010)
- MCL, Average - Between JUL-2007 and SEP-2007, Contaminant: Arsenic. Follow-up actions: St Violation/Reminder Notice (AUG-23-2007), St Public Notif requested (AUG-23-2007), St Public Notif received (SEP-11-2007), St Compliance achieved (SEP-21-2010)
- MCL, Monthly (TCR) - In OCT-2006, Contaminant: Coliform. Follow-up actions: St Public Notif requested (NOV-02-2006), St Violation/Reminder Notice (NOV-02-2006), St Boil Water Order (NOV-02-2006), St Compliance achieved (MAY-17-2010)
- One routine major monitoring violation
- One minor monitoring violation
- 15 regular monitoring violations
| This city: | 2.7 people |
| Indiana: | 2.5 people |
| This city: | 73.3% |
| Whole state: | 66.9% |
| This city: | 5.9% |
| Whole state: | 6.9% |
Likely homosexual households (counted as self-reported same-sex unmarried-partner households)
- Lesbian couples: 0.3% of all households
- Gay men: 0.3% of all households
People in group quarters in Noblesville in 2010:
- 316 people in nursing facilities/skilled-nursing facilities
- 311 people in local jails and other municipal confinement facilities
- 20 people in emergency and transitional shelters (with sleeping facilities) for people experiencing homelessness
- 7 people in group homes intended for adults
- 5 people in group homes for juveniles (non-correctional)
- 2 people in other noninstitutional facilities
People in group quarters in Noblesville in 2000:
- 337 people in local jails and other confinement facilities (including police lockups)
- 235 people in nursing homes
- 38 people in short-term care, detention or diagnostic centers for delinquent children
- 14 people in homes for the mentally retarded
- 11 people in training schools for juvenile delinquents
- 7 people in hospitals/wards and hospices for chronically ill
- 7 people in other hospitals or wards for chronically ill
- 3 people in religious group quarters
Banks with most branches in Noblesville (2011 data):
- Community Bank: South 10th Street Branch, at 830 Logan Street, Noble Creek Branch, Westside, North 10th Street Branch. Info updated 2010/01/13: Bank assets: $256.5 mil, Deposits: $221.4 mil, local headquarters, positive income, Commercial Lending Specialization, 11 total offices, Holding Company: Community Bancshares, Inc.
- BMO Harris Bank National Association: Stony Creek, Logan & Lakeview Branch, Noblesville Branch, Hamilton Towne Center Branch. Info updated 2011/07/14: Bank assets: $97,264.0 mil, Deposits: $75,624.6 mil, headquarters in Chicago, IL, positive income, 717 total offices, Holding Company: Bank Of Montreal
- JPMorgan Chase Bank, National Association: 141st And Sr 37 Banking Center Branc, Hamilton Town Center Branch, Sunny Dell Branch, Noblesville Banking Center Branch. Info updated 2011/11/10: Bank assets: $1,811,678.0 mil, Deposits: $1,190,738.0 mil, headquarters in Columbus, OH, positive income, International Specialization, 5577 total offices, Holding Company: Jpmorgan Chase & Co.
- The Huntington National Bank: Noblesville Branch, East Conner Branch, 146th St & Gray Road Branch. Info updated 2012/04/02: Bank assets: $54,183.4 mil, Deposits: $44,300.3 mil, headquarters in Columbus, OH, positive income, Commercial Lending Specialization, 878 total offices, Holding Company: Huntington Bancshares Incorporated
- KeyBank National Association: Noblesville Main Branch, Hamilton Town Center Branch, Westfield Branch. Info updated 2008/03/03: Bank assets: $86,198.8 mil, Deposits: $64,214.8 mil, headquarters in Cleveland, OH, positive income, Commercial Lending Specialization, 1067 total offices, Holding Company: Keycorp
- STAR Financial Bank: Prairie Lakes Branch at 14160 Mundy Drive Suite 100, branch established on 2004/08/20; Hazel Dell Crossing Branch at 14675 Hazell Dell Crossing, branch established on 2008/12/08. Info updated 2006/11/03: Bank assets: $1,622.5 mil, Deposits: $1,346.4 mil, headquarters in Fort Wayne, IN, positive income, Commercial Lending Specialization, 48 total offices, Holding Company: Star Financial Group, Inc.
- PNC Bank, National Association: Prairie Lakes Branch at 14475 Mundy Drive, branch established on 2004/03/24; Noblesville Branch at 300 Sheridan Road, branch established on 1966/06/22. Info updated 2012/03/20: Bank assets: $263,309.6 mil, Deposits: $197,343.0 mil, headquarters in Wilmington, DE, positive income, Commercial Lending Specialization, 3085 total offices, Holding Company: Pnc Financial Services Group, Inc., The
- Regions Bank: Hazell Dell Branch at 14795 Sunny Dell Lance, branch established on 2007/12/17; Noblesville Branch at 14425 Mundy Drive, branch established on 2004/11/02. Info updated 2011/02/24: Bank assets: $123,368.2 mil, Deposits: $98,301.3 mil, headquarters in Birmingham, AL, positive income, Commercial Lending Specialization, 1778 total offices, Holding Company: Regions Financial Corporation
- Fifth Third Bank: Noblesville Branch at 16864 Clover Road, branch established on 2001/05/30. Info updated 2009/10/05: Bank assets: $114,540.4 mil, Deposits: $89,689.1 mil, headquarters in Cincinnati, OH, positive income, Commercial Lending Specialization, 1378 total offices, Holding Company: Fifth Third Bancorp
- 3 other banks with 3 local branches
For population 15 years and over in Noblesville:
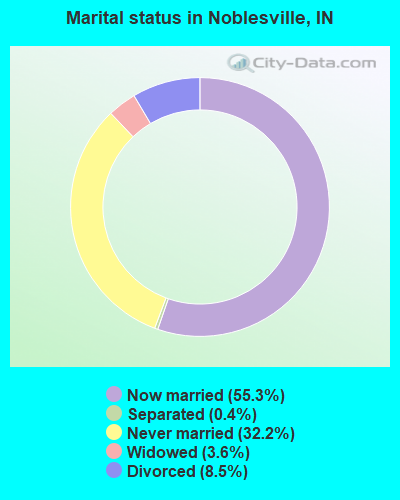
- Never married: 32.2%
- Now married: 55.3%
- Separated: 0.4%
- Widowed: 3.6%
- Divorced: 8.5%
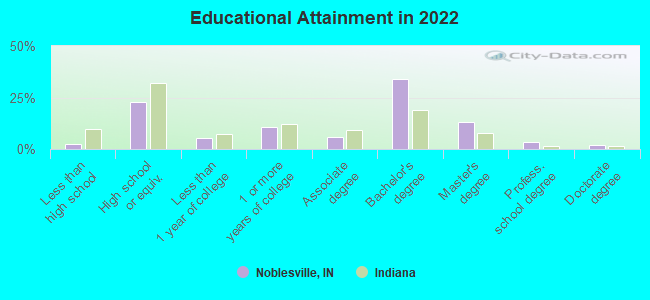
For population 25 years and over in Noblesville:
- High school or higher: 97.5%
- Bachelor's degree or higher: 52.7%
- Graduate or professional degree: 18.5%
- Unemployed: 2.2%
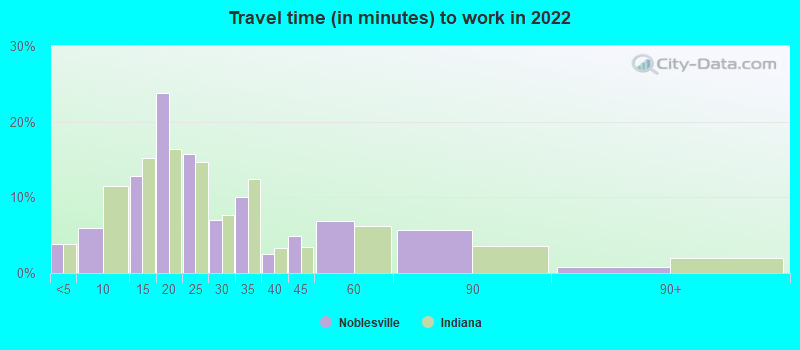
- Mean travel time to work (commute): 24.6 minutes
| Here: | 9.6 |
| Indiana average: | 11.3 |
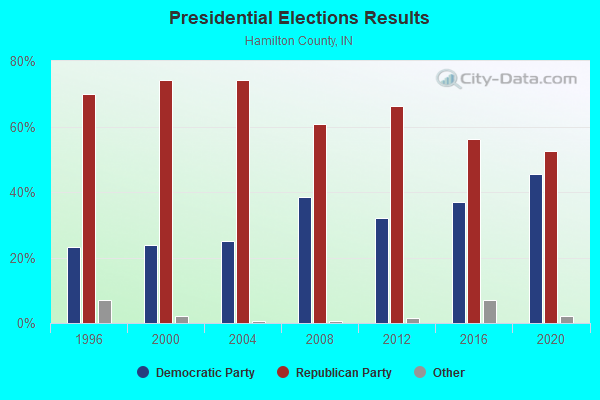
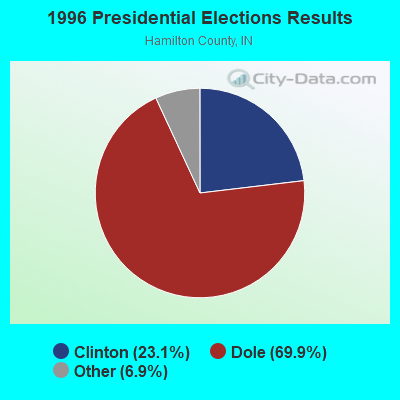
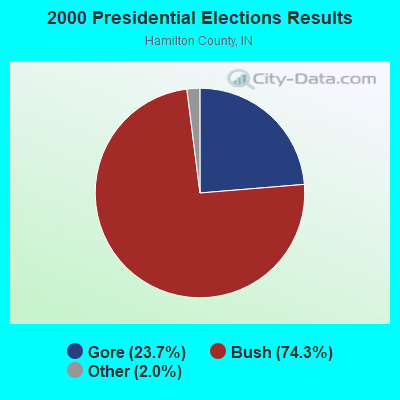
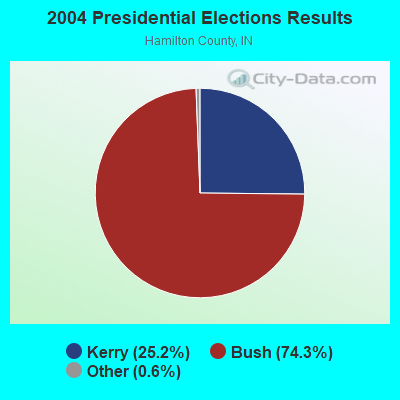
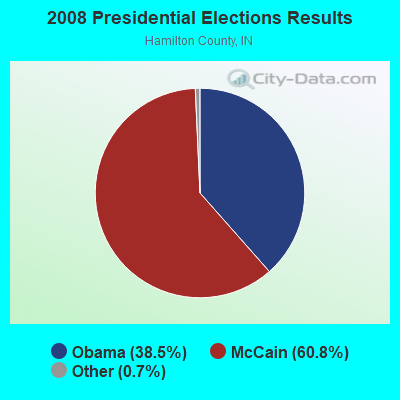
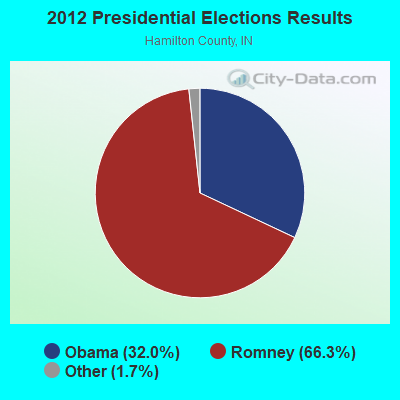
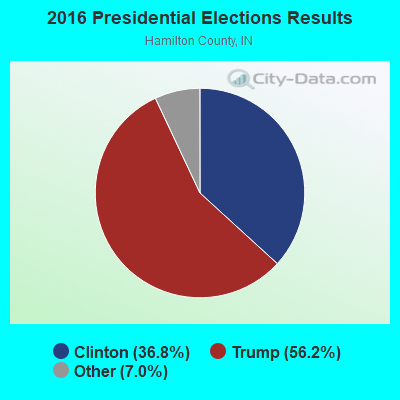
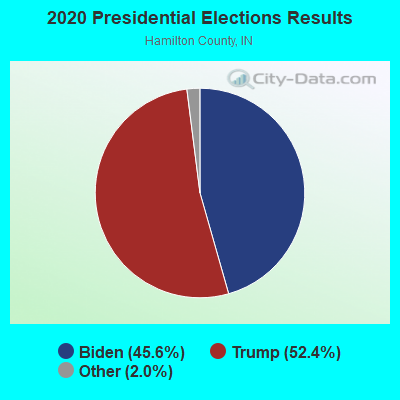
Graphs represent county-level data. Detailed 2008 Election Results
Neighborhoods in Noblesville:
(Noblesville, Indiana Neighborhood Map)- Arbor Grove neighborhood
- Ashfield neighborhood
- Brookside neighborhood
- Cherry Tree Farms neighborhood
- Conner Crossing of Noblesville neighborhood
- Crestview neighborhood
- Cumberland Knoll neighborhood
- Fairfield Farms neighborhood
- Feather Cove neighborhood
- Fox Glen neighborhood
- Hazel Dell Woods neighborhood
- Hinkle Creek Estates neighborhood
- Kingsley neighborhood
- Lochaven neighborhood
- Mill Creek neighborhood
- Millcreek Estates neighborhood
- Noblefield neighborhood
- North Pointe Ridge neighborhood
- Park 32 West neighborhood
- Pebble Brook neighborhood
- Pinehurst Village neighborhood
- Slater Ridge neighborhood
- Stony Ridge neighborhood
- Summitt Lakes neighborhood
- Villages at Pebble Brook neighborhood
- Woodshire neighborhood
Religion statistics for Noblesville, IN (based on Hamilton County data)
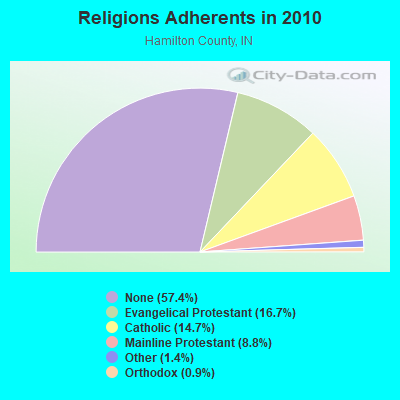
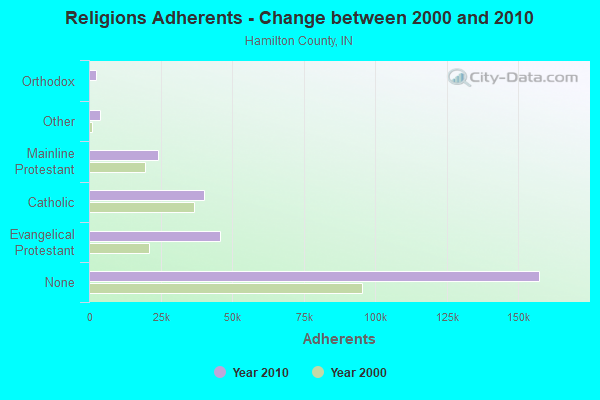
| Religion | Adherents | Congregations |
|---|---|---|
| Evangelical Protestant | 45,849 | 121 |
| Catholic | 40,251 | 8 |
| Mainline Protestant | 24,297 | 45 |
| Other | 3,969 | 13 |
| Orthodox | 2,455 | 2 |
| Black Protestant | 249 | 1 |
| None | 157,499 | - |
Food Environment Statistics:
| Hamilton County: | 1.50 / 10,000 pop. |
| Indiana: | 1.73 / 10,000 pop. |
| Hamilton County: | 0.23 / 10,000 pop. |
| Indiana: | 0.21 / 10,000 pop. |
| Here: | 0.19 / 10,000 pop. |
| State: | 0.50 / 10,000 pop. |
| Here: | 1.80 / 10,000 pop. |
| Indiana: | 3.57 / 10,000 pop. |
| Here: | 6.75 / 10,000 pop. |
| Indiana: | 6.78 / 10,000 pop. |
| Hamilton County: | 7.1% |
| Indiana: | 9.2% |
| Hamilton County: | 24.7% |
| Indiana: | 29.0% |
| Hamilton County: | 13.0% |
| State: | 14.3% |
Health and Nutrition:
| This city: | 51.2% |
| Indiana: | 49.3% |
| Noblesville: | 50.0% |
| State: | 46.2% |
| This city: | 28.3 |
| Indiana: | 28.7 |
| Noblesville: | 21.2% |
| State: | 21.3% |
| Noblesville: | 8.5% |
| Indiana: | 10.6% |
| Noblesville: | 6.9 |
| State: | 6.8 |
| This city: | 32.4% |
| State: | 33.9% |
| Here: | 59.5% |
| Indiana: | 56.1% |
| Here: | 80.8% |
| Indiana: | 78.7% |
More about Health and Nutrition of Noblesville, IN Residents
| Local government employment and payroll (March 2022) | |||||
| Function | Full-time employees | Monthly full-time payroll | Average yearly full-time wage | Part-time employees | Monthly part-time payroll |
|---|---|---|---|---|---|
| Firefighters | 135 | $999,385 | $88,834 | 1 | $1,605 |
| Police Protection - Officers | 95 | $673,723 | $85,102 | 0 | $0 |
| Streets and Highways | 43 | $256,182 | $71,493 | 1 | $824 |
| Sewerage | 31 | $167,438 | $64,815 | 5 | $6,309 |
| Parks and Recreation | 27 | $131,332 | $58,370 | 9 | $6,322 |
| Other and Unallocable | 24 | $142,175 | $71,088 | 0 | $0 |
| Other Government Administration | 17 | $126,491 | $89,288 | 9 | $6,379 |
| Housing and Community Development (Local) | 16 | $95,883 | $71,912 | 0 | $0 |
| Financial Administration | 14 | $77,823 | $66,705 | 0 | $0 |
| Police - Other | 10 | $44,323 | $53,188 | 0 | $0 |
| Judicial and Legal | 5 | $29,306 | $70,334 | 0 | $0 |
| Fire - Other | 4 | $18,744 | $56,232 | 0 | $0 |
| Totals for Government | 421 | $2,762,804 | $78,750 | 25 | $21,439 |
Noblesville government finances - Expenditure in 2021 (per resident):
- Construction - Sewerage: $1,736,000 ($23.86)
- Current Operations - General - Other: $22,128,000 ($304.17)
Local Fire Protection: $17,624,000 ($242.26)
Police Protection: $12,038,000 ($165.48)
Sewerage: $6,530,000 ($89.76)
Parks and Recreation: $5,273,000 ($72.48)
Central Staff Services: $4,411,000 ($60.63)
Regular Highways: $4,386,000 ($60.29)
Solid Waste Management: $3,200,000 ($43.99)
Judicial and Legal Services: $1,609,000 ($22.12)
Financial Administration: $1,278,000 ($17.57)
Parking Facilities: $109,000 ($1.50)
Housing and Community Development: $75,000 ($1.03)
Miscellaneous Commercial Activities - Other: $73,000 ($1.00)
General Public Buildings: $12,000 ($0.16)
- General - Interest on Debt: $2,950,000 ($40.55)
- Other Capital Outlay - Local Fire Protection: $452,000 ($6.21)
Parks and Recreation: $188,000 ($2.58)
Police Protection: $70,000 ($0.96)
Central Staff Services: $21,000 ($0.29)
Miscellaneous Commercial Activities - Other: $9,000 ($0.12)
General - Other: $1,000 ($0.01)
Parking Facilities: $1,000 ($0.01)
Noblesville government finances - Revenue in 2021 (per resident):
- Charges - Sewerage: $47,758,000 ($656.49)
Other: $2,077,000 ($28.55)
Parks and Recreation: $1,967,000 ($27.04)
Parking Facilities: $42,000 ($0.58)
Miscellaneous Commercial Activities: $6,000 ($0.08)
- Local Intergovernmental - Other: $1,349,000 ($18.54)
Highways: $1,329,000 ($18.27)
- Miscellaneous - General Revenue - Other: $237,000 ($3.26)
Interest Earnings: $226,000 ($3.11)
Donations From Private Sources: $119,000 ($1.64)
Rents: $70,000 ($0.96)
Sale of Property: $42,000 ($0.58)
Fines and Forfeits: $20,000 ($0.27)
- Revenue - Water Utilities: $20,000 ($0.27)
- State Intergovernmental - Other: $25,271,000 ($347.38)
Highways: $9,943,000 ($136.68)
General Local Government Support: $3,354,000 ($46.10)
- Tax - Property: $43,229,000 ($594.23)
Other License: $4,807,000 ($66.08)
Other Selective Sales: $1,790,000 ($24.61)
Public Utilities Sales: $406,000 ($5.58)
Noblesville government finances - Debt in 2021 (per resident):
- Long Term Debt - Beginning Outstanding - Unspecified Public Purpose: $116,855,000 ($1606.30)
Outstanding Unspecified Public Purpose: $116,855,000 ($1606.30)
Noblesville government finances - Cash and Securities in 2021 (per resident):
- Bond Funds - Cash and Securities: $33,169,000 ($455.94)
- Other Funds - Cash and Securities: $112,221,000 ($1542.60)
- Sinking Funds - Cash and Securities: $3,638,000 ($50.01)
| Businesses in Noblesville, IN | ||||
| Name | Count | Name | Count | |
|---|---|---|---|---|
| AT&T | 2 | Little Caesars Pizza | 1 | |
| Ace Hardware | 1 | Long John Silver's | 1 | |
| Advance Auto Parts | 1 | Lowe's | 1 | |
| Aeropostale | 1 | Marriott | 1 | |
| American Eagle Outfitters | 1 | MasterBrand Cabinets | 6 | |
| Ann Taylor | 1 | Maurices | 1 | |
| Applebee's | 1 | McDonald's | 3 | |
| Arby's | 1 | Meijer | 1 | |
| AutoZone | 2 | Men's Wearhouse | 1 | |
| Banana Republic | 1 | New Balance | 1 | |
| Barnes & Noble | 1 | New York & Co | 1 | |
| Bath & Body Works | 1 | Nike | 5 | |
| Bed Bath & Beyond | 1 | Office Depot | 1 | |
| Blockbuster | 2 | Old Navy | 1 | |
| Budget Car Rental | 1 | Olive Garden | 1 | |
| Burger King | 2 | Panda Express | 1 | |
| CVS | 6 | Panera Bread | 1 | |
| Cache | 1 | Papa John's Pizza | 1 | |
| Cambria | 1 | Payless | 1 | |
| Chevrolet | 1 | Penske | 1 | |
| Chick-Fil-A | 1 | PetSmart | 1 | |
| Chico's | 1 | Pier 1 Imports | 1 | |
| Cold Stone Creamery | 1 | Pizza Hut | 2 | |
| Coldwater Creek | 1 | Qdoba Mexican Grill | 2 | |
| Curves | 1 | Quality | 1 | |
| Dairy Queen | 1 | Quiznos | 1 | |
| Discount Tire | 1 | RadioShack | 2 | |
| Domino's Pizza | 1 | Red Robin | 1 | |
| DressBarn | 1 | Rue21 | 1 | |
| Dressbarn | 1 | SAS Shoes | 1 | |
| Express | 1 | Sears | 1 | |
| Fashion Bug | 1 | Sephora | 1 | |
| FedEx | 9 | Shoe Carnival | 1 | |
| Finish Line | 1 | Sprint Nextel | 3 | |
| Firestone Complete Auto Care | 2 | Staples | 1 | |
| GNC | 2 | Starbucks | 2 | |
| GameStop | 2 | Steak 'n Shake | 1 | |
| Goodwill | 2 | Super 8 | 1 | |
| Gymboree | 1 | T-Mobile | 3 | |
| H&R Block | 2 | T.J.Maxx | 1 | |
| Hardee's | 1 | Taco Bell | 2 | |
| Home Depot | 1 | U-Haul | 5 | |
| Houlihan's | 1 | UPS | 12 | |
| JCPenney | 1 | Vans | 2 | |
| JoS. A. Bank | 1 | Verizon Wireless | 2 | |
| KFC | 1 | Victoria's Secret | 1 | |
| Kmart | 1 | Walgreens | 2 | |
| Kohl's | 1 | Walmart | 1 | |
| Kroger | 2 | Wendy's | 2 | |
| La-Z-Boy | 1 | White Castle | 1 | |
| LensCrafters | 1 | |||
Strongest AM radio stations in Noblesville:
- WIBC (1070 AM; 50 kW; INDIANAPOLIS, IN; Owner: EMMIS RADIO LICENSE CORPORATION)
- WNDE (1260 AM; 5 kW; INDIANAPOLIS, IN; Owner: CAPSTAR TX LIMITED PARTNERSHIP)
- WBRI (1500 AM; daytime; 5 kW; INDIANAPOLIS, IN)
- WXLW (950 AM; 5 kW; INDIANAPOLIS, IN)
- WXNT (1430 AM; 5 kW; INDIANAPOLIS, IN; Owner: MYSTAR COMMUNICATIONS CORPORATION)
- WOWO (1190 AM; 50 kW; FORT WAYNE, IN; Owner: PATHFINDER COMMUNICATIONS CORPORATION)
- WNTS (1590 AM; 5 kW; BEECH GROVE, IN; Owner: S + M BROADCASTING CO., INC.)
- WTLC (1310 AM; 5 kW; INDIANAPOLIS, IN; Owner: RADIO ONE OF INDIANA, LLC)
- WLW (700 AM; 50 kW; CINCINNATI, OH; Owner: JACOR BROADCASTING CORPORATION)
- WIOU (1350 AM; 5 kW; KOKOMO, IN; Owner: MID-AMERICA RADIO GROUP, INC.)
- WHAS (840 AM; 50 kW; LOUISVILLE, KY; Owner: CLEAR CHANNEL BROADCASTING LICENSES, INC.)
- WSAI (1530 AM; 50 kW; CINCINNATI, OH; Owner: JACOR BROADCASTING CORPORATION)
- WHBU (1240 AM; 1 kW; ANDERSON, IN; Owner: INDIANA SABRECOM, INC.)
Strongest FM radio stations in Noblesville:
- WGRL (93.9 FM; NOBLESVILLE, IN; Owner: INDY LICO, INC.)
- WFBQ (94.7 FM; INDIANAPOLIS, IN; Owner: CAPSTAR TX LIMITED PARTNERSHIP)
- WRZX (103.3 FM; INDIANAPOLIS, IN; Owner: CAPSTAR TX LIMITED PARTNERSHIP)
- WTPI (107.9 FM; INDIANAPOLIS, IN; Owner: MYSTAR COMMUNICATIONS CORPORATION)
- WNOU (93.1 FM; INDIANAPOLIS, IN; Owner: EMMIS RADIO LICENSE CORPORATION)
- WFMS (95.5 FM; INDIANAPOLIS, IN; Owner: WFMS LICO, INC)
- WYXB (105.7 FM; INDIANAPOLIS, IN; Owner: EMMIS RADIO LICENSE CORPORATION)
- WZPL (99.5 FM; GREENFIELD, IN; Owner: MYSTAR COMMUNICATIONS CORPORATION)
- WFYI-FM (90.1 FM; INDIANAPOLIS, IN; Owner: METROPOLITAN IN. PUBLIC B/CING, INC.)
- WENS (97.1 FM; SHELBYVILLE, IN; Owner: EMMIS RADIO LICENSE CORPORATION)
- WHHH (96.3 FM; INDIANAPOLIS, IN; Owner: RADIO ONE OF INDIANA, LLC)
- WGNR-FM (97.9 FM; ANDERSON, IN; Owner: THE MOODY BIBLE INSTITUTE OF CHICAGO)
- WGLD (104.5 FM; INDIANAPOLIS, IN; Owner: INDY LICO, INC)
- WQME (98.7 FM; ANDERSON, IN; Owner: ANDERSON UNIVERSITY, INC.)
- WYJZ (100.9 FM; LEBANON, IN; Owner: RADIO ONE OF INDIANA, LLC)
- WHJE (91.3 FM; CARMEL, IN; Owner: CARMEL/CLAY SCHOOL CORPORATION)
- WURK (101.7 FM; ELWOOD, IN; Owner: INDIANA SABRECOM, INC.)
- WTTS (92.3 FM; BLOOMINGTON, IN; Owner: SARKES TARZIAN, INC.)
- WHTI (96.7 FM; ALEXANDRIA, IN; Owner: INDIANA SABRECOM, INC.)
- WBSB (89.5 FM; ANDERSON, IN; Owner: BALL STATE UNIVERSITY)
TV broadcast stations around Noblesville:
- WNDY-TV (Channel 23; MARION, IN; Owner: UPN STATIONS GROUP INC.)
- WTHR (Channel 13; INDIANAPOLIS, IN; Owner: VIDEOINDIANA, INC.)
- WALV-CA (Channel 50; INDIANAPOLIS, IN; Owner: VIDEOHIO, INC..)
- WRTV (Channel 6; INDIANAPOLIS, IN; Owner: MCGRAW-HILL BROADCASTING COMPANY, INC.)
- WXIN (Channel 59; INDIANAPOLIS, IN; Owner: TRIBUNE TELEVISION COMPANY)
- WISH-TV (Channel 8; INDIANAPOLIS, IN; Owner: INDIANA BROADCASTING, LLC)
- WHMB-TV (Channel 40; INDIANAPOLIS, IN; Owner: LESEA BROADCASTING CORPORATION)
- WBXI-CA (Channel 47; INDIANAPOLIS, IN; Owner: THE BOX WORLDWIDE LLC)
- WFYI (Channel 20; INDIANAPOLIS, IN; Owner: METROPOLITAN INDIANAPOLIS PUBLIC BROADCASTING, INC.)
- WIIH-CA (Channel 11; INDIANAPOLIS, IN; Owner: INDIANA BROADCASTING, LLC)
- WTTK (Channel 29; KOKOMO, IN; Owner: TRIBUNE BROADCAST HOLDINGS, INC.)
- WTBU-TV (Channel 69; INDIANAPOLIS, IN; Owner: BUTLER UNIVERSITY)
- WKOG-LP (Channel 31; INDIANAPOLIS, IN; Owner: KINGDOM OF GOD MINISTRIES, INC.)
- WDNI-LP (Channel 65; INDIANAPOLIS, IN; Owner: RADIO ONE OF INDIANA, LLC)
- WIPX-LP (Channel 51; INDIANAPOLIS, IN; Owner: PAXSON COMMUNICATIONS LICENSE COMPANY, LLC)
- WTTV (Channel 4; BLOOMINGTON, IN; Owner: TRIBUNE BROADCAST HOLDINGS, INC.)
- National Bridge Inventory (NBI) Statistics
- 85Number of bridges
- 823ft / 251mTotal length
- $7,634,000Total costs
- 703,110Total average daily traffic
- 59,471Total average daily truck traffic
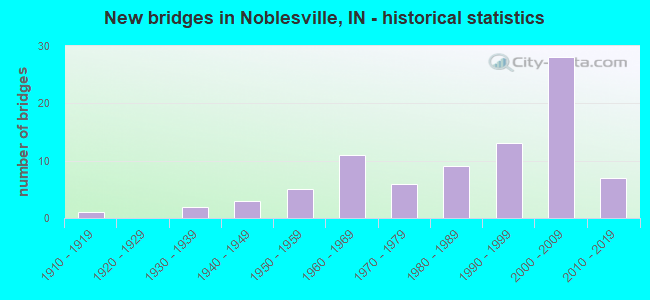
- New bridges - historical statistics
- 11910-1919
- 21930-1939
- 31940-1949
- 51950-1959
- 111960-1969
- 61970-1979
- 91980-1989
- 131990-1999
- 282000-2009
- 72010-2019
FCC Registered Antenna Towers: 253 (See the full list of FCC Registered Antenna Towers)
FCC Registered Private Land Mobile Towers: 8 (See the full list of FCC Registered Private Land Mobile Towers in Noblesville, IN)
FCC Registered Broadcast Land Mobile Towers: 47 (See the full list of FCC Registered Broadcast Land Mobile Towers)
FCC Registered Microwave Towers: 20 (See the full list of FCC Registered Microwave Towers in this town)
FCC Registered Paging Towers: 8 (See the full list of FCC Registered Paging Towers)
FCC Registered Maritime Coast & Aviation Ground Towers: 1 (See the full list of FCC Registered Maritime Coast & Aviation Ground Towers)
FCC Registered Amateur Radio Licenses: 346 (See the full list of FCC Registered Amateur Radio Licenses in Noblesville)
FAA Registered Aircraft: 69 (See the full list of FAA Registered Aircraft in Noblesville)
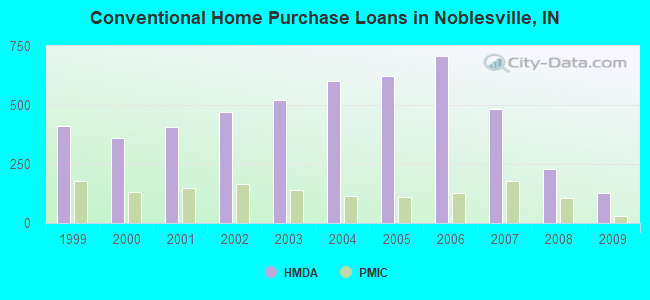
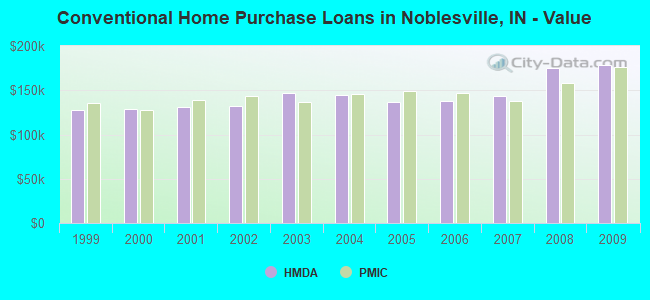
| Home Mortgage Disclosure Act Aggregated Statistics For Year 2009 (Based on 1 full and 4 partial tracts) | ||||||||||||||
| A) FHA, FSA/RHS & VA Home Purchase Loans | B) Conventional Home Purchase Loans | C) Refinancings | D) Home Improvement Loans | E) Loans on Dwellings For 5+ Families | F) Non-occupant Loans on < 5 Family Dwellings (A B C & D) | G) Loans On Manufactured Home Dwelling (A B C & D) | ||||||||
|---|---|---|---|---|---|---|---|---|---|---|---|---|---|---|
| Number | Average Value | Number | Average Value | Number | Average Value | Number | Average Value | Number | Average Value | Number | Average Value | Number | Average Value | |
| LOANS ORIGINATED | 205 | $137,613 | 129 | $178,335 | 739 | $168,855 | 15 | $81,652 | 2 | $7,564,215 | 35 | $115,298 | 2 | $92,760 |
| APPLICATIONS APPROVED, NOT ACCEPTED | 10 | $129,638 | 7 | $168,764 | 53 | $169,937 | 5 | $14,016 | 0 | $0 | 1 | $101,150 | 0 | $0 |
| APPLICATIONS DENIED | 28 | $128,455 | 19 | $159,965 | 214 | $176,987 | 10 | $37,521 | 0 | $0 | 13 | $128,735 | 1 | $91,170 |
| APPLICATIONS WITHDRAWN | 33 | $152,629 | 19 | $190,717 | 138 | $174,200 | 1 | $179,680 | 0 | $0 | 8 | $81,799 | 0 | $0 |
| FILES CLOSED FOR INCOMPLETENESS | 7 | $132,243 | 3 | $166,007 | 30 | $182,792 | 0 | $0 | 0 | $0 | 2 | $116,090 | 0 | $0 |
Detailed HMDA statistics for the following Tracts: 1105.02 , 1105.03, 1105.04, 1106.00, 1107.00
| Private Mortgage Insurance Companies Aggregated Statistics For Year 2009 (Based on 1 full and 4 partial tracts) | ||||
| A) Conventional Home Purchase Loans | B) Refinancings | |||
|---|---|---|---|---|
| Number | Average Value | Number | Average Value | |
| LOANS ORIGINATED | 31 | $176,804 | 42 | $168,494 |
| APPLICATIONS APPROVED, NOT ACCEPTED | 8 | $179,978 | 21 | $166,131 |
| APPLICATIONS DENIED | 4 | $170,352 | 3 | $204,597 |
| APPLICATIONS WITHDRAWN | 2 | $125,520 | 4 | $201,062 |
| FILES CLOSED FOR INCOMPLETENESS | 1 | $146,280 | 1 | $180,710 |
Detailed PMIC statistics for the following Tracts: 1105.02 , 1105.03, 1105.04, 1106.00, 1107.00
2002 - 2017 National Fire Incident Reporting System (NFIRS) incidents
- Fire incident types reported to NFIRS in Noblesville, IN
- 1,14845.2%Outside Fires
- 92336.3%Structure Fires
- 33013.0%Mobile Property/Vehicle Fires
- 1415.5%Other
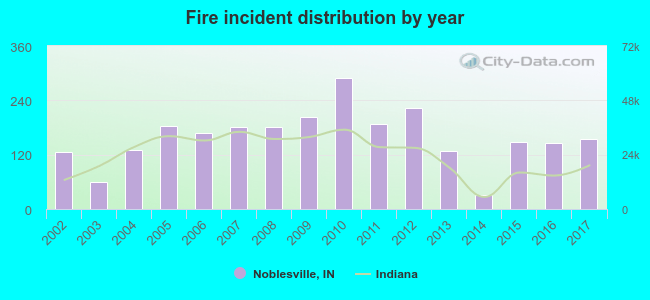 According to the data from the years 2002 - 2017 the average number of fire incidents per year is 159. The highest number of fires - 289 took place in 2010, and the least - 32 in 2014. The data has a growing trend.
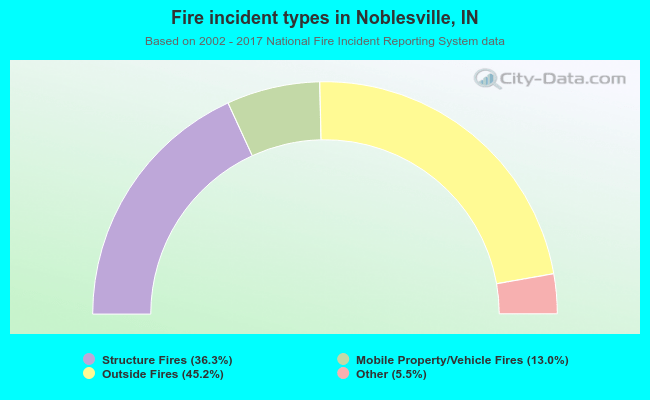 When looking into fire subcategories, the most reports belonged to: Outside Fires (45.2%), and Structure Fires (36.3%).
Fire-safe hotels and motels in Noblesville, Indiana:
- Super 8 Motel, 17070 Dragonfly Ln, Noblesville, Indiana 46060 , Phone: (317) 776-7088, Fax: (317) 776-7088
- Fairfield Inn & Suites Noblesville, 17960 Foundation Dr, Noblesville, Indiana 46060 , Phone: (317) 776-9900, Fax: (317) 776-9951
- Quality Inn & Suites, 16025 Prosperity Dr, Noblesville, Indiana 46060 , Phone: (317) 770-6772, Fax: (317) 770-6786
- Cambria Suites, 13500 Tegler Dr, Noblesville, Indiana 46060 , Phone: (317) 773-4970, Fax: (317) 773-4965
- Courtyard By Marriott Noblesville, 17863 Foundation Dr, Noblesville, Indiana 46060 , Phone: (317) 770-7800, Fax: (317) 770-7822
- Holiday Inn Express & Suites Noblesville, 13625, Noblesville, Indiana 46060 , Phone: (317) 316-0606
- Embassy Suites by Hilton Noblesville Indianapolis Conference Center, 13700 Conference Ctr Drive S, Noblesville, Indiana 46060 , Phone: (317) 674-1900, Fax: (317) 674-1901
| Most common first names in Noblesville, IN among deceased individuals | ||
| Name | Count | Lived (average) |
|---|---|---|
| Mary | 190 | 79.2 years |
| John | 148 | 74.6 years |
| William | 146 | 73.1 years |
| Robert | 135 | 70.6 years |
| Charles | 129 | 74.1 years |
| James | 128 | 68.4 years |
| Helen | 84 | 79.8 years |
| George | 75 | 74.2 years |
| Ruth | 72 | 81.2 years |
| Margaret | 64 | 80.8 years |
| Most common last names in Noblesville, IN among deceased individuals | ||
| Last name | Count | Lived (average) |
|---|---|---|
| Smith | 72 | 75.5 years |
| Wilson | 47 | 76.2 years |
| Brown | 45 | 75.4 years |
| Williams | 40 | 78.8 years |
| Roudebush | 38 | 76.1 years |
| White | 37 | 76.9 years |
| Johnson | 36 | 75.8 years |
| Davis | 31 | 78.0 years |
| Jones | 30 | 75.3 years |
| Clark | 29 | 78.2 years |
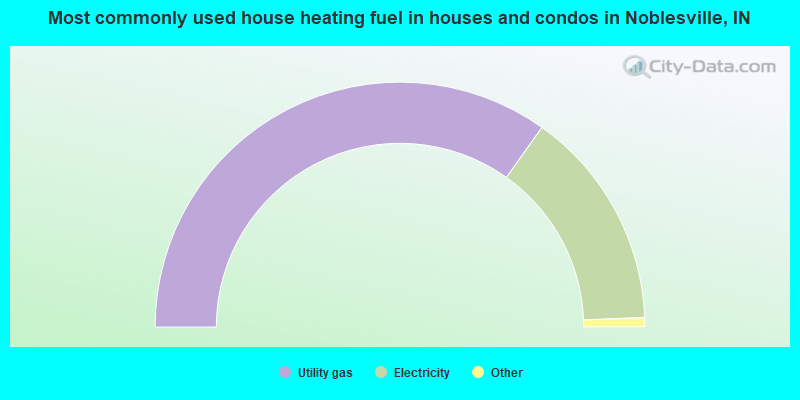
- 69.7%Utility gas
- 29.1%Electricity
- 1.0%Bottled, tank, or LP gas
- 0.1%Fuel oil, kerosene, etc.
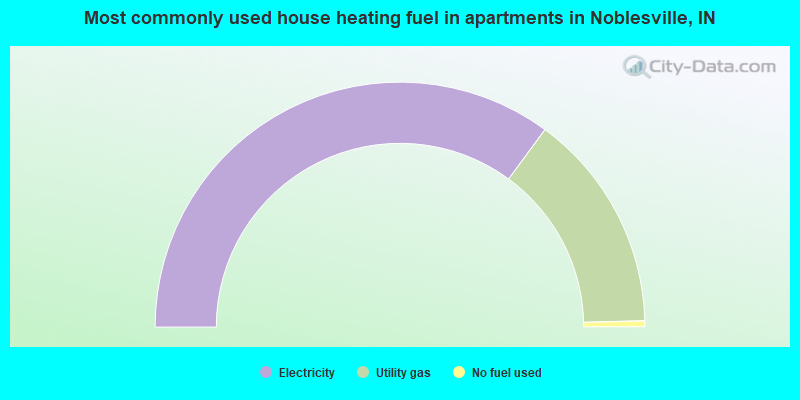
- 70.1%Electricity
- 29.0%Utility gas
- 0.8%No fuel used
Noblesville compared to Indiana state average:
- Median household income above state average.
- Median house value above state average.
- Unemployed percentage significantly below state average.
- Black race population percentage above state average.
- Median age below state average.
- Foreign-born population percentage significantly above state average.
- Length of stay since moving in below state average.
- House age significantly below state average.
- Number of college students above state average.
- Percentage of population with a bachelor's degree or higher significantly above state average.
Noblesville on our top lists:
- #13 on the list of "Top 101 cities with largest percentage of males in occupations: sales and related occupations (population 50,000+)"
- #21 on the list of "Top 101 cities with most building permits per 10,000 residents (population 50,000+)"
- #24 on the list of "Top 101 cities with the largest wind speed differences during a year (population 50,000+)"
- #28 on the list of "Top 101 cities with the largest percentage population increase from 2000 (population 50,000+)"
- #39 on the list of "Top 101 cities with largest percentage of females in occupations: health diagnosing and treating practitioners and other technical occupations (population 50,000+)"
- #42 on the list of "Top 100 fastest growing cities from 2000 to 2014 (pop. 50,000+)"
- #46 on the list of "Top 101 cities with the lowest number of assaults per 100,000 residents (population 50,000+)"
- #55 on the list of "Top 101 cities with largest percentage of males in occupations: architecture and engineering occupations (population 50,000+)"
- #60 on the list of "Top 101 cities with largest percentage population increases in the 1990s) (population 50,000+)"
- #63 on the list of "Top 100 least racially diverse cities (pop. 50,000+)"
- #65 on the list of "Top 101 cities with the highest percentage of English-only speaking households, population 50,000+"
- #66 on the list of "Top 101 cities with largest percentage of males in occupations: community and social service occupations (population 50,000+)"
- #66 on the list of "Top 101 cities with largest percentage of males in industries: information (population 50,000+)"
- #67 on the list of "Top 101 cities with largest percentage of females in occupations: health technologists and technicians (population 50,000+)"
- #68 on the list of "Top 100 cities with highest median household income and median resident age less than 35 (pop. 50,000+)"
- #73 on the list of "Top 101 cities with largest percentage of males in occupations: business and financial operations occupations (population 50,000+)"
- #83 on the list of "Top 101 cities with the least people below the poverty level (population 50,000+)"
- #85 on the list of "Top 101 larger cities with the largest decrease or smallest increase in house/condo value from 2000 (population 50,000+)"
- #87 on the list of "Top 101 cities with the largest city-data.com crime index increase from 2002 to 2012 (population 50,000+)"
- #92 on the list of "Top 100 cities with biggest houses (pop. 50,000+)"
- #28 on the list of "Top 101 counties with the largest number of people moving in compared to moving out (pop. 50,000+)"
- #62 on the list of "Top 101 counties with the largest number of children under 18 without health insurance coverage in 2000"
- #69 on the list of "Top 101 counties with the lowest number of deaths per 1000 residents 2007-2013"
- #71 on the list of "Top 101 counties with the largest decrease in the number of births per 1000 residents 2000-2006 to 2007-2013 (pop 50,000+)"
- #72 on the list of "Top 101 counties with the largest number of people without health insurance coverage in 2000 (pop. 50,000+)"

|
|
Total of 948 patent applications in 2008-2024.