Percentage of residents living in poverty in 2022: 13.9%
(8.7% for White Non-Hispanic residents, 42.6% for Black residents, 27.1% for Hispanic or Latino residents, 19.7% for other race residents, 44.9% for two or more races residents)
According to our research of Georgia and other state lists, there was 1 registered sex offender living in Mount Zion, Georgia as of May 23, 2024. The ratio of all residents to sex offenders in Mount Zion is 1,815 to 1. The ratio of registered sex offenders to all residents in this city is much lower than the state average.
Crime rates in Mount Zion by year
Type
2009
2010
2011
2012
2013
2014
2015
2016
2017
2018
2019
2020
2021
2022
Murders (per 100,000)
0 (0.0)
0 (0.0)
0 (0.0)
0 (0.0)
0 (0.0)
0 (0.0)
0 (0.0)
0 (0.0)
0 (0.0)
0 (0.0)
0 (0.0)
0 (0.0)
0 (0.0)
0 (0.0)
Rapes (per 100,000)
0 (0.0)
0 (0.0)
0 (0.0)
0 (0.0)
0 (0.0)
0 (0.0)
1 (58.0)
0 (0.0)
0 (0.0)
0 (0.0)
0 (0.0)
2 (109.6)
0 (0.0)
1 (49.5)
Robberies (per 100,000)
0 (0.0)
0 (0.0)
0 (0.0)
0 (0.0)
0 (0.0)
0 (0.0)
0 (0.0)
0 (0.0)
0 (0.0)
0 (0.0)
0 (0.0)
1 (54.8)
0 (0.0)
0 (0.0)
Assaults (per 100,000)
1 (62.0)
0 (0.0)
0 (0.0)
0 (0.0)
0 (0.0)
1 (58.1)
0 (0.0)
3 (172.1)
5 (282.2)
2 (110.4)
6 (328.6)
3 (164.4)
1 (52.4)
1 (49.5)
Burglaries (per 100,000)
2 (124.1)
0 (0.0)
7 (407.5)
5 (289.9)
8 (470.6)
10 (581.4)
7 (406.0)
9 (516.4)
1 (56.4)
3 (165.7)
0 (0.0)
1 (54.8)
4 (209.8)
0 (0.0)
Thefts (per 100,000)
5 (310.2)
9 (530.7)
11 (640.3)
4 (231.9)
12 (705.9)
9 (523.3)
14 (812.1)
7 (401.6)
5 (282.2)
6 (331.3)
4 (219.1)
11 (602.7)
6 (314.6)
11 (544.3)
Auto thefts (per 100,000)
0 (0.0)
4 (235.8)
2 (116.4)
0 (0.0)
1 (58.8)
1 (58.1)
0 (0.0)
1 (57.4)
0 (0.0)
0 (0.0)
3 (164.3)
2 (109.6)
2 (104.9)
2 (99.0)
Arson (per 100,000)
0 (0.0)
0 (0.0)
0 (0.0)
0 (0.0)
0 (0.0)
0 (0.0)
0 (0.0)
0 (0.0)
0 (0.0)
0 (0.0)
0 (0.0)
0 (0.0)
0 (0.0)
0 (0.0)
City-Data.com crime index
33.5
40.1
63.4
29.6
65.9
77.9
107.3
91.2
71.7
46.9
87.6
173.7
46.1
79.2
The City-Data.com crime index weighs serious crimes and violent crimes more heavily. Higher means more crime, U.S. average is 246.1. It adjusts for the number of visitors and daily workers commuting into cities.
Latest news from Mount Zion, GA collected exclusively by city-data.com from local newspapers, TV, and radio stations
Ancestries: American (40.8%), Irish (17.3%), German (13.4%), English (7.0%), Eastern European (1.4%).
Current Local Time: EST time zone
Land area: 9.75 square miles.
Population density: 203 people per square mile (very low).
118 residents are foreign born (3.4% Europe, 1.2% Latin America).
This city:
4.8%
Georgia:
10.4%
Median real estate property taxes paid for housing units with mortgages in 2022: $1,344 (0.7%) Median real estate property taxes paid for housing units with no mortgage in 2022: $1,274 (0.4%)
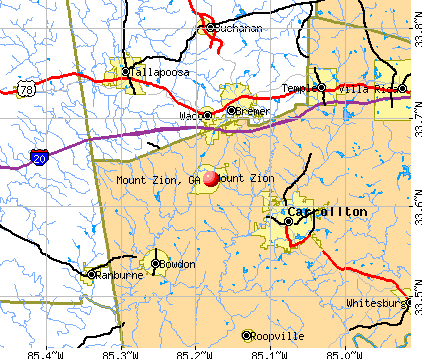
Nearest city with pop. 50,000+: Marietta, GA (43.0 miles , pop. 58,748).
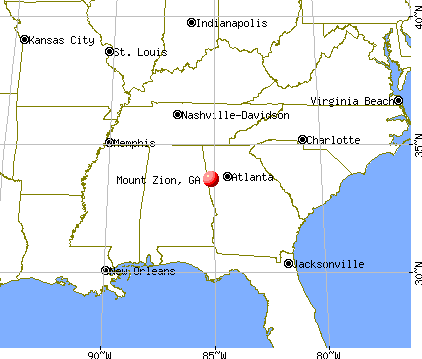
Nearest city with pop. 200,000+: Atlanta, GA (45.6 miles , pop. 416,474).
Nearest city with pop. 1,000,000+: Chicago, IL (584.0 miles , pop. 2,896,016).
Air Quality Index (AQI) level in 2022 was 63.8. This is about average.
City:
63.8
U.S.:
72.6
Carbon Monoxide (CO) [ppm] level in 2015 was 0.248. This is about average.Closest monitor was 22.0 miles away from the city center.
City:
0.248
U.S.:
0.251
Nitrogen Dioxide (NO2) [ppb] level in 2015 was 1.87. This is significantly better than average.Closest monitor was 22.0 miles away from the city center.
City:
1.87
U.S.:
5.11
Ozone [ppb] level in 2022 was 31.1. This is about average.Closest monitor was 22.0 miles away from the city center.
City:
31.1
U.S.:
33.3
Particulate Matter (PM2.5) [µg/m3] level in 2016 was 10.3. This is worse than average.Closest monitor was 22.0 miles away from the city center.
City:
10.3
U.S.:
8.1
Lead (Pb) [µg/m3] level in 2016 was 0.00153. This is significantly better than average.Closest monitor was 6.2 miles away from the city center.
City:
0.00153
U.S.:
0.00931
Tornado activity:
Mount Zion-area historical tornado activity is above Georgia state average. It is 88% greater than the overall U.S. average.
On 3/27/1994, a category F4 (max. wind speeds 207-260 mph) tornado 30.2 miles away from the Mount Zion city center killed 22 peopleand injured 150 peopleand causedbetween $5,000,000 and $50,000,000 in damages.
On 4/28/1964, a category F3 (max. wind speeds 158-206 mph) tornado 7.1 miles away from the city center injured 10 peopleand causedbetween $5000 and $50,000 in damages.
Earthquake activity:
Mount Zion-area historical earthquake activity is significantly above Georgia state average. It is 74% greater than the overall U.S. average.
On 4/29/2003 at 08:59:39, a magnitude 4.9 (4.4 MB, 4.6 MW, 4.9 LG, Class: Light, Intensity: IV - V) earthquake occurred 65.0 miles away from Mount Zion center On 4/29/2003 at 08:59:39, a magnitude 4.6 (4.6 MW, Depth: 12.3 mi) earthquake occurred 65.0 miles away from Mount Zion center On 1/18/1999 at 07:00:53, a magnitude 4.8 (4.8 MB, 4.0 LG, Depth: 0.6 mi) earthquake occurred 120.7 miles away from Mount Zion center On 8/2/1974 at 08:52:09, a magnitude 4.9 (4.3 MB, 4.9 LG) earthquake occurred 155.7 miles away from the city center On 11/30/1973 at 07:48:41, a magnitude 4.7 (4.7 MB, 4.6 ML) earthquake occurred 165.2 miles away from the city center On 10/24/1997 at 08:35:17, a magnitude 4.9 (4.8 MB, 4.2 MS, 4.9 LG, Depth: 6.2 mi) earthquake occurred 212.2 miles away from the city center Magnitude types: regional Lg-wave magnitude (LG), body-wave magnitude (MB), local magnitude (ML), surface-wave magnitude (MS), moment magnitude (MW)
Natural disasters:
The number of natural disasters in Carroll County (16) is near the US average (15). Major Disasters (Presidential) Declared: 11 Emergencies Declared: 4
Causes of natural disasters: Floods: 6, Storms: 5, Tornadoes: 4, Winter Storms: 4, Hurricanes: 3, Heavy Rains: 2, Drought: 1, Snowfall: 1, Tropical Storm: 1, Wind: 1, Other: 1 (Note: some incidents may be assigned to more than one category).
Hospitals and medical centers near Mount Zion:
BAGWELL NH (Nursing Home, about 4 miles away; CARROLLTON, GA)
CARROLL CONVALESCENT CENTER (Nursing Home, about 4 miles away; CARROLLTON, GA)
CARROLLTON NURSING AND REHAB CTR (Nursing Home, about 4 miles away; CARROLLTON, GA)
NORTH CARROLLTON DIALYSIS (Dialysis Facility, about 6 miles away; CARROLLTON, GA)
HIGGINS GENERAL HOSPITAL Critical Access Hospitals (about 7 miles away; BREMEN, GA)
HARALSON CO NH (Nursing Home, about 7 miles away; BREMEN, GA)
HARALSON NSG AND REHAB CENTER (Nursing Home, about 7 miles away; BREMEN, GA)
Colleges/universities with over 2000 students nearest to Mount Zion:
West Georgia Technical College (about 5 miles; Waco, GA; Full-time enrollment: 4,768)
University of West Georgia (about 7 miles; Carrollton, GA; FT enrollment: 10,358)
Jacksonville State University (about 37 miles; Jacksonville, AL; FT enrollment: 7,566)
Georgia Highlands College (about 38 miles; Rome, GA; FT enrollment: 4,071)
Georgia Northwestern Technical College (about 42 miles; Rome, GA; FT enrollment: 4,629)
Southern Union State Community College (about 42 miles; Wadley, AL; FT enrollment: 4,120)
Chattahoochee Technical College (about 42 miles; Marietta, GA; FT enrollment: 8,173)
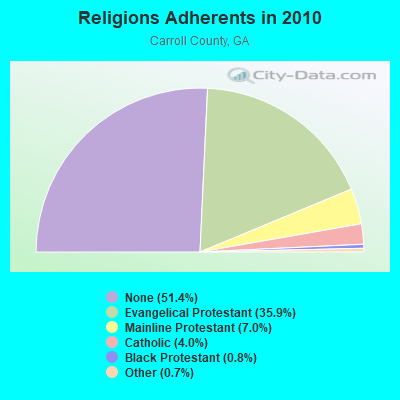
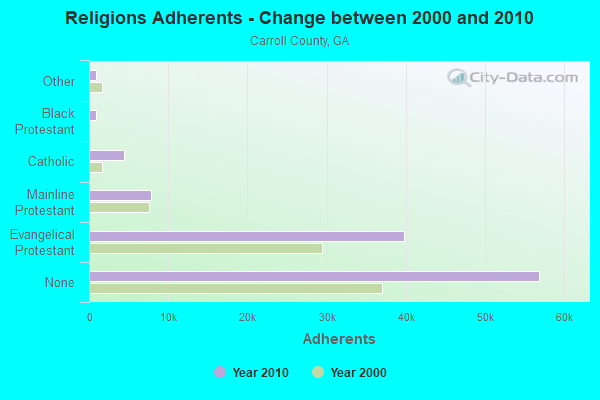
Religion statistics for Mount Zion, GA (based on Carroll County data)
Religion
Adherents
Congregations
Evangelical Protestant
39,730
116
Mainline Protestant
7,792
28
Catholic
4,462
1
Black Protestant
867
6
Other
826
3
None
56,850
-
Source: Clifford Grammich, Kirk Hadaway, Richard Houseal, Dale E.Jones, Alexei Krindatch, Richie Stanley and Richard H.Taylor. 2012. 2010 U.S.Religion Census: Religious Congregations & Membership Study. Association of Statisticians of American Religious Bodies. Jones, Dale E., et al. 2002. Congregations and Membership in the United States 2000. Nashville, TN: Glenmary Research Center. Graphs represent county-level data
Call Sign: AD4CE, Previous Call Sign: N4ZUO, Grant Date: 03/23/1993, Expiration Date: 03/23/2003, Cancellation Date: 03/24/2005, Registrant: John E Deegan, 11 Boudon Jct Rd, Mount Zion, GA 30150
Call Sign: K4SEZ, Previous Call Sign: KD5BCA, Licensee ID: L00749593, Grant Date: 12/06/2023, Expiration Date: 12/06/2033, Certifier: Mary K Royle, Registrant: Mary K Royle, Mount Zion, GA 30150
Home Mortgage Disclosure Act Aggregated Statistics For Year 2009 (Based on 1 partial tract)
A) FHA, FSA/RHS & VA Home Purchase Loans
B) Conventional Home Purchase Loans
C) Refinancings
D) Home Improvement Loans
F) Non-occupant Loans on < 5 Family Dwellings (A B C & D)
G) Loans On Manufactured Home Dwelling (A B C & D)
Number
Average Value
Number
Average Value
Number
Average Value
Number
Average Value
Number
Average Value
Number
Average Value
LOANS ORIGINATED
3
$83,473
3
$52,633
16
$130,610
2
$15,305
4
$64,908
2
$44,955
APPLICATIONS APPROVED, NOT ACCEPTED
0
$0
0
$0
1
$111,300
0
$0
0
$0
0
$0
APPLICATIONS DENIED
1
$32,350
1
$68,340
9
$136,608
2
$43,040
1
$21,560
1
$50,600
APPLICATIONS WITHDRAWN
1
$66,950
0
$0
6
$128,425
0
$0
0
$0
0
$0
FILES CLOSED FOR INCOMPLETENESS
0
$0
0
$0
2
$118,600
0
$0
0
$0
0
$0
Aggregated Statistics For Year 2008 (Based on 1 partial tract)
A) FHA, FSA/RHS & VA Home Purchase Loans
B) Conventional Home Purchase Loans
C) Refinancings
D) Home Improvement Loans
F) Non-occupant Loans on < 5 Family Dwellings (A B C & D)
G) Loans On Manufactured Home Dwelling (A B C & D)
Number
Average Value
Number
Average Value
Number
Average Value
Number
Average Value
Number
Average Value
Number
Average Value
LOANS ORIGINATED
3
$100,573
5
$112,130
23
$128,686
4
$25,085
8
$117,186
7
$58,331
APPLICATIONS APPROVED, NOT ACCEPTED
0
$0
1
$38,080
2
$76,950
0
$0
0
$0
1
$49,740
APPLICATIONS DENIED
0
$0
2
$91,035
13
$124,552
4
$24,910
1
$57,210
2
$71,735
APPLICATIONS WITHDRAWN
1
$91,470
0
$0
7
$139,741
1
$6,960
1
$60,170
1
$30,780
FILES CLOSED FOR INCOMPLETENESS
0
$0
0
$0
0
$0
0
$0
0
$0
0
$0
Aggregated Statistics For Year 2007 (Based on 1 partial tract)
A) FHA, FSA/RHS & VA Home Purchase Loans
B) Conventional Home Purchase Loans
C) Refinancings
D) Home Improvement Loans
F) Non-occupant Loans on < 5 Family Dwellings (A B C & D)
G) Loans On Manufactured Home Dwelling (A B C & D)
Number
Average Value
Number
Average Value
Number
Average Value
Number
Average Value
Number
Average Value
Number
Average Value
LOANS ORIGINATED
4
$120,860
10
$125,678
23
$142,386
5
$19,164
6
$126,078
4
$45,780
APPLICATIONS APPROVED, NOT ACCEPTED
0
$0
1
$129,380
3
$141,440
1
$49,740
1
$46,260
0
$0
APPLICATIONS DENIED
1
$73,560
2
$108,080
19
$122,270
3
$34,663
1
$133,030
3
$85,500
APPLICATIONS WITHDRAWN
0
$0
2
$142,685
9
$181,242
1
$71,820
1
$69,730
0
$0
FILES CLOSED FOR INCOMPLETENESS
0
$0
0
$0
2
$121,470
0
$0
0
$0
0
$0
Aggregated Statistics For Year 2006 (Based on 1 partial tract)
A) FHA, FSA/RHS & VA Home Purchase Loans
B) Conventional Home Purchase Loans
C) Refinancings
D) Home Improvement Loans
F) Non-occupant Loans on < 5 Family Dwellings (A B C & D)
G) Loans On Manufactured Home Dwelling (A B C & D)
Number
Average Value
Number
Average Value
Number
Average Value
Number
Average Value
Number
Average Value
Number
Average Value
LOANS ORIGINATED
5
$115,400
12
$101,949
26
$121,081
4
$20,432
8
$92,950
3
$59,357
APPLICATIONS APPROVED, NOT ACCEPTED
0
$0
1
$108,170
5
$107,262
1
$13,040
0
$0
1
$65,560
APPLICATIONS DENIED
1
$142,250
5
$102,322
17
$123,582
4
$26,780
2
$118,600
4
$67,778
APPLICATIONS WITHDRAWN
0
$0
2
$121,815
13
$142,785
1
$40,340
1
$66,600
1
$63,300
FILES CLOSED FOR INCOMPLETENESS
0
$0
0
$0
4
$112,295
0
$0
0
$0
0
$0
Aggregated Statistics For Year 2005 (Based on 1 partial tract)
A) FHA, FSA/RHS & VA Home Purchase Loans
B) Conventional Home Purchase Loans
C) Refinancings
D) Home Improvement Loans
F) Non-occupant Loans on < 5 Family Dwellings (A B C & D)
G) Loans On Manufactured Home Dwelling (A B C & D)
Number
Average Value
Number
Average Value
Number
Average Value
Number
Average Value
Number
Average Value
Number
Average Value
LOANS ORIGINATED
4
$112,210
14
$95,161
26
$111,891
4
$41,170
8
$81,732
5
$62,534
APPLICATIONS APPROVED, NOT ACCEPTED
0
$0
2
$80,865
5
$115,156
0
$0
1
$31,650
1
$74,430
APPLICATIONS DENIED
1
$81,910
6
$73,560
21
$112,215
4
$55,865
2
$133,730
4
$68,342
APPLICATIONS WITHDRAWN
1
$62,950
2
$103,730
12
$123,295
1
$142,950
0
$0
0
$0
FILES CLOSED FOR INCOMPLETENESS
0
$0
0
$0
4
$108,688
0
$0
0
$0
0
$0
Aggregated Statistics For Year 2004 (Based on 1 partial tract)
A) FHA, FSA/RHS & VA Home Purchase Loans
B) Conventional Home Purchase Loans
C) Refinancings
D) Home Improvement Loans
F) Non-occupant Loans on < 5 Family Dwellings (A B C & D)
G) Loans On Manufactured Home Dwelling (A B C & D)
Number
Average Value
Number
Average Value
Number
Average Value
Number
Average Value
Number
Average Value
Number
Average Value
LOANS ORIGINATED
5
$93,246
12
$104,732
27
$99,239
5
$34,120
8
$89,080
5
$63,022
APPLICATIONS APPROVED, NOT ACCEPTED
0
$0
1
$196,160
5
$95,958
1
$18,960
1
$36,520
2
$75,385
APPLICATIONS DENIED
1
$64,860
4
$124,165
18
$95,191
2
$42,520
2
$83,035
2
$68,690
APPLICATIONS WITHDRAWN
0
$0
2
$95,125
7
$97,831
1
$54,950
1
$60,690
1
$62,080
FILES CLOSED FOR INCOMPLETENESS
0
$0
0
$0
2
$108,165
0
$0
0
$0
0
$0
Aggregated Statistics For Year 2003 (Based on 1 partial tract)
A) FHA, FSA/RHS & VA Home Purchase Loans
B) Conventional Home Purchase Loans
C) Refinancings
D) Home Improvement Loans
F) Non-occupant Loans on < 5 Family Dwellings (A B C & D)
Number
Average Value
Number
Average Value
Number
Average Value
Number
Average Value
Number
Average Value
LOANS ORIGINATED
3
$109,963
13
$105,718
37
$99,029
5
$42,884
7
$79,571
APPLICATIONS APPROVED, NOT ACCEPTED
0
$0
1
$102,950
4
$90,340
0
$0
0
$0
APPLICATIONS DENIED
1
$63,300
3
$83,530
17
$96,095
2
$39,995
1
$53,210
APPLICATIONS WITHDRAWN
1
$53,210
1
$93,730
5
$115,852
1
$117,900
0
$0
FILES CLOSED FOR INCOMPLETENESS
0
$0
1
$41,390
2
$120,515
0
$0
0
$0
Aggregated Statistics For Year 2002 (Based on 1 partial tract)
A) FHA, FSA/RHS & VA Home Purchase Loans
B) Conventional Home Purchase Loans
C) Refinancings
D) Home Improvement Loans
F) Non-occupant Loans on < 5 Family Dwellings (A B C & D)
Number
Average Value
Number
Average Value
Number
Average Value
Number
Average Value
Number
Average Value
LOANS ORIGINATED
2
$94,080
12
$88,399
29
$98,967
5
$37,458
7
$72,441
APPLICATIONS APPROVED, NOT ACCEPTED
0
$0
2
$68,345
6
$99,500
0
$0
0
$0
APPLICATIONS DENIED
1
$46,260
2
$75,040
15
$81,315
2
$14,610
1
$63,470
APPLICATIONS WITHDRAWN
0
$0
1
$69,910
6
$110,717
0
$0
0
$0
FILES CLOSED FOR INCOMPLETENESS
0
$0
0
$0
3
$98,600
0
$0
0
$0
Aggregated Statistics For Year 2001 (Based on 1 partial tract)
A) FHA, FSA/RHS & VA Home Purchase Loans
B) Conventional Home Purchase Loans
C) Refinancings
D) Home Improvement Loans
F) Non-occupant Loans on < 5 Family Dwellings (A B C & D)
Number
Average Value
Number
Average Value
Number
Average Value
Number
Average Value
Number
Average Value
LOANS ORIGINATED
4
$95,168
11
$82,428
25
$80,349
4
$11,825
4
$79,342
APPLICATIONS APPROVED, NOT ACCEPTED
0
$0
3
$45,620
4
$65,560
1
$28,170
0
$0
APPLICATIONS DENIED
0
$0
8
$58,712
13
$66,898
3
$11,537
1
$89,040
APPLICATIONS WITHDRAWN
0
$0
1
$70,950
6
$83,327
1
$4,350
0
$0
FILES CLOSED FOR INCOMPLETENESS
0
$0
0
$0
1
$103,470
0
$0
0
$0
Aggregated Statistics For Year 2000 (Based on 1 partial tract)
A) FHA, FSA/RHS & VA Home Purchase Loans
B) Conventional Home Purchase Loans
C) Refinancings
D) Home Improvement Loans
F) Non-occupant Loans on < 5 Family Dwellings (A B C & D)
Number
Average Value
Number
Average Value
Number
Average Value
Number
Average Value
Number
Average Value
LOANS ORIGINATED
3
$72,690
11
$80,911
9
$78,448
5
$22,676
4
$75,690
APPLICATIONS APPROVED, NOT ACCEPTED
0
$0
2
$54,520
3
$56,113
2
$18,175
0
$0
APPLICATIONS DENIED
1
$58,780
10
$50,222
9
$49,213
3
$23,823
1
$80,170
APPLICATIONS WITHDRAWN
1
$36,690
0
$0
4
$51,518
1
$12,170
0
$0
FILES CLOSED FOR INCOMPLETENESS
0
$0
0
$0
3
$73,850
0
$0
0
$0
Aggregated Statistics For Year 1999 (Based on 1 partial tract)
A) FHA, FSA/RHS & VA Home Purchase Loans
B) Conventional Home Purchase Loans
C) Refinancings
D) Home Improvement Loans
F) Non-occupant Loans on < 5 Family Dwellings (A B C & D)


 Recent articles from our blog. Our writers, many of them Ph.D. graduates or candidates, create easy-to-read articles on a wide variety of topics.

 (43.0 miles