Matthews, North Carolina Submit your own pictures of this town and show them to the world
OSM Map
General Map
Google Map
MSN Map
OSM Map
General Map
Google Map
MSN Map
OSM Map
General Map
Google Map
MSN Map
OSM Map
General Map
Google Map
MSN Map
Please wait while loading the map...
Population in 2022: 30,124 (100% urban, 0% rural). Population change since 2000: +36.1%Males: 14,996 Females: 15,128
March 2022 cost of living index in Matthews: 93.2 (less than average, U.S. average is 100) Percentage of residents living in poverty in 2022: 4.8%for White Non-Hispanic residents , 10.2% for Black residents , 11.4% for Hispanic or Latino residents , 13.1% for American Indian residents , 21.0% for other race residents , 1.5% for two or more races residents )
Profiles of local businesses
Business Search - 14 Million verified businesses
Data:
Median household income ($)
Median household income (% change since 2000)
Household income diversity
Ratio of average income to average house value (%)
Ratio of average income to average rent
Median household income ($) - White
Median household income ($) - Black or African American
Median household income ($) - Asian
Median household income ($) - Hispanic or Latino
Median household income ($) - American Indian and Alaska Native
Median household income ($) - Multirace
Median household income ($) - Other Race
Median household income for houses/condos with a mortgage ($)
Median household income for apartments without a mortgage ($)
Races - White alone (%)
Races - White alone (% change since 2000)
Races - Black alone (%)
Races - Black alone (% change since 2000)
Races - American Indian alone (%)
Races - American Indian alone (% change since 2000)
Races - Asian alone (%)
Races - Asian alone (% change since 2000)
Races - Hispanic (%)
Races - Hispanic (% change since 2000)
Races - Native Hawaiian and Other Pacific Islander alone (%)
Races - Native Hawaiian and Other Pacific Islander alone (% change since 2000)
Races - Two or more races (%)
Races - Two or more races (% change since 2000)
Races - Other race alone (%)
Races - Other race alone (% change since 2000)
Racial diversity
Unemployment (%)
Unemployment (% change since 2000)
Unemployment (%) - White
Unemployment (%) - Black or African American
Unemployment (%) - Asian
Unemployment (%) - Hispanic or Latino
Unemployment (%) - American Indian and Alaska Native
Unemployment (%) - Multirace
Unemployment (%) - Other Race
Population density (people per square mile)
Population - Males (%)
Population - Females (%)
Population - Males (%) - White
Population - Males (%) - Black or African American
Population - Males (%) - Asian
Population - Males (%) - Hispanic or Latino
Population - Males (%) - American Indian and Alaska Native
Population - Males (%) - Multirace
Population - Males (%) - Other Race
Population - Females (%) - White
Population - Females (%) - Black or African American
Population - Females (%) - Asian
Population - Females (%) - Hispanic or Latino
Population - Females (%) - American Indian and Alaska Native
Population - Females (%) - Multirace
Population - Females (%) - Other Race
Coronavirus confirmed cases (May 13, 2024)
Deaths caused by coronavirus (May 13, 2024)
Coronavirus confirmed cases (per 100k population) (May 13, 2024)
Deaths caused by coronavirus (per 100k population) (May 13, 2024)
Daily increase in number of cases (May 13, 2024)
Weekly increase in number of cases (May 13, 2024)
Cases doubled (in days) (May 13, 2024)
Hospitalized patients (Apr 18, 2022)
Negative test results (Apr 18, 2022)
Total test results (Apr 18, 2022)
COVID Vaccine doses distributed (per 100k population) (Sep 19, 2023)
COVID Vaccine doses administered (per 100k population) (Sep 19, 2023)
COVID Vaccine doses distributed (Sep 19, 2023)
COVID Vaccine doses administered (Sep 19, 2023)
Likely homosexual households (%)
Likely homosexual households (% change since 2000)
Likely homosexual households - Lesbian couples (%)
Likely homosexual households - Lesbian couples (% change since 2000)
Likely homosexual households - Gay men (%)
Likely homosexual households - Gay men (% change since 2000)
Cost of living index
Median gross rent ($)
Median contract rent ($)
Median monthly housing costs ($)
Median house or condo value ($)
Median house or condo value ($ change since 2000)
Mean house or condo value by units in structure - 1, detached ($)
Mean house or condo value by units in structure - 1, attached ($)
Mean house or condo value by units in structure - 2 ($)
Mean house or condo value by units in structure by units in structure - 3 or 4 ($)
Mean house or condo value by units in structure - 5 or more ($)
Mean house or condo value by units in structure - Boat, RV, van, etc. ($)
Mean house or condo value by units in structure - Mobile home ($)
Median house or condo value ($) - White
Median house or condo value ($) - Black or African American
Median house or condo value ($) - Asian
Median house or condo value ($) - Hispanic or Latino
Median house or condo value ($) - American Indian and Alaska Native
Median house or condo value ($) - Multirace
Median house or condo value ($) - Other Race
Median resident age
Resident age diversity
Median resident age - Males
Median resident age - Females
Median resident age - White
Median resident age - Black or African American
Median resident age - Asian
Median resident age - Hispanic or Latino
Median resident age - American Indian and Alaska Native
Median resident age - Multirace
Median resident age - Other Race
Median resident age - Males - White
Median resident age - Males - Black or African American
Median resident age - Males - Asian
Median resident age - Males - Hispanic or Latino
Median resident age - Males - American Indian and Alaska Native
Median resident age - Males - Multirace
Median resident age - Males - Other Race
Median resident age - Females - White
Median resident age - Females - Black or African American
Median resident age - Females - Asian
Median resident age - Females - Hispanic or Latino
Median resident age - Females - American Indian and Alaska Native
Median resident age - Females - Multirace
Median resident age - Females - Other Race
Commute - mean travel time to work (minutes)
Travel time to work - Less than 5 minutes (%)
Travel time to work - Less than 5 minutes (% change since 2000)
Travel time to work - 5 to 9 minutes (%)
Travel time to work - 5 to 9 minutes (% change since 2000)
Travel time to work - 10 to 19 minutes (%)
Travel time to work - 10 to 19 minutes (% change since 2000)
Travel time to work - 20 to 29 minutes (%)
Travel time to work - 20 to 29 minutes (% change since 2000)
Travel time to work - 30 to 39 minutes (%)
Travel time to work - 30 to 39 minutes (% change since 2000)
Travel time to work - 40 to 59 minutes (%)
Travel time to work - 40 to 59 minutes (% change since 2000)
Travel time to work - 60 to 89 minutes (%)
Travel time to work - 60 to 89 minutes (% change since 2000)
Travel time to work - 90 or more minutes (%)
Travel time to work - 90 or more minutes (% change since 2000)
Marital status - Never married (%)
Marital status - Now married (%)
Marital status - Separated (%)
Marital status - Widowed (%)
Marital status - Divorced (%)
Median family income ($)
Median family income (% change since 2000)
Median non-family income ($)
Median non-family income (% change since 2000)
Median per capita income ($)
Median per capita income (% change since 2000)
Median family income ($) - White
Median family income ($) - Black or African American
Median family income ($) - Asian
Median family income ($) - Hispanic or Latino
Median family income ($) - American Indian and Alaska Native
Median family income ($) - Multirace
Median family income ($) - Other Race
Median year house/condo built
Median year apartment built
Year house built - Built 2005 or later (%)
Year house built - Built 2000 to 2004 (%)
Year house built - Built 1990 to 1999 (%)
Year house built - Built 1980 to 1989 (%)
Year house built - Built 1970 to 1979 (%)
Year house built - Built 1960 to 1969 (%)
Year house built - Built 1950 to 1959 (%)
Year house built - Built 1940 to 1949 (%)
Year house built - Built 1939 or earlier (%)
Average household size
Household density (households per square mile)
Average household size - White
Average household size - Black or African American
Average household size - Asian
Average household size - Hispanic or Latino
Average household size - American Indian and Alaska Native
Average household size - Multirace
Average household size - Other Race
Occupied housing units (%)
Vacant housing units (%)
Owner occupied housing units (%)
Renter occupied housing units (%)
Vacancy status - For rent (%)
Vacancy status - For sale only (%)
Vacancy status - Rented or sold, not occupied (%)
Vacancy status - For seasonal, recreational, or occasional use (%)
Vacancy status - For migrant workers (%)
Vacancy status - Other vacant (%)
Residents with income below the poverty level (%)
Residents with income below 50% of the poverty level (%)
Children below poverty level (%)
Poor families by family type - Married-couple family (%)
Poor families by family type - Male, no wife present (%)
Poor families by family type - Female, no husband present (%)
Poverty status for native-born residents (%)
Poverty status for foreign-born residents (%)
Poverty among high school graduates not in families (%)
Poverty among people who did not graduate high school not in families (%)
Residents with income below the poverty level (%) - White
Residents with income below the poverty level (%) - Black or African American
Residents with income below the poverty level (%) - Asian
Residents with income below the poverty level (%) - Hispanic or Latino
Residents with income below the poverty level (%) - American Indian and Alaska Native
Residents with income below the poverty level (%) - Multirace
Residents with income below the poverty level (%) - Other Race
Air pollution - Air Quality Index (AQI)
Air pollution - CO
Air pollution - NO2
Air pollution - SO2
Air pollution - Ozone
Air pollution - PM10
Air pollution - PM25
Air pollution - Pb
Crime - Murders per 100,000 population
Crime - Rapes per 100,000 population
Crime - Robberies per 100,000 population
Crime - Assaults per 100,000 population
Crime - Burglaries per 100,000 population
Crime - Thefts per 100,000 population
Crime - Auto thefts per 100,000 population
Crime - Arson per 100,000 population
Crime - City-data.com crime index
Crime - Violent crime index
Crime - Property crime index
Crime - Murders per 100,000 population (5 year average)
Crime - Rapes per 100,000 population (5 year average)
Crime - Robberies per 100,000 population (5 year average)
Crime - Assaults per 100,000 population (5 year average)
Crime - Burglaries per 100,000 population (5 year average)
Crime - Thefts per 100,000 population (5 year average)
Crime - Auto thefts per 100,000 population (5 year average)
Crime - Arson per 100,000 population (5 year average)
Crime - City-data.com crime index (5 year average)
Crime - Violent crime index (5 year average)
Crime - Property crime index (5 year average)
1996 Presidential Elections Results (%) - Democratic Party (Clinton)
1996 Presidential Elections Results (%) - Republican Party (Dole)
1996 Presidential Elections Results (%) - Other
2000 Presidential Elections Results (%) - Democratic Party (Gore)
2000 Presidential Elections Results (%) - Republican Party (Bush)
2000 Presidential Elections Results (%) - Other
2004 Presidential Elections Results (%) - Democratic Party (Kerry)
2004 Presidential Elections Results (%) - Republican Party (Bush)
2004 Presidential Elections Results (%) - Other
2008 Presidential Elections Results (%) - Democratic Party (Obama)
2008 Presidential Elections Results (%) - Republican Party (McCain)
2008 Presidential Elections Results (%) - Other
2012 Presidential Elections Results (%) - Democratic Party (Obama)
2012 Presidential Elections Results (%) - Republican Party (Romney)
2012 Presidential Elections Results (%) - Other
2016 Presidential Elections Results (%) - Democratic Party (Clinton)
2016 Presidential Elections Results (%) - Republican Party (Trump)
2016 Presidential Elections Results (%) - Other
2020 Presidential Elections Results (%) - Democratic Party (Biden)
2020 Presidential Elections Results (%) - Republican Party (Trump)
2020 Presidential Elections Results (%) - Other
Ancestries Reported - Arab (%)
Ancestries Reported - Czech (%)
Ancestries Reported - Danish (%)
Ancestries Reported - Dutch (%)
Ancestries Reported - English (%)
Ancestries Reported - French (%)
Ancestries Reported - French Canadian (%)
Ancestries Reported - German (%)
Ancestries Reported - Greek (%)
Ancestries Reported - Hungarian (%)
Ancestries Reported - Irish (%)
Ancestries Reported - Italian (%)
Ancestries Reported - Lithuanian (%)
Ancestries Reported - Norwegian (%)
Ancestries Reported - Polish (%)
Ancestries Reported - Portuguese (%)
Ancestries Reported - Russian (%)
Ancestries Reported - Scotch-Irish (%)
Ancestries Reported - Scottish (%)
Ancestries Reported - Slovak (%)
Ancestries Reported - Subsaharan African (%)
Ancestries Reported - Swedish (%)
Ancestries Reported - Swiss (%)
Ancestries Reported - Ukrainian (%)
Ancestries Reported - United States (%)
Ancestries Reported - Welsh (%)
Ancestries Reported - West Indian (%)
Ancestries Reported - Other (%)
Educational Attainment - No schooling completed (%)
Educational Attainment - Less than high school (%)
Educational Attainment - High school or equivalent (%)
Educational Attainment - Less than 1 year of college (%)
Educational Attainment - 1 or more years of college (%)
Educational Attainment - Associate degree (%)
Educational Attainment - Bachelor's degree (%)
Educational Attainment - Master's degree (%)
Educational Attainment - Professional school degree (%)
Educational Attainment - Doctorate degree (%)
School Enrollment - Nursery, preschool (%)
School Enrollment - Kindergarten (%)
School Enrollment - Grade 1 to 4 (%)
School Enrollment - Grade 5 to 8 (%)
School Enrollment - Grade 9 to 12 (%)
School Enrollment - College undergrad (%)
School Enrollment - Graduate or professional (%)
School Enrollment - Not enrolled in school (%)
School enrollment - Public schools (%)
School enrollment - Private schools (%)
School enrollment - Not enrolled (%)
Median number of rooms in houses and condos
Median number of rooms in apartments
Housing units lacking complete plumbing facilities (%)
Housing units lacking complete kitchen facilities (%)
Density of houses
Urban houses (%)
Rural houses (%)
Households with people 60 years and over (%)
Households with people 65 years and over (%)
Households with people 75 years and over (%)
Households with one or more nonrelatives (%)
Households with no nonrelatives (%)
Population in households (%)
Family households (%)
Nonfamily households (%)
Population in families (%)
Family households with own children (%)
Median number of bedrooms in owner occupied houses
Mean number of bedrooms in owner occupied houses
Median number of bedrooms in renter occupied houses
Mean number of bedrooms in renter occupied houses
Median number of vehichles in owner occupied houses
Mean number of vehichles in owner occupied houses
Median number of vehichles in renter occupied houses
Mean number of vehichles in renter occupied houses
Mortgage status - with mortgage (%)
Mortgage status - with second mortgage (%)
Mortgage status - with home equity loan (%)
Mortgage status - with both second mortgage and home equity loan (%)
Mortgage status - without a mortgage (%)
Average family size
Average family size - White
Average family size - Black or African American
Average family size - Asian
Average family size - Hispanic or Latino
Average family size - American Indian and Alaska Native
Average family size - Multirace
Average family size - Other Race
Geographical mobility - Same house 1 year ago (%)
Geographical mobility - Moved within same county (%)
Geographical mobility - Moved from different county within same state (%)
Geographical mobility - Moved from different state (%)
Geographical mobility - Moved from abroad (%)
Place of birth - Born in state of residence (%)
Place of birth - Born in other state (%)
Place of birth - Native, outside of US (%)
Place of birth - Foreign born (%)
Housing units in structures - 1, detached (%)
Housing units in structures - 1, attached (%)
Housing units in structures - 2 (%)
Housing units in structures - 3 or 4 (%)
Housing units in structures - 5 to 9 (%)
Housing units in structures - 10 to 19 (%)
Housing units in structures - 20 to 49 (%)
Housing units in structures - 50 or more (%)
Housing units in structures - Mobile home (%)
Housing units in structures - Boat, RV, van, etc. (%)
House/condo owner moved in on average (years ago)
Renter moved in on average (years ago)
Year householder moved into unit - Moved in 1999 to March 2000 (%)
Year householder moved into unit - Moved in 1995 to 1998 (%)
Year householder moved into unit - Moved in 1990 to 1994 (%)
Year householder moved into unit - Moved in 1980 to 1989 (%)
Year householder moved into unit - Moved in 1970 to 1979 (%)
Year householder moved into unit - Moved in 1969 or earlier (%)
Means of transportation to work - Drove car alone (%)
Means of transportation to work - Carpooled (%)
Means of transportation to work - Public transportation (%)
Means of transportation to work - Bus or trolley bus (%)
Means of transportation to work - Streetcar or trolley car (%)
Means of transportation to work - Subway or elevated (%)
Means of transportation to work - Railroad (%)
Means of transportation to work - Ferryboat (%)
Means of transportation to work - Taxicab (%)
Means of transportation to work - Motorcycle (%)
Means of transportation to work - Bicycle (%)
Means of transportation to work - Walked (%)
Means of transportation to work - Other means (%)
Working at home (%)
Industry diversity
Most Common Industries - Agriculture, forestry, fishing and hunting, and mining (%)
Most Common Industries - Agriculture, forestry, fishing and hunting (%)
Most Common Industries - Mining, quarrying, and oil and gas extraction (%)
Most Common Industries - Construction (%)
Most Common Industries - Manufacturing (%)
Most Common Industries - Wholesale trade (%)
Most Common Industries - Retail trade (%)
Most Common Industries - Transportation and warehousing, and utilities (%)
Most Common Industries - Transportation and warehousing (%)
Most Common Industries - Utilities (%)
Most Common Industries - Information (%)
Most Common Industries - Finance and insurance, and real estate and rental and leasing (%)
Most Common Industries - Finance and insurance (%)
Most Common Industries - Real estate and rental and leasing (%)
Most Common Industries - Professional, scientific, and management, and administrative and waste management services (%)
Most Common Industries - Professional, scientific, and technical services (%)
Most Common Industries - Management of companies and enterprises (%)
Most Common Industries - Administrative and support and waste management services (%)
Most Common Industries - Educational services, and health care and social assistance (%)
Most Common Industries - Educational services (%)
Most Common Industries - Health care and social assistance (%)
Most Common Industries - Arts, entertainment, and recreation, and accommodation and food services (%)
Most Common Industries - Arts, entertainment, and recreation (%)
Most Common Industries - Accommodation and food services (%)
Most Common Industries - Other services, except public administration (%)
Most Common Industries - Public administration (%)
Occupation diversity
Most Common Occupations - Management, business, science, and arts occupations (%)
Most Common Occupations - Management, business, and financial occupations (%)
Most Common Occupations - Management occupations (%)
Most Common Occupations - Business and financial operations occupations (%)
Most Common Occupations - Computer, engineering, and science occupations (%)
Most Common Occupations - Computer and mathematical occupations (%)
Most Common Occupations - Architecture and engineering occupations (%)
Most Common Occupations - Life, physical, and social science occupations (%)
Most Common Occupations - Education, legal, community service, arts, and media occupations (%)
Most Common Occupations - Community and social service occupations (%)
Most Common Occupations - Legal occupations (%)
Most Common Occupations - Education, training, and library occupations (%)
Most Common Occupations - Arts, design, entertainment, sports, and media occupations (%)
Most Common Occupations - Healthcare practitioners and technical occupations (%)
Most Common Occupations - Health diagnosing and treating practitioners and other technical occupations (%)
Most Common Occupations - Health technologists and technicians (%)
Most Common Occupations - Service occupations (%)
Most Common Occupations - Healthcare support occupations (%)
Most Common Occupations - Protective service occupations (%)
Most Common Occupations - Fire fighting and prevention, and other protective service workers including supervisors (%)
Most Common Occupations - Law enforcement workers including supervisors (%)
Most Common Occupations - Food preparation and serving related occupations (%)
Most Common Occupations - Building and grounds cleaning and maintenance occupations (%)
Most Common Occupations - Personal care and service occupations (%)
Most Common Occupations - Sales and office occupations (%)
Most Common Occupations - Sales and related occupations (%)
Most Common Occupations - Office and administrative support occupations (%)
Most Common Occupations - Natural resources, construction, and maintenance occupations (%)
Most Common Occupations - Farming, fishing, and forestry occupations (%)
Most Common Occupations - Construction and extraction occupations (%)
Most Common Occupations - Installation, maintenance, and repair occupations (%)
Most Common Occupations - Production, transportation, and material moving occupations (%)
Most Common Occupations - Production occupations (%)
Most Common Occupations - Transportation occupations (%)
Most Common Occupations - Material moving occupations (%)
People in Group quarters - Institutionalized population (%)
People in Group quarters - Correctional institutions (%)
People in Group quarters - Federal prisons and detention centers (%)
People in Group quarters - Halfway houses (%)
People in Group quarters - Local jails and other confinement facilities (including police lockups) (%)
People in Group quarters - Military disciplinary barracks (%)
People in Group quarters - State prisons (%)
People in Group quarters - Other types of correctional institutions (%)
People in Group quarters - Nursing homes (%)
People in Group quarters - Hospitals/wards, hospices, and schools for the handicapped (%)
People in Group quarters - Hospitals/wards and hospices for chronically ill (%)
People in Group quarters - Hospices or homes for chronically ill (%)
People in Group quarters - Military hospitals or wards for chronically ill (%)
People in Group quarters - Other hospitals or wards for chronically ill (%)
People in Group quarters - Hospitals or wards for drug/alcohol abuse (%)
People in Group quarters - Mental (Psychiatric) hospitals or wards (%)
People in Group quarters - Schools, hospitals, or wards for the mentally retarded (%)
People in Group quarters - Schools, hospitals, or wards for the physically handicapped (%)
People in Group quarters - Institutions for the deaf (%)
People in Group quarters - Institutions for the blind (%)
People in Group quarters - Orthopedic wards and institutions for the physically handicapped (%)
People in Group quarters - Wards in general hospitals for patients who have no usual home elsewhere (%)
People in Group quarters - Wards in military hospitals for patients who have no usual home elsewhere (%)
People in Group quarters - Juvenile institutions (%)
People in Group quarters - Long-term care (%)
People in Group quarters - Homes for abused, dependent, and neglected children (%)
People in Group quarters - Residential treatment centers for emotionally disturbed children (%)
People in Group quarters - Training schools for juvenile delinquents (%)
People in Group quarters - Short-term care, detention or diagnostic centers for delinquent children (%)
People in Group quarters - Type of juvenile institution unknown (%)
People in Group quarters - Noninstitutionalized population (%)
People in Group quarters - College dormitories (includes college quarters off campus) (%)
People in Group quarters - Military quarters (%)
People in Group quarters - On base (%)
People in Group quarters - Barracks, unaccompanied personnel housing (UPH), (Enlisted/Officer), ;and similar group living quarters for military personnel (%)
People in Group quarters - Transient quarters for temporary residents (%)
People in Group quarters - Military ships (%)
People in Group quarters - Group homes (%)
People in Group quarters - Homes or halfway houses for drug/alcohol abuse (%)
People in Group quarters - Homes for the mentally ill (%)
People in Group quarters - Homes for the mentally retarded (%)
People in Group quarters - Homes for the physically handicapped (%)
People in Group quarters - Other group homes (%)
People in Group quarters - Religious group quarters (%)
People in Group quarters - Dormitories (%)
People in Group quarters - Agriculture workers' dormitories on farms (%)
People in Group quarters - Job Corps and vocational training facilities (%)
People in Group quarters - Other workers' dormitories (%)
People in Group quarters - Crews of maritime vessels (%)
People in Group quarters - Other nonhousehold living situations (%)
People in Group quarters - Other noninstitutional group quarters (%)
Residents speaking English at home (%)
Residents speaking English at home - Born in the United States (%)
Residents speaking English at home - Native, born elsewhere (%)
Residents speaking English at home - Foreign born (%)
Residents speaking Spanish at home (%)
Residents speaking Spanish at home - Born in the United States (%)
Residents speaking Spanish at home - Native, born elsewhere (%)
Residents speaking Spanish at home - Foreign born (%)
Residents speaking other language at home (%)
Residents speaking other language at home - Born in the United States (%)
Residents speaking other language at home - Native, born elsewhere (%)
Residents speaking other language at home - Foreign born (%)
Class of Workers - Employee of private company (%)
Class of Workers - Self-employed in own incorporated business (%)
Class of Workers - Private not-for-profit wage and salary workers (%)
Class of Workers - Local government workers (%)
Class of Workers - State government workers (%)
Class of Workers - Federal government workers (%)
Class of Workers - Self-employed workers in own not incorporated business and Unpaid family workers (%)
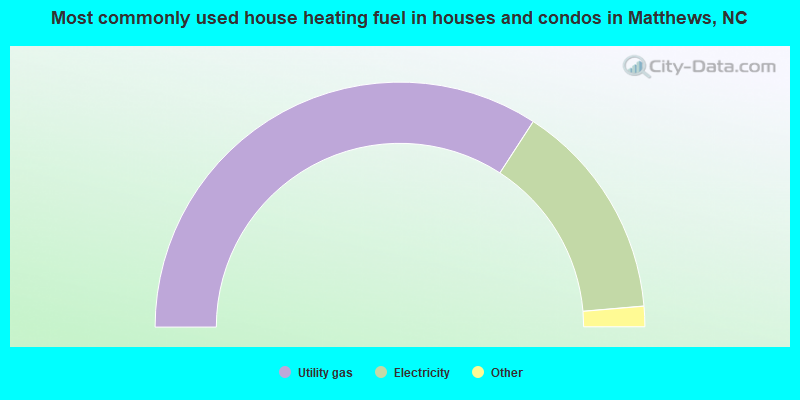
House heating fuel used in houses and condos - Utility gas (%)
House heating fuel used in houses and condos - Bottled, tank, or LP gas (%)
House heating fuel used in houses and condos - Electricity (%)
House heating fuel used in houses and condos - Fuel oil, kerosene, etc. (%)
House heating fuel used in houses and condos - Coal or coke (%)
House heating fuel used in houses and condos - Wood (%)
House heating fuel used in houses and condos - Solar energy (%)
House heating fuel used in houses and condos - Other fuel (%)
House heating fuel used in houses and condos - No fuel used (%)
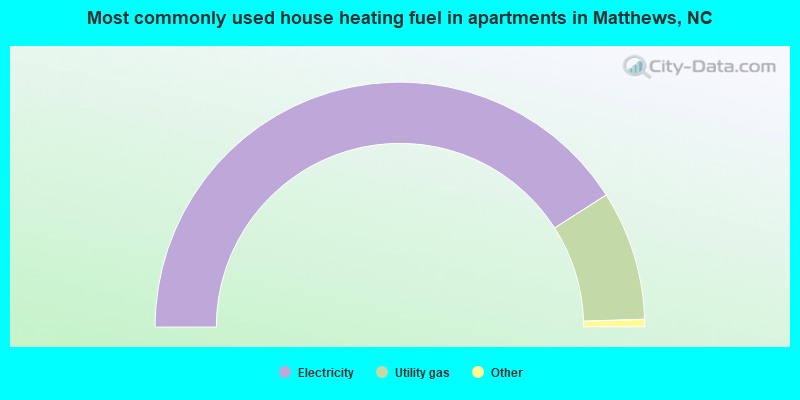
House heating fuel used in apartments - Utility gas (%)
House heating fuel used in apartments - Bottled, tank, or LP gas (%)
House heating fuel used in apartments - Electricity (%)
House heating fuel used in apartments - Fuel oil, kerosene, etc. (%)
House heating fuel used in apartments - Coal or coke (%)
House heating fuel used in apartments - Wood (%)
House heating fuel used in apartments - Solar energy (%)
House heating fuel used in apartments - Other fuel (%)
House heating fuel used in apartments - No fuel used (%)
Armed forces status - In Armed Forces (%)
Armed forces status - Civilian (%)
Armed forces status - Civilian - Veteran (%)
Armed forces status - Civilian - Nonveteran (%)
Fatal accidents locations in years 2005-2021
Fatal accidents locations in 2005
Fatal accidents locations in 2006
Fatal accidents locations in 2007
Fatal accidents locations in 2008
Fatal accidents locations in 2009
Fatal accidents locations in 2010
Fatal accidents locations in 2011
Fatal accidents locations in 2012
Fatal accidents locations in 2013
Fatal accidents locations in 2014
Fatal accidents locations in 2015
Fatal accidents locations in 2016
Fatal accidents locations in 2017
Fatal accidents locations in 2018
Fatal accidents locations in 2019
Fatal accidents locations in 2020
Fatal accidents locations in 2021
Alcohol use - People drinking some alcohol every month (%)
Alcohol use - People not drinking at all (%)
Alcohol use - Average days/month drinking alcohol
Alcohol use - Average drinks/week
Alcohol use - Average days/year people drink much
Audiometry - Average condition of hearing (%)
Audiometry - People that can hear a whisper from across a quiet room (%)
Audiometry - People that can hear normal voice from across a quiet room (%)
Audiometry - Ears ringing, roaring, buzzing (%)
Audiometry - Had a job exposure to loud noise (%)
Audiometry - Had off-work exposure to loud noise (%)
Blood Pressure & Cholesterol - Has high blood pressure (%)
Blood Pressure & Cholesterol - Checking blood pressure at home (%)
Blood Pressure & Cholesterol - Frequently checking blood cholesterol (%)
Blood Pressure & Cholesterol - Has high cholesterol level (%)
Consumer Behavior - Money monthly spent on food at supermarket/grocery store
Consumer Behavior - Money monthly spent on food at other stores
Consumer Behavior - Money monthly spent on eating out
Consumer Behavior - Money monthly spent on carryout/delivered foods
Consumer Behavior - Income spent on food at supermarket/grocery store (%)
Consumer Behavior - Income spent on food at other stores (%)
Consumer Behavior - Income spent on eating out (%)
Consumer Behavior - Income spent on carryout/delivered foods (%)
Current Health Status - General health condition (%)
Current Health Status - Blood donors (%)
Current Health Status - Has blood ever tested for HIV virus (%)
Current Health Status - Left-handed people (%)
Dermatology - People using sunscreen (%)
Diabetes - Diabetics (%)
Diabetes - Had a blood test for high blood sugar (%)
Diabetes - People taking insulin (%)
Diet Behavior & Nutrition - Diet health (%)
Diet Behavior & Nutrition - Milk product consumption (# of products/month)
Diet Behavior & Nutrition - Meals not home prepared (#/week)
Diet Behavior & Nutrition - Meals from fast food or pizza place (#/week)
Diet Behavior & Nutrition - Ready-to-eat foods (#/month)
Diet Behavior & Nutrition - Frozen meals/pizza (#/month)
Drug Use - People that ever used marijuana or hashish (%)
Drug Use - Ever used hard drugs (%)
Drug Use - Ever used any form of cocaine (%)
Drug Use - Ever used heroin (%)
Drug Use - Ever used methamphetamine (%)
Health Insurance - People covered by health insurance (%)
Kidney Conditions-Urology - Avg. # of times urinating at night
Medical Conditions - People with asthma (%)
Medical Conditions - People with anemia (%)
Medical Conditions - People with psoriasis (%)
Medical Conditions - People with overweight (%)
Medical Conditions - Elderly people having difficulties in thinking or remembering (%)
Medical Conditions - People who ever received blood transfusion (%)
Medical Conditions - People having trouble seeing even with glass/contacts (%)
Medical Conditions - People with arthritis (%)
Medical Conditions - People with gout (%)
Medical Conditions - People with congestive heart failure (%)
Medical Conditions - People with coronary heart disease (%)
Medical Conditions - People with angina pectoris (%)
Medical Conditions - People who ever had heart attack (%)
Medical Conditions - People who ever had stroke (%)
Medical Conditions - People with emphysema (%)
Medical Conditions - People with thyroid problem (%)
Medical Conditions - People with chronic bronchitis (%)
Medical Conditions - People with any liver condition (%)
Medical Conditions - People who ever had cancer or malignancy (%)
Mental Health - People who have little interest in doing things (%)
Mental Health - People feeling down, depressed, or hopeless (%)
Mental Health - People who have trouble sleeping or sleeping too much (%)
Mental Health - People feeling tired or having little energy (%)
Mental Health - People with poor appetite or overeating (%)
Mental Health - People feeling bad about themself (%)
Mental Health - People who have trouble concentrating on things (%)
Mental Health - People moving or speaking slowly or too fast (%)
Mental Health - People having thoughts they would be better off dead (%)
Oral Health - Average years since last visit a dentist
Oral Health - People embarrassed because of mouth (%)
Oral Health - People with gum disease (%)
Oral Health - General health of teeth and gums (%)
Oral Health - Average days a week using dental floss/device
Oral Health - Average days a week using mouthwash for dental problem
Oral Health - Average number of teeth
Pesticide Use - Households using pesticides to control insects (%)
Pesticide Use - Households using pesticides to kill weeds (%)
Physical Activity - People doing vigorous-intensity work activities (%)
Physical Activity - People doing moderate-intensity work activities (%)
Physical Activity - People walking or bicycling (%)
Physical Activity - People doing vigorous-intensity recreational activities (%)
Physical Activity - People doing moderate-intensity recreational activities (%)
Physical Activity - Average hours a day doing sedentary activities
Physical Activity - Average hours a day watching TV or videos
Physical Activity - Average hours a day using computer
Physical Functioning - People having limitations keeping them from working (%)
Physical Functioning - People limited in amount of work they can do (%)
Physical Functioning - People that need special equipment to walk (%)
Physical Functioning - People experiencing confusion/memory problems (%)
Physical Functioning - People requiring special healthcare equipment (%)
Prescription Medications - Average number of prescription medicines taking
Preventive Aspirin Use - Adults 40+ taking low-dose aspirin (%)
Reproductive Health - Vaginal deliveries (%)
Reproductive Health - Cesarean deliveries (%)
Reproductive Health - Deliveries resulted in a live birth (%)
Reproductive Health - Pregnancies resulted in a delivery (%)
Reproductive Health - Women breastfeeding newborns (%)
Reproductive Health - Women that had a hysterectomy (%)
Reproductive Health - Women that had both ovaries removed (%)
Reproductive Health - Women that have ever taken birth control pills (%)
Reproductive Health - Women taking birth control pills (%)
Reproductive Health - Women that have ever used Depo-Provera or injectables (%)
Reproductive Health - Women that have ever used female hormones (%)
Sexual Behavior - People 18+ that ever had sex (vaginal, anal, or oral) (%)
Sexual Behavior - Males 18+ that ever had vaginal sex with a woman (%)
Sexual Behavior - Males 18+ that ever performed oral sex on a woman (%)
Sexual Behavior - Males 18+ that ever had anal sex with a woman (%)
Sexual Behavior - Males 18+ that ever had any sex with a man (%)
Sexual Behavior - Females 18+ that ever had vaginal sex with a man (%)
Sexual Behavior - Females 18+ that ever performed oral sex on a man (%)
Sexual Behavior - Females 18+ that ever had anal sex with a man (%)
Sexual Behavior - Females 18+ that ever had any kind of sex with a woman (%)
Sexual Behavior - Average age people first had sex
Sexual Behavior - Average number of female sex partners in lifetime (males 18+)
Sexual Behavior - Average number of female vaginal sex partners in lifetime (males 18+)
Sexual Behavior - Average age people first performed oral sex on a woman (18+)
Sexual Behavior - Average number of woman performed oral sex on in lifetime (18+)
Sexual Behavior - Average number of male sex partners in lifetime (males 18+)
Sexual Behavior - Average number of male anal sex partners in lifetime (males 18+)
Sexual Behavior - Average age people first performed oral sex on a man (18+)
Sexual Behavior - Average number of male oral sex partners in lifetime (18+)
Sexual Behavior - People using protection when performing oral sex (%)
Sexual Behavior - Average number of times people have vaginal or anal sex a year
Sexual Behavior - People having sex without condom (%)
Sexual Behavior - Average number of male sex partners in lifetime (females 18+)
Sexual Behavior - Average number of male vaginal sex partners in lifetime (females 18+)
Sexual Behavior - Average number of female sex partners in lifetime (females 18+)
Sexual Behavior - Circumcised males 18+ (%)
Sleep Disorders - Average hours sleeping at night
Sleep Disorders - People that has trouble sleeping (%)
Smoking-Cigarette Use - People smoking cigarettes (%)
Taste & Smell - People 40+ having problems with smell (%)
Taste & Smell - People 40+ having problems with taste (%)
Taste & Smell - People 40+ that ever had wisdom teeth removed (%)
Taste & Smell - People 40+ that ever had tonsils teeth removed (%)
Taste & Smell - People 40+ that ever had a loss of consciousness because of a head injury (%)
Taste & Smell - People 40+ that ever had a broken nose or other serious injury to face or skull (%)
Taste & Smell - People 40+ that ever had two or more sinus infections (%)
Weight - Average height (inches)
Weight - Average weight (pounds)
Weight - Average BMI
Weight - People that are obese (%)
Weight - People that ever were obese (%)
Weight - People trying to lose weight (%)
Officers per 1,000 residents here:
1.86North Carolina average:
2.27
Latest news from Matthews, NC collected exclusively by city-data.com from local newspapers, TV, and radio stations
Matthews, NC City Guides: Ancestries: American (9.6%), English (8.1%), German (6.3%), Irish (5.3%), Italian (3.7%), Russian (3.4%).
Current Local Time:
Land area: 14.2 square miles.
Population density: 2,120 people per square mile (low).
3,926 residents are foreign born (5.7% Asia , 3.4% Europe , 2.4% Latin America ).
This town:
12.9%North Carolina:
8.3%
Median real estate property taxes paid for housing units with mortgages in 2022: $2,805 (0.6%)Median real estate property taxes paid for housing units with no mortgage in 2022: $2,812 (0.7%)
Nearest city with pop. 50,000+: Charlotte, NC
Nearest city with pop. 1,000,000+: Philadelphia, PA
Nearest cities:
Latitude: 35.12 N, Longitude: 80.72 W
Daytime population change due to commuting: +6,918 (+22.7%)Workers who live and work in this town: 5,284 (32.0%)
Property values in Matthews, NC
Unemployment in December 2023: Here:
2.5%North Carolina:
3.2%
Population change in the 1990s: +7,520 (+51.5%).
Most common occupations in Matthews, NC (%)
Both Males Females
Other management occupations, except farmers and farm managers (6.2%)
Sales representatives, services, wholesale and manufacturing (5.9%)
Preschool, kindergarten, elementary, and middle school teachers (4.9%)
Other sales and related occupations, including supervisors (4.3%)
Computer specialists (3.9%)
Other office and administrative support workers, including supervisors (3.8%)
Retail sales workers, except cashiers (3.6%)
Other management occupations, except farmers and farm managers (7.9%)
Sales representatives, services, wholesale and manufacturing (7.5%)
Computer specialists (6.2%)
Other sales and related occupations, including supervisors (4.6%)
Top executives (4.4%)
Electrical equipment mechanics and other installation, maintenance, and repair workers, including supervisors (4.3%)
Retail sales workers, except cashiers (3.7%)
Preschool, kindergarten, elementary, and middle school teachers (8.9%)
Registered nurses (6.2%)
Other office and administrative support workers, including supervisors (6.1%)
Secretaries and administrative assistants (5.0%)
Other management occupations, except farmers and farm managers (4.2%)
Other sales and related occupations, including supervisors (4.0%)
Sales representatives, services, wholesale and manufacturing (3.9%)
Tornado activity:
Matthews-area historical tornado activity is slightly above North Carolina state average. It is 16% greater than the overall U.S. average.
On 5/5/1989, a category F4 (max. wind speeds 207-260 mph) tornado 9.5 miles away from the Matthews town center killed one person and injured 6 people and caused between $5,000,000 and $50,000,000 in damages.
On 3/27/1994, a category F3 (max. wind speeds 158-206 mph) tornado 8.4 miles away from the town center injured 2 people and caused between $5,000,000 and $50,000,000 in damages.
Earthquake activity:
Matthews-area historical earthquake activity is significantly above North Carolina state average. It is 24% smaller than the overall U.S. average. On 8/9/2020 at 12:07:37, a magnitude 5.1 (5.1 MW, Depth: 4.7 mi, Class: Moderate, Intensity: VI - VII) earthquake occurred 96.3 miles away from the city center On 8/23/2011 at 17:51:04, a magnitude 5.8 (5.8 MW, Depth: 3.7 mi) earthquake occurred 247.4 miles away from the city center On 8/2/1974 at 08:52:09, a magnitude 4.9 (4.3 MB, 4.9 LG, Class: Light, Intensity: IV - V) earthquake occurred 132.7 miles away from the city center On 11/22/1974 at 05:25:55, a magnitude 4.7 (4.7 MB) earthquake occurred 156.8 miles away from Matthews center On 7/27/1980 at 18:52:21, a magnitude 5.2 (5.1 MB, 4.7 MS, 5.0 UK, 5.2 UK) earthquake occurred 278.7 miles away from Matthews center On 11/30/1973 at 07:48:41, a magnitude 4.7 (4.7 MB, 4.6 ML) earthquake occurred 188.8 miles away from Matthews center Magnitude types: regional Lg-wave magnitude (LG), body-wave magnitude (MB), local magnitude (ML), surface-wave magnitude (MS), moment magnitude (MW) Natural disasters: The number of natural disasters in Mecklenburg County (9) is smaller than the US average (15).Major Disasters (Presidential) Declared: 5Emergencies Declared: 3Droughts: 2, Hurricanes: 2, Blizzard: 1, Freeze: 1, Ice Storm: 1, Tropical Storm: 1, Winter Storm: 1, Other: 1 (Note: some incidents may be assigned to more than one category). Hospitals and medical centers in Matthews: PRESBYTERIAN HOSPITAL MATTHEWS (Voluntary non-profit - Other, 1500 MATTHEWS TWNSHP PRKWY BOX 3310) WOODBEND GROUP HOME (12300 WOODBEND ROAD) CARRINGTON PLACE (600 FULLWOOD LANE)
WILLOWBROOKE COURT SC CTR AT P (701 PLANTATION ESTATES DR)
FRESENIUS MEDICAL CARE MATTHEWS (910 PARK CENTER DRIVE)
Amtrak station near Matthews: 11 miles: CHARLOTTE (1914 N. TYRON ST.) Services: ticket office, partially wheelchair accessible, enclosed waiting area, public restrooms, public payphones, vending machines, free short-term parking, free long-term parking, call for car rental service, taxi stand, public transit connection.
College/University in Matthews: Empire Beauty School-Matthews Full-time enrollment: 135; Location: 11032 E Independance Blvd; Private, for-profit; Website: www.empire.edu)
Colleges/universities with over 2000 students nearest to Matthews:
Queens University of Charlotte (about 9 miles; Charlotte, NC ; Full-time enrollment: 2,083)
Central Piedmont Community College (about 10 miles; Charlotte, NC ; FT enrollment: 15,371)
Johnson & Wales University-Charlotte (about 12 miles; Charlotte, NC ; FT enrollment: 2,518)
University of North Carolina at Charlotte (about 14 miles; Charlotte, NC ; FT enrollment: 22,807)
Wingate University (about 19 miles; Wingate, NC ; FT enrollment: 2,125)
York Technical College (about 21 miles; Rock Hill, SC ; FT enrollment: 3,572)
Winthrop University (about 22 miles; Rock Hill, SC ; FT enrollment: 5,575)
Public high schools in Matthews: BUTLER HIGH Location: 1810 MATTHEWS-MINT HILL RD, Grades: 9-12)HARPER/LEVINE MIDDLE COLLEGE HIGH Location: 2800 CAMPUS RIDGE RD, Grades: 11-12)
LEVINE MIDDLE COLLEGE HIGH Location: 2728 CAMPUS RIDGE RD, Grades: 9-12)
WEDDINGTON HIGH Location: 4901 MONROE-WEDDINGTON ROAD, Grades: 9-12)Private high schools in Matthews: COVENANT DAY SCHOOL Students: 836, Location: 800 FULLWOOD LN, Grades: KG-12)
CARMEL CHRISTIAN SCHOOL Students: 567, Location: 1145 PINEVILLE MATTHEWS RD, Grades: KG-10)
GRACE ACADEMY Students: 346, Location: 3645 PLEASANT PLAINS RD, Grades: KG-12)BIBLE BAPTIST CHRISTIAN SCHOOL Students: 171, Location: 2724 MARGARET WALLACE RD, Grades: PK-12)
ARBORBROOK CHRISTIAN ACADEMY Students: 128, Location: 4823 WAXHAW INDIAN TRAIL RD, Grades: KG-12)
THE SCHOOL AT THOMPSON Students: 37, Location: 6800 SAINT PETERS LN, Grades: 1-10)
GREYFRIARS CLASSICAL ACADEMY Students: 29, Location: 2701 RICE RD, Grades: 9-11)
Public elementary/middle schools in Matthews: SOCRATES ACADEMY Location: 3909 WEDDINGTON RD, Grades: KG-8, Charter school )
CROWN POINT ELEMENTARY Location: 3335 SAM NEWELL RD, Grades: PK-5)MATTHEWS ELEMENTARY Location: 200 MCDOWELL AVE, Grades: PK-5)ELIZABETH LANE ELEMENTARY Location: 121 ELIZABETH LN, Grades: KG-5)CRESTDALE MIDDLE Location: 940 SAM NEWELL RD, Grades: 6-8)MINT HILL MIDDLE Location: 11501 IDEWILD RD, Grades: 6-8)WEDDINGTON ELEMENTARY Location: 3927 TWELVE MILE CREEK ROAD, Grades: PK-5)WEDDINGTON MIDDLE Location: 5903 DEAL ROAD, Grades: 6-8)ANTIOCH ELEMENTARY Location: 3101 ANTIOCH CHURCH ROAD, Grades: KG-5)See full list of schools located in Matthews User-submitted facts and corrections:
Covenant Day School goes through 12th grade now and graduated their first class in 2006 , also, I believe it has close to 900 students
Notable locations in Matthews: (A) , Matthews Township Festival Center (B) , Matthews Plaza (C) . Display/hide their locations on the map
Shopping Centers: (1) , Depot Shopping Center (2) . Display/hide their locations on the map
Churches in Matthews include: (A) , Eastern Church (B) , Springdale Church (C) . Display/hide their locations on the map
Park in Matthews: (1) . Display/hide its location on the map
Tourist attractions: (1) , Charlotte Amusement & Music Service Inc (Amusement & Theme Parks; 1334 Weddington Hills Drive) (2) , 1600-F Matthews-Mint Hill Road Matthews (Amusement & Theme Parks; 1600F Matthews Mint Hill R) (3) . Display/hide their approximate locations on the map
Hotels: (1) , Country Inn & Suites (2001 Mount Harmony Chemin Road) (2) , Courtyard Matthews (11425 East Independence Boulevard) (3) , Econolodge Motel (1938 Moore Road) (4) , Hampton Inn Charlotte/Matthews (9615 Independence Pointe Parkway) (5) , Comfort Inn Matthews (9701 East Independence Boulevard) (6) , Econo Lodge East (1938 Moore Road) (7) , Country Inn-Stes Clt I-485 (2001 Mount Harmony Church Road) (8) . Display/hide their approximate locations on the map
Birthplace of: Anthony Magazu - College football player (Kent State Golden Flashes).
Mecklenburg County has a predicted average indoor radon screening level less than 2 pCi/L (pico curies per liter) - Low Potential Drinking water stations with addresses in Matthews and their reported violations in the past:
JOY CHRISTIAN FELLOWSHIP CH (Population served: 400, Groundwater):
Past health violations:
MCL, Monthly (TCR) - Between JUL-2013 and SEP-2013, Contaminant: Coliform. Follow-up actions: St Public Notif received (JUL-27-2013), St Public Notif requested (JUL-29-2013), St Formal NOV issued (JUL-29-2013), St AO (w/o penalty) issued (JUL-29-2013), St Compliance achieved (AUG-31-2013)
MCL, Monthly (TCR) - Between JUL-2011 and SEP-2011, Contaminant: Coliform. Follow-up actions: St Public Notif requested (AUG-17-2011), St Formal NOV issued (AUG-17-2011), St AO (w/o penalty) issued (AUG-17-2011), St Public Notif received (AUG-23-2011), St Compliance achieved (MAR-31-2012)
Past monitoring violations:
2 routine major monitoring violations
One regular monitoring violation
Population served: 400, Groundwater):
Past health violations:
MCL, Monthly (TCR) - Between APR-2009 and JUN-2009, Contaminant: Coliform. Follow-up actions: St Public Notif requested (JUN-19-2009), St Formal NOV issued (JUN-19-2009), St Public Notif received (JUN-25-2009), St Compliance achieved (SEP-02-2010)
Address: GOSPEL LIGHT BAPTIST CHURCH Population served: 60, Groundwater):
Past health violations:
MCL, Monthly (TCR) - Between APR-2011 and JUN-2011, Contaminant: Coliform. Follow-up actions: St Public Notif requested (JUL-07-2011), St Formal NOV issued (JUL-07-2011), St AO (w/o penalty) issued (JUL-07-2011), St Public Notif received (JUL-19-2011), St Compliance achieved (MAR-31-2012)
MCL, Monthly (TCR) - Between APR-2010 and JUN-2010, Contaminant: Coliform. Follow-up actions: St Public Notif requested (JUL-02-2010), St Formal NOV issued (JUL-02-2010), St Public Notif received (AUG-09-2010), St Compliance achieved (DEC-31-2010)
MCL, Monthly (TCR) - Between APR-2009 and JUN-2009, Contaminant: Coliform. Follow-up actions: St Public Notif requested (JUN-23-2009), St Formal NOV issued (JUN-23-2009), St Public Notif received (JUL-14-2009), St Compliance achieved (FEB-04-2010)
Past monitoring violations:
Monitoring, Repeat Major (TCR) - Between APR-2013 and JUN-2013, Contaminant: Coliform (TCR). Follow-up actions: St Compliance achieved (DEC-18-2013)
13 routine major monitoring violations
3 regular monitoring violations
Population served: 25, Groundwater):
Past monitoring violations:
8 routine major monitoring violations
2 regular monitoring violations
Average household size: This town:
2.6 peopleNorth Carolina:
2.5 people
Percentage of family households: This town:
71.7%Whole state:
66.7%
Percentage of households with unmarried partners: This town:
4.0%Whole state:
5.9%
Likely homosexual households (counted as self-reported same-sex unmarried-partner households)
Lesbian couples: 0.3% of all households Gay men: 0.4% of all households
People in group quarters in Matthews in 2010:
254 people in nursing facilities/skilled-nursing facilities
10 people in group homes intended for adults
5 people in group homes for juveniles (non-correctional)
people in nursing homes in 2000people in other noninstitutional group quarters in 2000Banks with branches in Matthews (2011 data):
Branch Banking and Trust Company: Township Parkway Branch, Matthews Branch, Plantation Estates Branch, Matthews Wesley Chapel Branch. Info updated 2010/03/29: Bank assets: $168,867.6 mil, Deposits: $127,549.5 mil, headquarters in Winston Salem, NC, positive income , Commercial Lending Specialization, 1793 total offices , Holding Company: Bb&T Corporation
SunTrust Bank: Mckee Farms Branch at 3126 Fincher Farm Rd, branch established on 2009/05/18; John Street Branch 280 at 345 West John Street, branch established on 1971/11/04. Info updated 2010/05/27: Bank assets: $171,291.7 mil, Deposits: $129,833.2 mil, headquarters in Atlanta, GA, positive income , Commercial Lending Specialization, 1716 total offices , Holding Company: Suntrust Banks, Inc.
Wells Fargo Bank, National Association: Matthews Branch at 1401 Matthews-Mint Hill Road, branch established on 1987/03/02; Idlewild Market Branch at 15030 Idlewild Road, branch established on 2004/12/13. Info updated 2011/04/05: Bank assets: $1,161,490.0 mil, Deposits: $905,653.0 mil, headquarters in Sioux Falls, SD, positive income , 6395 total offices , Holding Company: Wells Fargo & Company
Bank of Granite: Matthews Office at 2432 Mckee Road, branch established on 2005/04/04. Info updated 2006/11/03: Bank assets: $753.5 mil, Deposits: $688.5 mil, headquarters in Granite Falls, NC, positive income , Commercial Lending Specialization, 18 total offices , Holding Company: Fnb United Corp.
PNC Bank, National Association: Matthews Station Branch at 110 Matthews Station Street, Suite 1-F, branch established on 2001/12/07. Info updated 2012/03/20: Bank assets: $263,309.6 mil, Deposits: $197,343.0 mil, headquarters in Wilmington, DE, positive income , Commercial Lending Specialization, 3085 total offices , Holding Company: Pnc Financial Services Group, Inc., The
Fifth Third Bank: Matthews Branch at 1818 Matthews Township Parkway, branch established on 1992/08/10. Info updated 2009/10/05: Bank assets: $114,540.4 mil, Deposits: $89,689.1 mil, headquarters in Cincinnati, OH, positive income , Commercial Lending Specialization, 1378 total offices , Holding Company: Fifth Third Bancorp
Bank of America, National Association: Plantation Market Branch at 3220 Weddington Road, branch established on 2004/04/12. Info updated 2009/11/18: Bank assets: $1,451,969.3 mil, Deposits: $1,077,176.8 mil, headquarters in Charlotte, NC, positive income , 5782 total offices , Holding Company: Bank Of America Corporation
For population 15 years and over in Matthews:
Never married: 28.9%Now married: 56.9%Separated: 1.3%Widowed: 4.8%Divorced: 8.1% For population 25 years and over in Matthews:
High school or higher: 94.5%Bachelor's degree or higher: 52.4%Graduate or professional degree: 14.3%Unemployed: 4.7%Mean travel time to work (commute): 19.4 minutes
Education Gini index (Inequality in education) Here:
9.4North Carolina average:
11.7
Religion statistics for Matthews, NC (based on Mecklenburg County data)
Religion Adherents Congregations Evangelical Protestant 204,287 491 Mainline Protestant 138,743 188 Catholic 78,692 15 Black Protestant 26,612 73 Other 20,979 68 Orthodox 8,724 12 None 442,262 -
Source: Clifford Grammich, Kirk Hadaway, Richard Houseal, Dale E.Jones, Alexei Krindatch, Richie Stanley and Richard H.Taylor. 2012. 2010 U.S.Religion Census: Religious Congregations & Membership Study. Association of Statisticians of American Religious Bodies. Jones, Dale E., et al. 2002. Congregations and Membership in the United States 2000. Nashville, TN: Glenmary Research Center. Graphs represent county-level data
Food Environment Statistics: Number of grocery stores : 185Mecklenburg County :
2.14 / 10,000 pop.North Carolina :
2.05 / 10,000 pop.
Number of supercenters and club stores : 10This county :
0.12 / 10,000 pop.North Carolina :
0.14 / 10,000 pop.
Number of convenience stores (no gas) : 83Mecklenburg County :
0.96 / 10,000 pop.North Carolina :
0.92 / 10,000 pop.
Number of convenience stores (with gas) : 245This county :
2.84 / 10,000 pop.State :
4.75 / 10,000 pop.
Number of full-service restaurants : 804Mecklenburg County :
9.31 / 10,000 pop.North Carolina :
7.57 / 10,000 pop.
Adult diabetes rate : This county :
7.7%North Carolina :
9.8%
Adult obesity rate : Mecklenburg County :
24.2%North Carolina :
28.3%
Low-income preschool obesity rate : Mecklenburg County :
17.4%North Carolina :
15.6%
Health and Nutrition: Healthy diet rate : This city:
54.9%North Carolina:
48.9%
Average overall health of teeth and gums : Average BMI : Matthews:
28.0North Carolina:
28.8
People feeling badly about themselves : Matthews:
20.0%North Carolina:
20.7%
People not drinking alcohol at all : Here:
8.3%North Carolina:
10.7%
Average hours sleeping at night : Matthews:
6.9North Carolina:
6.8
Overweight people : Matthews:
33.5%North Carolina:
33.7%
General health condition : Here:
61.9%North Carolina:
55.8%
Average condition of hearing : This city:
81.9%State:
79.7%
More about Health and Nutrition of Matthews, NC Residents
Local government employment and payroll (March 2022)
Function
Full-time employees
Monthly full-time payroll
Average yearly full-time wage
Part-time employees
Monthly part-time payroll
Police Protection - Officers
62 $332,163 $64,290 0 $0 Firefighters
30 $138,834 $55,534 26 $12,170 Other Government Administration
19 $87,805 $55,456 0 $0 Other and Unallocable
18 $80,100 $53,400 0 $0 Police - Other
17 $69,148 $48,810 3 $553 Streets and Highways
14 $71,178 $61,010 0 $0 Financial Administration
6 $37,092 $74,184 1 $2,013 Parks and Recreation
6 $37,853 $75,706 14 $7,245 Fire - Other
1 $4,852 $58,224 0 $0
Totals for Government
173 $859,023 $59,585 44 $21,981
Matthews government finances - Expenditure in 2018 (per resident):
Construction - Parks and Recreation: $194,000 ($6.44)
Regular Highways: $78,000 ($2.59)Current Operations - Police Protection: $5,708,000 ($189.48)
Local Fire Protection: $2,161,000 ($71.74)General - Other: $2,116,000 ($70.24)Parks and Recreation: $2,089,000 ($69.35)Regular Highways: $1,953,000 ($64.83)Solid Waste Management: $1,646,000 ($54.64)Transit Utilities: $752,000 ($24.96)Central Staff Services: $647,000 ($21.48)Natural Resources - Other: $600,000 ($19.92)Housing and Community Development: $491,000 ($16.30)Financial Administration: $445,000 ($14.77)General - Interest on Debt: $189,000 ($6.27)
Intergovernmental to Local - Other - Correctional Institutions: $23,000 ($0.76)
Other Capital Outlay - Police Protection: $1,432,000 ($47.54)
Health - Other: $290,000 ($9.63)Natural Resources - Other: $108,000 ($3.59)Transit Utilities: $106,000 ($3.52)Regular Highways: $69,000 ($2.29)Parks and Recreation: $60,000 ($1.99)Local Fire Protection: $28,000 ($0.93)General - Other: $10,000 ($0.33)
Matthews government finances - Revenue in 2018 (per resident):
Charges - Parks and Recreation: $625,000 ($20.75)
Miscellaneous Commercial Activities: $34,000 ($1.13)Solid Waste Management: $20,000 ($0.66)Federal Intergovernmental - Other: $339,000 ($11.25)
Local Intergovernmental - Other: $910,000 ($30.21)
Highways: $65,000 ($2.16)Transit Utilities: $2,000 ($0.07)Miscellaneous - Donations From Private Sources: $4,241,000 ($140.78)
Rents: $232,000 ($7.70)General Revenue - Other: $189,000 ($6.27)Sale of Property: $54,000 ($1.79)Interest Earnings: $0 ($0.00)State Intergovernmental - General Local Government Support: $1,845,000 ($61.25)
Highways: $773,000 ($25.66)Other: $324,000 ($10.76)Tax - Property: $12,307,000 ($408.54)
General Sales and Gross Receipts: $3,235,000 ($107.39)Other Selective Sales: $1,536,000 ($50.99)Motor Vehicle License: $743,000 ($24.66)Occupation and Business License - Other: $231,000 ($7.67)Other License: $2,000 ($0.07)
Matthews government finances - Debt in 2018 (per resident):
Long Term Debt - Beginning Outstanding - Unspecified Public Purpose: $6,371,000 ($211.49)
Outstanding Unspecified Public Purpose: $5,622,000 ($186.63)Retired Unspecified Public Purpose: $749,000 ($24.86)
9.09% of this county's 2021 resident taxpayers lived in other counties in 2020 ($78,641 average adjusted gross income )
Here:
9.09%North Carolina average:
8.85%
0.01% of residents moved from foreign countries ($73 average AGI )Mecklenburg County:
0.01%North Carolina average:
0.04%
Top counties from which taxpayers relocated into this county between 2020 and 2021:
9.02% of this county's 2020 resident taxpayers moved to other counties in 2021 ($81,691 average adjusted gross income )
Here:
9.02%North Carolina average:
7.89%
0.02% of residents moved to foreign countries ($115 average AGI )Mecklenburg County:
0.02%North Carolina average:
0.03%
Top counties to which taxpayers relocated from this county between 2020 and 2021:
Businesses in Matthews, NC
Name Count Name Count
ALDI 1 KFC 1 AMF Bowling 1 Kohl's 1 AT&T 1 Lane Bryant 1 Advance Auto Parts 1 Lowe's 1 Applebee's 1 Marriott 1 Ashley Furniture 1 Marshalls 1 Audi 1 MasterBrand Cabinets 1 AutoZone 1 McDonald's 2 Baskin-Robbins 1 Men's Wearhouse 1 Bed Bath & Beyond 1 Microtel 1 Blockbuster 1 New Balance 3 Burger King 2 Nike 2 CVS 3 Office Depot 1 Caribou Coffee 1 OfficeMax 1 Chick-Fil-A 2 Old Navy 1 Chipotle 1 Outback 1 Circle K 1 Outback Steakhouse 1 Comfort Inn 1 Panera Bread 1 Costco 1 Penske 1 Cracker Barrel 1 PetSmart 1 Cricket Wireless 1 Pier 1 Imports 1 Curves 1 Pizza Hut 1 Dairy Queen 1 Plato's Closet 1 Domino's Pizza 2 Qdoba Mexican Grill 2 DressBarn 1 Quality 1 Dressbarn 1 RadioShack 1 Dunkin Donuts 2 Rite Aid 3 Econo Lodge 1 Sam's Club 1 FedEx 7 Shoe Carnival 1 Firestone Complete Auto Care 3 Sleep Inn 1 GNC 2 Sprint Nextel 1 GameStop 1 Starbucks 4 H&R Block 2 T-Mobile 3 Hilton 1 Taco Bell 1 Hobby Lobby 1 Target 1 Holiday Inn 1 The Room Place 1 Home Depot 1 Tire Kingdom 1 Hyundai 1 UPS 13 IHOP 1 Verizon Wireless 1 InTown Suites 2 Walgreens 3 Jimmy John's 1 Wendy's 1 Jones New York 2 YMCA 1 Justice 1
Strongest AM radio stations in Matthews:
WBT (1110 AM; 50 kW; CHARLOTTE, NC; Owner: JEFFERSON-PILOT COMMUNICATNS CO. OF NORTH CAROLINA)
WNOW (1030 AM; daytime; 9 kW; MINT HILL, NC; Owner: CHARLOTTE METRO RADIO, INC.)
WAGL (1560 AM; daytime; 50 kW; LANCASTER, SC; Owner: PALMETTO BROADCASTING SYSTEM, INC.)
WGFY (1480 AM; 10 kW; CHARLOTTE, NC; Owner: ABC, INC.)
WFNZ (610 AM; 5 kW; CHARLOTTE, NC; Owner: INFINITY RADIO SUBSIDIARY OPERATIONS INC.)
WYFQ (930 AM; 5 kW; CHARLOTTE, NC; Owner: BIBLE BROADCASTING NETWORK, INC.)
WLTC (1370 AM; 20 kW; GASTONIA, NC)
WCGC (1270 AM; 10 kW; BELMONT, NC; Owner: WHVN, INC.)
WCEO (840 AM; daytime; 50 kW; COLUMBIA, SC; Owner: EASTERN BROADCASTING GROUP, INC.)
WDEX (1430 AM; 2 kW; MONROE, NC; Owner: NEW LIFE COMMUNITY TEMPLE OF FAITH, INC.)
WHKY (1290 AM; 50 kW; HICKORY, NC; Owner: LONG COMMUNICATIONS, LLC.)
WHVN (1240 AM; 1 kW; CHARLOTTE, NC; Owner: WHVN, INC.)
WBAJ (890 AM; daytime; 50 kW; BLYTHEWOOD, SC; Owner: FAMILY FIRST)
Strongest FM radio stations in Matthews:
WWMG (96.1 FM; SHELBY, NC; Owner: CLEAR CHANNEL BROADCASTING LICENSES, INC.)
WRCM (91.9 FM; WINGATE, NC; Owner: COLUMBIA BIBLE COLLEGE BROADCASTING CO)
WKKT (96.9 FM; STATESVILLE, NC; Owner: CAPSTAR TX LIMITED PARTNERSHIP)
WSOC-FM (103.7 FM; CHARLOTTE, NC; Owner: INFINITY RADIO SUBSIDIARY OPERATIONS INC.)
WSSS (104.7 FM; CHARLOTTE, NC; Owner: INFINITY RADIO SUBSIDIARY OPERATIONS INC.)
WRFX-FM (99.7 FM; KANNAPOLIS, NC; Owner: CAPSTAR TX LIMITED PARTNERSHIP)
WFAE (90.7 FM; CHARLOTTE, NC; Owner: UNIVERSITY RADIO FOUNDATION, INC.)
W264AF (100.7 FM; CHARLOTTE, NC; Owner: ISOTHERMAL COMMUNITY COLLEGE)
WLNK (107.9 FM; CHARLOTTE, NC; Owner: JEFFERSON-PILOT COMMUNICATIONS COMPANY OF NORTH CAROLINA)
WPEG (97.9 FM; CONCORD, NC; Owner: INFINITY RADIO SUBSIDIARY OPERATIONS INC.)
WNKS (95.1 FM; CHARLOTTE, NC; Owner: INFINITY RADIO SUBSIDIARY OPERATIONS INC.)
WLYT (102.9 FM; HICKORY, NC; Owner: CAPSTAR TX LIMITED PARTNERSHIP)
WBAV-FM (101.9 FM; GASTONIA, NC; Owner: INFINITY RADIO SUBSIDIARY OPERATIONS INC.)
WCHH (92.7 FM; HARRISBURG, NC; Owner: RADIO ONE OF NORTH CAROLINA, LLC)
WDAV (89.9 FM; DAVIDSON, NC; Owner: THE TRUSTEES OF DAVIDSON COLLEGE)
WTHZ (94.1 FM; LEXINGTON, NC; Owner: DAVIDSON COUNTY BROADCASTING CO, INC)
WXRC (95.7 FM; HICKORY, NC; Owner: PACIFIC BROADCASTING GROUP, INC.)
WSGE (91.7 FM; DALLAS, NC; Owner: GASTON COLLEGE)
WFMX (105.7 FM; STATESVILLE, NC; Owner: MERCURY BROADCASTING COMPANY, INC.)
WYFQ-FM (93.5 FM; WADESBORO, NC; Owner: BIBLE BROADCASTING NETWORK, INC.)
TV broadcast stations around Matthews:
WAFF (Channel 48; HUNTSVILLE, AL; Owner: RAYCOM AMERICA, INC.)
WGTB-LP (Channel 28; CHARLOTTE, NC; Owner: VICTORY CHRISTIAN CENTER, INC.)
WSOC-TV (Channel 9; CHARLOTTE, NC; Owner: WSOC-TV HOLDINGS, INC.)
WCCB (Channel 18; CHARLOTTE, NC; Owner: NORTH CAROLINA BROADCASTING PARTNERS)
WTVI (Channel 42; CHARLOTTE, NC; Owner: CHARLOTTE-MECKLENBURG PUBLIC BROADCASTING AUTHORITY)
W25BR (Channel 25; CHARLOTTE, NC; Owner: WORD OF GOD FELLOWSHIP, INC.)
W52CW (Channel 52; CHARLOTTE, NC; Owner: TRINITY BROADCASTING NETWORK)
WUNG-TV (Channel 58; CONCORD, NC; Owner: UNIVERSITY OF NORTH CAROLINA)
WBTV (Channel 3; CHARLOTTE, NC; Owner: JEFFERSON-PILOT COMMUNICATIONS/WBTV, INC.)
W34BN (Channel 34; CHARLOTTE, NC; Owner: THREE ANGELS BROADCASTING NETWORK)
WCNC-TV (Channel 36; CHARLOTTE, NC; Owner: WCNC-TV, INC.)
WJZY (Channel 46; BELMONT, NC; Owner: WJZY-TV, INC.)
WWWB (Channel 55; ROCK HILL, SC; Owner: WWWB-TV, INC.)
WAXN (Channel 64; KANNAPOLIS, NC; Owner: WSOC-TV HOLDINGS, INC.)
WNSC-TV (Channel 30; ROCK HILL, SC; Owner: SOUTH CAROLINA EDUCATIONAL TV COMMISSION)
W38CN (Channel 38; CHARLOTTE, NC; Owner: NATIONAL MINORITY T.V., INC.)
Home Mortgage Disclosure Act Aggregated Statistics For Year 2009(Based on 1 full and 5 partial tracts) A) FHA, FSA/RHS & VA B) Conventional C) Refinancings D) Home Improvement Loans E) Loans on Dwellings For 5+ Families F) Non-occupant Loans on G) Loans On Manufactured Number Average Value Number Average Value Number Average Value Number Average Value Number Average Value Number Average Value Number Average Value
LOANS ORIGINATED 111 $167,107 103 $189,958 826 $192,416 18 $103,847 1 $167,180 20 $115,584 0 $0 APPLICATIONS APPROVED, NOT ACCEPTED 2 $187,355 8 $285,570 59 $193,371 4 $55,632 0 $0 4 $99,345 0 $0 APPLICATIONS DENIED 10 $153,950 8 $236,119 222 $194,108 17 $42,331 0 $0 13 $87,778 4 $93,040 APPLICATIONS WITHDRAWN 13 $172,993 14 $167,606 174 $190,201 4 $154,962 0 $0 8 $94,238 1 $118,350 FILES CLOSED FOR INCOMPLETENESS 3 $165,173 7 $207,269 38 $167,388 1 $76,000 0 $0 1 $130,490 1 $23,780
Aggregated Statistics For Year 2008(Based on 1 full and 5 partial tracts) A) FHA, FSA/RHS & VA B) Conventional C) Refinancings D) Home Improvement Loans E) Loans on Dwellings For 5+ Families F) Non-occupant Loans on G) Loans On Manufactured Number Average Value Number Average Value Number Average Value Number Average Value Number Average Value Number Average Value Number Average Value
LOANS ORIGINATED 84 $173,089 225 $186,095 469 $180,149 49 $54,581 0 $0 49 $157,187 0 $0 APPLICATIONS APPROVED, NOT ACCEPTED 4 $147,600 22 $194,044 64 $154,571 13 $23,472 0 $0 11 $121,165 1 $64,970 APPLICATIONS DENIED 17 $182,311 39 $172,153 229 $178,750 50 $69,247 0 $0 10 $161,235 2 $53,965 APPLICATIONS WITHDRAWN 11 $187,990 36 $230,572 111 $178,512 15 $124,421 1 $9,745,920 6 $111,125 0 $0 FILES CLOSED FOR INCOMPLETENESS 1 $159,640 3 $164,433 28 $232,255 2 $61,340 0 $0 2 $109,800 0 $0
Aggregated Statistics For Year 2007(Based on 1 full and 5 partial tracts) A) FHA, FSA/RHS & VA B) Conventional C) Refinancings D) Home Improvement Loans E) Loans on Dwellings For 5+ Families F) Non-occupant Loans on G) Loans On Manufactured Number Average Value Number Average Value Number Average Value Number Average Value Number Average Value Number Average Value Number Average Value
LOANS ORIGINATED 32 $158,998 652 $168,725 446 $155,286 63 $52,960 2 $12,984,650 86 $145,999 1 $29,040 APPLICATIONS APPROVED, NOT ACCEPTED 0 $0 59 $179,751 95 $131,016 18 $56,358 0 $0 11 $165,143 0 $0 APPLICATIONS DENIED 6 $143,303 102 $161,448 275 $157,514 48 $74,824 0 $0 31 $141,681 4 $58,005 APPLICATIONS WITHDRAWN 7 $144,384 84 $167,979 141 $157,474 8 $110,960 0 $0 16 $131,954 0 $0 FILES CLOSED FOR INCOMPLETENESS 1 $51,760 14 $160,402 36 $162,083 0 $0 0 $0 3 $188,470 0 $0
Aggregated Statistics For Year 2006(Based on 1 full and 5 partial tracts) A) FHA, FSA/RHS & VA B) Conventional C) Refinancings D) Home Improvement Loans E) Loans on Dwellings For 5+ Families F) Non-occupant Loans on G) Loans On Manufactured Number Average Value Number Average Value Number Average Value Number Average Value Number Average Value Number Average Value Number Average Value
LOANS ORIGINATED 31 $157,448 830 $142,057 452 $136,682 51 $75,537 1 $25,457,160 127 $132,438 3 $79,650 APPLICATIONS APPROVED, NOT ACCEPTED 3 $137,717 100 $124,277 89 $116,874 11 $32,288 0 $0 15 $98,660 0 $0 APPLICATIONS DENIED 7 $158,683 122 $133,437 250 $144,934 32 $44,985 1 $116,000 20 $108,271 2 $87,585 APPLICATIONS WITHDRAWN 4 $149,082 94 $155,532 126 $154,490 10 $116,256 0 $0 14 $108,758 1 $83,940 FILES CLOSED FOR INCOMPLETENESS 0 $0 12 $189,508 34 $144,323 0 $0 0 $0 1 $72,610 0 $0
Aggregated Statistics For Year 2005(Based on 1 full and 5 partial tracts) A) FHA, FSA/RHS & VA B) Conventional C) Refinancings D) Home Improvement Loans E) Loans on Dwellings For 5+ Families F) Non-occupant Loans on G) Loans On Manufactured Number Average Value Number Average Value Number Average Value Number Average Value Number Average Value Number Average Value Number Average Value
LOANS ORIGINATED 34 $145,411 770 $142,761 526 $134,815 38 $62,448 1 $11,700,000 103 $118,922 2 $45,120 APPLICATIONS APPROVED, NOT ACCEPTED 1 $95,460 74 $155,581 106 $112,044 13 $47,156 0 $0 10 $112,369 3 $30,053 APPLICATIONS DENIED 6 $128,398 94 $138,456 252 $130,316 34 $52,394 0 $0 17 $118,573 1 $46,080 APPLICATIONS WITHDRAWN 6 $123,190 87 $138,493 164 $145,059 15 $132,836 0 $0 19 $110,737 0 $0 FILES CLOSED FOR INCOMPLETENESS 0 $0 14 $187,731 47 $159,521 1 $94,360 0 $0 1 $357,950 0 $0
Aggregated Statistics For Year 2004(Based on 1 full and 5 partial tracts) A) FHA, FSA/RHS & VA B) Conventional C) Refinancings D) Home Improvement Loans E) Loans on Dwellings For 5+ Families F) Non-occupant Loans on G) Loans On Manufactured Number Average Value Number Average Value Number Average Value Number Average Value Number Average Value Number Average Value Number Average Value
LOANS ORIGINATED 61 $129,418 587 $149,551 533 $136,870 25 $37,578 1 $5,752,800 64 $110,880 2 $72,750 APPLICATIONS APPROVED, NOT ACCEPTED 1 $189,620 45 $135,760 66 $134,790 11 $35,298 0 $0 6 $115,252 2 $24,260 APPLICATIONS DENIED 6 $134,253 71 $140,039 259 $123,639 31 $40,848 0 $0 12 $90,711 3 $68,723 APPLICATIONS WITHDRAWN 11 $135,381 59 $130,921 111 $137,449 6 $43,303 1 $5,922,000 10 $122,805 1 $24,480 FILES CLOSED FOR INCOMPLETENESS 0 $0 17 $154,250 56 $146,848 1 $18,190 0 $0 2 $123,195 0 $0
Aggregated Statistics For Year 2003(Based on 1 full and 5 partial tracts) A) FHA, FSA/RHS & VA B) Conventional C) Refinancings D) Home Improvement Loans F) Non-occupant Loans on Number Average Value Number Average Value Number Average Value Number Average Value Number Average Value
LOANS ORIGINATED 87 $127,729 465 $151,041 1,544 $141,846 22 $55,149 70 $109,162 APPLICATIONS APPROVED, NOT ACCEPTED 1 $75,710 22 $143,003 136 $144,491 14 $48,169 8 $99,516 APPLICATIONS DENIED 5 $135,636 71 $119,640 296 $138,583 32 $21,854 23 $117,240 APPLICATIONS WITHDRAWN 7 $136,794 52 $131,683 163 $128,177 2 $11,575 12 $118,862 FILES CLOSED FOR INCOMPLETENESS 1 $108,420 16 $127,996 39 $149,568 1 $34,130 3 $129,167
Aggregated Statistics For Year 1999(Based on 4 partial tracts) A) FHA, FSA/RHS & VA B) Conventional C) Refinancings D) Home Improvement Loans E) Loans on Dwellings For 5+ Families F) Non-occupant Loans on Number Average Value Number Average Value Number Average Value Number Average Value Number Average Value Number Average Value
LOANS ORIGINATED 143 $120,934 558 $139,739 450 $113,064 39 $23,211 1 $9,455,740 30 $85,785 APPLICATIONS APPROVED, NOT ACCEPTED 3 $111,270 42 $106,121 85 $98,876 24 $25,460 0 $0 6 $61,793 APPLICATIONS DENIED 12 $119,191 92 $103,998 167 $106,799 36 $23,035 0 $0 10 $81,638 APPLICATIONS WITHDRAWN 14 $127,390 49 $167,000 124 $110,435 9 $42,853 0 $0 4 $108,860 FILES CLOSED FOR INCOMPLETENESS 1 $234,770 14 $108,664 31 $116,737 0 $0 0 $0 1 $115,690
Detailed HMDA statistics for the following Tracts:
0057.08
, 0057.09 , 0057.12 , 0058.12 , 0058.13 , 0058.14
Private Mortgage Insurance Companies Aggregated Statistics For Year 2009(Based on 1 full and 5 partial tracts) A) Conventional B) Refinancings Number Average Value Number Average Value
LOANS ORIGINATED 21 $194,866 31 $190,059 APPLICATIONS APPROVED, NOT ACCEPTED 6 $217,283 10 $198,343 APPLICATIONS DENIED 3 $137,173 4 $158,322 APPLICATIONS WITHDRAWN 1 $176,740 2 $141,195 FILES CLOSED FOR INCOMPLETENESS 1 $120,470 2 $137,465
Aggregated Statistics For Year 2008(Based on 1 full and 5 partial tracts) A) Conventional B) Refinancings C) Non-occupant Loans on Number Average Value Number Average Value Number Average Value
LOANS ORIGINATED 78 $192,924 43 $181,903 11 $146,055 APPLICATIONS APPROVED, NOT ACCEPTED 22 $198,070 12 $188,898 2 $153,610 APPLICATIONS DENIED 4 $179,025 1 $116,120 0 $0 APPLICATIONS WITHDRAWN 3 $176,153 1 $71,320 0 $0 FILES CLOSED FOR INCOMPLETENESS 2 $260,010 0 $0 1 $104,780
Aggregated Statistics For Year 2007(Based on 1 full and 5 partial tracts) A) Conventional B) Refinancings C) Non-occupant Loans on Number Average Value Number Average Value Number Average Value
LOANS ORIGINATED 160 $179,502 48 $176,413 19 $145,947 APPLICATIONS APPROVED, NOT ACCEPTED 28 $177,598 8 $184,030 5 $213,496 APPLICATIONS DENIED 1 $279,050 2 $143,845 1 $120,690 APPLICATIONS WITHDRAWN 5 $182,238 3 $237,633 1 $69,120 FILES CLOSED FOR INCOMPLETENESS 0 $0 1 $207,360 1 $60,350
Aggregated Statistics For Year 2006(Based on 1 full and 5 partial tracts) A) Conventional B) Refinancings C) Non-occupant Loans on Number Average Value Number Average Value Number Average Value
LOANS ORIGINATED 79 $174,937 29 $175,196 14 $159,429 APPLICATIONS APPROVED, NOT ACCEPTED 11 $165,258 7 $188,837 1 $108,620 APPLICATIONS DENIED 0 $0 0 $0 0 $0 APPLICATIONS WITHDRAWN 5 $187,490 4 $156,100 2 $108,625 FILES CLOSED FOR INCOMPLETENESS 1 $217,790 0 $0 1 $217,790
Aggregated Statistics For Year 2005(Based on 1 full and 5 partial tracts) A) Conventional B) Refinancings C) Non-occupant Loans on D) Loans On Manufactured Number Average Value Number Average Value Number Average Value Number Average Value
LOANS ORIGINATED 78 $179,857 39 $166,827 13 $162,228 1 $31,480 APPLICATIONS APPROVED, NOT ACCEPTED 7 $199,389 9 $131,138 2 $99,655 0 $0 APPLICATIONS DENIED 1 $316,000 0 $0 0 $0 0 $0 APPLICATIONS WITHDRAWN 2 $175,395 2 $140,460 0 $0 0 $0 FILES CLOSED FOR INCOMPLETENESS 0 $0 0 $0 0 $0 0 $0
Aggregated Statistics For Year 2004(Based on 1 full and 5 partial tracts) A) Conventional B) Refinancings C) Non-occupant Loans on Number Average Value Number Average Value Number Average Value
LOANS ORIGINATED 79 $151,093 55 $150,471 16 $138,198 APPLICATIONS APPROVED, NOT ACCEPTED 9 $177,961 23 $169,778 1 $267,710 APPLICATIONS DENIED 3 $207,120 0 $0 1 $200,780 APPLICATIONS WITHDRAWN 5 $151,608 4 $141,468 0 $0 FILES CLOSED FOR INCOMPLETENESS 1 $114,040 3 $169,423 0 $0
Aggregated Statistics For Year 2003(Based on 1 full and 5 partial tracts) A) Conventional B) Refinancings C) Non-occupant Loans on Number Average Value Number Average Value Number Average Value
LOANS ORIGINATED 101 $149,007 165 $148,811 11 $114,555 APPLICATIONS APPROVED, NOT ACCEPTED 8 $166,015 32 $160,308 3 $86,733 APPLICATIONS DENIED 3 $101,500 3 $115,293 2 $131,550 APPLICATIONS WITHDRAWN 2 $126,615 8 $145,235 0 $0 FILES CLOSED FOR INCOMPLETENESS 0 $0 0 $0 0 $0
Aggregated Statistics For Year 1999(Based on 4 partial tracts) A) Conventional B) Refinancings C) Non-occupant Loans on Number Average Value Number Average Value Number Average Value
LOANS ORIGINATED 173 $143,334 64 $132,743 6 $98,490 APPLICATIONS APPROVED, NOT ACCEPTED 9 $140,352 9 $134,429 1 $74,780 APPLICATIONS DENIED 7 $136,699 1 $170,560 1 $56,600 APPLICATIONS WITHDRAWN 5 $147,246 0 $0 0 $0 FILES CLOSED FOR INCOMPLETENESS 1 $120,090 0 $0 0 $0
Detailed PMIC statistics for the following Tracts:
0057.08
, 0057.09 , 0057.12 , 0058.12 , 0058.13 , 0058.14 Fire-safe hotels and motels in Matthews, North Carolina:
Sleep Inn Matthews, 9900 Matthews Park Dr, Matthews, North Carolina 28105 Phone: (704) 841-1660, Fax: (704) 845-8004
In Town Suites Matthews, 9211 E Independence Blvd, Matthews, North Carolina 28105 Phone: (704) 845-2001, Fax: (704) 845-2275
Intown Suites Charlotte Southeast, 12895 Independence, Matthews, North Carolina 28105 Phone: (704) 882-4768, Fax: (704) 882-0185
Holiday Inn Express & Suites-Matthews, 9420 E Independence Blvd, Matthews, North Carolina 28105 Phone: (704) 443-3100, Fax: (704) 443-3102
All 4 fire-safe hotels and motels in Matthews, North Carolina
Most common first names in Matthews, NC among deceased individuals Name Count Lived (average)
William 174 75.8 years Mary 163 80.8 years James 147 72.5 years Robert 138 72.4 years John 131 75.1 years Charles 77 70.9 years George 60 75.7 years Helen 59 82.9 years Margaret 58 78.5 years Elizabeth 56 83.7 years
Most common last names in Matthews, NC among deceased individuals Last name Count Lived (average)
Helms 67 74.1 years Smith 65 76.5 years Williams 54 76.5 years Morris 34 69.3 years Johnson 34 77.0 years Moore 34 76.2 years Thompson 30 80.6 years Thomas 29 78.6 years Davis 26 68.7 years Mullis 26 75.6 years
Matthews compared to North Carolina state average:
Median household income above state average. Median house value above state average. Unemployed percentage significantly below state average. Median age below state average. Foreign-born population percentage above state average. Length of stay since moving in significantly above state average. House age below state average. Percentage of population with a bachelor's degree or higher above state average.
#70 on the list of "Top 101 cities with the most residents born in Middle Africa (population 500+)"
#9 on the list of "Top 101 counties with the most Mainline Protestant adherents"
#24 on the list of "Top 101 counties with the most Evangelical Protestant adherents"
#26 on the list of "Top 101 counties with the most Mainline Protestant congregations"
#30 on the list of "Top 101 counties with the most Orthodox adherents"
#31 on the list of "Top 101 counties with the most Evangelical Protestant congregations"
Top Patent Applicants
Kurt D. Newman (32)
Brian V. Conti (27)
Glenn Grossman (25)
Kurt Newman (23)
Ronald Carter (18)
Glenn M. Grossman (15)
Lie Shi (11)
Jeffrey N. Healy (10)
Paul Ronald Dekoster (8)
Robert Joseph Schiavone (7)
Total of 590 patent applications in 2008-2024.


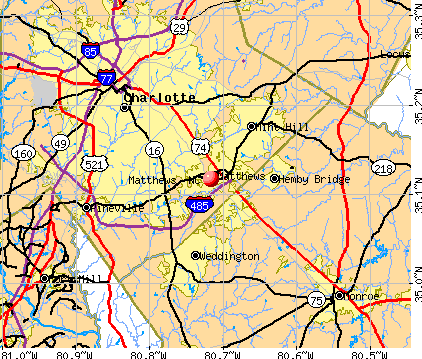


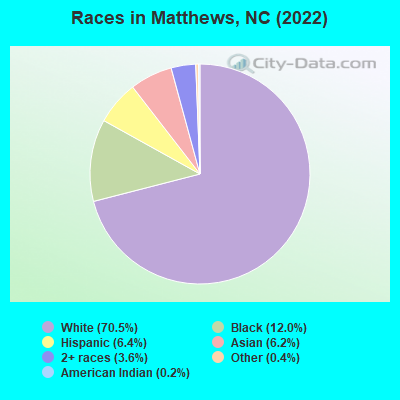
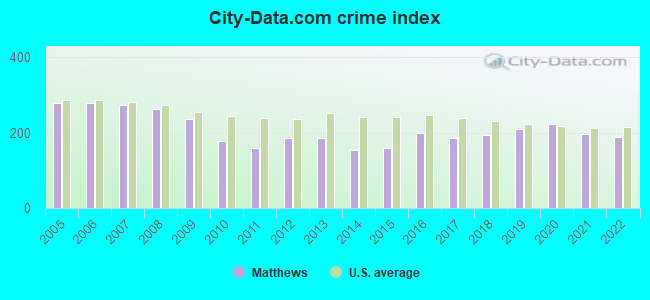
 Recent articles from our blog. Our writers, many of them Ph.D. graduates or candidates, create easy-to-read articles on a wide variety of topics.


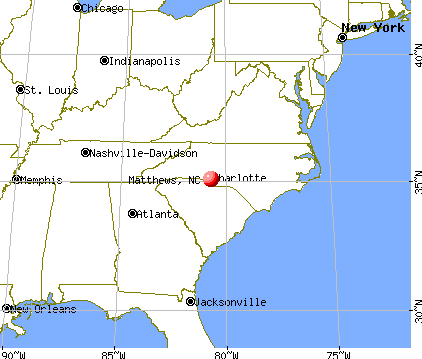
 (8.9 miles
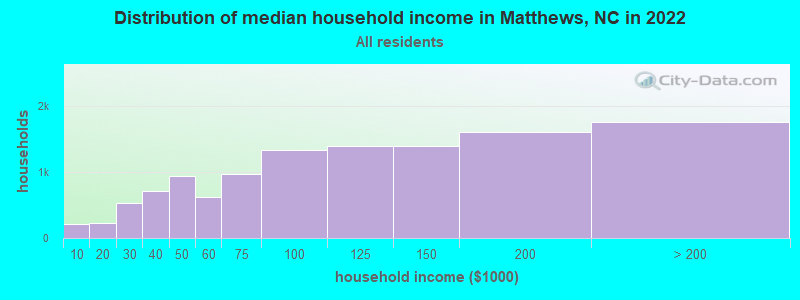
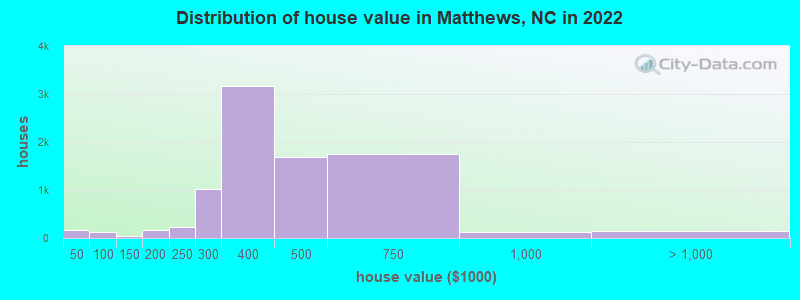
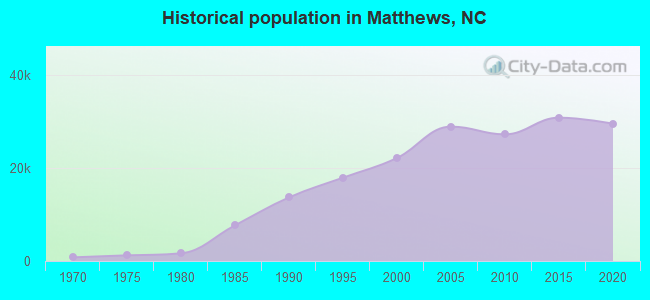
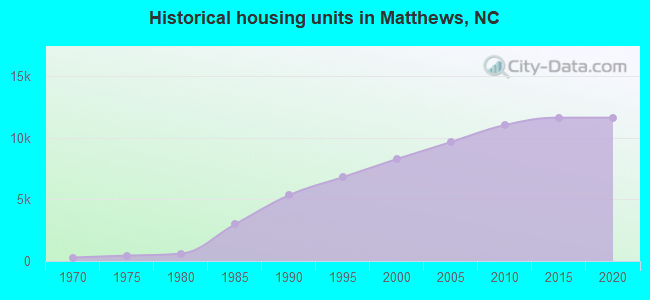
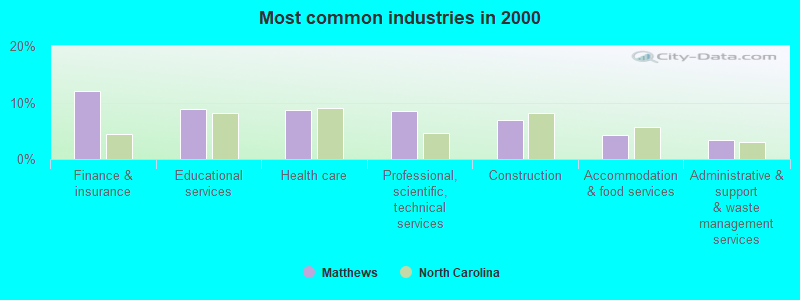
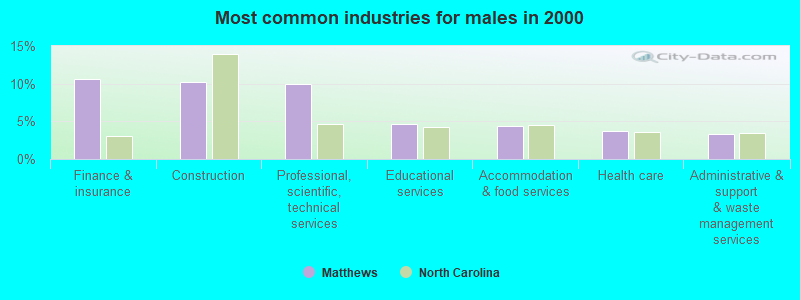
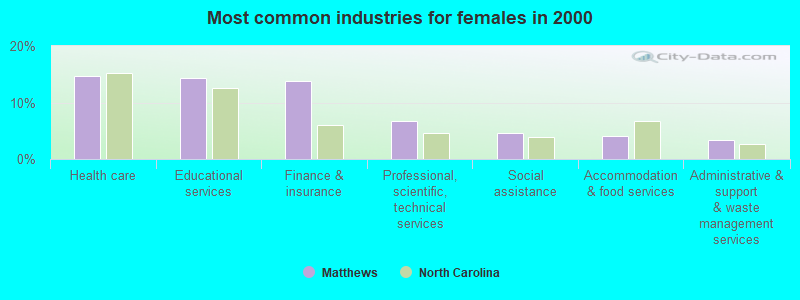
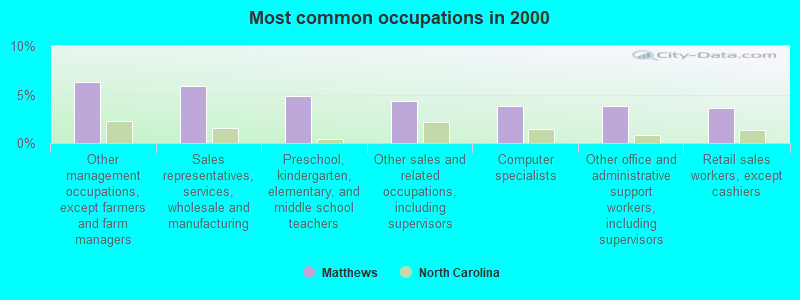
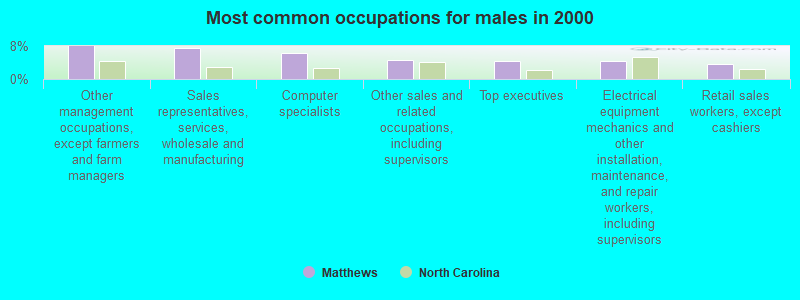
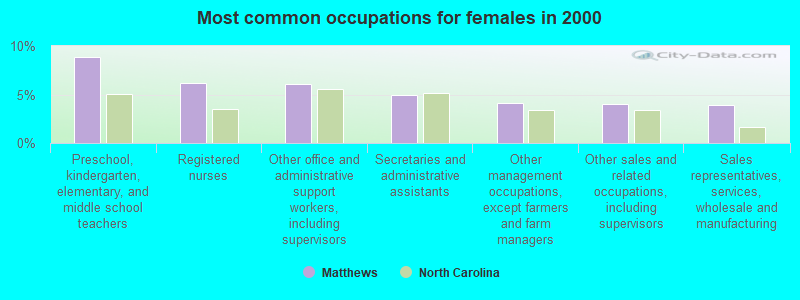
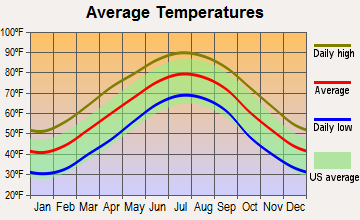
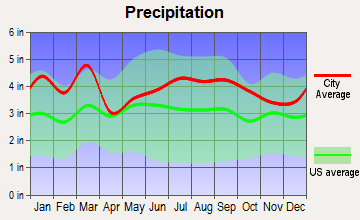
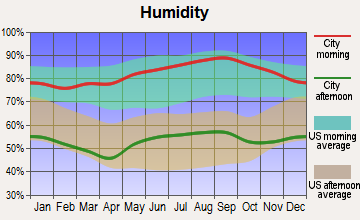
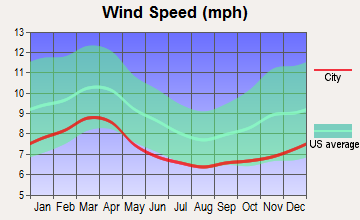
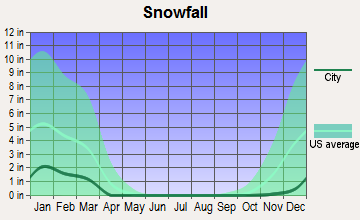
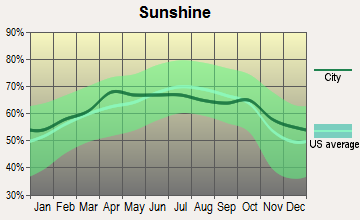
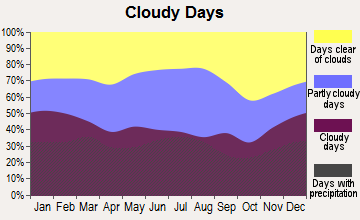


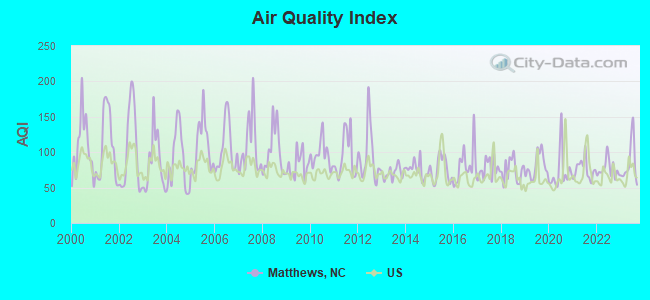
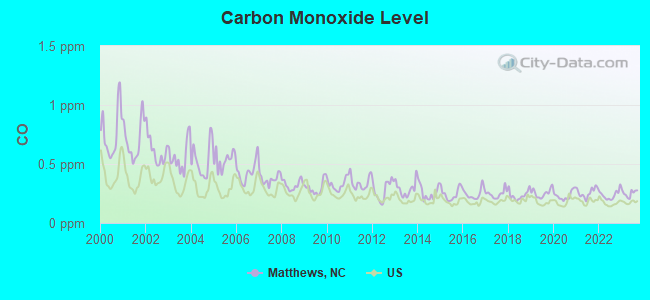
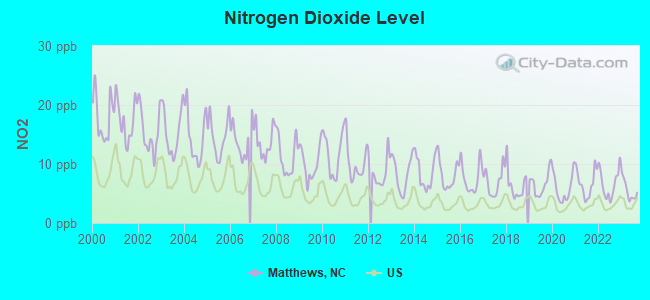
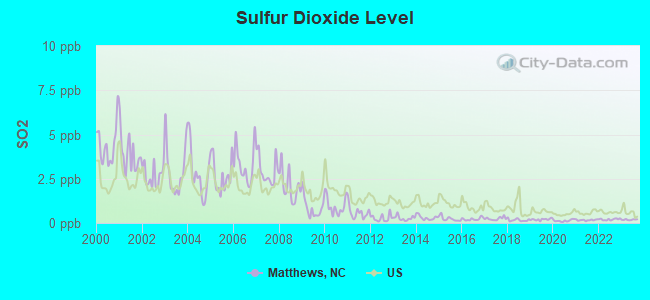
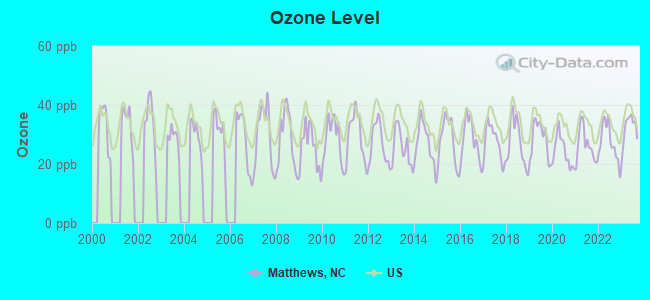
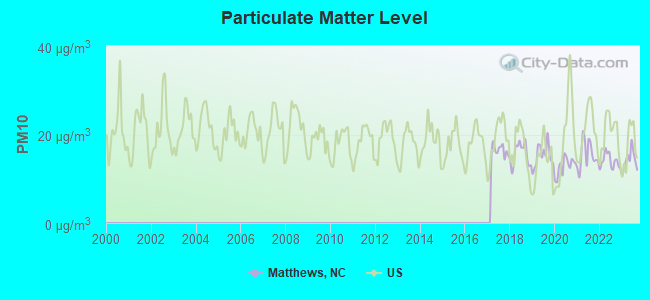
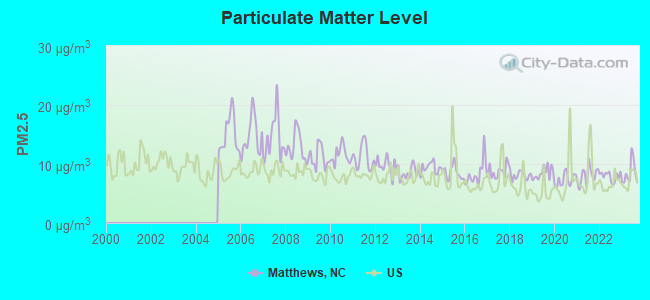
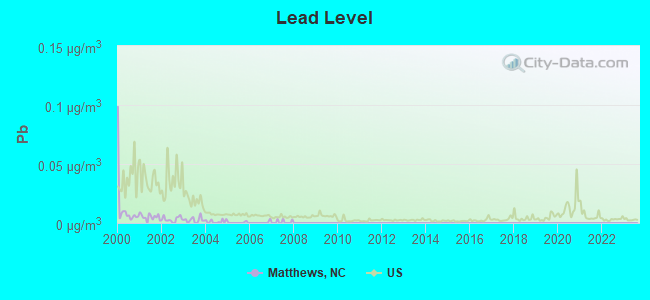
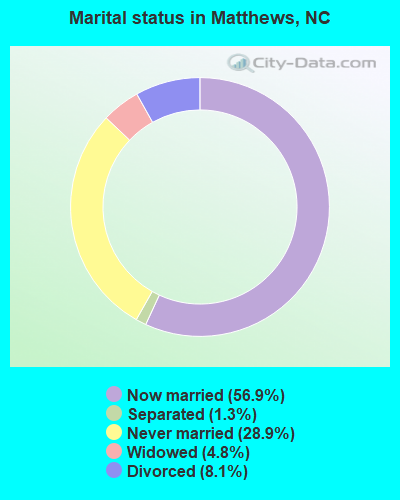
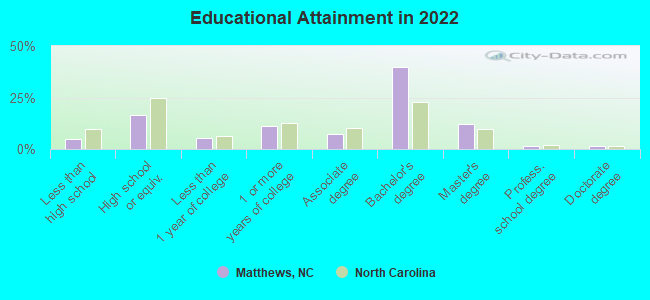
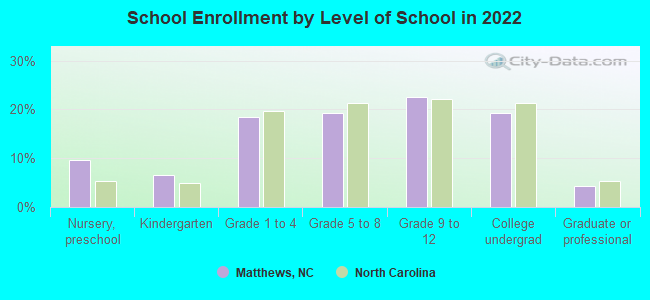
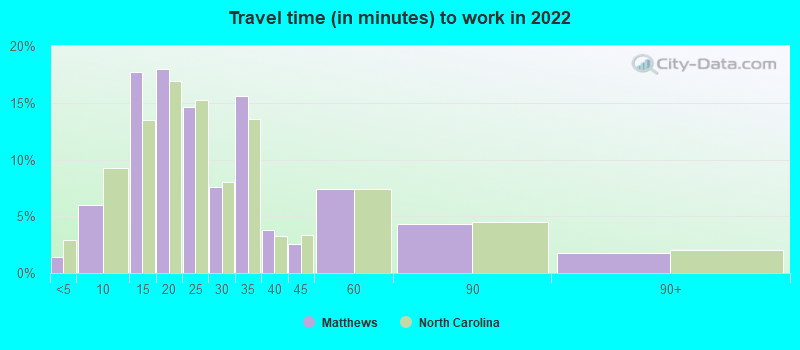
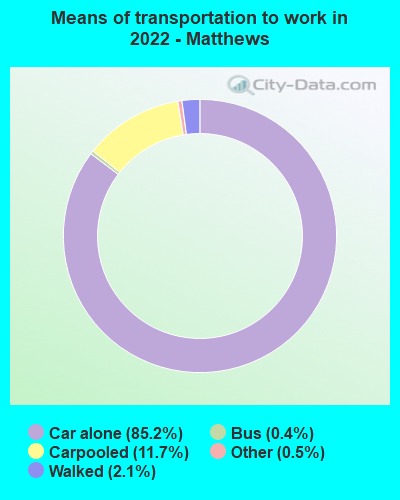
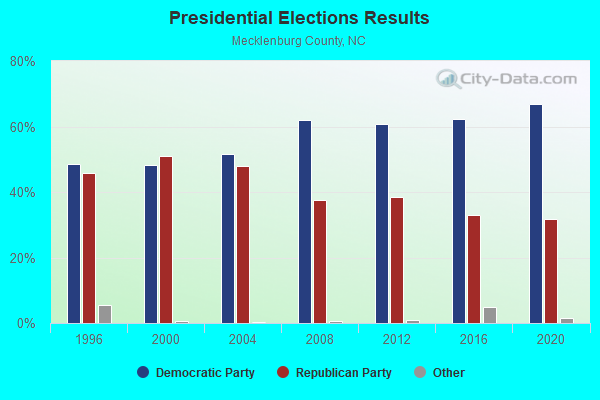
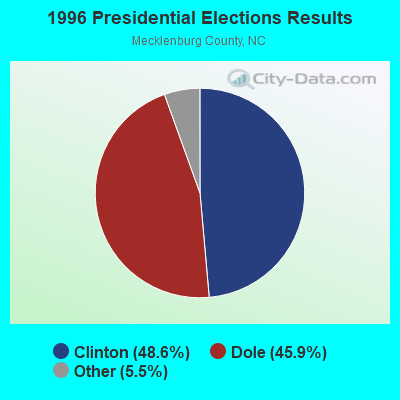
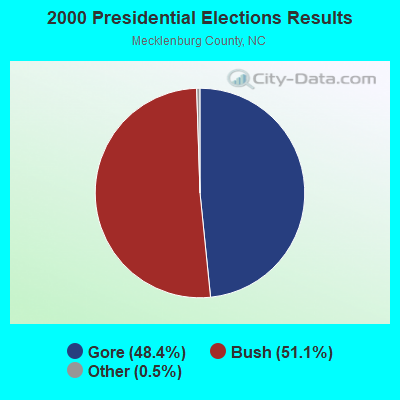
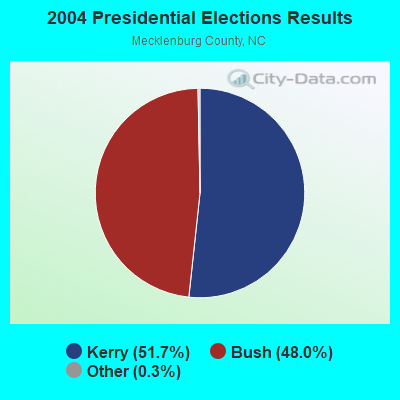
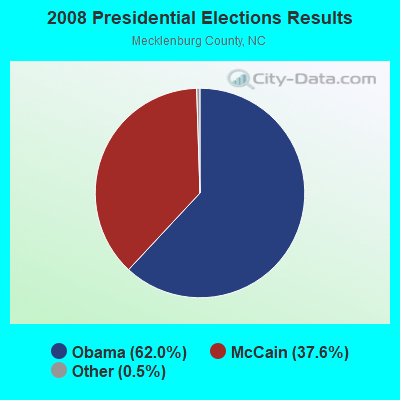
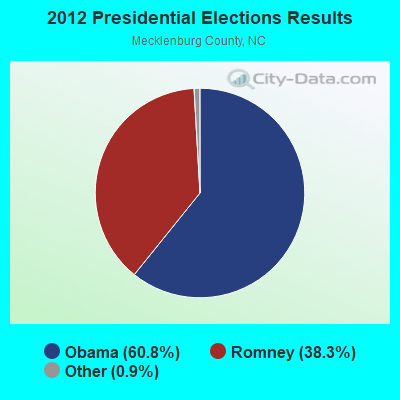
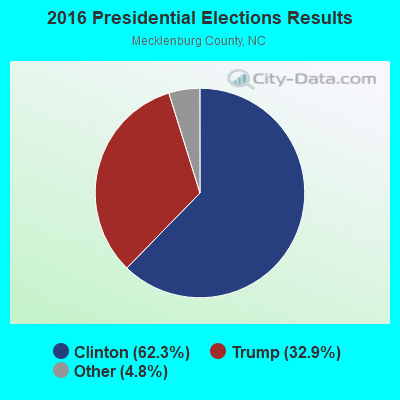
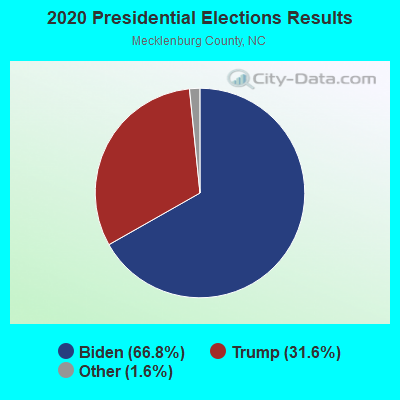
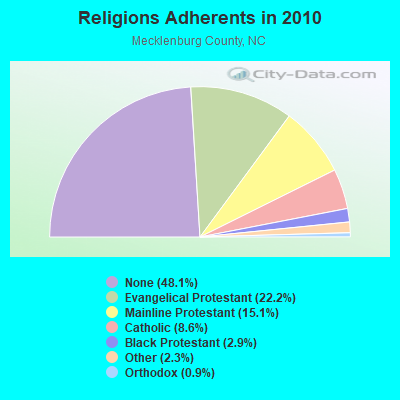
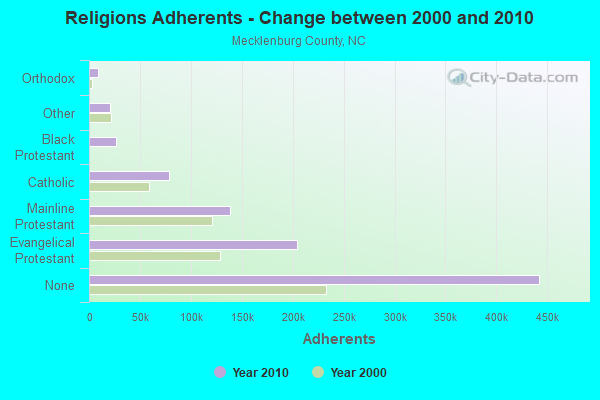
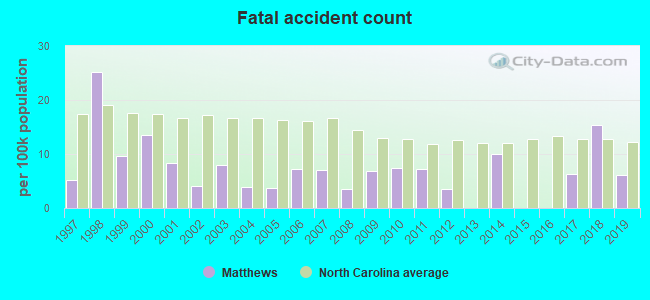
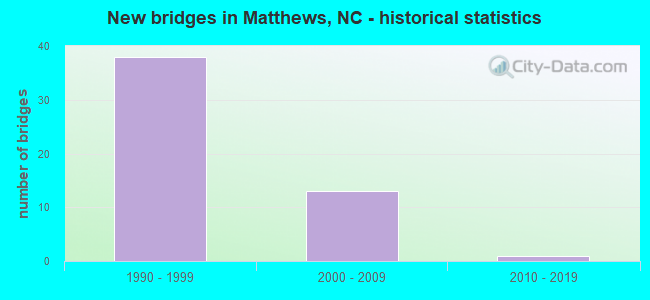
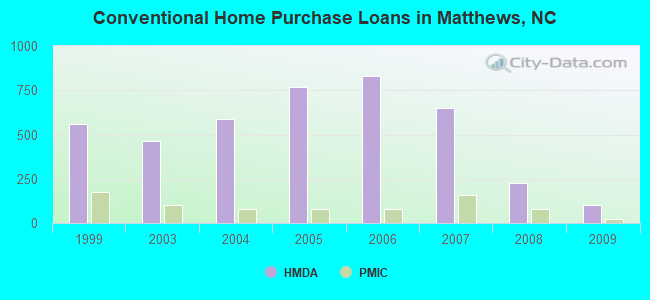
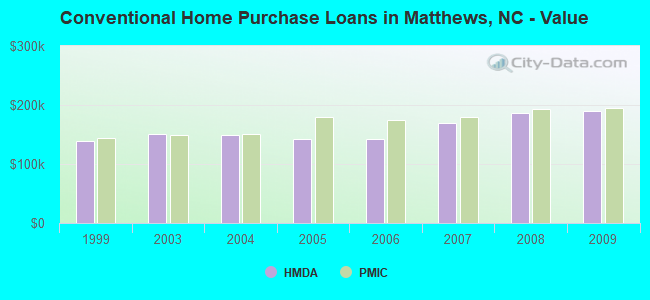
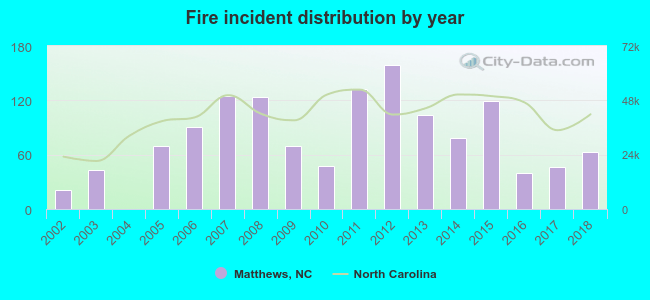 Based on the data from the years 2002 - 2018 the average number of fires per year is 78. The highest number of fires - 159 took place in 2012, and the least - 0 in 2004. The data has a growing trend.
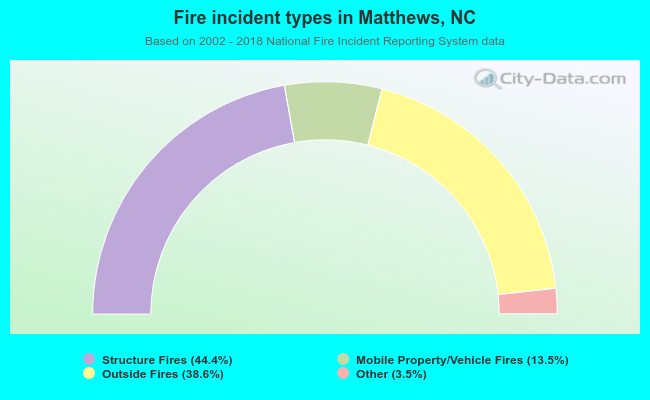 When looking into fire subcategories, the most incidents belonged to: Structure Fires (44.4%), and Outside Fires (38.6%).