Marion, Arkansas
Submit your own pictures of this city and show them to the world
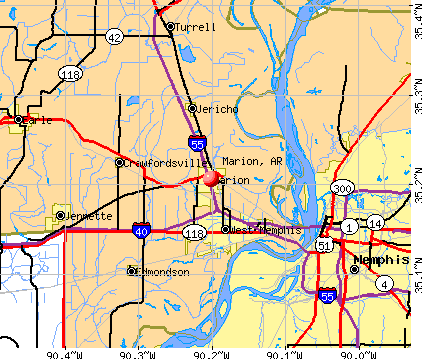
- OSM Map
- General Map
- Google Map
- MSN Map
Population change since 2000: +52.7%
| Males: 6,813 | |
| Females: 6,783 |
| Median resident age: | 36.0 years |
| Arkansas median age: | 38.9 years |
Zip codes: 72364.
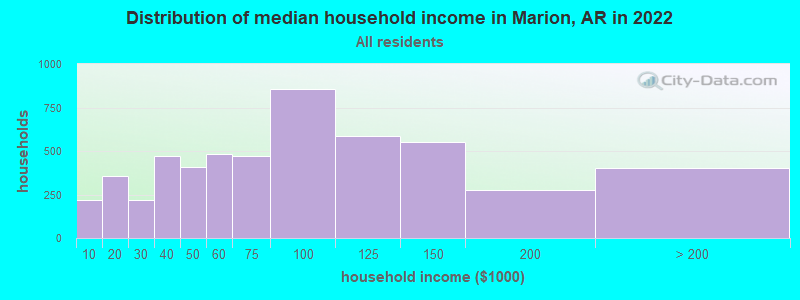
| Marion: | $76,110 |
| AR: | $55,432 |
Estimated per capita income in 2022: $36,909 (it was $19,074 in 2000)
Marion city income, earnings, and wages data
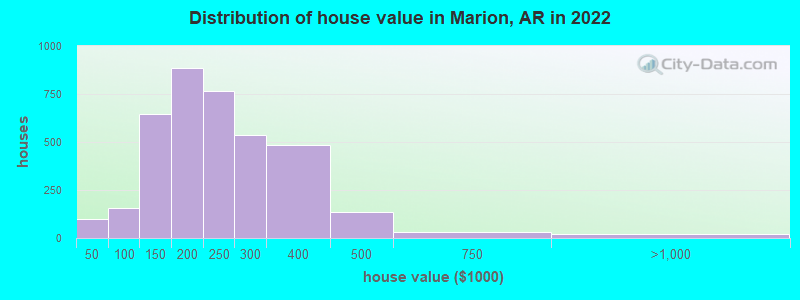
Estimated median house or condo value in 2022: $207,368 (it was $95,600 in 2000)
| Marion: | $207,368 |
| AR: | $179,800 |
Mean prices in 2022: all housing units: $243,678; detached houses: $246,204; mobile homes: $22,126
Median gross rent in 2022: $983.
(6.9% for White Non-Hispanic residents, 10.0% for Black residents, 5.2% for Hispanic or Latino residents, 6.4% for two or more races residents)
Detailed information about poverty and poor residents in Marion, AR
Compare current foreclosures in Marion, AR:
| Photo | Address | Area | Beds / Baths | Price | Details |
|---|---|---|---|---|---|

|
#1
Brunetti Ln
Marion, AR 72364
|
1,357 sq. feet
|
2 baths 3 beds |
show details | |

|
#2
Pleasant Woods Dr
Marion, AR 72364
|
2,306 sq. feet
|
3 baths 5 beds |
show details | |

|
#3
Crittenden Blvd
Marion, AR 72364
|
- sq. feet
|
2 baths 3 beds |
show details | |

|
#4
Haley Cv
Marion, AR 72364
|
1,523 sq. feet
|
2 baths 3 beds |
show details | |

|
#5
Dozier Cir
Marion, AR 72364
|
1,148 sq. feet
|
2 baths - beds |
show details | |

|
#6
Edgewood Cv
Marion, AR 72364
|
1,831 sq. feet
|
2 baths - beds |
show details | |

|
#7
Masbend Cv
Marion, AR 72364
|
2,473 sq. feet
|
2 baths - beds |
show details | |

|
#8
Gail Cv
Marion, AR 72364
|
1,565 sq. feet
|
2 baths - beds |
show details | |

|
#9
Shiloh Dr
Marion, AR 72364
|
1,354 sq. feet
|
1 baths - beds |
show details | |

|
#10
Sturch Cv
Marion, AR 72364
|
1,430 sq. feet
|
2 baths - beds |
show details |
| Photo | Address | Area | Beds / Baths | Price | Details |
|---|---|---|---|---|---|

|
#11
Southwind Dr
Marion, AR 72364
|
1,888 sq. feet
|
2 baths - beds |
show details | |

|
#12
E Brick Dr
Marion, AR 72364
|
1,248 sq. feet
|
2 baths - beds |
show details | |

|
#13
Riverwest Cir
Marion, AR 72364
|
2,668 sq. feet
|
3 baths - beds |
show details | |

|
#14
Marquette Ln
Marion, AR 72364
|
2,585 sq. feet
|
2 baths - beds |
show details | |

|
#15
Blair Dr
Marion, AR 72364
|
2,068 sq. feet
|
2 baths - beds |
show details | |

|
#16
Bayou Vista Dr
Marion, AR 72364
|
2,474 sq. feet
|
2 baths - beds |
show details | |

|
#17
Wintree Ln
Marion, AR 72364
|
1,767 sq. feet
|
2 baths - beds |
show details | |

|
#18
Cabriolet St
Marion, AR 72364
|
1,337 sq. feet
|
2 baths - beds |
show details | |

|
#19
Whispering Wind Cir
Marion, AR 72364
|
1,582 sq. feet
|
1 baths - beds |
show details | |

|
#20
Lackey Rd
Marion, AR 72364
|
1,470 sq. feet
|
2 baths - beds |
show details |
| Photo | Address | Area | Beds / Baths | Price | Details |
|---|---|---|---|---|---|

|
#21
Forbis Ln
Marion, AR 72364
|
1,939 sq. feet
|
2 baths - beds |
show details | |

|
#22
Nicks Cv
Marion, AR 72364
|
1,242 sq. feet
|
2 baths - beds |
show details | |

|
#23
L H Polk Dr
Marion, AR 72364
|
2,171 sq. feet
|
2 baths - beds |
show details | |

|
#24
Koser Dr
Marion, AR 72364
|
2,325 sq. feet
|
2 baths - beds |
show details | |

|
#25
Jackson Sq
Marion, AR 72364
|
1,152 sq. feet
|
2 baths - beds |
show details | |

|
#26
Sorrell Cir
Marion, AR 72364
|
- sq. feet
|
- baths - beds |
show details | |

|
#27
Birdie Dr Apt 8
Marion, AR 72364
|
- sq. feet
|
- baths - beds |
show details | |

|
#28
Patricia Ln
Marion, AR 72364
|
- sq. feet
|
- baths - beds |
show details | |

|
#29
Rue Le Maison Dr
Marion, AR 72364
|
- sq. feet
|
- baths - beds |
show details | |

|
#30
Long Leaf Dr
Marion, AR 72364
|
- sq. feet
|
- baths - beds |
show details |
| Photo | Address | Area | Beds / Baths | Price | Details |
|---|---|---|---|---|---|

|
#31
E Surrey Trce
Marion, AR 72364
|
- sq. feet
|
- baths - beds |
show details | |

|
#32
Stonebrook Loop, Apt A
Marion, AR 72364
|
- sq. feet
|
- baths - beds |
show details | |

|
#33
Powell St
Marion, AR 72364
|
- sq. feet
|
- baths - beds |
show details | |

|
#34
Caroline Ln Apt 1
Marion, AR 72364
|
- sq. feet
|
- baths - beds |
show details | |

|
#35
Boulevard Orleans St
Marion, AR 72364
|
- sq. feet
|
- baths - beds |
show details | |

|
#36
Shiloh Dr
Marion, AR 72364
|
- sq. feet
|
- baths - beds |
show details | |

|
#37
Robinson Dr
Marion, AR 72364
|
- sq. feet
|
- baths - beds |
show details | |

|
#38
Judge Smith Dr Apt 8
Marion, AR 72364
|
- sq. feet
|
- baths - beds |
show details | |

|
#39
Southwind Dr
Marion, AR 72364
|
- sq. feet
|
- baths - beds |
show details | |

|
Check over 1 million property listings on Foreclosure.com!
|
browse all offers | |||


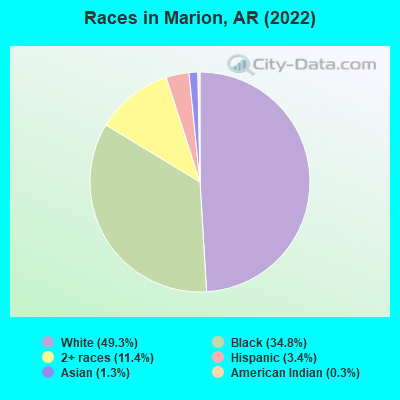
- 6,78849.3%White alone
- 4,78334.8%Black alone
- 1,56511.4%Two or more races
- 4693.4%Hispanic
- 1851.3%Asian alone
- 380.3%American Indian alone
According to our research of Arkansas and other state lists, there were 29 registered sex offenders living in Marion, Arkansas as of May 12, 2024.
The ratio of all residents to sex offenders in Marion is 428 to 1.
The ratio of registered sex offenders to all residents in this city is near the state average.
Type |
2009 |
2010 |
2011 |
2012 |
2013 |
2014 |
2015 |
2016 |
2017 |
2018 |
2019 |
2020 |
2021 |
2022 |
|---|---|---|---|---|---|---|---|---|---|---|---|---|---|---|
| Murders (per 100,000) | 0 (0.0) | 0 (0.0) | 2 (16.1) | 0 (0.0) | 0 (0.0) | 0 (0.0) | 0 (0.0) | 1 (8.1) | 1 (8.1) | 0 (0.0) | 0 (0.0) | 0 (0.0) | 7 (57.1) | 2 (14.7) |
| Rapes (per 100,000) | 4 (31.6) | 4 (32.4) | 8 (64.3) | 5 (40.7) | 13 (106.1) | 3 (24.4) | 9 (73.2) | 16 (130.4) | 7 (56.7) | 14 (112.7) | 12 (97.2) | 10 (81.4) | 9 (73.4) | 8 (58.8) |
| Robberies (per 100,000) | 6 (47.5) | 13 (105.3) | 7 (56.3) | 10 (81.3) | 8 (65.3) | 9 (73.1) | 19 (154.5) | 21 (171.1) | 19 (153.8) | 20 (161.0) | 11 (89.1) | 10 (81.4) | 4 (32.6) | 5 (36.8) |
| Assaults (per 100,000) | 58 (458.8) | 44 (356.4) | 53 (426.1) | 48 (390.2) | 70 (571.1) | 46 (373.7) | 69 (560.9) | 68 (554.2) | 106 (857.9) | 92 (740.4) | 99 (802.0) | 137 (1,115) | 120 (978.3) | 81 (595.5) |
| Burglaries (per 100,000) | 189 (1,495) | 154 (1,247) | 151 (1,214) | 173 (1,407) | 144 (1,175) | 117 (950.5) | 117 (951.1) | 84 (684.6) | 80 (647.5) | 144 (1,159) | 61 (494.2) | 54 (439.6) | 60 (489.2) | 74 (544.0) |
| Thefts (per 100,000) | 193 (1,527) | 277 (2,244) | 264 (2,123) | 247 (2,008) | 245 (1,999) | 402 (3,266) | 361 (2,935) | 383 (3,121) | 314 (2,541) | 326 (2,624) | 292 (2,366) | 282 (2,295) | 271 (2,209) | 268 (1,970) |
| Auto thefts (per 100,000) | 18 (142.4) | 19 (153.9) | 14 (112.6) | 21 (170.7) | 17 (138.7) | 18 (146.2) | 22 (178.8) | 22 (179.3) | 23 (186.1) | 35 (281.7) | 27 (218.7) | 31 (252.3) | 19 (154.9) | 36 (264.7) |
| Arson (per 100,000) | 1 (7.9) | 1 (8.1) | 1 (8.0) | 5 (40.7) | 5 (40.8) | 1 (8.1) | 2 (16.3) | 7 (57.0) | 1 (8.1) | 2 (16.1) | 1 (8.1) | 1 (8.1) | 1 (8.2) | 4 (29.4) |
| City-Data.com crime index | 308.4 | 318.2 | 364.6 | 327.4 | 391.9 | 325.0 | 415.3 | 469.9 | 441.1 | 495.1 | 411.6 | 455.4 | 513.3 | 344.7 |
The City-Data.com crime index weighs serious crimes and violent crimes more heavily. Higher means more crime, U.S. average is 246.1. It adjusts for the number of visitors and daily workers commuting into cities.
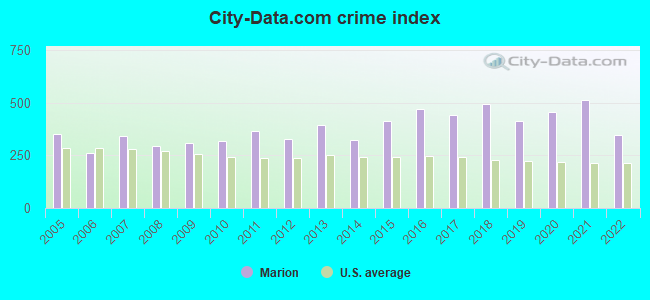
Crime rate in Marion detailed stats: murders, rapes, robberies, assaults, burglaries, thefts, arson
Full-time law enforcement employees in 2021, including police officers: 35 (30 officers - 24 male; 6 female).
| Officers per 1,000 residents here: | 2.45 |
| Arkansas average: | 2.25 |
 Recent articles from our blog. Our writers, many of them Ph.D. graduates or candidates, create easy-to-read articles on a wide variety of topics.


 | Point us in the right direction (47 replies) |
| Guy holds up Black Lives Matter Sign in Harrison (163 replies) |
| Is one part of Arkansas as muggy as the other? (17 replies) |
| What is Jonesboro like? (9 replies) |
| Little Rock Move Mistake (37 replies) |
| Hopefully moving to Arkansas for retirement (86 replies) |
Latest news from Marion, AR collected exclusively by city-data.com from local newspapers, TV, and radio stations
Ancestries: American (22.6%), English (7.1%), Irish (4.6%), European (2.4%), German (2.2%).
Current Local Time: CST time zone
Incorporated on 03/05/1896
Elevation: 225 feet
Land area: 13.4 square miles.
Population density: 1,013 people per square mile (low).
396 residents are foreign born (1.2% Asia, 0.7% Latin America, 0.6% North America).
| This city: | 2.9% |
| Arkansas: | 5.0% |
Median real estate property taxes paid for housing units with mortgages in 2022: $1,413 (0.6%)
Median real estate property taxes paid for housing units with no mortgage in 2022: $1,675 (0.8%)
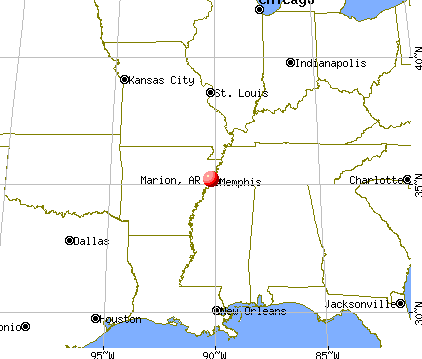
Nearest city with pop. 50,000+: Memphis, TN  (14.4 miles , pop. 650,100).
Nearest city with pop. 1,000,000+: Dallas, TX (412.6 miles , pop. 1,188,580).
Nearest cities:
), ), ), ), Latitude: 35.21 N, Longitude: 90.20 W
Daytime population change due to commuting: -2,796 (-20.3%)
Workers who live and work in this city: 1,654 (24.7%)
Area code: 870
Marion, Arkansas accommodation & food services, waste management - Economy and Business Data
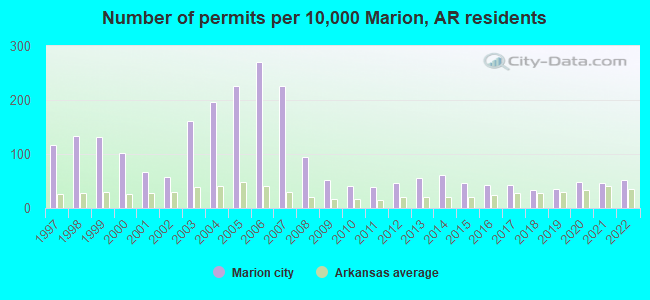
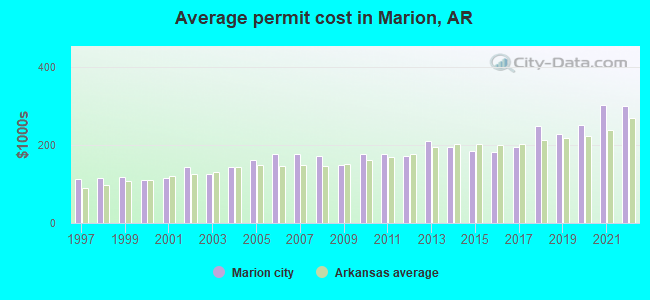
Single-family new house construction building permits:
- 2022: 45 buildings, average cost: $299,600
- 2021: 42 buildings, average cost: $303,700
- 2020: 43 buildings, average cost: $252,100
- 2019: 32 buildings, average cost: $229,000
- 2018: 29 buildings, average cost: $250,200
- 2017: 38 buildings, average cost: $194,800
- 2016: 38 buildings, average cost: $181,600
- 2015: 41 buildings, average cost: $183,700
- 2014: 54 buildings, average cost: $196,100
- 2013: 49 buildings, average cost: $209,600
- 2012: 42 buildings, average cost: $172,800
- 2011: 35 buildings, average cost: $178,400
- 2010: 36 buildings, average cost: $176,900
- 2009: 45 buildings, average cost: $148,600
- 2008: 84 buildings, average cost: $171,300
- 2007: 200 buildings, average cost: $176,600
- 2006: 240 buildings, average cost: $177,200
- 2005: 201 buildings, average cost: $160,900
- 2004: 175 buildings, average cost: $143,900
- 2003: 143 buildings, average cost: $127,100
- 2002: 52 buildings, average cost: $144,400
- 2001: 60 buildings, average cost: $116,100
- 2000: 90 buildings, average cost: $111,300
- 1999: 117 buildings, average cost: $117,300
- 1998: 119 buildings, average cost: $116,100
- 1997: 103 buildings, average cost: $114,300
| Here: | 4.2% |
| Arkansas: | 3.4% |
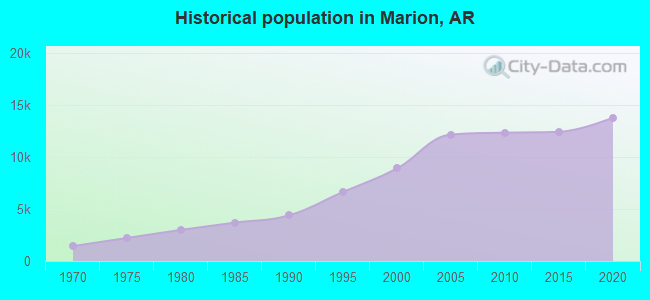
Population change in the 1990s: +4,155 (+87.5%).
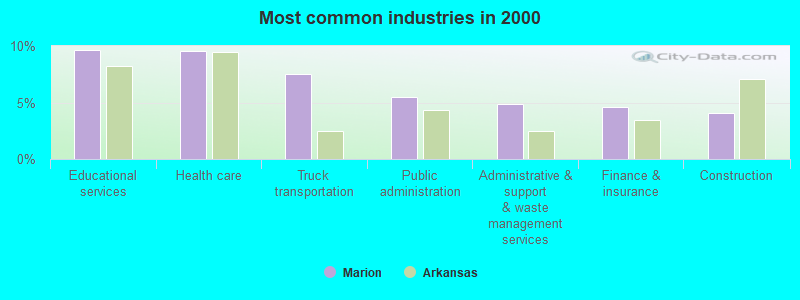
- Educational services (9.6%)
- Health care (9.6%)
- Truck transportation (7.5%)
- Public administration (5.5%)
- Administrative & support & waste management services (4.9%)
- Finance & insurance (4.6%)
- Construction (4.1%)
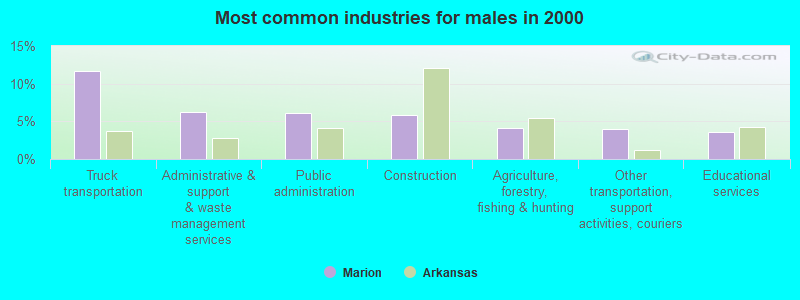
- Truck transportation (11.6%)
- Administrative & support & waste management services (6.2%)
- Public administration (6.1%)
- Construction (5.8%)
- Agriculture, forestry, fishing & hunting (4.1%)
- Other transportation, support activities, couriers (4.0%)
- Educational services (3.6%)
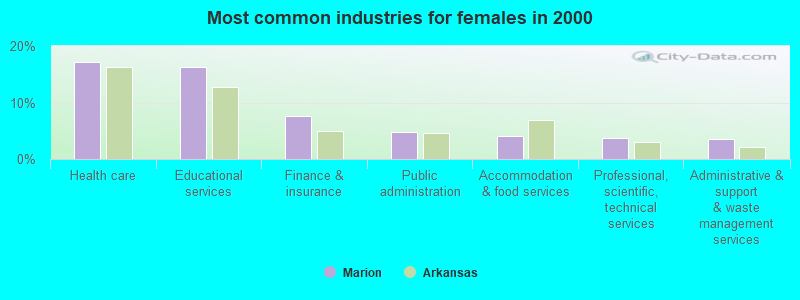
- Health care (17.1%)
- Educational services (16.3%)
- Finance & insurance (7.7%)
- Public administration (4.8%)
- Accommodation & food services (4.2%)
- Professional, scientific, technical services (3.8%)
- Administrative & support & waste management services (3.5%)
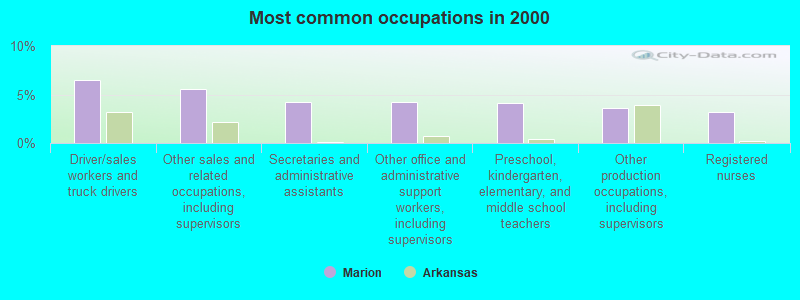
- Driver/sales workers and truck drivers (6.5%)
- Other sales and related occupations, including supervisors (5.6%)
- Secretaries and administrative assistants (4.2%)
- Other office and administrative support workers, including supervisors (4.2%)
- Preschool, kindergarten, elementary, and middle school teachers (4.1%)
- Other production occupations, including supervisors (3.6%)
- Registered nurses (3.1%)
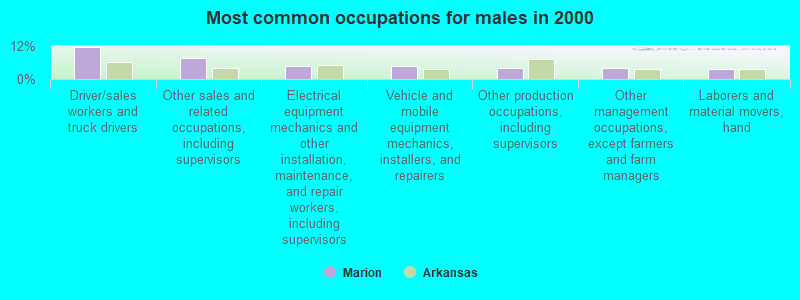
- Driver/sales workers and truck drivers (11.6%)
- Other sales and related occupations, including supervisors (7.5%)
- Electrical equipment mechanics and other installation, maintenance, and repair workers, including supervisors (4.9%)
- Vehicle and mobile equipment mechanics, installers, and repairers (4.8%)
- Other production occupations, including supervisors (4.2%)
- Other management occupations, except farmers and farm managers (4.0%)
- Laborers and material movers, hand (3.6%)
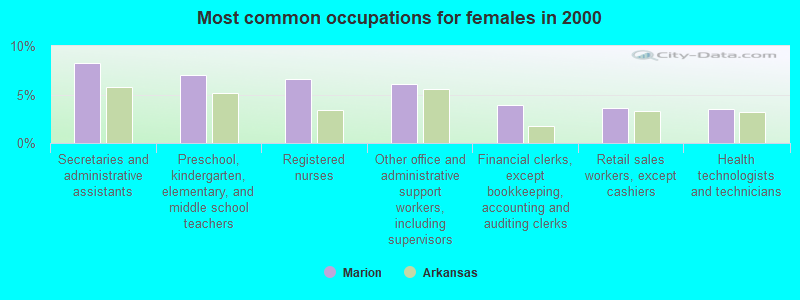
- Secretaries and administrative assistants (8.2%)
- Preschool, kindergarten, elementary, and middle school teachers (7.0%)
- Registered nurses (6.6%)
- Other office and administrative support workers, including supervisors (6.1%)
- Financial clerks, except bookkeeping, accounting and auditing clerks (3.9%)
- Retail sales workers, except cashiers (3.6%)
- Health technologists and technicians (3.5%)
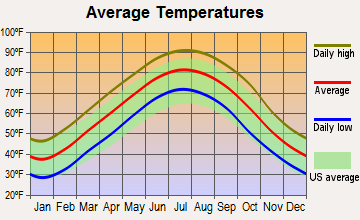
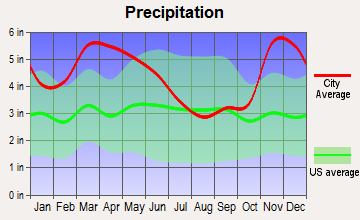
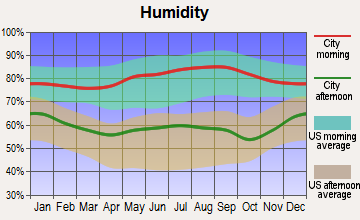
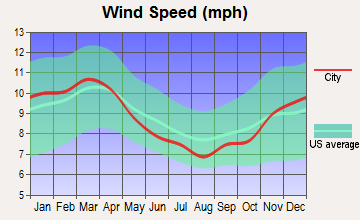
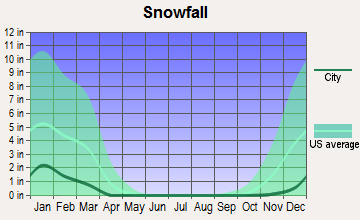
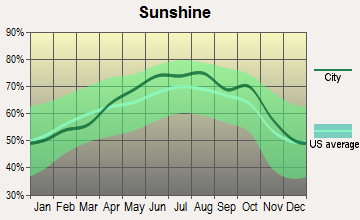
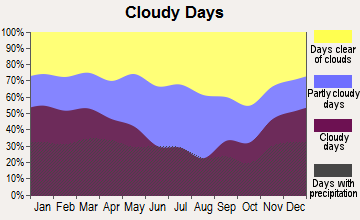
Average climate in Marion, Arkansas
Based on data reported by over 4,000 weather stations
|
|


(lower is better)
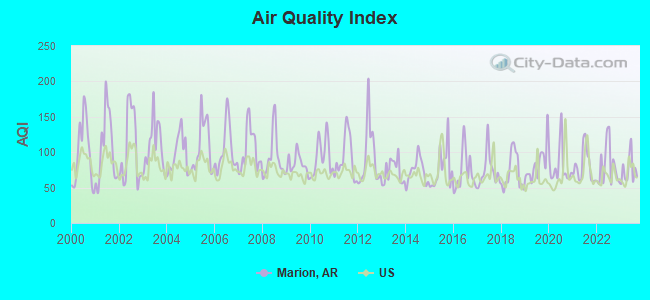
Air Quality Index (AQI) level in 2023 was 74.6. This is about average.
| City: | 74.6 |
| U.S.: | 72.6 |
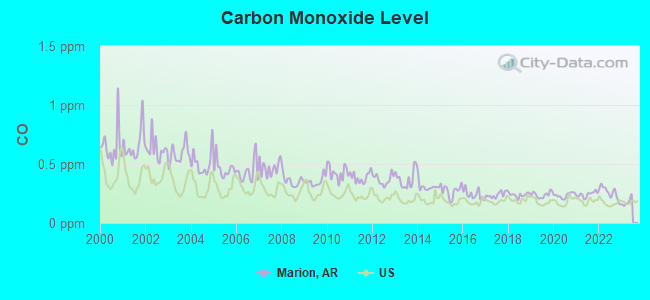
Carbon Monoxide (CO) [ppm] level in 2022 was 0.257. This is about average. Closest monitor was 9.8 miles away from the city center.
| City: | 0.257 |
| U.S.: | 0.251 |
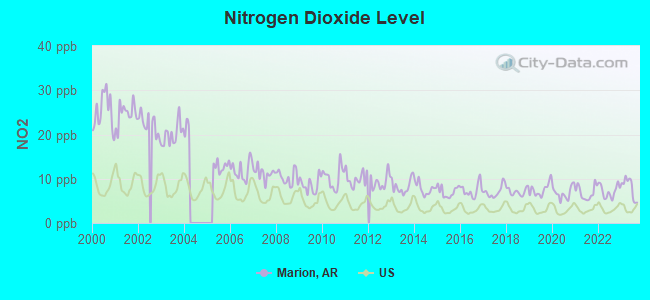
Nitrogen Dioxide (NO2) [ppb] level in 2023 was 7.98. This is significantly worse than average. Closest monitor was 0.8 miles away from the city center.
| City: | 7.98 |
| U.S.: | 5.11 |
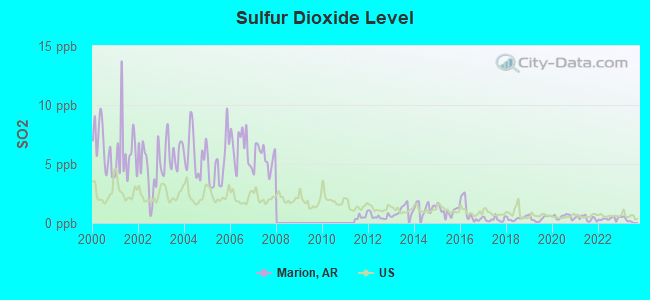
Sulfur Dioxide (SO2) [ppb] level in 2022 was 0.365. This is significantly better than average. Closest monitor was 4.3 miles away from the city center.
| City: | 0.365 |
| U.S.: | 1.515 |
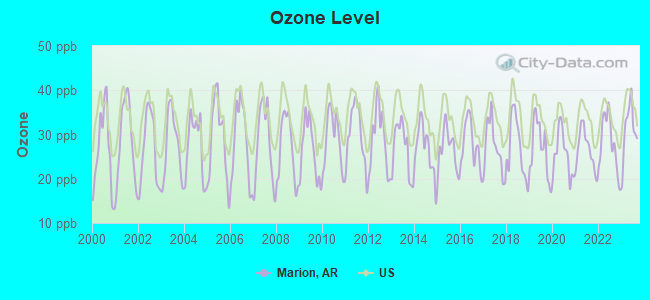
Ozone [ppb] level in 2023 was 31.0. This is about average. Closest monitor was 0.8 miles away from the city center.
| City: | 31.0 |
| U.S.: | 33.3 |

Particulate Matter (PM10) [µg/m3] level in 2022 was 20.2. This is about average. Closest monitor was 4.3 miles away from the city center.
| City: | 20.2 |
| U.S.: | 19.2 |
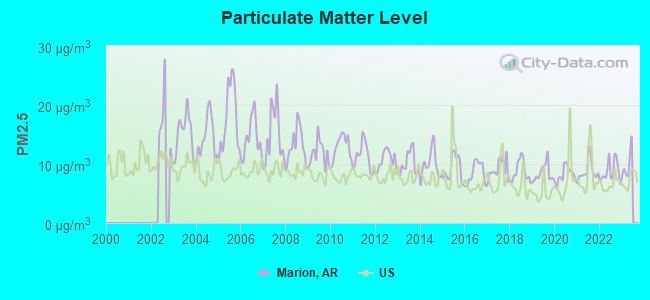
Particulate Matter (PM2.5) [µg/m3] level in 2022 was 8.75. This is about average. Closest monitor was 0.8 miles away from the city center.
| City: | 8.75 |
| U.S.: | 8.11 |
Tornado activity:
Marion-area historical tornado activity is near Arkansas state average. It is 104% greater than the overall U.S. average.
On 4/21/1984, a category F3 (max. wind speeds 158-206 mph) tornado 6.0 miles away from the Marion city center injured 3 people and caused between $500,000 and $5,000,000 in damages.
On 12/14/1987, a category F3 tornado 7.5 miles away from the city center killed 6 people and injured 121 people and caused between $5,000,000 and $50,000,000 in damages.
Earthquake activity:
Marion-area historical earthquake activity is significantly above Arkansas state average. It is 392% greater than the overall U.S. average.On 3/25/1976 at 00:41:20, a magnitude 5.0 (4.9 MB, 5.0 LG, Class: Moderate, Intensity: VI - VII) earthquake occurred 30.6 miles away from the city center
On 5/4/1991 at 01:18:54, a magnitude 5.0 (4.4 MB, 4.6 LG, 5.0 LG, Depth: 3.1 mi) earthquake occurred 96.3 miles away from the city center
On 4/27/1989 at 16:47:49, a magnitude 4.7 (4.6 MB, 4.7 LG, 4.3 LG, Class: Light, Intensity: IV - V) earthquake occurred 60.5 miles away from the city center
On 3/25/1976 at 01:00:11, a magnitude 4.5 (4.1 MB, 4.5 LG) earthquake occurred 32.0 miles away from the city center
On 9/26/1990 at 13:18:51, a magnitude 5.0 (4.7 MB, 4.8 LG, 5.0 LG, Depth: 7.7 mi) earthquake occurred 140.6 miles away from Marion center
On 5/4/2001 at 06:42:12, a magnitude 4.7 (4.2 MB, 4.7 LG, 4.5 LG) earthquake occurred 112.6 miles away from the city center
Magnitude types: regional Lg-wave magnitude (LG), body-wave magnitude (MB)
Natural disasters:
The number of natural disasters in Crittenden County (15) is near the US average (15).Major Disasters (Presidential) Declared: 11
Emergencies Declared: 3
Causes of natural disasters: Storms: 9, Floods: 7, Tornadoes: 5, Winter Storms: 4, Hurricane: 1, Ice Storm: 1, Other: 1 (Note: some incidents may be assigned to more than one category).
Hospitals and medical centers in Marion:
Other hospitals and medical centers near Marion:
- BROADWAY HEALTHCARE CENTER (Nursing Home, about 5 miles away; WEST MEMPHIS, AR)
- CRITTENDEN MEMORIAL HOSPITAL Acute Care Hospitals (about 5 miles away; WEST MEMPHIS, AR)
- HAVEN HOSPICE SERVICES (Hospital, about 5 miles away; WEST MEMPHIS, AR)
- FMCNA - EAST ARKANSAS (Dialysis Facility, about 5 miles away; WEST MEMPHIS, AR)
- GERIATRIC NURSING CENTER (Nursing Home, about 5 miles away; WEST MEMPHIS, AR)
- HEALTH CARE AND REHABILITATION CENTER OF WEST MEMP (Nursing Home, about 5 miles away; WEST MEMPHIS, AR)
- LEISURE LODGE INC (Nursing Home, about 5 miles away; WEST MEMPHIS, AR)
Amtrak station near Marion:
- 10 miles: MEMPHIS (545 S. MAIN ST.) . Services: ticket office, partially wheelchair accessible, enclosed waiting area, public restrooms, public payphones, vending machines, free short-term parking, free long-term parking, call for car rental service, call for taxi service, public transit connection.
Colleges/universities with over 2000 students nearest to Marion:
- Southwest Tennessee Community College (about 11 miles; Memphis, TN; Full-time enrollment: 8,043)
- Rhodes College (about 13 miles; Memphis, TN; FT enrollment: 2,052)
- University of Memphis (about 14 miles; Memphis, TN; FT enrollment: 17,427)
- Northwest Mississippi Community College (about 43 miles; Senatobia, MS; FT enrollment: 6,607)
- Arkansas State University-Main Campus (about 52 miles; Jonesboro, AR; FT enrollment: 12,323)
- Coahoma Community College (about 69 miles; Clarksdale, MS; FT enrollment: 2,284)
- University of Mississippi (about 70 miles; University, MS; FT enrollment: 17,642)
Public high school in Marion:
- BARTON HIGH SCHOOL (Location: 9546 HWY 85 S, Grades: 7-12)
Public elementary/middle school in Marion:
- BARTON ELEMENTARY SCHOOL (Location: 9546 HWY 85 S, Grades: PK-6)
User-submitted facts and corrections:
- http://www.crittendencountyarkansas.org Crittenden County Open Portal Website
- UT Bowld Hospital is closed & has merged with the former Methodist (Central) Hospital to form Methodist University Hospital. The distance from Marion is about 1-2 miles greater than the Bowld Hospital.
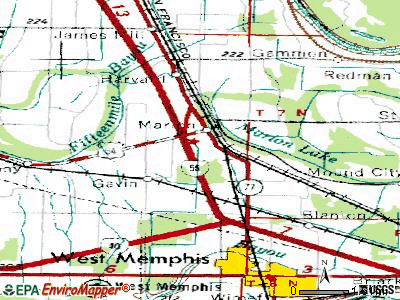
Points of interest:
Notable locations in Marion: Crittenden County Courthouse (A), Marion Police Department (B), Marion Emergency Medical Services (C), Marion Fire Department Station 1 (D), Marion Fire Department Station 2 (E). Display/hide their locations on the map
Churches in Marion include: Jackson Chapel (A), Reynold Grove Church (B). Display/hide their locations on the map
Hotels: Journey Inn (3733 Interstate 55) (1), Best Western Regency Motor Inn (Interstate 55 & Highway) (2), Hallmarc Inn of America (2980 Interstate 55) (3). Display/hide their approximate locations on the map
Courts: Marion-City - Police Court (14 Military Road) (1), Crittenden-County - Circuit Court Judge- Circuit Court Judge Chambers- John Fogl (116 Mound City Road) (2), Crittenden County - Circuit Court Judge Chambers (Court House) (3), West Memphis-City - Municipal Court (100 Court Street) (4). Display/hide their approximate locations on the map
Birthplace of: John Tate (boxer) - Boxer, Ray Brown - 2005 NFL player (Washington Redskins, born: Dec 12, 1962), Jerry Franklin - Football player, Ray Brown (offensive lineman) - Football player.
Drinking water stations with addresses in Marion and their reported violations in the past:
MARION WATERWORKS (Population served: 10,300, Groundwater):Past health violations:LAKESHORE ESTATES WATER ASSN (Population served: 1,004, Purch groundwater):
- MCL, Monthly (TCR) - In AUG-2005, Contaminant: Coliform. Follow-up actions: St Public Notif requested (OCT-14-2005), St Public Notif received (OCT-28-2005), St Compliance achieved (NOV-09-2006)
- MCL, Monthly (TCR) - In JUL-2005, Contaminant: Coliform. Follow-up actions: St Public Notif requested (SEP-06-2005), St Public Notif received (OCT-06-2005), St Compliance achieved (NOV-09-2006)
Past health violations:CLARKEDALE-JERICHO WATER ASSOC (Population served: 955, Purch groundwater):Past monitoring violations:
- MCL, Monthly (TCR) - In JUN-2005, Contaminant: Coliform. Follow-up actions: St Public Notif requested (AUG-10-2005), St Compliance achieved (NOV-16-2006)
- One routine major monitoring violation
- 3 minor monitoring violations
Past health violations:HEAFER-BLACK OAK WATER ASSOC (Population served: 481, Purch groundwater):Past monitoring violations:
- OCCT/SOWT Study/Recommendation - In SEP-10-2010, Contaminant: Lead and Copper Rule. Follow-up actions: St Compliance achieved (2 times from FEB-15-2011 to FEB-16-2011)
- MCL, Monthly (TCR) - In JUN-2005, Contaminant: Coliform. Follow-up actions: St Public Notif requested (AUG-10-2005), St Compliance achieved (SEP-27-2006)
- Follow-up Or Routine LCR Tap M/R - In JUL-01-2010, Contaminant: Lead and Copper Rule. Follow-up actions: St Compliance achieved (2 times from FEB-15-2011 to FEB-15-2011)
- One minor monitoring violation
Past monitoring violations:HWY 64 WATER ASSOCIATION (Population served: 228, Purch groundwater):
- One minor monitoring violation
Past health violations:Past monitoring violations:
- MCL, Monthly (TCR) - In JUN-2005, Contaminant: Coliform. Follow-up actions: St Public Notif requested (AUG-10-2005), St Compliance achieved (SEP-27-2006)
- 2 minor monitoring violations
| This city: | 2.7 people |
| Arkansas: | 2.5 people |
| This city: | 74.5% |
| Whole state: | 67.6% |
| This city: | 5.4% |
| Whole state: | 5.7% |
Likely homosexual households (counted as self-reported same-sex unmarried-partner households)
- Lesbian couples: 0.3% of all households
- Gay men: 0.2% of all households
13 people in emergency and transitional shelters (with sleeping facilities) for people experiencing homelessness in 2010
87 people in nursing homes in 2000
18 people in other noninstitutional group quarters in 2000
Banks with branches in Marion (2011 data):
- Fidelity National Bank: Marion Branch at 330 West Military Road, branch established on 1989/06/08; Midway Branch at 1200 State Highway 77, branch established on 2000/06/16. Info updated 2006/11/03: Bank assets: $332.5 mil, Deposits: $293.6 mil, headquarters in West Memphis, AR, positive income, 5 total offices, Holding Company: Carlson Bancshares, Inc.
- Regions Bank: Marion West Branch at 141 Block Street, branch established on 1990/07/25. Info updated 2011/02/24: Bank assets: $123,368.2 mil, Deposits: $98,301.3 mil, headquarters in Birmingham, AL, positive income, Commercial Lending Specialization, 1778 total offices, Holding Company: Regions Financial Corporation
- SunTrust Bank: Marion Main Office 950 at 115 Block Street, branch established on 1938/03/23. Info updated 2010/05/27: Bank assets: $171,291.7 mil, Deposits: $129,833.2 mil, headquarters in Atlanta, GA, positive income, Commercial Lending Specialization, 1716 total offices, Holding Company: Suntrust Banks, Inc.
- First Community Bank of Eastern Arkansas: First Community Bank Of Eastern Arka at 205 Block Street, branch established on 1998/10/13. Info updated 2006/11/03: Bank assets: $115.5 mil, Deposits: $101.2 mil, local headquarters, positive income, Commercial Lending Specialization, 2 total offices, Holding Company: Fcb Financial Services, Inc
- First National Bank of Eastern Arkansas: Marion Branch at 1381 Highway 64, branch established on 1998/10/28. Info updated 2006/11/03: Bank assets: $355.0 mil, Deposits: $314.3 mil, headquarters in Forrest City, AR, positive income, Agricultural Specialization, 14 total offices, Holding Company: Bancshares Of Eastern Arkansas, Inc.
- Helena National Bank: Marion Branch at 2770 Highway 77, branch established on 2005/12/05. Info updated 2006/11/03: Bank assets: $175.4 mil, Deposits: $149.9 mil, headquarters in Helena, AR, positive income, Agricultural Specialization, 6 total offices, Holding Company: Helena Bancshares, Inc.
For population 15 years and over in Marion:
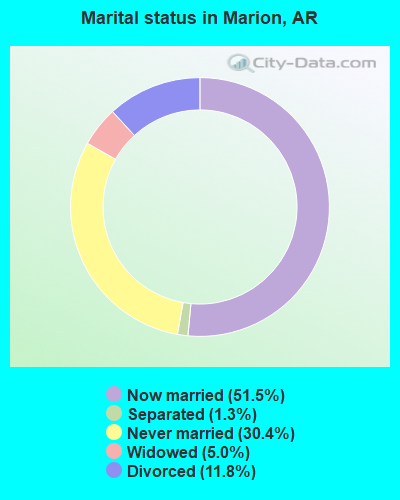
- Never married: 30.4%
- Now married: 51.5%
- Separated: 1.3%
- Widowed: 5.0%
- Divorced: 11.8%
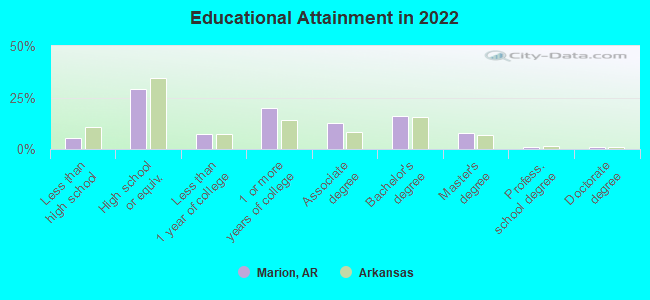
For population 25 years and over in Marion:
- High school or higher: 93.9%
- Bachelor's degree or higher: 25.0%
- Graduate or professional degree: 9.2%
- Unemployed: 2.5%
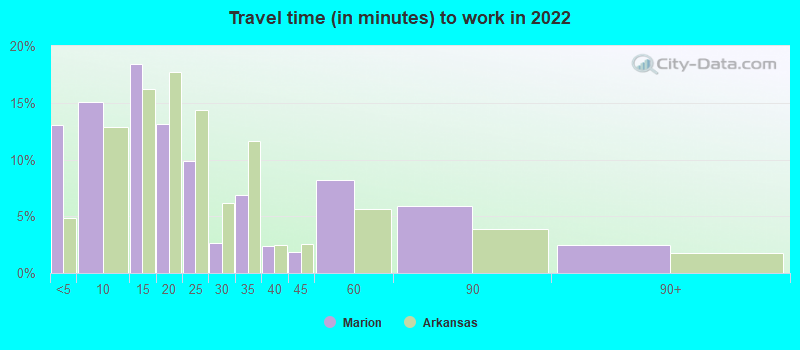
- Mean travel time to work (commute): 19.5 minutes
| Here: | 9.0 |
| Arkansas average: | 11.4 |

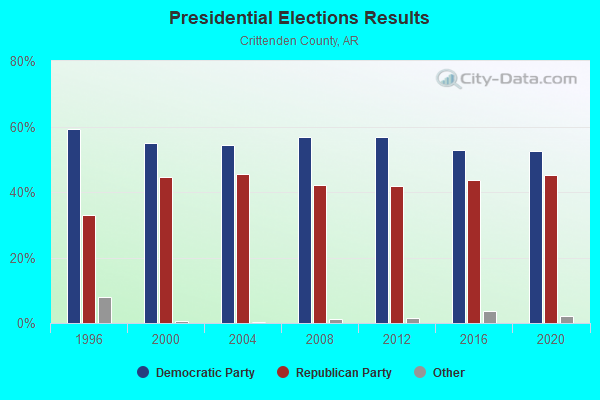
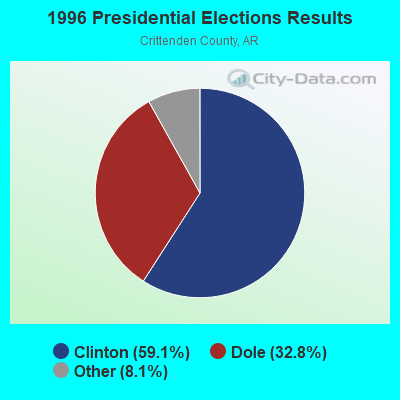
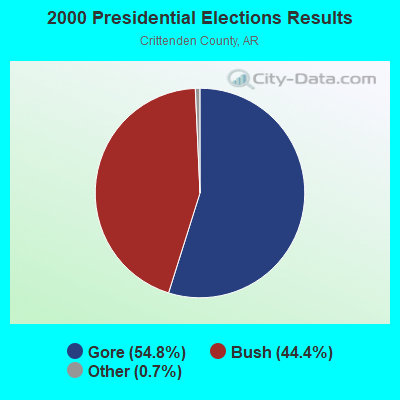
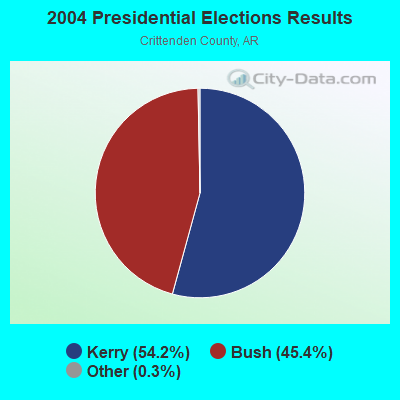
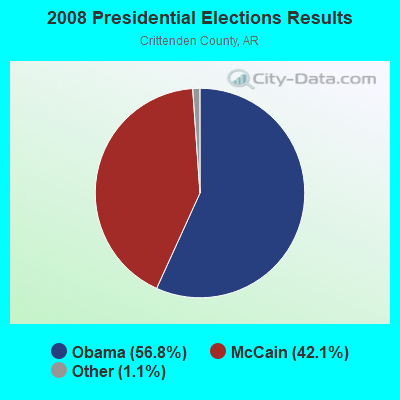


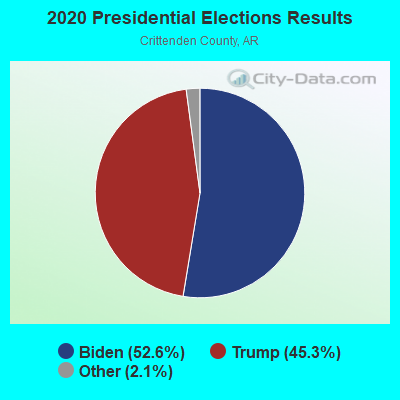
Graphs represent county-level data. Detailed 2008 Election Results
Religion statistics for Marion, AR (based on Crittenden County data)
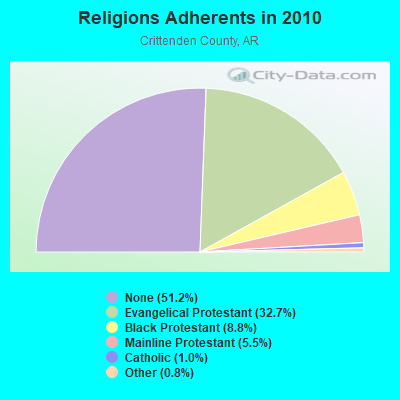
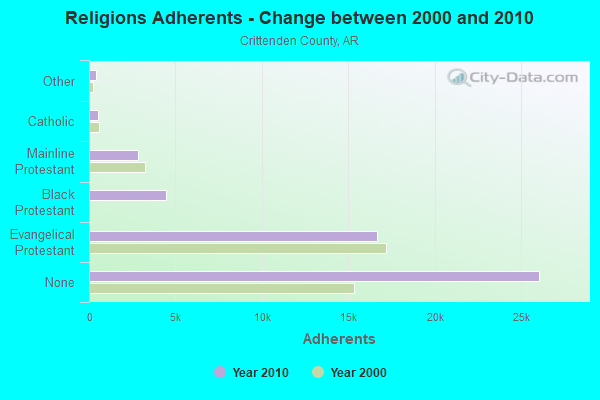
| Religion | Adherents | Congregations |
|---|---|---|
| Evangelical Protestant | 16,649 | 48 |
| Black Protestant | 4,466 | 17 |
| Mainline Protestant | 2,805 | 8 |
| Catholic | 525 | 3 |
| Other | 411 | 3 |
| None | 26,046 | - |
Food Environment Statistics:
| Crittenden County: | 2.69 / 10,000 pop. |
| Arkansas: | 2.02 / 10,000 pop. |
| This county: | 0.19 / 10,000 pop. |
| Arkansas: | 0.25 / 10,000 pop. |
| Crittenden County: | 0.19 / 10,000 pop. |
| Arkansas: | 0.59 / 10,000 pop. |
| Crittenden County: | 4.80 / 10,000 pop. |
| Arkansas: | 4.94 / 10,000 pop. |
| Crittenden County: | 2.88 / 10,000 pop. |
| Arkansas: | 6.66 / 10,000 pop. |
| Crittenden County: | 12.7% |
| Arkansas: | 9.8% |
| This county: | 34.2% |
| State: | 29.1% |
| Crittenden County: | 13.9% |
| State: | 13.6% |
Health and Nutrition:
| Marion: | 46.3% |
| Arkansas: | 48.2% |
| Marion: | 43.0% |
| Arkansas: | 44.2% |
| Here: | 29.1 |
| Arkansas: | 28.9 |
| Here: | 23.4% |
| Arkansas: | 21.6% |
| Here: | 10.2% |
| Arkansas: | 11.3% |
| Marion: | 6.7 |
| Arkansas: | 6.8 |
| Marion: | 33.5% |
| Arkansas: | 34.0% |
| This city: | 55.3% |
| State: | 54.4% |
| This city: | 80.4% |
| Arkansas: | 78.0% |
More about Health and Nutrition of Marion, AR Residents
| Local government employment and payroll (March 2022) | |||||
| Function | Full-time employees | Monthly full-time payroll | Average yearly full-time wage | Part-time employees | Monthly part-time payroll |
|---|---|---|---|---|---|
| Police Protection - Officers | 31 | $116,206 | $44,983 | 2 | $1,794 |
| Streets and Highways | 26 | $69,148 | $31,914 | 3 | $2,243 |
| Other Government Administration | 11 | $42,036 | $45,857 | 0 | $0 |
| Water Supply | 10 | $32,550 | $39,060 | 0 | $0 |
| Sewerage | 8 | $41,899 | $62,849 | 0 | $0 |
| Police - Other | 5 | $5,280 | $12,672 | 0 | $0 |
| Other and Unallocable | 4 | $17,770 | $53,310 | 0 | $0 |
| Judicial and Legal | 3 | $17,630 | $70,520 | 0 | $0 |
| Parks and Recreation | 3 | $28,064 | $112,256 | 0 | $0 |
| Firefighters | 3 | $8,195 | $32,780 | 32 | $4,617 |
| Health | 2 | $9,827 | $58,962 | 2 | $2,042 |
| Financial Administration | 2 | $6,125 | $36,750 | 0 | $0 |
| Totals for Government | 108 | $394,729 | $43,859 | 39 | $10,695 |
Marion government finances - Expenditure in 2021 (per resident):
- Construction - General - Other: $1,412,000 ($103.85)
- Current Operations - Police Protection: $2,232,000 ($164.17)
Regular Highways: $1,372,000 ($100.91)
Financial Administration: $913,000 ($67.15)
Water Utilities: $855,000 ($62.89)
General - Other: $679,000 ($49.94)
Parks and Recreation: $546,000 ($40.16)
Solid Waste Management: $506,000 ($37.22)
Local Fire Protection: $474,000 ($34.86)
Sewerage: $204,000 ($15.00)
Health - Other: $67,000 ($4.93)
- General - Interest on Debt: $6,873,000 ($505.52)
- Other Capital Outlay - General - Other: $626,000 ($46.04)
Water Utilities: $590,000 ($43.40)
Regular Highways: $162,000 ($11.92)
Sewerage: $73,000 ($5.37)
- Total Salaries and Wages: $10,000 ($0.74)
Marion government finances - Revenue in 2021 (per resident):
- Charges - Sewerage: $974,000 ($71.64)
Other: $810,000 ($59.58)
- Federal Intergovernmental - Other: $5,000 ($0.37)
- Local Intergovernmental - General Local Government Support: $999,000 ($73.48)
- Miscellaneous - Interest Earnings: $7,409,000 ($544.94)
General Revenue - Other: $620,000 ($45.60)
Fines and Forfeits: $299,000 ($21.99)
- Revenue - Water Utilities: $1,017,000 ($74.80)
- State Intergovernmental - Highways: $890,000 ($65.46)
Other: $212,000 ($15.59)
- Tax - General Sales and Gross Receipts: $3,200,000 ($235.36)
Property: $1,294,000 ($95.18)
Public Utilities Sales: $582,000 ($42.81)
Other Selective Sales: $294,000 ($21.62)
Other License: $134,000 ($9.86)
Marion government finances - Debt in 2021 (per resident):
- Long Term Debt - Beginning Outstanding - Public Debt for Private Purpose: $158,020,000 ($11622.54)
Outstanding Nonguaranteed - Industrial Revenue: $148,795,000 ($10944.03)
Beginning Outstanding - Unspecified Public Purpose: $19,254,000 ($1416.15)
Outstanding Unspecified Public Purpose: $17,652,000 ($1298.32)
Retired Nonguaranteed - Public Debt for Private Purpose: $9,225,000 ($678.51)
Retired Unspecified Public Purpose: $1,602,000 ($117.83)
Marion government finances - Cash and Securities in 2021 (per resident):
- Bond Funds - Cash and Securities: $17,432,000 ($1282.14)
- Other Funds - Cash and Securities: $11,392,000 ($837.89)
- Sinking Funds - Cash and Securities: $194,115,000 ($14277.36)
| Businesses in Marion, AR | ||||
| Name | Count | Name | Count | |
|---|---|---|---|---|
| AutoZone | 1 | Lane Furniture | 1 | |
| Baskin-Robbins | 1 | McDonald's | 1 | |
| Best Western | 1 | Quiznos | 1 | |
| Burger King | 1 | SONIC Drive-In | 1 | |
| Chevrolet | 1 | Subway | 2 | |
| Comfort Inn | 1 | Taco Bell | 1 | |
| FedEx | 1 | U-Haul | 1 | |
| H&R Block | 1 | UPS | 1 | |
| KFC | 1 | Wendy's | 1 | |
Strongest AM radio stations in Marion:
- WDIA (1070 AM; 50 kW; MEMPHIS, TN; Owner: CLEAR CHANNEL BROADCASTING LICENSES, INC.)
- WGSF (1030 AM; 50 kW; MEMPHIS, TN; Owner: FLINN BROADCASTING CORPORATION)
- WJCE (680 AM; 10 kW; MEMPHIS, TN; Owner: ENTERCOM MEMPHIS LICENSE, LLC)
- WCRV (640 AM; 50 kW; COLLIERVILLE, TN; Owner: BOTT BROADCASTING COMPANY/TENNESSEE)
- WHBQ (560 AM; 5 kW; MEMPHIS, TN; Owner: FLINN BROADCASTING CORPORATION)
- KWAM (990 AM; 10 kW; MEMPHIS, TN; Owner: CONCORD MEDIA GROUP, INC.)
- WREC (600 AM; 5 kW; MEMPHIS, TN; Owner: CLEAR CHANNEL BROADCASTING LICENSES, INC.)
- WMQM (1600 AM; 50 kW; LAKELAND, TN; Owner: WMQM, INC.)
- KSUD (730 AM; 1 kW; WEST MEMPHIS, AR; Owner: EDUCATIONAL MEDIA FOUNDATION)
- WBBP (1480 AM; 5 kW; MEMPHIS, TN)
- WMC (790 AM; 5 kW; MEMPHIS, TN; Owner: INFINITY RADIO OPERATIONS INC.)
- WPLX (1170 AM; 10 kW; GERMANTOWN, TN; Owner: EDUCATIONAL MEDIA FOUNDATION)
- WLRM (1380 AM; 2 kW; MILLINGTON, TN; Owner: WORLD OVERCOMERS OUTREACH MINISTRIES)
Strongest FM radio stations in Marion:
- KXHT (107.1 FM; MARION, AR; Owner: FLINN BROADCASTING CORPORATION)
- KJMS (101.1 FM; MEMPHIS, TN; Owner: CLEAR CHANNEL BROADCASTING LICENSES, INC.)
- WHRK (97.1 FM; MEMPHIS, TN; Owner: CLEAR CHANNEL BROADCASTING LICENSES, INC.)
- WYPL (89.3 FM; MEMPHIS, TN; Owner: MEMPHIS/SHELBY COUNTY PUBLIC LIBRARY & INFO CNTR.)
- WSRR-FM (98.1 FM; MILLINGTON, TN; Owner: KOOL BROADCASTING, INC.)
- WMC-FM (99.7 FM; MEMPHIS, TN; Owner: INFINITY RADIO OPERATIONS INC.)
- WGKX (105.9 FM; MEMPHIS, TN; Owner: KIX BROADCASTING, INC.)
- WRVR-FM (104.5 FM; MEMPHIS, TN; Owner: ENTERCOM MEMPHIS LICENSE, LLC)
- KKLV (94.7 FM; TURRELL, AR; Owner: EDUCATIONAL MEDIA FOUNDATION)
- WEGR (102.7 FM; MEMPHIS, TN; Owner: CLEAR CHANNEL BROADCASTING LICENSES, INC.)
- WHAL-FM (95.7 FM; OLIVE BRANCH, MS; Owner: CLEAR CHANNEL BROADCASTING LICENSES, INC.)
- WKNO-FM (91.1 FM; MEMPHIS, TN; Owner: MID-SOUTH PUBLIC COMMUNICATIONS FOUNDATION)
- WUMR (91.7 FM; MEMPHIS, TN; Owner: THE UNIVERSITY OF MEMPHIS)
- WQOX (88.5 FM; MEMPHIS, TN; Owner: MEMPHIS CITY SCHOOLS)
- WMBZ (94.1 FM; GERMANTOWN, TN; Owner: ENTERCOM MEMPHIS LICENSE, LLC)
- WMFS (92.9 FM; BARTLETT, TN; Owner: INFINITY BROADCASTING CORP. OF ILLINOIS)
- WEVL (89.9 FM; MEMPHIS, TN; Owner: SOUTHERN COMMUNICATION VOLUNTEERS, INC.)
- KTRQ (102.3 FM; COLT, AR; Owner: EAST ARKANSAS BROADCASTERS, INC.)
- WMPS (107.5 FM; GERMANTOWN, TN; Owner: FLINN BROADCASTING CORPORATION)
- K213CN (90.5 FM; WEST MEMPHIS, AR; Owner: COMMUNITY BROADCASTING, INC.)
TV broadcast stations around Marion:
- W67CV (Channel 67; MEMPHIS, TN; Owner: GEORGE S. FLINN, JR.)
- WBXP-CA (Channel 44; MEMPHIS, TN; Owner: THE BOX WORLDWIDE LLC)
- WREG-TV (Channel 3; MEMPHIS, TN; Owner: NEW YORK TIMES MANAGEMENT SERVICES)
- W42BY (Channel 42; MEMPHIS, TN; Owner: THREE ANGELS BROADCASTING NETWORK, INC,)
- WMC-TV (Channel 5; MEMPHIS, TN; Owner: RAYCOM AMERICA, INC.)
- WHBQ-TV (Channel 13; MEMPHIS, TN; Owner: FOX TELEVISION STATIONS, INC.)
- WPXX-TV (Channel 50; MEMPHIS, TN; Owner: FLINN BROADCASTING CORPORATION)
- WJRJ-LP (Channel 59; MEMPHIS, TN; Owner: WORD OF GOD FELLOWSHIP, INC.)
- WKNO (Channel 10; MEMPHIS, TN; Owner: MID-SOUTH PUBLIC COMMUNICATIONS FOUNDATION)
- WLMT (Channel 30; MEMPHIS, TN; Owner: CLEAR CHANNEL BROADCASTING LICENSES, INC.)
- WPTY-TV (Channel 24; MEMPHIS, TN; Owner: CLEAR CHANNEL BROADCASTING LICENSES, INC.)
- W57CG (Channel 57; MEMPHIS, TN; Owner: GEORGE S. FLINN, JR.)
- KVTJ (Channel 48; JONESBORO, AR; Owner: AGAPE CHURCH, INC.)
- W61BP (Channel 61; MEMPHIS, TN; Owner: JIMMY BOYD)
- WBUY (Channel 40; HOLLY SPRINGS, MS; Owner: TRINITY BROADCASTING NETWORK)
- National Bridge Inventory (NBI) Statistics
- 36Number of bridges
- 423ft / 129mTotal length
- $4,654,000Total costs
- 364,062Total average daily traffic
- 85,977Total average daily truck traffic
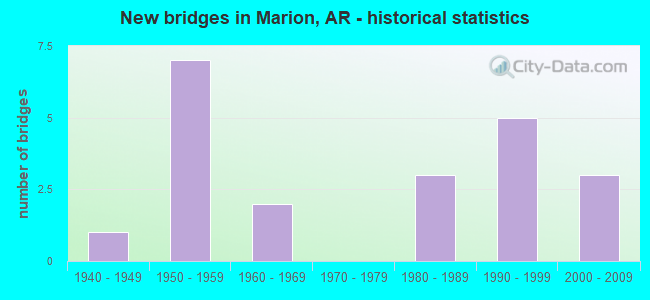
- New bridges - historical statistics
- 11940-1949
- 71950-1959
- 21960-1969
- 31980-1989
- 51990-1999
- 32000-2009
FCC Registered Antenna Towers:
47 (See the full list of FCC Registered Antenna Towers in Marion)FCC Registered Broadcast Land Mobile Towers:
11 (See the full list of FCC Registered Broadcast Land Mobile Towers in Marion, AR)FCC Registered Microwave Towers:
1- MARION, 215 Military Rd (Lat: 35.212306 Lon: -90.204528), Type: Ltower, Structure height: 32 m, Call Sign: WNEK207,
Assigned Frequencies: 6130.51 MHz, 6152.75 MHz, 6152.75 MHz, 6152.75 MHz, 6152.75 MHz, 6785.00 MHz, 6785.00 MHz, 6785.00 MHz, 6785.00 MHz, 6004.50 MHz... (+3 more), Grant Date: 02/04/2021, Expiration Date: 10/16/2030, Certifier: Steve Paquette, Registrant: Entergy Services, LLC, 425 West Capitol Ave., Little Rock, AR 72203-0551, Phone: (501) 377-5609, Email:
FCC Registered Amateur Radio Licenses:
78 (See the full list of FCC Registered Amateur Radio Licenses in Marion)FAA Registered Aircraft:
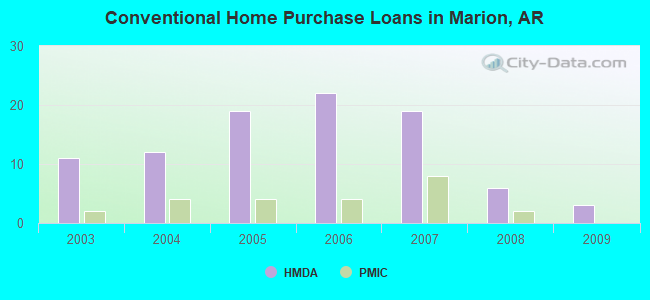
11 (See the full list of FAA Registered Aircraft in Marion)| Home Mortgage Disclosure Act Aggregated Statistics For Year 2009 (Based on 3 partial tracts) | ||||||||||||
| A) FHA, FSA/RHS & VA Home Purchase Loans | B) Conventional Home Purchase Loans | C) Refinancings | D) Home Improvement Loans | F) Non-occupant Loans on < 5 Family Dwellings (A B C & D) | G) Loans On Manufactured Home Dwelling (A B C & D) | |||||||
|---|---|---|---|---|---|---|---|---|---|---|---|---|
| Number | Average Value | Number | Average Value | Number | Average Value | Number | Average Value | Number | Average Value | Number | Average Value | |
| LOANS ORIGINATED | 10 | $131,252 | 3 | $140,220 | 11 | $132,405 | 1 | $15,290 | 1 | $102,000 | 0 | $0 |
| APPLICATIONS APPROVED, NOT ACCEPTED | 0 | $0 | 0 | $0 | 1 | $103,300 | 0 | $0 | 0 | $0 | 0 | $0 |
| APPLICATIONS DENIED | 1 | $81,710 | 1 | $77,960 | 5 | $125,848 | 1 | $21,510 | 0 | $0 | 1 | $29,500 |
| APPLICATIONS WITHDRAWN | 0 | $0 | 0 | $0 | 4 | $152,908 | 0 | $0 | 0 | $0 | 0 | $0 |
| FILES CLOSED FOR INCOMPLETENESS | 0 | $0 | 0 | $0 | 1 | $86,040 | 0 | $0 | 0 | $0 | 0 | $0 |
Detailed HMDA statistics for the following Tracts: 0308.01 , 0308.02
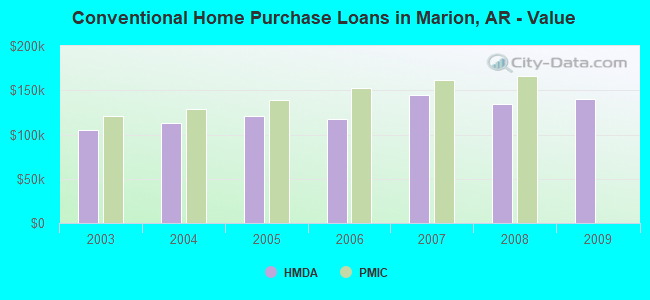
| Private Mortgage Insurance Companies Aggregated Statistics For Year 2008 (Based on 3 partial tracts) | ||
| A) Conventional Home Purchase Loans | ||
|---|---|---|
| Number | Average Value | |
| LOANS ORIGINATED | 2 | $166,205 |
| APPLICATIONS APPROVED, NOT ACCEPTED | 0 | $0 |
| APPLICATIONS DENIED | 0 | $0 |
| APPLICATIONS WITHDRAWN | 0 | $0 |
| FILES CLOSED FOR INCOMPLETENESS | 0 | $0 |
Detailed PMIC statistics for the following Tracts: 0308.01 , 0308.02
2003 - 2018 National Fire Incident Reporting System (NFIRS) incidents
- Fire incident types reported to NFIRS in Marion, AR
- 51543.0%Outside Fires
- 43536.3%Structure Fires
- 19416.2%Mobile Property/Vehicle Fires
- 534.4%Other
 Based on the data from the years 2003 - 2018 the average number of fire incidents per year is 75. The highest number of fire incidents - 125 took place in 2016, and the least - 2 in 2009. The data has a growing trend.
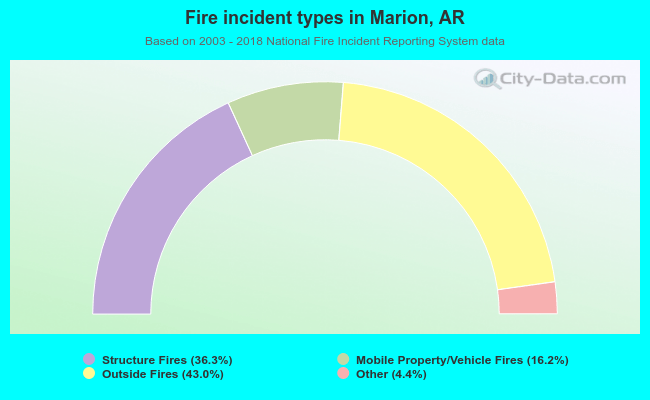 When looking into fire subcategories, the most reports belonged to: Outside Fires (43.0%), and Structure Fires (36.3%).
Fire-safe hotels and motels in Marion, Arkansas:
- Best Western Regency, I-55 & US 64, Marion, Arkansas 72364 , Phone: (870) 739-3278
- Comfort Inn, 2700 Interstate 55 Service Rd, Marion, Arkansas 72364 , Phone: (870) 739-2323, Fax: (870) 739-2324
- Hampton Inn, 310 Angelo's Grove Rd, Marion Arkansas, Marion, Arkansas 72364 , Phone: (870) 739-2800, Fax: (870) 739-2801
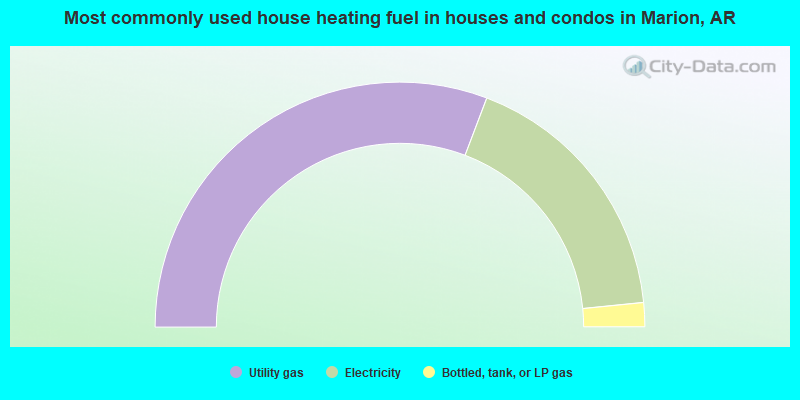
- 61.6%Utility gas
- 35.3%Electricity
- 3.2%Bottled, tank, or LP gas
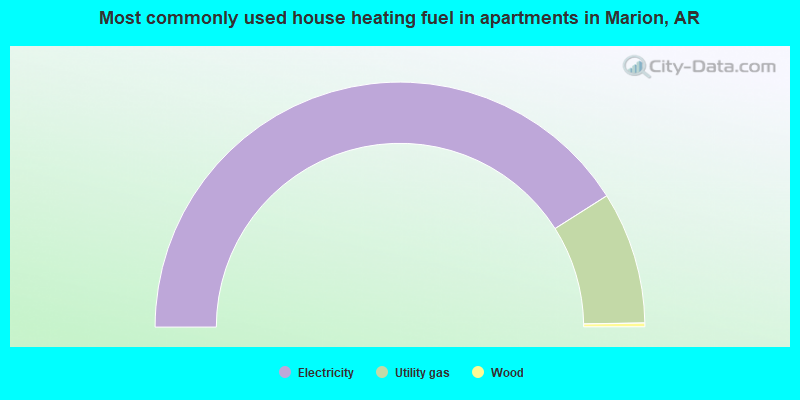
- 82.0%Electricity
- 17.5%Utility gas
- 0.5%Wood
Marion compared to Arkansas state average:
- Unemployed percentage significantly below state average.
- Black race population percentage significantly above state average.
- Median age below state average.
- Length of stay since moving in significantly above state average.
- House age below state average.
Marion on our top lists:
- #41 on the list of "Top 101 cities with the lowest percentage of workers working at home, population 5,000+"
- #22 on the list of "Top 101 counties with the smallest number of people without health insurance coverage in 2000 (pop. 50,000+)"
- #53 on the list of "Top 101 counties with the largest number of people moving out compared to moving in (pop. 50,000+)"
- #81 on the list of "Top 101 counties with the highest Nitrogen Dioxide air pollution readings in 2012 (ppm)"

|
|
Total of 24 patent applications in 2008-2024.