Mamaroneck, New York Submit your own pictures of this village and show them to the world
OSM Map
General Map
Google Map
MSN Map
OSM Map
General Map
Google Map
MSN Map
OSM Map
General Map
Google Map
MSN Map
OSM Map
General Map
Google Map
MSN Map
Please wait while loading the map...
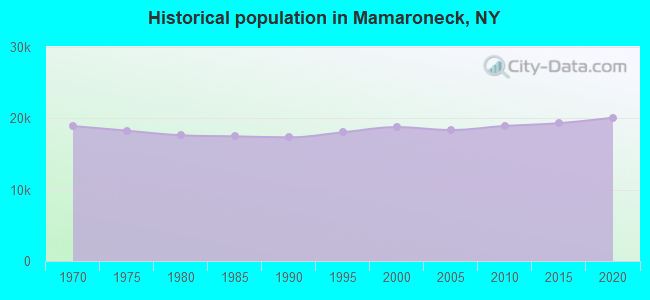
Population in 2022: 19,669 (100% urban, 0% rural). Population change since 2000: +4.9%Males: 10,159 Females: 9,510
March 2022 cost of living index in Mamaroneck: 153.9 (very high, U.S. average is 100) Percentage of residents living in poverty in 2022: 6.5%for White Non-Hispanic residents , 26.5% for Black residents , 7.5% for Hispanic or Latino residents , 11.6% for other race residents , 3.9% for two or more races residents )
Profiles of local businesses
Business Search - 14 Million verified businesses
Data:
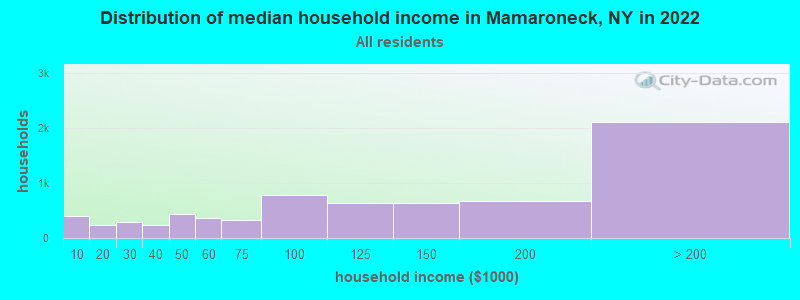
Median household income ($)
Median household income (% change since 2000)
Household income diversity
Ratio of average income to average house value (%)
Ratio of average income to average rent
Median household income ($) - White
Median household income ($) - Black or African American
Median household income ($) - Asian
Median household income ($) - Hispanic or Latino
Median household income ($) - American Indian and Alaska Native
Median household income ($) - Multirace
Median household income ($) - Other Race
Median household income for houses/condos with a mortgage ($)
Median household income for apartments without a mortgage ($)
Races - White alone (%)
Races - White alone (% change since 2000)
Races - Black alone (%)
Races - Black alone (% change since 2000)
Races - American Indian alone (%)
Races - American Indian alone (% change since 2000)
Races - Asian alone (%)
Races - Asian alone (% change since 2000)
Races - Hispanic (%)
Races - Hispanic (% change since 2000)
Races - Native Hawaiian and Other Pacific Islander alone (%)
Races - Native Hawaiian and Other Pacific Islander alone (% change since 2000)
Races - Two or more races (%)
Races - Two or more races (% change since 2000)
Races - Other race alone (%)
Races - Other race alone (% change since 2000)
Racial diversity
Unemployment (%)
Unemployment (% change since 2000)
Unemployment (%) - White
Unemployment (%) - Black or African American
Unemployment (%) - Asian
Unemployment (%) - Hispanic or Latino
Unemployment (%) - American Indian and Alaska Native
Unemployment (%) - Multirace
Unemployment (%) - Other Race
Population density (people per square mile)
Population - Males (%)
Population - Females (%)
Population - Males (%) - White
Population - Males (%) - Black or African American
Population - Males (%) - Asian
Population - Males (%) - Hispanic or Latino
Population - Males (%) - American Indian and Alaska Native
Population - Males (%) - Multirace
Population - Males (%) - Other Race
Population - Females (%) - White
Population - Females (%) - Black or African American
Population - Females (%) - Asian
Population - Females (%) - Hispanic or Latino
Population - Females (%) - American Indian and Alaska Native
Population - Females (%) - Multirace
Population - Females (%) - Other Race
Coronavirus confirmed cases (Jun 05, 2024)
Deaths caused by coronavirus (Jun 05, 2024)
Coronavirus confirmed cases (per 100k population) (Jun 05, 2024)
Deaths caused by coronavirus (per 100k population) (Jun 05, 2024)
Daily increase in number of cases (Jun 05, 2024)
Weekly increase in number of cases (Jun 05, 2024)
Cases doubled (in days) (Jun 05, 2024)
Hospitalized patients (Apr 18, 2022)
Negative test results (Apr 18, 2022)
Total test results (Apr 18, 2022)
COVID Vaccine doses distributed (per 100k population) (Sep 19, 2023)
COVID Vaccine doses administered (per 100k population) (Sep 19, 2023)
COVID Vaccine doses distributed (Sep 19, 2023)
COVID Vaccine doses administered (Sep 19, 2023)
Likely homosexual households (%)
Likely homosexual households (% change since 2000)
Likely homosexual households - Lesbian couples (%)
Likely homosexual households - Lesbian couples (% change since 2000)
Likely homosexual households - Gay men (%)
Likely homosexual households - Gay men (% change since 2000)
Cost of living index
Median gross rent ($)
Median contract rent ($)
Median monthly housing costs ($)
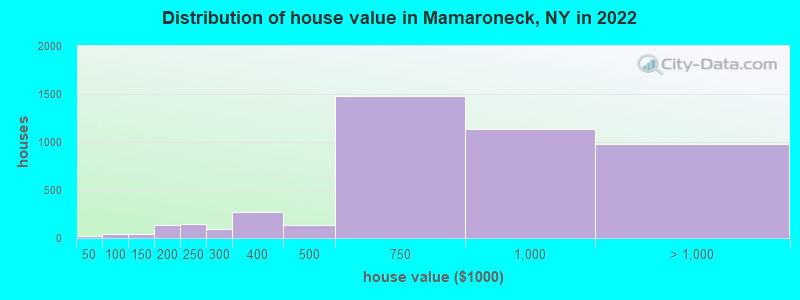
Median house or condo value ($)
Median house or condo value ($ change since 2000)
Mean house or condo value by units in structure - 1, detached ($)
Mean house or condo value by units in structure - 1, attached ($)
Mean house or condo value by units in structure - 2 ($)
Mean house or condo value by units in structure by units in structure - 3 or 4 ($)
Mean house or condo value by units in structure - 5 or more ($)
Mean house or condo value by units in structure - Boat, RV, van, etc. ($)
Mean house or condo value by units in structure - Mobile home ($)
Median house or condo value ($) - White
Median house or condo value ($) - Black or African American
Median house or condo value ($) - Asian
Median house or condo value ($) - Hispanic or Latino
Median house or condo value ($) - American Indian and Alaska Native
Median house or condo value ($) - Multirace
Median house or condo value ($) - Other Race
Median resident age
Resident age diversity
Median resident age - Males
Median resident age - Females
Median resident age - White
Median resident age - Black or African American
Median resident age - Asian
Median resident age - Hispanic or Latino
Median resident age - American Indian and Alaska Native
Median resident age - Multirace
Median resident age - Other Race
Median resident age - Males - White
Median resident age - Males - Black or African American
Median resident age - Males - Asian
Median resident age - Males - Hispanic or Latino
Median resident age - Males - American Indian and Alaska Native
Median resident age - Males - Multirace
Median resident age - Males - Other Race
Median resident age - Females - White
Median resident age - Females - Black or African American
Median resident age - Females - Asian
Median resident age - Females - Hispanic or Latino
Median resident age - Females - American Indian and Alaska Native
Median resident age - Females - Multirace
Median resident age - Females - Other Race
Commute - mean travel time to work (minutes)
Travel time to work - Less than 5 minutes (%)
Travel time to work - Less than 5 minutes (% change since 2000)
Travel time to work - 5 to 9 minutes (%)
Travel time to work - 5 to 9 minutes (% change since 2000)
Travel time to work - 10 to 19 minutes (%)
Travel time to work - 10 to 19 minutes (% change since 2000)
Travel time to work - 20 to 29 minutes (%)
Travel time to work - 20 to 29 minutes (% change since 2000)
Travel time to work - 30 to 39 minutes (%)
Travel time to work - 30 to 39 minutes (% change since 2000)
Travel time to work - 40 to 59 minutes (%)
Travel time to work - 40 to 59 minutes (% change since 2000)
Travel time to work - 60 to 89 minutes (%)
Travel time to work - 60 to 89 minutes (% change since 2000)
Travel time to work - 90 or more minutes (%)
Travel time to work - 90 or more minutes (% change since 2000)
Marital status - Never married (%)
Marital status - Now married (%)
Marital status - Separated (%)
Marital status - Widowed (%)
Marital status - Divorced (%)
Median family income ($)
Median family income (% change since 2000)
Median non-family income ($)
Median non-family income (% change since 2000)
Median per capita income ($)
Median per capita income (% change since 2000)
Median family income ($) - White
Median family income ($) - Black or African American
Median family income ($) - Asian
Median family income ($) - Hispanic or Latino
Median family income ($) - American Indian and Alaska Native
Median family income ($) - Multirace
Median family income ($) - Other Race
Median year house/condo built
Median year apartment built
Year house built - Built 2005 or later (%)
Year house built - Built 2000 to 2004 (%)
Year house built - Built 1990 to 1999 (%)
Year house built - Built 1980 to 1989 (%)
Year house built - Built 1970 to 1979 (%)
Year house built - Built 1960 to 1969 (%)
Year house built - Built 1950 to 1959 (%)
Year house built - Built 1940 to 1949 (%)
Year house built - Built 1939 or earlier (%)
Average household size
Household density (households per square mile)
Average household size - White
Average household size - Black or African American
Average household size - Asian
Average household size - Hispanic or Latino
Average household size - American Indian and Alaska Native
Average household size - Multirace
Average household size - Other Race
Occupied housing units (%)
Vacant housing units (%)
Owner occupied housing units (%)
Renter occupied housing units (%)
Vacancy status - For rent (%)
Vacancy status - For sale only (%)
Vacancy status - Rented or sold, not occupied (%)
Vacancy status - For seasonal, recreational, or occasional use (%)
Vacancy status - For migrant workers (%)
Vacancy status - Other vacant (%)
Residents with income below the poverty level (%)
Residents with income below 50% of the poverty level (%)
Children below poverty level (%)
Poor families by family type - Married-couple family (%)
Poor families by family type - Male, no wife present (%)
Poor families by family type - Female, no husband present (%)
Poverty status for native-born residents (%)
Poverty status for foreign-born residents (%)
Poverty among high school graduates not in families (%)
Poverty among people who did not graduate high school not in families (%)
Residents with income below the poverty level (%) - White
Residents with income below the poverty level (%) - Black or African American
Residents with income below the poverty level (%) - Asian
Residents with income below the poverty level (%) - Hispanic or Latino
Residents with income below the poverty level (%) - American Indian and Alaska Native
Residents with income below the poverty level (%) - Multirace
Residents with income below the poverty level (%) - Other Race
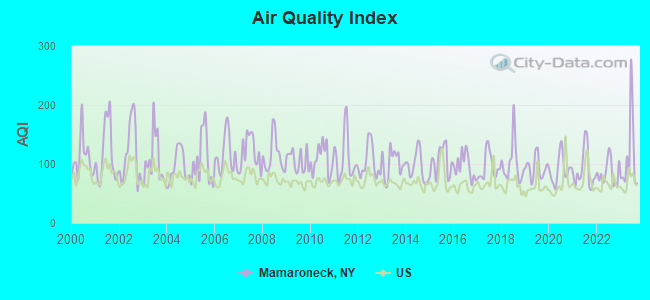
Air pollution - Air Quality Index (AQI)
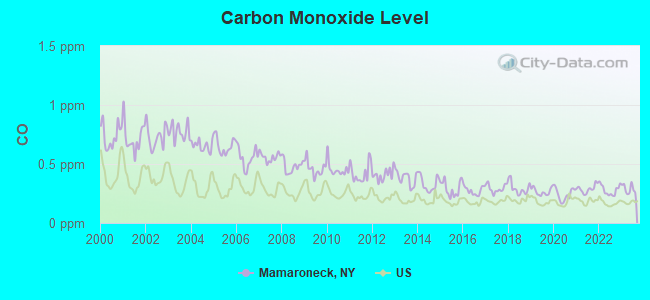
Air pollution - CO
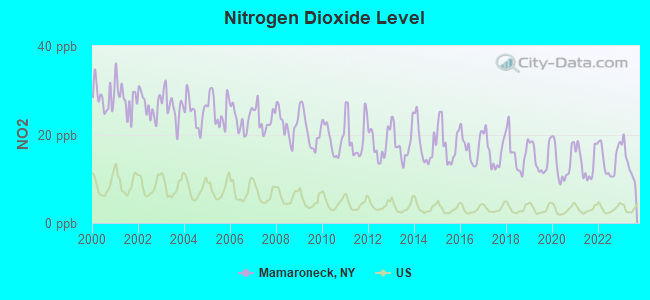
Air pollution - NO2
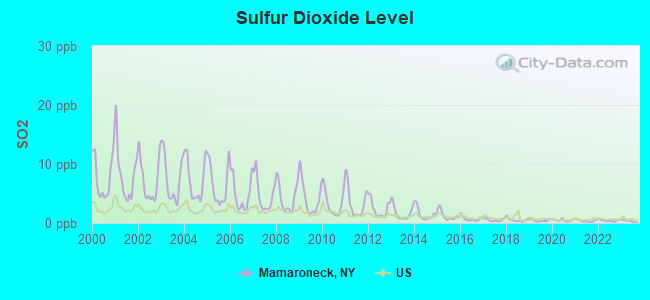
Air pollution - SO2
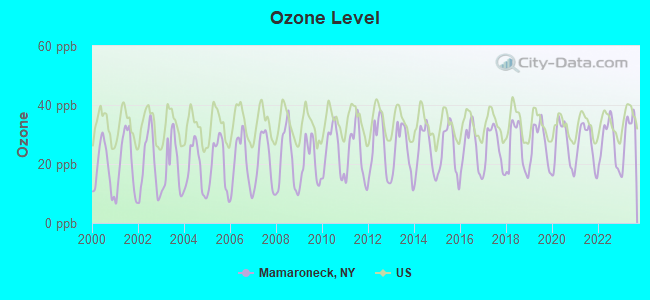
Air pollution - Ozone
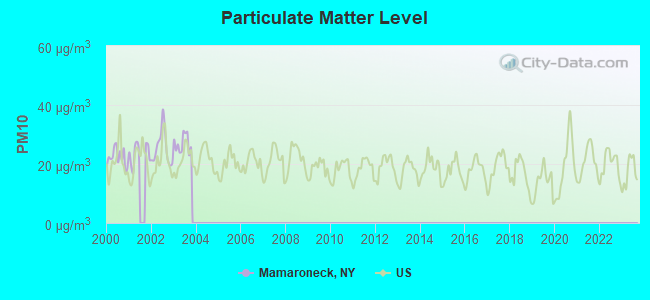
Air pollution - PM10
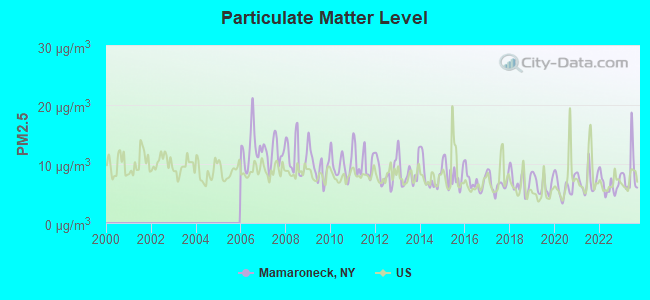
Air pollution - PM25
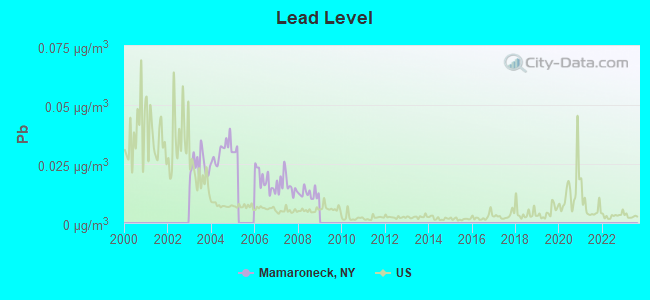
Air pollution - Pb
Crime - Murders per 100,000 population
Crime - Rapes per 100,000 population
Crime - Robberies per 100,000 population
Crime - Assaults per 100,000 population
Crime - Burglaries per 100,000 population
Crime - Thefts per 100,000 population
Crime - Auto thefts per 100,000 population
Crime - Arson per 100,000 population
Crime - City-data.com crime index
Crime - Violent crime index
Crime - Property crime index
Crime - Murders per 100,000 population (5 year average)
Crime - Rapes per 100,000 population (5 year average)
Crime - Robberies per 100,000 population (5 year average)
Crime - Assaults per 100,000 population (5 year average)
Crime - Burglaries per 100,000 population (5 year average)
Crime - Thefts per 100,000 population (5 year average)
Crime - Auto thefts per 100,000 population (5 year average)
Crime - Arson per 100,000 population (5 year average)
Crime - City-data.com crime index (5 year average)
Crime - Violent crime index (5 year average)
Crime - Property crime index (5 year average)
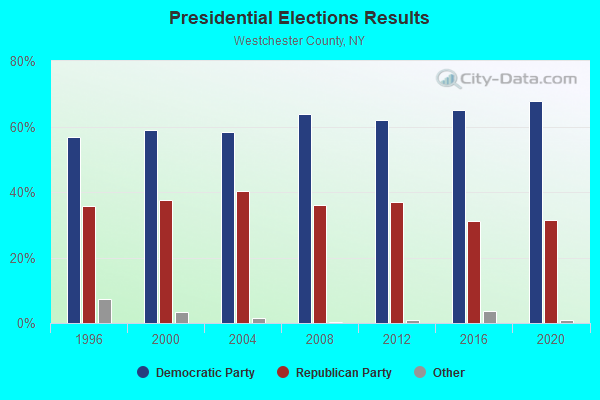
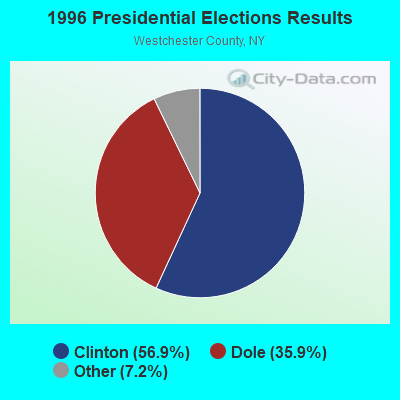
1996 Presidential Elections Results (%) - Democratic Party (Clinton)
1996 Presidential Elections Results (%) - Republican Party (Dole)
1996 Presidential Elections Results (%) - Other
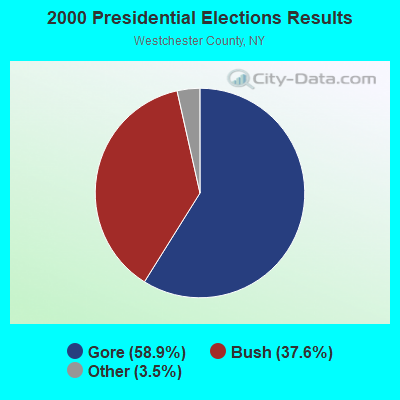
2000 Presidential Elections Results (%) - Democratic Party (Gore)
2000 Presidential Elections Results (%) - Republican Party (Bush)
2000 Presidential Elections Results (%) - Other
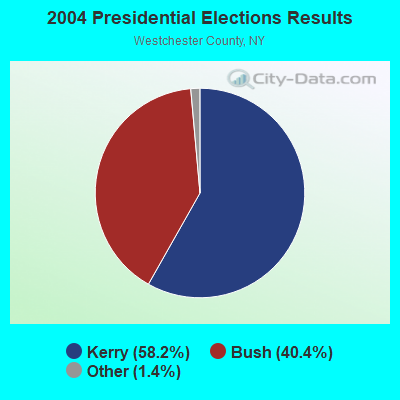
2004 Presidential Elections Results (%) - Democratic Party (Kerry)
2004 Presidential Elections Results (%) - Republican Party (Bush)
2004 Presidential Elections Results (%) - Other
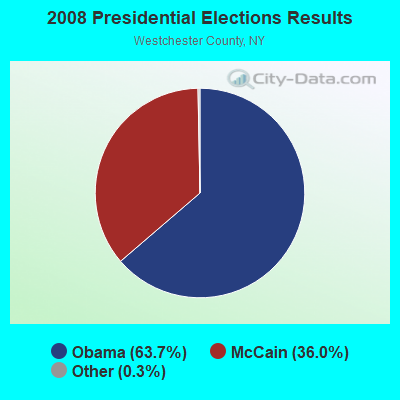
2008 Presidential Elections Results (%) - Democratic Party (Obama)
2008 Presidential Elections Results (%) - Republican Party (McCain)
2008 Presidential Elections Results (%) - Other
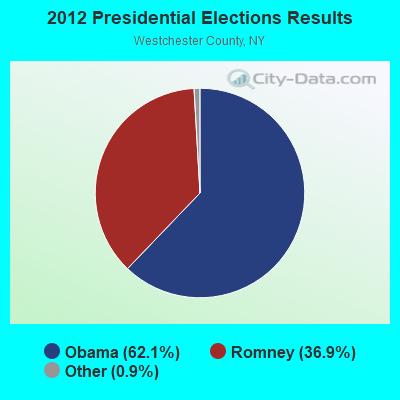
2012 Presidential Elections Results (%) - Democratic Party (Obama)
2012 Presidential Elections Results (%) - Republican Party (Romney)
2012 Presidential Elections Results (%) - Other
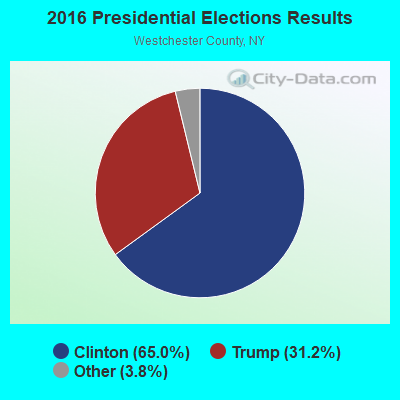
2016 Presidential Elections Results (%) - Democratic Party (Clinton)
2016 Presidential Elections Results (%) - Republican Party (Trump)
2016 Presidential Elections Results (%) - Other
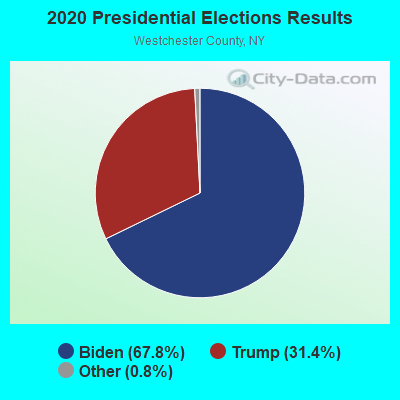
2020 Presidential Elections Results (%) - Democratic Party (Biden)
2020 Presidential Elections Results (%) - Republican Party (Trump)
2020 Presidential Elections Results (%) - Other
Ancestries Reported - Arab (%)
Ancestries Reported - Czech (%)
Ancestries Reported - Danish (%)
Ancestries Reported - Dutch (%)
Ancestries Reported - English (%)
Ancestries Reported - French (%)
Ancestries Reported - French Canadian (%)
Ancestries Reported - German (%)
Ancestries Reported - Greek (%)
Ancestries Reported - Hungarian (%)
Ancestries Reported - Irish (%)
Ancestries Reported - Italian (%)
Ancestries Reported - Lithuanian (%)
Ancestries Reported - Norwegian (%)
Ancestries Reported - Polish (%)
Ancestries Reported - Portuguese (%)
Ancestries Reported - Russian (%)
Ancestries Reported - Scotch-Irish (%)
Ancestries Reported - Scottish (%)
Ancestries Reported - Slovak (%)
Ancestries Reported - Subsaharan African (%)
Ancestries Reported - Swedish (%)
Ancestries Reported - Swiss (%)
Ancestries Reported - Ukrainian (%)
Ancestries Reported - United States (%)
Ancestries Reported - Welsh (%)
Ancestries Reported - West Indian (%)
Ancestries Reported - Other (%)
Educational Attainment - No schooling completed (%)
Educational Attainment - Less than high school (%)
Educational Attainment - High school or equivalent (%)
Educational Attainment - Less than 1 year of college (%)
Educational Attainment - 1 or more years of college (%)
Educational Attainment - Associate degree (%)
Educational Attainment - Bachelor's degree (%)
Educational Attainment - Master's degree (%)
Educational Attainment - Professional school degree (%)
Educational Attainment - Doctorate degree (%)
School Enrollment - Nursery, preschool (%)
School Enrollment - Kindergarten (%)
School Enrollment - Grade 1 to 4 (%)
School Enrollment - Grade 5 to 8 (%)
School Enrollment - Grade 9 to 12 (%)
School Enrollment - College undergrad (%)
School Enrollment - Graduate or professional (%)
School Enrollment - Not enrolled in school (%)
School enrollment - Public schools (%)
School enrollment - Private schools (%)
School enrollment - Not enrolled (%)
Median number of rooms in houses and condos
Median number of rooms in apartments
Housing units lacking complete plumbing facilities (%)
Housing units lacking complete kitchen facilities (%)
Density of houses
Urban houses (%)
Rural houses (%)
Households with people 60 years and over (%)
Households with people 65 years and over (%)
Households with people 75 years and over (%)
Households with one or more nonrelatives (%)
Households with no nonrelatives (%)
Population in households (%)
Family households (%)
Nonfamily households (%)
Population in families (%)
Family households with own children (%)
Median number of bedrooms in owner occupied houses
Mean number of bedrooms in owner occupied houses
Median number of bedrooms in renter occupied houses
Mean number of bedrooms in renter occupied houses
Median number of vehichles in owner occupied houses
Mean number of vehichles in owner occupied houses
Median number of vehichles in renter occupied houses
Mean number of vehichles in renter occupied houses
Mortgage status - with mortgage (%)
Mortgage status - with second mortgage (%)
Mortgage status - with home equity loan (%)
Mortgage status - with both second mortgage and home equity loan (%)
Mortgage status - without a mortgage (%)
Average family size
Average family size - White
Average family size - Black or African American
Average family size - Asian
Average family size - Hispanic or Latino
Average family size - American Indian and Alaska Native
Average family size - Multirace
Average family size - Other Race
Geographical mobility - Same house 1 year ago (%)
Geographical mobility - Moved within same county (%)
Geographical mobility - Moved from different county within same state (%)
Geographical mobility - Moved from different state (%)
Geographical mobility - Moved from abroad (%)
Place of birth - Born in state of residence (%)
Place of birth - Born in other state (%)
Place of birth - Native, outside of US (%)
Place of birth - Foreign born (%)
Housing units in structures - 1, detached (%)
Housing units in structures - 1, attached (%)
Housing units in structures - 2 (%)
Housing units in structures - 3 or 4 (%)
Housing units in structures - 5 to 9 (%)
Housing units in structures - 10 to 19 (%)
Housing units in structures - 20 to 49 (%)
Housing units in structures - 50 or more (%)
Housing units in structures - Mobile home (%)
Housing units in structures - Boat, RV, van, etc. (%)
House/condo owner moved in on average (years ago)
Renter moved in on average (years ago)
Year householder moved into unit - Moved in 1999 to March 2000 (%)
Year householder moved into unit - Moved in 1995 to 1998 (%)
Year householder moved into unit - Moved in 1990 to 1994 (%)
Year householder moved into unit - Moved in 1980 to 1989 (%)
Year householder moved into unit - Moved in 1970 to 1979 (%)
Year householder moved into unit - Moved in 1969 or earlier (%)
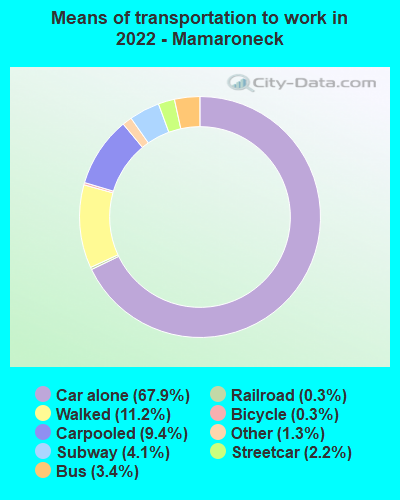
Means of transportation to work - Drove car alone (%)
Means of transportation to work - Carpooled (%)
Means of transportation to work - Public transportation (%)
Means of transportation to work - Bus or trolley bus (%)
Means of transportation to work - Streetcar or trolley car (%)
Means of transportation to work - Subway or elevated (%)
Means of transportation to work - Railroad (%)
Means of transportation to work - Ferryboat (%)
Means of transportation to work - Taxicab (%)
Means of transportation to work - Motorcycle (%)
Means of transportation to work - Bicycle (%)
Means of transportation to work - Walked (%)
Means of transportation to work - Other means (%)
Working at home (%)
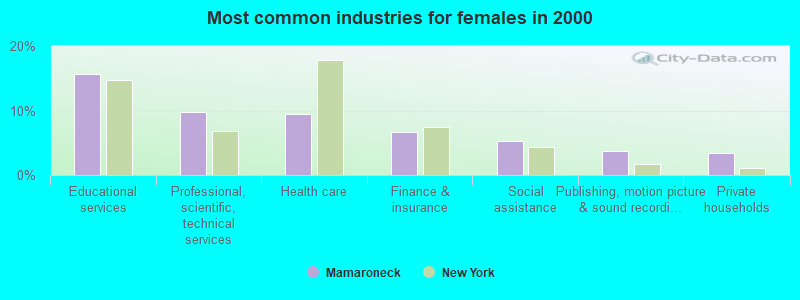
Industry diversity
Most Common Industries - Agriculture, forestry, fishing and hunting, and mining (%)
Most Common Industries - Agriculture, forestry, fishing and hunting (%)
Most Common Industries - Mining, quarrying, and oil and gas extraction (%)
Most Common Industries - Construction (%)
Most Common Industries - Manufacturing (%)
Most Common Industries - Wholesale trade (%)
Most Common Industries - Retail trade (%)
Most Common Industries - Transportation and warehousing, and utilities (%)
Most Common Industries - Transportation and warehousing (%)
Most Common Industries - Utilities (%)
Most Common Industries - Information (%)
Most Common Industries - Finance and insurance, and real estate and rental and leasing (%)
Most Common Industries - Finance and insurance (%)
Most Common Industries - Real estate and rental and leasing (%)
Most Common Industries - Professional, scientific, and management, and administrative and waste management services (%)
Most Common Industries - Professional, scientific, and technical services (%)
Most Common Industries - Management of companies and enterprises (%)
Most Common Industries - Administrative and support and waste management services (%)
Most Common Industries - Educational services, and health care and social assistance (%)
Most Common Industries - Educational services (%)
Most Common Industries - Health care and social assistance (%)
Most Common Industries - Arts, entertainment, and recreation, and accommodation and food services (%)
Most Common Industries - Arts, entertainment, and recreation (%)
Most Common Industries - Accommodation and food services (%)
Most Common Industries - Other services, except public administration (%)
Most Common Industries - Public administration (%)
Occupation diversity
Most Common Occupations - Management, business, science, and arts occupations (%)
Most Common Occupations - Management, business, and financial occupations (%)
Most Common Occupations - Management occupations (%)
Most Common Occupations - Business and financial operations occupations (%)
Most Common Occupations - Computer, engineering, and science occupations (%)
Most Common Occupations - Computer and mathematical occupations (%)
Most Common Occupations - Architecture and engineering occupations (%)
Most Common Occupations - Life, physical, and social science occupations (%)
Most Common Occupations - Education, legal, community service, arts, and media occupations (%)
Most Common Occupations - Community and social service occupations (%)
Most Common Occupations - Legal occupations (%)
Most Common Occupations - Education, training, and library occupations (%)
Most Common Occupations - Arts, design, entertainment, sports, and media occupations (%)
Most Common Occupations - Healthcare practitioners and technical occupations (%)
Most Common Occupations - Health diagnosing and treating practitioners and other technical occupations (%)
Most Common Occupations - Health technologists and technicians (%)
Most Common Occupations - Service occupations (%)
Most Common Occupations - Healthcare support occupations (%)
Most Common Occupations - Protective service occupations (%)
Most Common Occupations - Fire fighting and prevention, and other protective service workers including supervisors (%)
Most Common Occupations - Law enforcement workers including supervisors (%)
Most Common Occupations - Food preparation and serving related occupations (%)
Most Common Occupations - Building and grounds cleaning and maintenance occupations (%)
Most Common Occupations - Personal care and service occupations (%)
Most Common Occupations - Sales and office occupations (%)
Most Common Occupations - Sales and related occupations (%)
Most Common Occupations - Office and administrative support occupations (%)
Most Common Occupations - Natural resources, construction, and maintenance occupations (%)
Most Common Occupations - Farming, fishing, and forestry occupations (%)
Most Common Occupations - Construction and extraction occupations (%)
Most Common Occupations - Installation, maintenance, and repair occupations (%)
Most Common Occupations - Production, transportation, and material moving occupations (%)
Most Common Occupations - Production occupations (%)
Most Common Occupations - Transportation occupations (%)
Most Common Occupations - Material moving occupations (%)
People in Group quarters - Institutionalized population (%)
People in Group quarters - Correctional institutions (%)
People in Group quarters - Federal prisons and detention centers (%)
People in Group quarters - Halfway houses (%)
People in Group quarters - Local jails and other confinement facilities (including police lockups) (%)
People in Group quarters - Military disciplinary barracks (%)
People in Group quarters - State prisons (%)
People in Group quarters - Other types of correctional institutions (%)
People in Group quarters - Nursing homes (%)
People in Group quarters - Hospitals/wards, hospices, and schools for the handicapped (%)
People in Group quarters - Hospitals/wards and hospices for chronically ill (%)
People in Group quarters - Hospices or homes for chronically ill (%)
People in Group quarters - Military hospitals or wards for chronically ill (%)
People in Group quarters - Other hospitals or wards for chronically ill (%)
People in Group quarters - Hospitals or wards for drug/alcohol abuse (%)
People in Group quarters - Mental (Psychiatric) hospitals or wards (%)
People in Group quarters - Schools, hospitals, or wards for the mentally retarded (%)
People in Group quarters - Schools, hospitals, or wards for the physically handicapped (%)
People in Group quarters - Institutions for the deaf (%)
People in Group quarters - Institutions for the blind (%)
People in Group quarters - Orthopedic wards and institutions for the physically handicapped (%)
People in Group quarters - Wards in general hospitals for patients who have no usual home elsewhere (%)
People in Group quarters - Wards in military hospitals for patients who have no usual home elsewhere (%)
People in Group quarters - Juvenile institutions (%)
People in Group quarters - Long-term care (%)
People in Group quarters - Homes for abused, dependent, and neglected children (%)
People in Group quarters - Residential treatment centers for emotionally disturbed children (%)
People in Group quarters - Training schools for juvenile delinquents (%)
People in Group quarters - Short-term care, detention or diagnostic centers for delinquent children (%)
People in Group quarters - Type of juvenile institution unknown (%)
People in Group quarters - Noninstitutionalized population (%)
People in Group quarters - College dormitories (includes college quarters off campus) (%)
People in Group quarters - Military quarters (%)
People in Group quarters - On base (%)
People in Group quarters - Barracks, unaccompanied personnel housing (UPH), (Enlisted/Officer), ;and similar group living quarters for military personnel (%)
People in Group quarters - Transient quarters for temporary residents (%)
People in Group quarters - Military ships (%)
People in Group quarters - Group homes (%)
People in Group quarters - Homes or halfway houses for drug/alcohol abuse (%)
People in Group quarters - Homes for the mentally ill (%)
People in Group quarters - Homes for the mentally retarded (%)
People in Group quarters - Homes for the physically handicapped (%)
People in Group quarters - Other group homes (%)
People in Group quarters - Religious group quarters (%)
People in Group quarters - Dormitories (%)
People in Group quarters - Agriculture workers' dormitories on farms (%)
People in Group quarters - Job Corps and vocational training facilities (%)
People in Group quarters - Other workers' dormitories (%)
People in Group quarters - Crews of maritime vessels (%)
People in Group quarters - Other nonhousehold living situations (%)
People in Group quarters - Other noninstitutional group quarters (%)
Residents speaking English at home (%)
Residents speaking English at home - Born in the United States (%)
Residents speaking English at home - Native, born elsewhere (%)
Residents speaking English at home - Foreign born (%)
Residents speaking Spanish at home (%)
Residents speaking Spanish at home - Born in the United States (%)
Residents speaking Spanish at home - Native, born elsewhere (%)
Residents speaking Spanish at home - Foreign born (%)
Residents speaking other language at home (%)
Residents speaking other language at home - Born in the United States (%)
Residents speaking other language at home - Native, born elsewhere (%)
Residents speaking other language at home - Foreign born (%)
Class of Workers - Employee of private company (%)
Class of Workers - Self-employed in own incorporated business (%)
Class of Workers - Private not-for-profit wage and salary workers (%)
Class of Workers - Local government workers (%)
Class of Workers - State government workers (%)
Class of Workers - Federal government workers (%)
Class of Workers - Self-employed workers in own not incorporated business and Unpaid family workers (%)
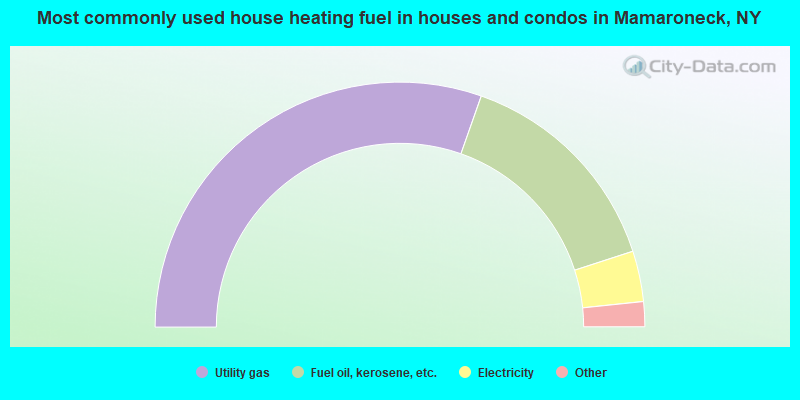
House heating fuel used in houses and condos - Utility gas (%)
House heating fuel used in houses and condos - Bottled, tank, or LP gas (%)
House heating fuel used in houses and condos - Electricity (%)
House heating fuel used in houses and condos - Fuel oil, kerosene, etc. (%)
House heating fuel used in houses and condos - Coal or coke (%)
House heating fuel used in houses and condos - Wood (%)
House heating fuel used in houses and condos - Solar energy (%)
House heating fuel used in houses and condos - Other fuel (%)
House heating fuel used in houses and condos - No fuel used (%)
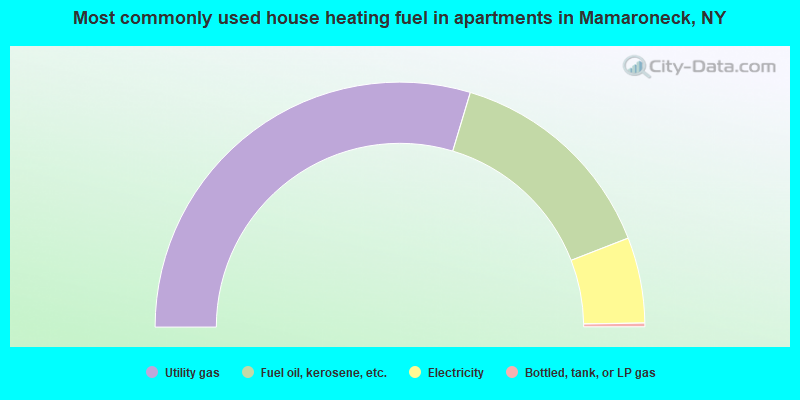
House heating fuel used in apartments - Utility gas (%)
House heating fuel used in apartments - Bottled, tank, or LP gas (%)
House heating fuel used in apartments - Electricity (%)
House heating fuel used in apartments - Fuel oil, kerosene, etc. (%)
House heating fuel used in apartments - Coal or coke (%)
House heating fuel used in apartments - Wood (%)
House heating fuel used in apartments - Solar energy (%)
House heating fuel used in apartments - Other fuel (%)
House heating fuel used in apartments - No fuel used (%)
Armed forces status - In Armed Forces (%)
Armed forces status - Civilian (%)
Armed forces status - Civilian - Veteran (%)
Armed forces status - Civilian - Nonveteran (%)
Fatal accidents locations in years 2005-2021
Fatal accidents locations in 2005
Fatal accidents locations in 2006
Fatal accidents locations in 2007
Fatal accidents locations in 2008
Fatal accidents locations in 2009
Fatal accidents locations in 2010
Fatal accidents locations in 2011
Fatal accidents locations in 2012
Fatal accidents locations in 2013
Fatal accidents locations in 2014
Fatal accidents locations in 2015
Fatal accidents locations in 2016
Fatal accidents locations in 2017
Fatal accidents locations in 2018
Fatal accidents locations in 2019
Fatal accidents locations in 2020
Fatal accidents locations in 2021
Alcohol use - People drinking some alcohol every month (%)
Alcohol use - People not drinking at all (%)
Alcohol use - Average days/month drinking alcohol
Alcohol use - Average drinks/week
Alcohol use - Average days/year people drink much
Audiometry - Average condition of hearing (%)
Audiometry - People that can hear a whisper from across a quiet room (%)
Audiometry - People that can hear normal voice from across a quiet room (%)
Audiometry - Ears ringing, roaring, buzzing (%)
Audiometry - Had a job exposure to loud noise (%)
Audiometry - Had off-work exposure to loud noise (%)
Blood Pressure & Cholesterol - Has high blood pressure (%)
Blood Pressure & Cholesterol - Checking blood pressure at home (%)
Blood Pressure & Cholesterol - Frequently checking blood cholesterol (%)
Blood Pressure & Cholesterol - Has high cholesterol level (%)
Consumer Behavior - Money monthly spent on food at supermarket/grocery store
Consumer Behavior - Money monthly spent on food at other stores
Consumer Behavior - Money monthly spent on eating out
Consumer Behavior - Money monthly spent on carryout/delivered foods
Consumer Behavior - Income spent on food at supermarket/grocery store (%)
Consumer Behavior - Income spent on food at other stores (%)
Consumer Behavior - Income spent on eating out (%)
Consumer Behavior - Income spent on carryout/delivered foods (%)
Current Health Status - General health condition (%)
Current Health Status - Blood donors (%)
Current Health Status - Has blood ever tested for HIV virus (%)
Current Health Status - Left-handed people (%)
Dermatology - People using sunscreen (%)
Diabetes - Diabetics (%)
Diabetes - Had a blood test for high blood sugar (%)
Diabetes - People taking insulin (%)
Diet Behavior & Nutrition - Diet health (%)
Diet Behavior & Nutrition - Milk product consumption (# of products/month)
Diet Behavior & Nutrition - Meals not home prepared (#/week)
Diet Behavior & Nutrition - Meals from fast food or pizza place (#/week)
Diet Behavior & Nutrition - Ready-to-eat foods (#/month)
Diet Behavior & Nutrition - Frozen meals/pizza (#/month)
Drug Use - People that ever used marijuana or hashish (%)
Drug Use - Ever used hard drugs (%)
Drug Use - Ever used any form of cocaine (%)
Drug Use - Ever used heroin (%)
Drug Use - Ever used methamphetamine (%)
Health Insurance - People covered by health insurance (%)
Kidney Conditions-Urology - Avg. # of times urinating at night
Medical Conditions - People with asthma (%)
Medical Conditions - People with anemia (%)
Medical Conditions - People with psoriasis (%)
Medical Conditions - People with overweight (%)
Medical Conditions - Elderly people having difficulties in thinking or remembering (%)
Medical Conditions - People who ever received blood transfusion (%)
Medical Conditions - People having trouble seeing even with glass/contacts (%)
Medical Conditions - People with arthritis (%)
Medical Conditions - People with gout (%)
Medical Conditions - People with congestive heart failure (%)
Medical Conditions - People with coronary heart disease (%)
Medical Conditions - People with angina pectoris (%)
Medical Conditions - People who ever had heart attack (%)
Medical Conditions - People who ever had stroke (%)
Medical Conditions - People with emphysema (%)
Medical Conditions - People with thyroid problem (%)
Medical Conditions - People with chronic bronchitis (%)
Medical Conditions - People with any liver condition (%)
Medical Conditions - People who ever had cancer or malignancy (%)
Mental Health - People who have little interest in doing things (%)
Mental Health - People feeling down, depressed, or hopeless (%)
Mental Health - People who have trouble sleeping or sleeping too much (%)
Mental Health - People feeling tired or having little energy (%)
Mental Health - People with poor appetite or overeating (%)
Mental Health - People feeling bad about themself (%)
Mental Health - People who have trouble concentrating on things (%)
Mental Health - People moving or speaking slowly or too fast (%)
Mental Health - People having thoughts they would be better off dead (%)
Oral Health - Average years since last visit a dentist
Oral Health - People embarrassed because of mouth (%)
Oral Health - People with gum disease (%)
Oral Health - General health of teeth and gums (%)
Oral Health - Average days a week using dental floss/device
Oral Health - Average days a week using mouthwash for dental problem
Oral Health - Average number of teeth
Pesticide Use - Households using pesticides to control insects (%)
Pesticide Use - Households using pesticides to kill weeds (%)
Physical Activity - People doing vigorous-intensity work activities (%)
Physical Activity - People doing moderate-intensity work activities (%)
Physical Activity - People walking or bicycling (%)
Physical Activity - People doing vigorous-intensity recreational activities (%)
Physical Activity - People doing moderate-intensity recreational activities (%)
Physical Activity - Average hours a day doing sedentary activities
Physical Activity - Average hours a day watching TV or videos
Physical Activity - Average hours a day using computer
Physical Functioning - People having limitations keeping them from working (%)
Physical Functioning - People limited in amount of work they can do (%)
Physical Functioning - People that need special equipment to walk (%)
Physical Functioning - People experiencing confusion/memory problems (%)
Physical Functioning - People requiring special healthcare equipment (%)
Prescription Medications - Average number of prescription medicines taking
Preventive Aspirin Use - Adults 40+ taking low-dose aspirin (%)
Reproductive Health - Vaginal deliveries (%)
Reproductive Health - Cesarean deliveries (%)
Reproductive Health - Deliveries resulted in a live birth (%)
Reproductive Health - Pregnancies resulted in a delivery (%)
Reproductive Health - Women breastfeeding newborns (%)
Reproductive Health - Women that had a hysterectomy (%)
Reproductive Health - Women that had both ovaries removed (%)
Reproductive Health - Women that have ever taken birth control pills (%)
Reproductive Health - Women taking birth control pills (%)
Reproductive Health - Women that have ever used Depo-Provera or injectables (%)
Reproductive Health - Women that have ever used female hormones (%)
Sexual Behavior - People 18+ that ever had sex (vaginal, anal, or oral) (%)
Sexual Behavior - Males 18+ that ever had vaginal sex with a woman (%)
Sexual Behavior - Males 18+ that ever performed oral sex on a woman (%)
Sexual Behavior - Males 18+ that ever had anal sex with a woman (%)
Sexual Behavior - Males 18+ that ever had any sex with a man (%)
Sexual Behavior - Females 18+ that ever had vaginal sex with a man (%)
Sexual Behavior - Females 18+ that ever performed oral sex on a man (%)
Sexual Behavior - Females 18+ that ever had anal sex with a man (%)
Sexual Behavior - Females 18+ that ever had any kind of sex with a woman (%)
Sexual Behavior - Average age people first had sex
Sexual Behavior - Average number of female sex partners in lifetime (males 18+)
Sexual Behavior - Average number of female vaginal sex partners in lifetime (males 18+)
Sexual Behavior - Average age people first performed oral sex on a woman (18+)
Sexual Behavior - Average number of woman performed oral sex on in lifetime (18+)
Sexual Behavior - Average number of male sex partners in lifetime (males 18+)
Sexual Behavior - Average number of male anal sex partners in lifetime (males 18+)
Sexual Behavior - Average age people first performed oral sex on a man (18+)
Sexual Behavior - Average number of male oral sex partners in lifetime (18+)
Sexual Behavior - People using protection when performing oral sex (%)
Sexual Behavior - Average number of times people have vaginal or anal sex a year
Sexual Behavior - People having sex without condom (%)
Sexual Behavior - Average number of male sex partners in lifetime (females 18+)
Sexual Behavior - Average number of male vaginal sex partners in lifetime (females 18+)
Sexual Behavior - Average number of female sex partners in lifetime (females 18+)
Sexual Behavior - Circumcised males 18+ (%)
Sleep Disorders - Average hours sleeping at night
Sleep Disorders - People that has trouble sleeping (%)
Smoking-Cigarette Use - People smoking cigarettes (%)
Taste & Smell - People 40+ having problems with smell (%)
Taste & Smell - People 40+ having problems with taste (%)
Taste & Smell - People 40+ that ever had wisdom teeth removed (%)
Taste & Smell - People 40+ that ever had tonsils teeth removed (%)
Taste & Smell - People 40+ that ever had a loss of consciousness because of a head injury (%)
Taste & Smell - People 40+ that ever had a broken nose or other serious injury to face or skull (%)
Taste & Smell - People 40+ that ever had two or more sinus infections (%)
Weight - Average height (inches)
Weight - Average weight (pounds)
Weight - Average BMI
Weight - People that are obese (%)
Weight - People that ever were obese (%)
Weight - People trying to lose weight (%)
According to our research of New York and other state lists, there were 2 registered sex offenders living in Mamaroneck, New York as of June 04, 2024 . The ratio of all residents to sex offenders in Mamaroneck is 9,684 to 1.The ratio of registered sex offenders to all residents in this city is much lower than the state average.
Officers per 1,000 residents here:
3.13New York average:
3.28
Latest news from Mamaroneck, NY collected exclusively by city-data.com from local newspapers, TV, and radio stations
Ancestries: Italian (17.5%), Irish (5.5%), American (5.4%), Portuguese (5.2%), French (2.9%), Brazilian (2.8%).
Current Local Time:
Land area: 3.23 square miles.
Population density: 6,083 people per square mile (high).
6,036 residents are foreign born (13.9% Latin America , 11.1% Europe , 4.2% Asia ).
This village:
30.5%New York:
22.6%
Median real estate property taxes paid for housing units with mortgages in 2022: $10,001 (1.3%)Median real estate property taxes paid for housing units with no mortgage in 2022: $10,001 (1.5%)
Nearest city with pop. 50,000+: New Rochelle, NY
Nearest city with pop. 200,000+: Bronx, NY
Nearest cities:
Latitude: 40.95 N, Longitude: 73.73 W
Daytime population change due to commuting: -814 (-4.1%)Workers who live and work in this village: 3,413 (33.3%)
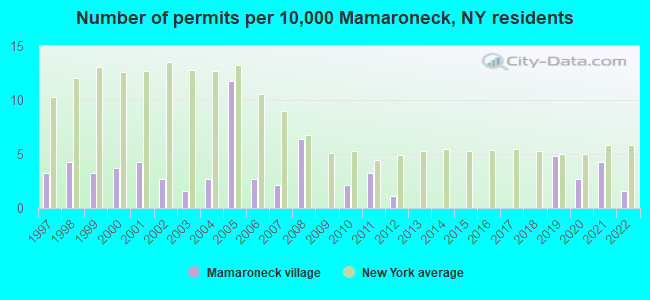
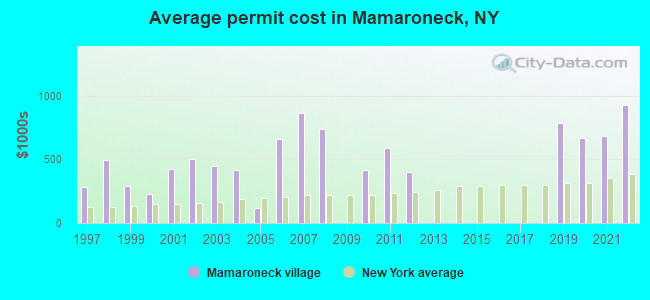
Single-family new house construction building permits:
2022: 3 buildings , average cost: $926,7002021: 8 buildings , average cost: $680,4002020: 5 buildings , average cost: $667,9002019: 9 buildings , average cost: $788,4002012: 2 buildings , average cost: $400,0002011: 6 buildings , average cost: $590,0002010: 4 buildings , average cost: $416,3002008: 12 buildings , average cost: $736,3002007: 4 buildings , average cost: $862,5002006: 5 buildings , average cost: $660,6002005: 22 buildings , average cost: $117,8002004: 5 buildings , average cost: $415,0002003: 3 buildings , average cost: $450,0002002: 5 buildings , average cost: $503,0002001: 8 buildings , average cost: $421,1002000: 7 buildings , average cost: $226,4001999: 6 buildings , average cost: $290,0001998: 8 buildings , average cost: $496,9001997: 6 buildings , average cost: $282,900Unemployment in December 2023:
Population change in the 1990s: +1,390 (+8.0%).
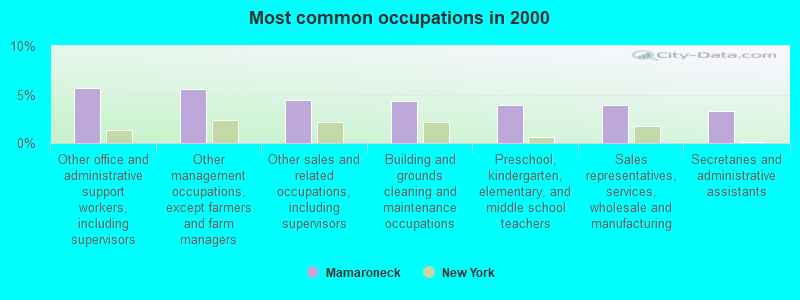
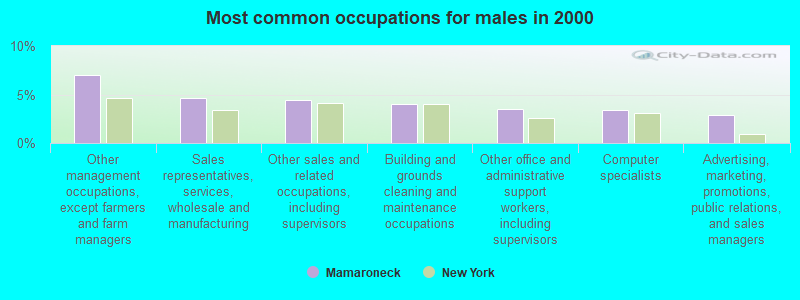
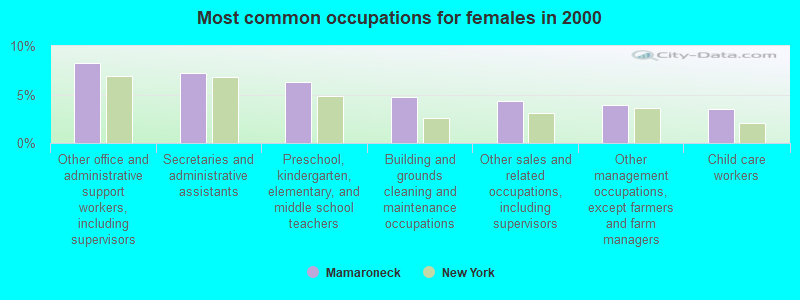
Most common occupations in Mamaroneck, NY (%)
Both Males Females
Other office and administrative support workers, including supervisors (5.7%)
Other management occupations, except farmers and farm managers (5.6%)
Other sales and related occupations, including supervisors (4.4%)
Building and grounds cleaning and maintenance occupations (4.3%)
Preschool, kindergarten, elementary, and middle school teachers (3.9%)
Sales representatives, services, wholesale and manufacturing (3.9%)
Secretaries and administrative assistants (3.3%)
Other management occupations, except farmers and farm managers (7.0%)
Sales representatives, services, wholesale and manufacturing (4.6%)
Other sales and related occupations, including supervisors (4.4%)
Building and grounds cleaning and maintenance occupations (4.0%)
Other office and administrative support workers, including supervisors (3.5%)
Computer specialists (3.4%)
Advertising, marketing, promotions, public relations, and sales managers (2.9%)
Other office and administrative support workers, including supervisors (8.3%)
Secretaries and administrative assistants (7.2%)
Preschool, kindergarten, elementary, and middle school teachers (6.3%)
Building and grounds cleaning and maintenance occupations (4.7%)
Other sales and related occupations, including supervisors (4.3%)
Other management occupations, except farmers and farm managers (3.9%)
Child care workers (3.5%)
Tornado activity:
Mamaroneck-area historical tornado activity is above New York state average. It is 42% smaller than the overall U.S. average.
On 7/10/1989, a category F4 (max. wind speeds 207-260 mph) tornado 49.5 miles away from the Mamaroneck village center injured 40 people and caused between $50,000,000 and $500,000,000 in damages.
On 7/15/1970, a category F2 (max. wind speeds 113-157 mph) tornado 9.9 miles away from the village center caused between $5000 and $50,000 in damages.
Earthquake activity:
Mamaroneck-area historical earthquake activity is significantly above New York state average. It is 69% smaller than the overall U.S. average. On 10/7/1983 at 10:18:46, a magnitude 5.3 (5.1 MB, 5.3 LG, 5.1 ML, Class: Moderate, Intensity: VI - VII) earthquake occurred 210.1 miles away from the city center On 8/23/2011 at 17:51:04, a magnitude 5.8 (5.8 MW, Depth: 3.7 mi) earthquake occurred 307.5 miles away from Mamaroneck center On 4/20/2002 at 10:50:47, a magnitude 5.3 (5.3 ML, Depth: 3.0 mi) earthquake occurred 246.5 miles away from the city center On 4/20/2002 at 10:50:47, a magnitude 5.2 (5.2 MB, 4.2 MS, 5.2 MW, 5.0 MW) earthquake occurred 244.7 miles away from Mamaroneck center On 1/16/1994 at 01:49:16, a magnitude 4.6 (4.6 MB, 4.6 LG, Depth: 3.1 mi, Class: Light, Intensity: IV - V) earthquake occurred 128.3 miles away from the city center On 8/22/1992 at 12:20:32, a magnitude 4.8 (4.8 MB, 3.8 MS, 4.7 LG, Depth: 6.2 mi) earthquake occurred 221.2 miles away from the city center Magnitude types: regional Lg-wave magnitude (LG), body-wave magnitude (MB), local magnitude (ML), surface-wave magnitude (MS), moment magnitude (MW) Natural disasters: The number of natural disasters in Westchester County (26) is a lot greater than the US average (15).Major Disasters (Presidential) Declared: 17Emergencies Declared: 8Floods: 9, Storms: 9, Hurricanes: 7, Blizzards: 2, Heavy Rains: 2, Tropical Storms: 2, Landslide: 1, Power Outage: 1, Snowstorm: 1, Water Shortage: 1, Other: 3 (Note: some incidents may be assigned to more than one category). Main business address for: SOUND FEDERAL BANCORP INC SAVINGS INSTITUTION, FEDERALLY CHARTERED ).
Hospitals and medical centers in Mamaroneck: YOUNG ADULT INSTITUTE (421 N BARRY AVE) JEWISH HOME LIFECARE, SARAH NEUMAN CENTER (845 PALMER AVENUE)
Other hospitals and medical centers near Mamaroneck: WESTCHESTER JEWISH COMMUNITY SERVICES (Hospital, about 2 miles away; LARCHMONT, NY)
WESTCHESTER JEWISH COMMUNITY SERVICES (Hospital, about 2 miles away; HARRISON, NY)
RICHMOND CHILDREN'S CENTER (Hospital, about 3 miles away; NEW ROCHELLE, NY)
THE OSBORN (Nursing Home, about 3 miles away; RYE, NY)
RYE PSYCH HOSP CENTER (Hospital, about 3 miles away; RYE, NY)
ST VINCENTS HOSP (Hospital, about 3 miles away; HARRISON, NY)
DRY HARBOR HRF (Nursing Home, about 4 miles away; MIDDLE VILLAGE, NY)
Amtrak stations near Mamaroneck: 4 miles: NEW ROCHELLE (DEPOT PLAZA NORTH) Services: enclosed waiting area, public restrooms, public payphones, paid short-term parking, paid long-term parking, call for car rental service, taxi stand, public transit connection.
9 miles: YONKERS (FOOT OF DOCK ST. & WELLS AVE.) Services: fully wheelchair accessible, enclosed waiting area, public restrooms, public payphones, snack bar, paid short-term parking, paid long-term parking, call for car rental service, taxi stand, public transit connection.
13 miles: STAMFORD (WASHINGTON BLVD. & E. STATE ST.) Services: ticket office, fully wheelchair accessible, enclosed waiting area, public restrooms, public payphones, snack bar, ATM, paid short-term parking, paid long-term parking, call for car rental service, taxi stand, public transit connection.
Colleges/universities with over 2000 students nearest to Mamaroneck:
Iona College (about 4 miles; New Rochelle, NY ; Full-time enrollment: 3,775)
The College of New Rochelle (about 5 miles; New Rochelle, NY ; FT enrollment: 3,635)
Manhattanville College (about 6 miles; Purchase, NY ; FT enrollment: 2,299)
SUNY at Purchase College (about 8 miles; Purchase, NY ; FT enrollment: 4,415)
SUNY Westchester Community College (about 9 miles; Valhalla, NY ; FT enrollment: 10,278)
Mercy College (about 9 miles; Dobbs Ferry, NY ; FT enrollment: 8,602)
Manhattan College (about 10 miles; Riverdale, NY ; FT enrollment: 3,508)
Public high schools in Mamaroneck:
Private high school in Mamaroneck:
Public elementary/middle schools in Mamaroneck:
Private elementary/middle school in Mamaroneck:
See full list of schools located in Mamaroneck Library in Mamaroneck: MAMARONECK PUBLIC LIBRARY DISTRICT Operating income: $1,583,713; Location: 102 MAMARONECK AVE.; 72,401 books ; 767 e-books ; 5,582 audio materials ; 3,302 video materials ; 14 state licensed databases ; 10 other licensed databases ; 65 print serial subscriptions )
Notable locations in Mamaroneck: (A) , Boardwalk Pier (B) , Washington Square (C) , Mamaroneck Station (D) , Mamaroneck Public Library (E) , Columbia Engine and Hose Company 2 (F) , Halstead Manor Engine and Hose Company 4 (G) , Village of Mamaroneck Fire Department Hook and Ladder Company 1 (H) , Mamaro Engine and Hose Company Number 1 (I) , Mamaroneck and Rye Neck Volunteer Engine and Hose Company 3 (J) , Sarah Neuman Center for Healthcare and Rehabilitation (K) , Sunnydale Home Adult Care Facility (L) , Mamaroneck Town Hall (M) , Mamaroneck Village Hall (N) . Display/hide their locations on the map
Main business address in Mamaroneck: (A) . Display/hide its location on the map
Churches in Mamaroneck include: (A) , Saint Vito's Church (B) , Mamaroneck United Methodist Church (C) , First Church of Christ (D) , Barry Avenue African Methodist Episcopal Zion Church (E) , First Church of Christ Scientist (F) , Victory Temple Pentecostal Church (G) , Saint John's Lutheran Church (H) , Saint Thomas Episcopal Church (I) . Display/hide their locations on the map
Cemeteries: (1) , Old Town of Mamaroneck Cemetery (2) , Rogers Cemetery (3) , Florence-Powell Cemetery (4) , Disbrow Cemetery (5) , Gedney Cemetery (6) . Display/hide their locations on the map
Reservoirs: (A) , Van Amringe Millpond (B) , Mamaroneck Reservoir (C) . Display/hide their locations on the map
Streams, rivers, and creeks: (A) , Mamaroneck River (B) , Otter Creek (C) , Sheldrake River (D) , Guion Creek (E) , Premium River (F) . Display/hide their locations on the map
Parks in Mamaroneck include: (1) , Florence Street Park (2) , Otter Creek Preserve (3) , Harbor Island Park (4) , Gillies Park (5) . Display/hide their locations on the map
Tourist attraction:
Westchester County has a predicted average indoor radon screening level less than 2 pCi/L (pico curies per liter) - Low Potential Average household size: This village:
2.6 peopleNew York:
2.6 people
Percentage of family households: This village:
67.3%Whole state:
63.5%
Percentage of households with unmarried partners: This village:
5.1%Whole state:
6.8%
Likely homosexual households (counted as self-reported same-sex unmarried-partner households)
Lesbian couples: 0.3% of all households Gay men: 0.4% of all households
People in group quarters in Mamaroneck in 2010:
300 people in nursing facilities/skilled-nursing facilities
52 people in group homes intended for adults
52 people in other noninstitutional facilities
People in group quarters in Mamaroneck in 2000:
276 people in nursing homes
15 people in homes for the mentally retarded
15 people in other noninstitutional group quarters
8 people in religious group quarters
7 people in homes for the mentally ill
Banks with most branches in Mamaroneck (2011 data):
JPMorgan Chase Bank, National Association: East Boston Post Road Branch, Mamaroneck Branch, Mamaroneck Branch. Info updated 2011/11/10: Bank assets: $1,811,678.0 mil, Deposits: $1,190,738.0 mil, headquarters in Columbus, OH, positive income , International Specialization, 5577 total offices , Holding Company: Jpmorgan Chase & Co.
Bank of America, National Association: Mamaroneck - Post Road Branch at 1160 West Boston Post Road, branch established on 2011/06/01. Info updated 2009/11/18: Bank assets: $1,451,969.3 mil, Deposits: $1,077,176.8 mil, headquarters in Charlotte, NC, positive income , 5782 total offices , Holding Company: Bank Of America Corporation
Hudson City Savings Bank: Mamaroneck Branch at 300 Mamaroneck Avenue, branch established on 2006/07/14. Info updated 2012/01/09: Bank assets: $45,373.6 mil, Deposits: $25,645.6 mil, headquarters in Paramus, NJ, negative income in the last year , Mortgage Lending Specialization, 135 total offices
HSBC Bank USA, National Association: Mamaroneck Branch at 1043 West Boston Post Road, branch established on 1972/03/28. Info updated 2010/11/30: Bank assets: $206,009.7 mil, Deposits: $149,026.8 mil, headquarters in Mc Lean, VA, positive income , 474 total offices , Holding Company: Hsbc Holdings Plc
Citibank, National Association: Mamaroneck Branch at 711 East Boston Post Road, branch established on 1963/12/19. Info updated 2012/01/10: Bank assets: $1,288,658.0 mil, Deposits: $882,541.0 mil, headquarters in Sioux Falls, SD, positive income , International Specialization, 1048 total offices , Holding Company: Citigroup Inc.
People's United Bank: Mamaroneck Branch at 1444 East Boston Post Road, branch established on 2009/12/14. Info updated 2012/02/16: Bank assets: $27,319.3 mil, Deposits: $20,835.4 mil, headquarters in Bridgeport, CT, positive income , Commercial Lending Specialization, 374 total offices
Wells Fargo Bank, National Association: Mamaroneck Branch at 219 Mamaroneck Avenue, branch established on 1988/09/12. Info updated 2011/04/05: Bank assets: $1,161,490.0 mil, Deposits: $905,653.0 mil, headquarters in Sioux Falls, SD, positive income , 6395 total offices , Holding Company: Wells Fargo & Company
Webster Bank, National Association: Mamaroneck Branch at 1265 Boston Post Road, branch established on 2004/12/28. Info updated 2008/12/23: Bank assets: $18,674.3 mil, Deposits: $13,861.5 mil, headquarters in Waterbury, CT, positive income , Commercial Lending Specialization, 167 total offices , Holding Company: Webster Financial Corporation
TrustCo Bank: Mamaroneck Branch at 180-190 E Boston Post Rd, branch established on 2006/04/24. Info updated 2011/07/21: Bank assets: $4,250.1 mil, Deposits: $3,736.0 mil, headquarters in Glenville, NY, positive income , Mortgage Lending Specialization, 135 total offices
2 other banks with 2 local branches
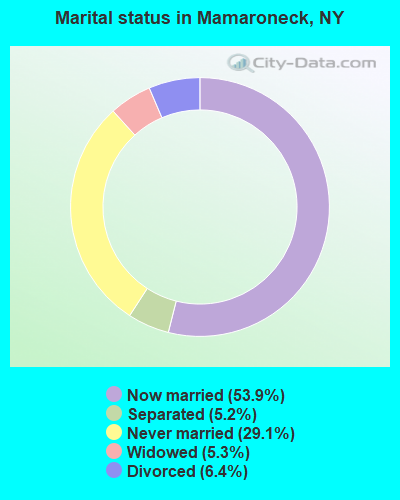
For population 15 years and over in Mamaroneck:
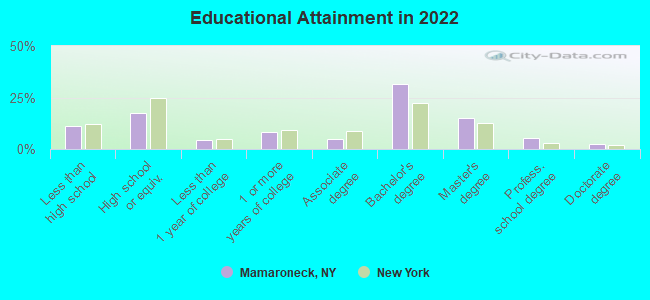
Never married: 29.1%Now married: 53.9%Separated: 5.2%Widowed: 5.3%Divorced: 6.4% For population 25 years and over in Mamaroneck:
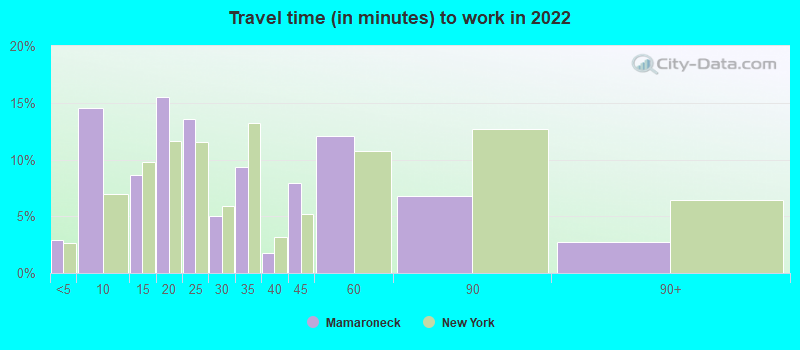
High school or higher: 87.5%Bachelor's degree or higher: 52.6%Graduate or professional degree: 22.8%Unemployed: 3.8%Mean travel time to work (commute): 24.1 minutes
Education Gini index (Inequality in education) Here:
13.3New York average:
13.9
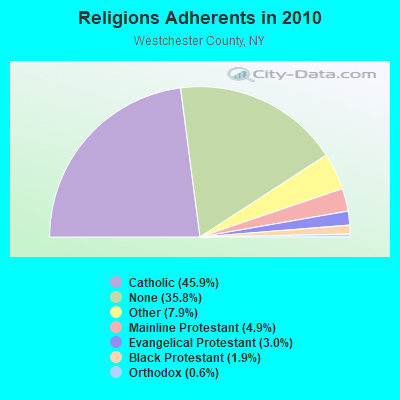
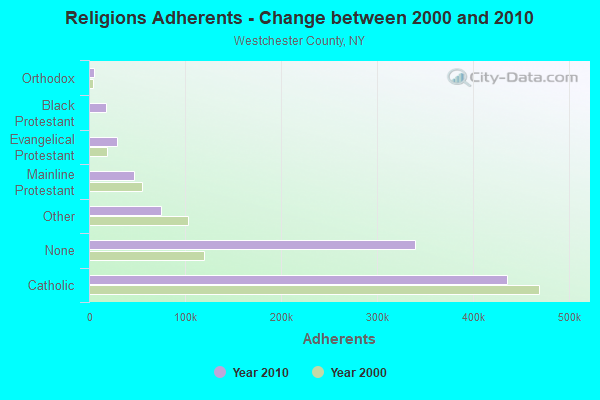
Religion statistics for Mamaroneck, NY (based on Westchester County data)
Religion Adherents Congregations Catholic 435,590 100 Other 75,029 114 Mainline Protestant 46,854 176 Evangelical Protestant 28,915 209 Black Protestant 17,814 38 Orthodox 5,458 16 None 339,453 -
Source: Clifford Grammich, Kirk Hadaway, Richard Houseal, Dale E.Jones, Alexei Krindatch, Richie Stanley and Richard H.Taylor. 2012. 2010 U.S.Religion Census: Religious Congregations & Membership Study. Association of Statisticians of American Religious Bodies. Jones, Dale E., et al. 2002. Congregations and Membership in the United States 2000. Nashville, TN: Glenmary Research Center. Graphs represent county-level data
Food Environment Statistics: Number of grocery stores : 417Westchester County :
4.39 / 10,000 pop.New York :
4.13 / 10,000 pop.
Number of supercenters and club stores : 5Here :
0.05 / 10,000 pop.State :
0.06 / 10,000 pop.
Number of convenience stores (no gas) : 71Westchester County :
0.75 / 10,000 pop.New York :
0.92 / 10,000 pop.
Number of convenience stores (with gas) : 111Here :
1.17 / 10,000 pop.New York :
1.68 / 10,000 pop.
Number of full-service restaurants : 904Westchester County :
9.52 / 10,000 pop.State :
8.82 / 10,000 pop.
Adult diabetes rate : This county :
7.6%State :
8.2%
Adult obesity rate : This county :
19.1%New York :
23.8%
Low-income preschool obesity rate : This county :
17.8%New York :
15.6%
Health and Nutrition:
Average overall health of teeth and gums : Mamaroneck:
49.6%New York:
48.1%
People feeling badly about themselves : This city:
19.7%New York:
20.3%
People not drinking alcohol at all : Average hours sleeping at night : General health condition : Mamaroneck:
57.7%New York:
56.5%
Average condition of hearing : This city:
79.5%New York:
80.2%
More about Health and Nutrition of Mamaroneck, NY Residents
Local government employment and payroll (March 2022)
Function
Full-time employees
Monthly full-time payroll
Average yearly full-time wage
Part-time employees
Monthly part-time payroll
Police Protection - Officers
47 $560,954 $143,222 0 $0 Streets and Highways
23 $198,509 $103,570 0 $0 Parks and Recreation
17 $101,100 $71,365 1 $266 Other Government Administration
14 $212,059 $181,765 6 $10,968 Solid Waste Management
13 $97,495 $89,995 1 $248 Financial Administration
8 $68,243 $102,365 2 $6,461 Police - Other
7 $45,202 $77,489 22 $14,551 Judicial and Legal
3 $18,043 $72,172 5 $18,787 Water Transport and Terminals
3 $18,310 $73,240 0 $0 Other and Unallocable
2 $21,779 $130,674 1 $2,307 Fire - Other
1 $6,331 $75,972 10 $3,688 Sewerage
1 $9,522 $114,264 0 $0
Totals for Government
139 $1,357,547 $117,198 48 $57,276
Mamaroneck government finances - Expenditure in 2021 (per resident):
Construction - Water Utilities: $2,029,000 ($103.16)
General - Other: $510,000 ($25.93)Regular Highways: $352,000 ($17.90)Parks and Recreation: $235,000 ($11.95)Sewerage: $148,000 ($7.52)Police Protection: $56,000 ($2.85)Local Fire Protection: $34,000 ($1.73)Solid Waste Management: $25,000 ($1.27)Current Operations - Water Utilities: $16,196,000 ($823.43)
General - Other: $15,356,000 ($780.72)Police Protection: $7,998,000 ($406.63)Parks and Recreation: $2,124,000 ($107.99)Solid Waste Management: $1,984,000 ($100.87)Regular Highways: $1,591,000 ($80.89)Central Staff Services: $1,229,000 ($62.48)Judicial and Legal Services: $1,185,000 ($60.25)Financial Administration: $789,000 ($40.11)Protective Inspection and Regulation - Other: $640,000 ($32.54)Local Fire Protection: $617,000 ($31.37)Parking Facilities: $451,000 ($22.93)Health - Other: $315,000 ($16.02)Natural Resources - Other: $290,000 ($14.74)Sewerage: $262,000 ($13.32)General Public Buildings: $207,000 ($10.52)Correctional Institutions: $1,000 ($0.05)General - Interest on Debt: $2,951,000 ($150.03)
Intergovernmental to Local - Other - Financial Administration: $238,000 ($12.10)
Other Capital Outlay - Water Utilities: $5,242,000 ($266.51)
Police Protection: $232,000 ($11.80)Local Fire Protection: $160,000 ($8.13)General - Other: $46,000 ($2.34)Parks and Recreation: $23,000 ($1.17)Regular Highways: $16,000 ($0.81)Solid Waste Management: $15,000 ($0.76)Parking Facilities: $3,000 ($0.15)Sewerage: $3,000 ($0.15)Financial Administration: $2,000 ($0.10)Central Staff Services: $1,000 ($0.05)Natural Resources - Other: $1,000 ($0.05)Protective Inspection and Regulation - Other: $1,000 ($0.05)Total Salaries and Wages: $19,187,000 ($975.49)
Mamaroneck government finances - Revenue in 2021 (per resident):
Charges - Parks and Recreation: $1,144,000 ($58.16)
Other: $892,000 ($45.35)Parking Facilities: $834,000 ($42.40)Sewerage: $570,000 ($28.98)Local Intergovernmental - General Local Government Support: $4,501,000 ($228.84)
Other: $2,389,000 ($121.46)Highways: $32,000 ($1.63)Miscellaneous - General Revenue - Other: $807,000 ($41.03)
Fines and Forfeits: $528,000 ($26.84)Rents: $338,000 ($17.18)Interest Earnings: $259,000 ($13.17)Revenue - Water Utilities: $26,855,000 ($1365.35)
State Intergovernmental - Other: $305,000 ($15.51)
General Local Government Support: $58,000 ($2.95)Tax - Property: $26,355,000 ($1339.93)
Other License: $1,686,000 ($85.72)Public Utilities Sales: $346,000 ($17.59)Other Selective Sales: $26,000 ($1.32)Occupation and Business License - Other: $1,000 ($0.05)
Mamaroneck government finances - Debt in 2021 (per resident):
Long Term Debt - Beginning Outstanding - Unspecified Public Purpose: $42,007,000 ($2135.70)
Outstanding Unspecified Public Purpose: $39,570,000 ($2011.80)Retired Unspecified Public Purpose: $2,437,000 ($123.90)Short Term Debt Outstanding - End of Fiscal Year: $2,568,000 ($130.56)
Mamaroneck government finances - Cash and Securities in 2021 (per resident):
Bond Funds - Cash and Securities: $1,114,000 ($56.64)
Other Funds - Cash and Securities: $17,982,000 ($914.23)
Sinking Funds - Cash and Securities: $3,228,000 ($164.12)
5.69% of this county's 2021 resident taxpayers lived in other counties in 2020 ($147,956 average adjusted gross income )
Here:
5.69%New York average:
5.29%
0.02% of residents moved from foreign countries ($25 average AGI )Westchester County:
0.02%New York average:
0.01%
Top counties from which taxpayers relocated into this county between 2020 and 2021:
6.51% of this county's 2020 resident taxpayers moved to other counties in 2021 ($174,362 average adjusted gross income )
Here:
6.51%New York average:
6.93%
0.01% of residents moved to foreign countries ($44 average AGI )Westchester County:
0.01%New York average:
0.02%
Top counties to which taxpayers relocated from this county between 2020 and 2021:
Businesses in Mamaroneck, NY
Name Count Name Count
A&P 1 McDonald's 1 AT&T 1 Nike 2 Applebee's 1 Payless 1 BMW 1 RadioShack 1 CVS 2 Starbucks 1 Domino's Pizza 1 Stop & Shop 1 Dunkin Donuts 2 Toyota 1 FedEx 5 True Value 1 Jones New York 1 U-Haul 1 MasterBrand Cabinets 4 UPS 4
Strongest AM radio stations in Mamaroneck:
WFAN (660 AM; 50 kW; NEW YORK, NY; Owner: INFINITY BROADCASTING OPERATIONS, INC.)
WCBS (880 AM; 50 kW; NEW YORK, NY; Owner: INFINITY BROADCASTING OPERATIONS, INC.)
WABC (770 AM; 50 kW; NEW YORK, NY; Owner: WABC-AM RADIO, INC.)
WMCA (570 AM; 50 kW; NEW YORK, NY; Owner: SALEM MEDIA OF NEW YORK, LLC)
WOR (710 AM; 50 kW; NEW YORK, NY; Owner: BUCKLEY BROADCASTING CORPORATION)
WBBR (1130 AM; 50 kW; NEW YORK, NY; Owner: BLOOMBERG COMMUNICATIONS INC.)
WEPN (1050 AM; 50 kW; NEW YORK, NY; Owner: NEW YORK AM RADIO, LLC)
WGSM (740 AM; 25 kW; HUNTINGTON, NY; Owner: K RADIO LICENSEE, INC.)
WINS (1010 AM; 50 kW; NEW YORK, NY; Owner: INFINITY BROADCASTING OPERATIONS, INC.)
WADO (1280 AM; 50 kW; NEW YORK, NY; Owner: WADO-AM LICENSE CORP.)
WQEW (1560 AM; 50 kW; NEW YORK, NY; Owner: THE NEW YORK TIMES ELECTRONIC MEDIA COMPANY)
WLIB (1190 AM; 30 kW; NEW YORK, NY; Owner: ICBC BROADCAST HOLDINGS-NY, INC.)
WVOX (1460 AM; 0 kW; NEW ROCHELLE, NY; Owner: HUDSON-WESTCHESTER RADIO, INC.)
Strongest FM radio stations in Mamaroneck:
WPLJ (95.5 FM; NEW YORK, NY; Owner: WPLJ-FM RADIO, INC.)
WFAS-FM (103.9 FM; WHITE PLAINS, NY; Owner: CUMULUS LICENSING CORP.)
WKCR-FM (89.9 FM; NEW YORK, NY; Owner: TRUSTEES OF COLUMBIA UNIVERSITY IN NEW YORK)
WRTN (93.5 FM; NEW ROCHELLE, NY; Owner: HUDSON-WESTCHESTER RADIO, INC.)
WXPK (107.1 FM; BRIARCLIFF MANOR, NY; Owner: NASSAU BROADCASTING HOLDINGS, INC.)
WKTU (103.5 FM; LAKE SUCCESS, NY; Owner: AMFM RADIO LICENSES, LLC)
WQCD (101.9 FM; NEW YORK, NY; Owner: EMMIS RADIO LICENSE CORPORATION)
WAXQ (104.3 FM; NEW YORK, NY; Owner: AMFM NEW YORK LICENSES, LLC)
WHTZ (100.3 FM; NEWARK, NJ; Owner: AMFM RADIO LICENSES, L.L.C.)
WWPR-FM (105.1 FM; NEW YORK, NY; Owner: AMFM RADIO LICENSES, L.L.C.)
WCBS-FM (101.1 FM; NEW YORK, NY; Owner: INFINITY BROADCASTING OPERATIONS, INC.)
WCAA (105.9 FM; NEWARK, NJ; Owner: WADO-AM LICENSE CORP. ("WADO"))
WBAI (99.5 FM; NEW YORK, NY; Owner: PACIFICA FOUNDATION, INC.)
WBLS (107.5 FM; NEW YORK, NY; Owner: ICBC BROADCAST HOLDINGS-NY, INC.)
WLTW (106.7 FM; NEW YORK, NY; Owner: AMFM NEW YORK LICENSES, LLC)
WQXR-FM (96.3 FM; NEW YORK, NY; Owner: THE NEW YORK TIMES ELECTRONIC MEDIA COMPANY)
WSKQ-FM (97.9 FM; NEW YORK, NY; Owner: WSKQ LICENSING, INC.)
WXRK (92.3 FM; NEW YORK, NY; Owner: INFINITY BROADCASTING OPERATIONS, INC.)
WQHT (97.1 FM; NEW YORK, NY; Owner: EMMIS LICENSE CORPORATION OF NEW YORK)
WNYC-FM (93.9 FM; NEW YORK, NY; Owner: WNYC RADIO)
TV broadcast stations around Mamaroneck:
W38CL (Channel 38; BRONX, NY; Owner: RENARD COMMUNICATIONS CORP.)
WNYW (Channel 5; NEW YORK, NY; Owner: FOX TELEVISION STATIONS, INC.)
W68DN (Channel 68; CHERRY HILL, ETC., NJ; Owner: MARCIA COHEN)
WCBS-TV (Channel 2; NEW YORK, NY; Owner: CBS BROADCASTING INC.)
WABC-TV (Channel 7; NEW YORK, NY; Owner: AMERICAN BROADCASTING COMPANIES, INC)
WPIX (Channel 11; NEW YORK, NY; Owner: WPIX, INC.)
WWOR-TV (Channel 9; SECAUCUS, NJ; Owner: FOX TELEVISION STATIONS, INC.)
WXNY-LP (Channel 32; NEW YORK, NY; Owner: ISLAND BROADCASTING COMPANY)
WNJU (Channel 47; LINDEN, NJ; Owner: WNJU LICENSE CORPORATION)
WFUT (Channel 68; NEWARK, NJ; Owner: UNIVISION NEW YORK LLC)
WNYE-TV (Channel 25; NEW YORK, NY; Owner: NEW YORK CITY BOARD OF EDUCATION)
WPXN-TV (Channel 31; NEW YORK, NY; Owner: PAXSON COMMUNICATIONS LICENSE COMPANY, LLC)
WNBC (Channel 4; NEW YORK, NY; Owner: NATIONAL BROADCASTING COMPANY, INC.)
WNET (Channel 13; NEWARK, NJ; Owner: EDUCATIONAL BROADCASTING CORPORATION)
WXTV (Channel 41; PATERSON, NJ; Owner: WXTV LICENSE PARTNERSHIP, G.P.)
WKOB-LP (Channel 53; NEW YORK, NY; Owner: WKOB COMMUNICATIONS, INC.)
WEBR-CA (Channel 17; MANHATTAN, NY; Owner: K LICENSEE INC.)
WRNN-LP (Channel 57; NYACK, NY; Owner: LP NYACK LIMITED PARTNERSHIP)
W60AI (Channel 60; NEW YORK, NY; Owner: VENTANA TELEVISION, INC.)
WNYX-LP (Channel 35; NEW YORK, NY; Owner: ISLAND BROADCASTING COMPANY)
W33BS (Channel 33; DARIEN, CT; Owner: CT&T BROADCASTING, INC.)
WNYN-LP (Channel 39; NEW YORK, NY; Owner: ISLAND BROADCASTING COMPANY)
WPXO-LP (Channel 34; EAST ORANGE, NJ; Owner: PAXSON COMMUNICATIONS LPTV, INC.)
WNXY-LP (Channel 26; NEW YORK, NY; Owner: ISLAND BROADCASTING COMPANY)
WFME-TV (Channel 66; WEST MILFORD, NJ; Owner: FAMILY STATIONS, INC.)
Medal of Honor Recipients
Medal of Honor Recipient born in Mamaroneck: David H. Scofield.
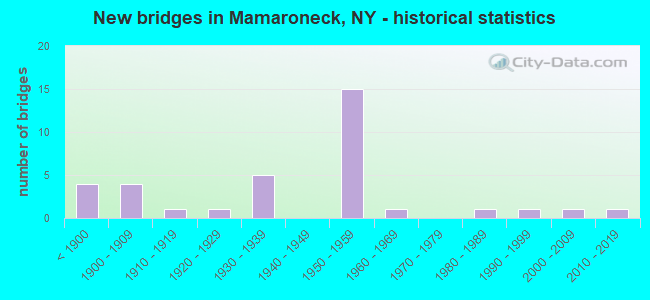
National Bridge Inventory (NBI) Statistics 35 Number of bridges187ft / 56.7m Total length $108,546,000 Total costs673,566 Total average daily traffic45,665 Total average daily truck traffic
New bridges - historical statistics
4 Before 1900 4 1900-1909 1 1910-1919 1 1920-1929 5 1930-1939 15 1950-1959 1 1960-1969 1 1980-1989 1 1990-1999 1 2000-2009 1 2010-2019
See full National Bridge Inventory statistics for Mamaroneck, NY
FCC Registered Antenna Towers: 2
john e arthur, Fenimore Road & I-95 (Lat: 40.950889 Lon: -73.745194), Type: 39.6, Overall height: 33.5 m, Registrant: Wireless Edge Westchester Group LLC, Arthur@wirelessedge.Org, , New R-ochelle, Phone: (914) 712-0000 john e arthur, Fenimore Road & I-95 (Lat: 40.950889 Lon: -73.745194), Type: 39.6, Overall height: 33.5 m, Registrant: Wireless Edge Westchester Group LLC, Arthur@wirelessedge.Org, , New R-ochelle, Phone: (914) 712-0000 FCC Registered Broadcast Land Mobile Towers: 18 (
See the full list of FCC Registered Broadcast Land Mobile Towers in Mamaroneck, NY )
FCC Registered Microwave Towers: 2 (
See the full list of FCC Registered Microwave Towers in this town )
FCC Registered Maritime Coast & Aviation Ground Towers: 9 (
See the full list of FCC Registered Maritime Coast & Aviation Ground Towers )
FCC Registered Amateur Radio Licenses: 58 (
See the full list of FCC Registered Amateur Radio Licenses in Mamaroneck )
FAA Registered Aircraft: 12 (
See the full list of FAA Registered Aircraft in Mamaroneck )
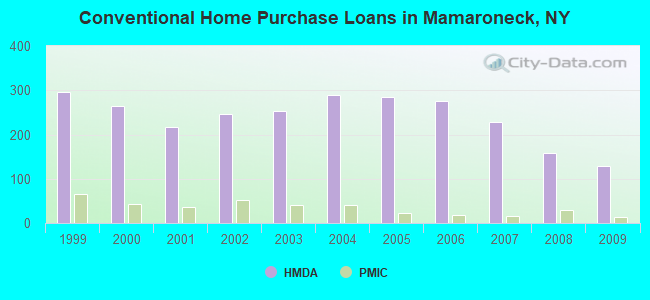
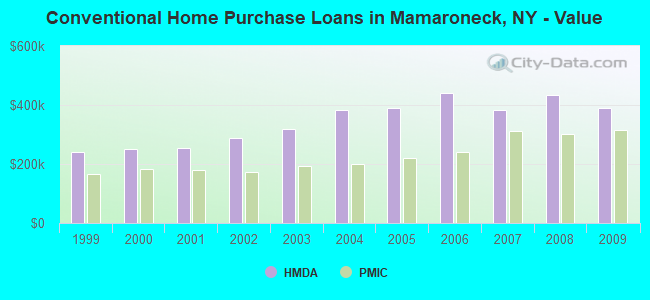
Home Mortgage Disclosure Act Aggregated Statistics For Year 2009(Based on 4 full and 2 partial tracts) A) FHA, FSA/RHS & VA B) Conventional C) Refinancings D) Home Improvement Loans E) Loans on Dwellings For 5+ Families F) Non-occupant Loans on Number Average Value Number Average Value Number Average Value Number Average Value Number Average Value Number Average Value
LOANS ORIGINATED 9 $447,263 128 $389,588 177 $351,102 17 $393,931 3 $1,197,667 7 $540,994 APPLICATIONS APPROVED, NOT ACCEPTED 0 $0 15 $792,303 25 $343,145 4 $164,078 0 $0 2 $251,565 APPLICATIONS DENIED 0 $0 22 $327,758 123 $389,779 14 $120,721 0 $0 12 $243,606 APPLICATIONS WITHDRAWN 0 $0 21 $331,804 68 $415,072 1 $377,790 0 $0 3 $390,823 FILES CLOSED FOR INCOMPLETENESS 0 $0 2 $659,010 17 $462,748 2 $210,000 0 $0 2 $346,000
Aggregated Statistics For Year 2008(Based on 4 full and 2 partial tracts) A) FHA, FSA/RHS & VA B) Conventional C) Refinancings D) Home Improvement Loans F) Non-occupant Loans on Number Average Value Number Average Value Number Average Value Number Average Value Number Average Value
LOANS ORIGINATED 3 $440,673 158 $434,110 87 $342,406 21 $205,503 14 $490,115 APPLICATIONS APPROVED, NOT ACCEPTED 2 $361,500 38 $490,552 37 $287,945 6 $275,673 4 $574,590 APPLICATIONS DENIED 1 $540,000 35 $505,583 81 $423,712 12 $56,536 10 $519,181 APPLICATIONS WITHDRAWN 2 $599,500 22 $474,503 33 $418,369 5 $163,600 2 $347,500 FILES CLOSED FOR INCOMPLETENESS 0 $0 9 $638,080 19 $495,834 0 $0 1 $309,000
Aggregated Statistics For Year 2007(Based on 4 full and 2 partial tracts) A) FHA, FSA/RHS & VA B) Conventional C) Refinancings D) Home Improvement Loans E) Loans on Dwellings For 5+ Families F) Non-occupant Loans on Number Average Value Number Average Value Number Average Value Number Average Value Number Average Value Number Average Value
LOANS ORIGINATED 0 $0 229 $383,335 129 $353,151 29 $181,122 4 $570,380 9 $348,091 APPLICATIONS APPROVED, NOT ACCEPTED 0 $0 46 $389,087 31 $341,759 11 $212,139 0 $0 4 $320,250 APPLICATIONS DENIED 0 $0 42 $484,101 110 $442,746 26 $127,153 0 $0 9 $464,840 APPLICATIONS WITHDRAWN 0 $0 27 $378,339 39 $445,190 3 $120,853 1 $1,400,000 6 $562,988 FILES CLOSED FOR INCOMPLETENESS 1 $370,000 8 $434,845 28 $485,674 0 $0 0 $0 4 $784,565
Aggregated Statistics For Year 2006(Based on 4 full and 2 partial tracts) A) FHA, FSA/RHS & VA B) Conventional C) Refinancings D) Home Improvement Loans E) Loans on Dwellings For 5+ Families F) Non-occupant Loans on G) Loans On Manufactured Number Average Value Number Average Value Number Average Value Number Average Value Number Average Value Number Average Value Number Average Value
LOANS ORIGINATED 1 $225,000 275 $440,056 180 $385,114 30 $153,829 4 $1,188,970 36 $470,405 0 $0 APPLICATIONS APPROVED, NOT ACCEPTED 0 $0 41 $417,707 43 $339,548 11 $197,276 1 $2,640,000 4 $383,750 1 $55,000 APPLICATIONS DENIED 0 $0 61 $398,089 80 $399,699 19 $148,477 1 $467,000 7 $929,571 0 $0 APPLICATIONS WITHDRAWN 0 $0 30 $492,946 73 $403,949 3 $621,153 2 $105,000 11 $477,737 0 $0 FILES CLOSED FOR INCOMPLETENESS 0 $0 13 $292,388 23 $494,126 2 $334,990 0 $0 0 $0 1 $357,000
Aggregated Statistics For Year 2005(Based on 4 full and 2 partial tracts) B) Conventional C) Refinancings D) Home Improvement Loans E) Loans on Dwellings For 5+ Families F) Non-occupant Loans on Number Average Value Number Average Value Number Average Value Number Average Value Number Average Value
LOANS ORIGINATED 284 $389,630 207 $349,733 30 $138,810 6 $911,768 38 $360,268 APPLICATIONS APPROVED, NOT ACCEPTED 31 $372,015 52 $304,797 15 $108,449 0 $0 2 $312,140 APPLICATIONS DENIED 47 $390,673 91 $325,501 26 $160,049 1 $400,000 5 $484,976 APPLICATIONS WITHDRAWN 49 $455,639 107 $329,906 13 $205,464 0 $0 1 $366,570 FILES CLOSED FOR INCOMPLETENESS 16 $371,378 21 $398,760 6 $139,485 0 $0 0 $0
Aggregated Statistics For Year 2004(Based on 4 full and 2 partial tracts) B) Conventional C) Refinancings D) Home Improvement Loans E) Loans on Dwellings For 5+ Families F) Non-occupant Loans on Number Average Value Number Average Value Number Average Value Number Average Value Number Average Value
LOANS ORIGINATED 289 $384,194 258 $302,269 25 $160,591 2 $284,465 25 $379,409 APPLICATIONS APPROVED, NOT ACCEPTED 51 $352,858 61 $294,480 7 $233,637 0 $0 4 $370,748 APPLICATIONS DENIED 41 $383,681 103 $270,703 23 $118,920 0 $0 10 $401,011 APPLICATIONS WITHDRAWN 63 $401,944 127 $281,861 8 $276,806 4 $330,398 11 $248,375 FILES CLOSED FOR INCOMPLETENESS 12 $701,910 23 $278,709 4 $171,500 0 $0 1 $304,770
Aggregated Statistics For Year 2003(Based on 4 full and 2 partial tracts) A) FHA, FSA/RHS & VA B) Conventional C) Refinancings D) Home Improvement Loans E) Loans on Dwellings For 5+ Families F) Non-occupant Loans on Number Average Value Number Average Value Number Average Value Number Average Value Number Average Value Number Average Value
LOANS ORIGINATED 0 $0 252 $317,193 740 $273,835 12 $75,356 4 $1,622,500 38 $282,383 APPLICATIONS APPROVED, NOT ACCEPTED 0 $0 34 $279,436 129 $263,072 8 $45,480 0 $0 3 $216,983 APPLICATIONS DENIED 1 $271,000 40 $346,476 168 $281,576 13 $94,243 0 $0 14 $294,933 APPLICATIONS WITHDRAWN 0 $0 32 $287,222 130 $309,337 4 $157,175 0 $0 7 $190,084 FILES CLOSED FOR INCOMPLETENESS 0 $0 6 $263,027 30 $329,462 1 $100,000 0 $0 0 $0
Aggregated Statistics For Year 2002(Based on 4 full and 2 partial tracts) B) Conventional C) Refinancings D) Home Improvement Loans E) Loans on Dwellings For 5+ Families F) Non-occupant Loans on Number Average Value Number Average Value Number Average Value Number Average Value Number Average Value
LOANS ORIGINATED 247 $286,729 483 $283,757 27 $90,491 2 $1,168,480 29 $286,662 APPLICATIONS APPROVED, NOT ACCEPTED 35 $413,249 83 $311,834 12 $54,222 0 $0 4 $219,675 APPLICATIONS DENIED 23 $227,144 112 $245,124 19 $121,848 0 $0 9 $232,137 APPLICATIONS WITHDRAWN 27 $265,572 96 $227,129 7 $88,280 0 $0 9 $222,414 FILES CLOSED FOR INCOMPLETENESS 5 $309,158 34 $217,426 2 $147,805 0 $0 0 $0
Aggregated Statistics For Year 2001(Based on 4 full and 2 partial tracts) B) Conventional C) Refinancings D) Home Improvement Loans E) Loans on Dwellings For 5+ Families F) Non-occupant Loans on Number Average Value Number Average Value Number Average Value Number Average Value Number Average Value
LOANS ORIGINATED 217 $253,019 274 $243,989 24 $59,530 2 $1,125,340 17 $251,002 APPLICATIONS APPROVED, NOT ACCEPTED 23 $326,698 57 $222,696 11 $38,046 1 $85,000 2 $261,710 APPLICATIONS DENIED 17 $233,718 92 $207,070 25 $46,101 1 $350,000 9 $166,016 APPLICATIONS WITHDRAWN 24 $172,445 80 $206,151 13 $50,877 0 $0 1 $57,670 FILES CLOSED FOR INCOMPLETENESS 5 $446,808 20 $215,576 3 $90,000 0 $0 1 $142,680
Aggregated Statistics For Year 2000(Based on 4 full and 2 partial tracts) A) FHA, FSA/RHS & VA B) Conventional C) Refinancings D) Home Improvement Loans E) Loans on Dwellings For 5+ Families F) Non-occupant Loans on Number Average Value Number Average Value Number Average Value Number Average Value Number Average Value Number Average Value
LOANS ORIGINATED 2 $225,000 264 $250,115 81 $191,130 30 $74,976 2 $390,980 7 $169,976 APPLICATIONS APPROVED, NOT ACCEPTED 0 $0 31 $270,734 17 $220,212 15 $73,471 1 $424,000 3 $257,517 APPLICATIONS DENIED 0 $0 43 $220,110 50 $141,465 23 $54,520 1 $100,000 2 $277,810 APPLICATIONS WITHDRAWN 0 $0 21 $317,501 54 $136,226 10 $86,003 0 $0 2 $85,620 FILES CLOSED FOR INCOMPLETENESS 0 $0 10 $337,421 8 $187,790 0 $0 0 $0 2 $263,245
Aggregated Statistics For Year 1999(Based on 3 full and 2 partial tracts) A) FHA, FSA/RHS & VA B) Conventional C) Refinancings D) Home Improvement Loans E) Loans on Dwellings For 5+ Families F) Non-occupant Loans on Number Average Value Number Average Value Number Average Value Number Average Value Number Average Value Number Average Value
LOANS ORIGINATED 1 $221,080 295 $239,335 194 $202,062 20 $52,192 2 $222,915 27 $273,119 APPLICATIONS APPROVED, NOT ACCEPTED 1 $41,050 35 $249,066 55 $174,200 10 $44,212 1 $222,920 4 $150,688 APPLICATIONS DENIED 1 $235,000 34 $183,065 72 $306,557 13 $45,840 2 $144,600 5 $669,682 APPLICATIONS WITHDRAWN 0 $0 25 $193,590 70 $159,764 7 $96,523 0 $0 1 $327,450 FILES CLOSED FOR INCOMPLETENESS 0 $0 7 $160,047 23 $173,097 6 $70,102 0 $0 1 $55,970
Detailed HMDA statistics for the following Tracts:
0070.00
, 0071.00 , 0072.00 , 0073.00 , 0074.01 , 0074.02
Private Mortgage Insurance Companies Aggregated Statistics For Year 2009(Based on 4 full and 2 partial tracts) A) Conventional B) Refinancings Number Average Value Number Average Value
LOANS ORIGINATED 13 $316,768 6 $359,500 APPLICATIONS APPROVED, NOT ACCEPTED 2 $253,995 0 $0 APPLICATIONS DENIED 1 $347,060 2 $620,440 APPLICATIONS WITHDRAWN 2 $389,250 0 $0 FILES CLOSED FOR INCOMPLETENESS 0 $0 0 $0
Aggregated Statistics For Year 2008(Based on 4 full and 2 partial tracts) A) Conventional B) Refinancings C) Non-occupant Loans on Number Average Value Number Average Value Number Average Value
LOANS ORIGINATED 29 $301,052 2 $246,500 0 $0 APPLICATIONS APPROVED, NOT ACCEPTED 7 $422,166 2 $385,500 0 $0 APPLICATIONS DENIED 7 $468,114 1 $600,000 1 $564,000 APPLICATIONS WITHDRAWN 4 $437,500 1 $162,000 0 $0 FILES CLOSED FOR INCOMPLETENESS 0 $0 0 $0 0 $0
Aggregated Statistics For Year 2007(Based on 4 full and 2 partial tracts) A) Conventional B) Refinancings C) Non-occupant Loans on Number Average Value Number Average Value Number Average Value
LOANS ORIGINATED 15 $311,871 2 $542,250 1 $383,000 APPLICATIONS APPROVED, NOT ACCEPTED 5 $450,842 0 $0 1 $342,000 APPLICATIONS DENIED 0 $0 1 $320,000 0 $0 APPLICATIONS WITHDRAWN 0 $0 0 $0 0 $0 FILES CLOSED FOR INCOMPLETENESS 0 $0 0 $0 0 $0
Aggregated Statistics For Year 2006(Based on 4 full and 2 partial tracts) A) Conventional B) Refinancings Number Average Value Number Average Value
LOANS ORIGINATED 19 $239,883 2 $604,500 APPLICATIONS APPROVED, NOT ACCEPTED 3 $336,360 0 $0 APPLICATIONS DENIED 0 $0 0 $0 APPLICATIONS WITHDRAWN 2 $382,095 0 $0 FILES CLOSED FOR INCOMPLETENESS 1 $308,000 0 $0
Aggregated Statistics For Year 2005(Based on 4 full and 2 partial tracts) A) Conventional B) Refinancings Number Average Value Number Average Value
LOANS ORIGINATED 22 $219,811 0 $0 APPLICATIONS APPROVED, NOT ACCEPTED 9 $281,684 0 $0 APPLICATIONS DENIED 2 $401,500 0 $0 APPLICATIONS WITHDRAWN 4 $303,750 1 $400,000 FILES CLOSED FOR INCOMPLETENESS 0 $0 0 $0
Aggregated Statistics For Year 2004(Based on 4 full and 2 partial tracts) A) Conventional B) Refinancings Number Average Value Number Average Value
LOANS ORIGINATED 40 $198,326 2 $390,500 APPLICATIONS APPROVED, NOT ACCEPTED 8 $202,996 1 $182,740 APPLICATIONS DENIED 1 $147,000 0 $0 APPLICATIONS WITHDRAWN 2 $220,800 1 $72,000 FILES CLOSED FOR INCOMPLETENESS 1 $80,000 0 $0
Aggregated Statistics For Year 2003(Based on 4 full and 2 partial tracts) A) Conventional B) Refinancings Number Average Value Number Average Value
LOANS ORIGINATED 41 $194,475 7 $178,279 APPLICATIONS APPROVED, NOT ACCEPTED 16 $304,196 7 $239,853 APPLICATIONS DENIED 2 $378,115 0 $0 APPLICATIONS WITHDRAWN 4 $279,000 1 $392,880 FILES CLOSED FOR INCOMPLETENESS 1 $306,000 0 $0
Aggregated Statistics For Year 2002(Based on 4 full and 2 partial tracts) A) Conventional B) Refinancings C) Non-occupant Loans on Number Average Value Number Average Value Number Average Value
LOANS ORIGINATED 51 $173,231 5 $264,530 1 $464,000 APPLICATIONS APPROVED, NOT ACCEPTED 17 $229,524 2 $309,430 0 $0 APPLICATIONS DENIED 2 $166,000 0 $0 0 $0 APPLICATIONS WITHDRAWN 2 $216,585 3 $183,000 0 $0 FILES CLOSED FOR INCOMPLETENESS 2 $443,375 0 $0 0 $0
Aggregated Statistics For Year 2001(Based on 4 full and 2 partial tracts) A) Conventional B) Refinancings Number Average Value Number Average Value
LOANS ORIGINATED 37 $179,649 4 $260,000 APPLICATIONS APPROVED, NOT ACCEPTED 9 $232,760 4 $271,250 APPLICATIONS DENIED 3 $259,000 0 $0 APPLICATIONS WITHDRAWN 0 $0 1 $327,000 FILES CLOSED FOR INCOMPLETENESS 1 $131,000 0 $0
Aggregated Statistics For Year 2000(Based on 4 full and 2 partial tracts) A) Conventional B) Refinancings C) Non-occupant Loans on Number Average Value Number Average Value Number Average Value
LOANS ORIGINATED 42 $184,090 5 $275,842 1 $240,000 APPLICATIONS APPROVED, NOT ACCEPTED 14 $203,323 1 $98,200 1 $369,000 APPLICATIONS DENIED 1 $207,000 0 $0 0 $0 APPLICATIONS WITHDRAWN 3 $217,333 0 $0 0 $0 FILES CLOSED FOR INCOMPLETENESS 0 $0 1 $370,000 0 $0
Aggregated Statistics For Year 1999(Based on 3 full and 2 partial tracts) A) Conventional B) Refinancings Number Average Value Number Average Value
LOANS ORIGINATED 65 $167,414 10 $172,145 APPLICATIONS APPROVED, NOT ACCEPTED 8 $167,448 3 $266,370 APPLICATIONS DENIED 11 $168,490 1 $370,000 APPLICATIONS WITHDRAWN 3 $181,263 0 $0 FILES CLOSED FOR INCOMPLETENESS 0 $0 1 $288,000
Detailed PMIC statistics for the following Tracts:
0070.00
, 0071.00 , 0072.00 , 0073.00 , 0074.01 , 0074.02 Mamaroneck compared to New York state average:
Median house value above state average. Unemployed percentage significantly below state average. Black race population percentage significantly below state average. Length of stay since moving in significantly above state average. Percentage of population with a bachelor's degree or higher above state average. Mamaroneck on our top lists :
#52 on the list of "Top 101 cities with the most residents born in Italy (population 500+)"
#69 on the list of "Top 101 cities with the most residents born in Other Southern Europe (population 500+)"
#10 on the list of "Top 101 counties with the lowest percentage of residents that keep firearms around their homes"
#18 on the list of "Top 101 counties with the most Catholic congregations"
#19 on the list of "Top 101 counties with the most Catholic adherents"
#25 on the list of "Top 101 counties with the most Orthodox congregations"
#27 on the list of "Top 101 counties with the highest percentage of residents that visited a dentist within the past year"
Top Patent Applicants
Jean-Thierry Simonnet (36)
Jennifer Dogin (15)
Gregory Lyon (13)
Seth L. Neubardt (12)
Leslie S. Prichep (11)
Robert A. Sonneman (10)
Charles A. Reisman (9)
Erwin R. John (9)
Chris I. Rill (8)
Sudheer A. Grandhi (8)
Total of 306 patent applications in 2008-2024.
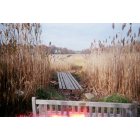

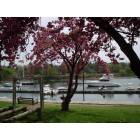
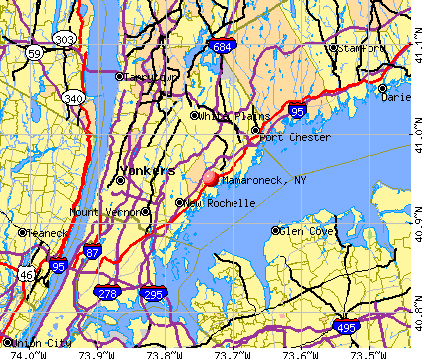


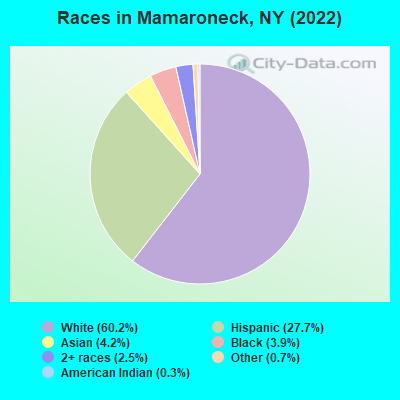
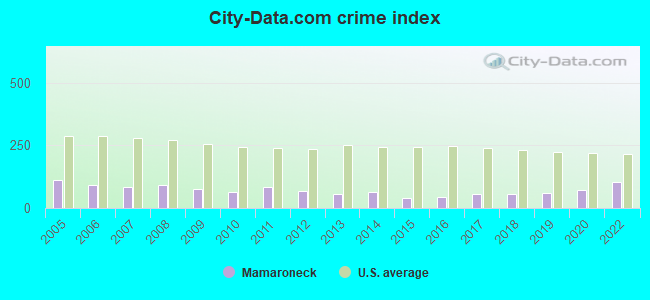
 Recent articles from our blog. Our writers, many of them Ph.D. graduates or candidates, create easy-to-read articles on a wide variety of topics.

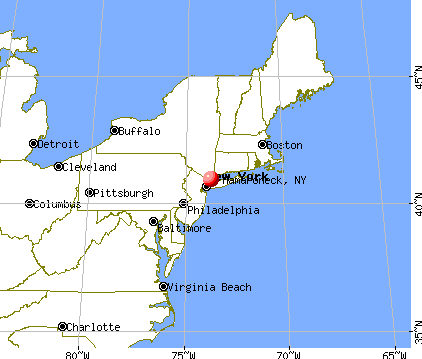
 (3.0 miles