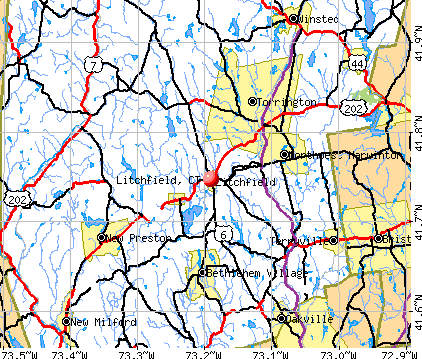
Litchfield, Connecticut
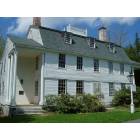
Litchfield: LITCHFIELD, CT - TALLMADGE HOUSE 1775
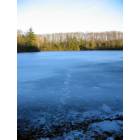
Litchfield: A frozen lake.
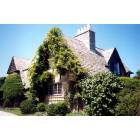
Litchfield: Topsmead State Forest, summer estate of Miss Edith Morton Chase, 1972 she left her beloved country estate to the people of Connecticut
- add
your
Submit your own pictures of this borough and show them to the world
- OSM Map
- General Map
- Google Map
- MSN Map
Population change since 2000: -9.3%
 |
| Males: 592 | |
| Females: 613 |
| Median resident age: | 45.4 years |
| Connecticut median age: | 40.9 years |
Zip codes: 06759.
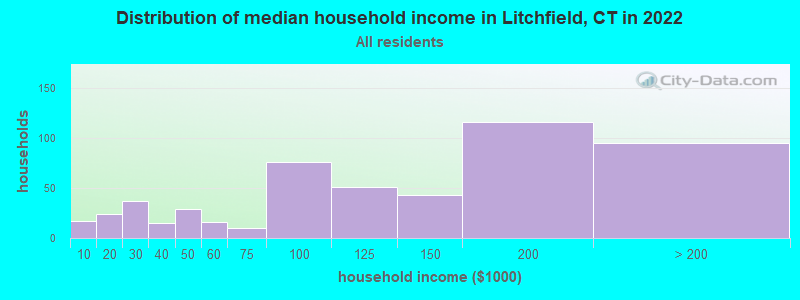
| Litchfield: | $118,946 |
| CT: | $88,429 |
Estimated per capita income in 2022: $67,187 (it was $38,789 in 2000)
Litchfield borough income, earnings, and wages data
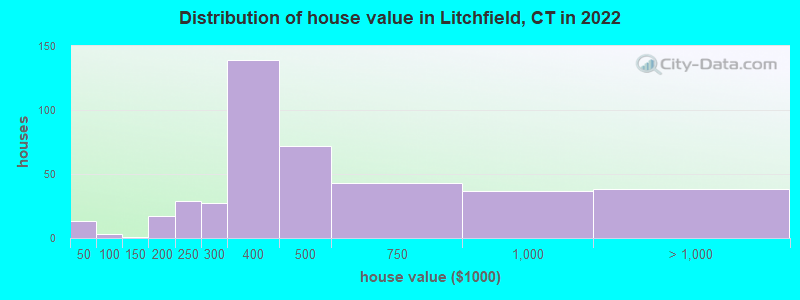
Estimated median house or condo value in 2022: $407,802 (it was $199,300 in 2000)
| Litchfield: | $407,802 |
| CT: | $347,200 |
Mean prices in 2022: all housing units: $429,743; detached houses: $455,293; townhouses or other attached units: $232,674; in 2-unit structures: $242,050; in 3-to-4-unit structures: $229,634; in 5-or-more-unit structures: $182,162; mobile homes: $243,504; occupied boats, rvs, vans, etc.: $127,144
Median gross rent in 2022: $1,098.
(7.6% for White Non-Hispanic residents, 2.8% for two or more races residents)
Detailed information about poverty and poor residents in Litchfield, CT

Compare current foreclosures near Litchfield, CT:
| Photo | Address | Area | Beds / Baths | Price | Details |
|---|---|---|---|---|---|

|
#1
S Lake St # A
Litchfield, CT 06759
|
3,962 sq. feet
|
3 baths 7 beds |
show details | |

|
#2
Hart Dr
Litchfield, CT 06759
|
936 sq. feet
|
1 baths 2 beds |
show details | |

|
#3
Norfolk Rd
Litchfield, CT 06759
|
- sq. feet
|
- baths - beds |
show details | |

|
#4
Wieting Rd
New Milford, CT 06776
|
3,210 sq. feet
|
3 baths 5 beds |
$549,900
|
show details |

|
#5
Allen St
Bristol, CT 06010
|
1,092 sq. feet
|
1 baths 3 beds |
$215,000
|
show details |

|
#6
Dowd Ave
Canton, CT 06019
|
1,190 sq. feet
|
1 baths 2 beds |
$239,900
|
show details |

|
#7
Clinton Hill Rd
Wolcott, CT 06716
|
1,828 sq. feet
|
1 baths 3 beds |
$240,000
|
show details |

|
#8
Litchfield Rd
Norfolk, CT 06058
|
3,678 sq. feet
|
3 baths 6 beds |
$650,000
|
show details |

|
#9
Janwood Rd
Waterbury, CT 06708
|
1,200 sq. feet
|
2 baths 3 beds |
$275,000
|
show details |

|
#10
Woodbine St
Torrington, CT 06790
|
2,756 sq. feet
|
3 baths 6 beds |
$419,900
|
show details |
| Photo | Address | Area | Beds / Baths | Price | Details |
|---|---|---|---|---|---|

|
#11
Great Hill Rd
Litchfield, CT 06759
|
- sq. feet
|
- baths - beds |
show details | |

|
#12
Clairmont Ave
Waterbury, CT 06708
|
1,564 sq. feet
|
2 baths 4 beds |
show details | |

|
#13
Rena Ln
Waterbury, CT 06705
|
1,080 sq. feet
|
1 baths 3 beds |
show details | |

|
#14
Carter Rd
Plymouth, CT 06782
|
2,192 sq. feet
|
2 baths 3 beds |
show details | |

|
#15
White Pine Rd
Torrington, CT 06790
|
1,536 sq. feet
|
2 baths 3 beds |
show details | |

|
#16
Sylvan Ave
Terryville, CT 06786
|
1,691 sq. feet
|
1 baths 4 beds |
show details | |

|
#17
Flanders Rd
Woodbury, CT 06798
|
2,424 sq. feet
|
2 baths 4 beds |
show details | |

|
#18
Surrey Dr
Bristol, CT 06010
|
1,079 sq. feet
|
1 baths 3 beds |
show details | |

|
#19
Farmington Chase Cre
Farmington, CT 06032
|
1,317 sq. feet
|
1 baths 2 beds |
show details | |

|
#20
Doran St
Waterbury, CT 06704
|
1,036 sq. feet
|
1 baths 3 beds |
show details |
| Photo | Address | Area | Beds / Baths | Price | Details |
|---|---|---|---|---|---|

|
#21
Benton St
Winsted, CT 06098
|
1,109 sq. feet
|
2 baths 2 beds |
show details | |

|
#22
Calumet St
Waterbury, CT 06710
|
2,175 sq. feet
|
2 baths 4 beds |
show details | |

|
#23
Vanderbilt Rd
Bristol, CT 06010
|
1,803 sq. feet
|
1 baths 5 beds |
show details | |

|
#24
Fairfield Ave
Waterbury, CT 06708
|
1,538 sq. feet
|
1 baths 2 beds |
show details | |

|
#25
E Hill Rd Apt 4d
Canton, CT 06019
|
1,116 sq. feet
|
2 baths 2 beds |
show details | |

|
#26
Lockhart Ave
Waterbury, CT 06705
|
- sq. feet
|
2 baths 3 beds |
show details | |

|
#27
Bch St
Goshen, CT 06756
|
1,380 sq. feet
|
1 baths 4 beds |
show details | |

|
#28
Barbara Dr
Waterbury, CT 06705
|
1,248 sq. feet
|
2 baths 3 beds |
show details | |

|
#29
Horne Cir
Southington, CT 06489
|
1,902 sq. feet
|
2 baths 4 beds |
show details | |

|
#30
Litchfield Rd
Harwinton, CT 06791
|
2,216 sq. feet
|
1 baths 3 beds |
show details |
| Photo | Address | Area | Beds / Baths | Price | Details |
|---|---|---|---|---|---|

|
#31
Sylvan Ave
Waterbury, CT 06706
|
1,350 sq. feet
|
1 baths 4 beds |
show details | |

|
#32
Marcia Dr
Torrington, CT 06790
|
1,496 sq. feet
|
2 baths 4 beds |
show details | |

|
#33
Wilson Rd
Wolcott, CT 06716
|
1,116 sq. feet
|
1 baths 3 beds |
show details | |

|
#34
Cody Ave
Plainville, CT 06062
|
1,428 sq. feet
|
2 baths 3 beds |
show details | |

|
#35
Main St Apt 9c
New Hartford, CT 06057
|
1,136 sq. feet
|
1 baths 2 beds |
show details | |

|
#36
Sorrel Rd
Waterbury, CT 06704
|
1,510 sq. feet
|
1 baths 4 beds |
show details | |

|
#37
Robinwood Rd
Waterbury, CT 06708
|
988 sq. feet
|
1 baths 2 beds |
show details | |

|
#38
Carmel St
Waterbury, CT 06704
|
1,533 sq. feet
|
2 baths 3 beds |
show details | |

|
#39
Knollwood Rd
Farmington, CT 06032
|
1,224 sq. feet
|
1 baths 3 beds |
show details | |

|
#40
N Beacon St
Waterbury, CT 06704
|
1,603 sq. feet
|
2 baths 3 beds |
show details |
| Photo | Address | Area | Beds / Baths | Price | Details |
|---|---|---|---|---|---|

|
#41
Courtland Ave
Waterbury, CT 06705
|
1,020 sq. feet
|
1 baths 3 beds |
show details | |

|
#42
Joy Rd
Waterbury, CT 06708
|
1,650 sq. feet
|
1 baths 4 beds |
show details | |

|
#43
Highland Ave Unit 33a
Waterbury, CT 06708
|
1,480 sq. feet
|
1 baths 2 beds |
show details | |

|
#44
Orenaug Ave
Woodbury, CT 06798
|
2,058 sq. feet
|
1 baths 3 beds |
show details | |

|
#45
Fern Cir
Waterbury, CT 06708
|
2,280 sq. feet
|
2 baths 3 beds |
show details | |

|
#46
Lakewood Rd
Waterbury, CT 06704
|
1,948 sq. feet
|
2 baths 3 beds |
show details | |

|
#47
Fairview Ave
Bristol, CT 06010
|
1,114 sq. feet
|
1 baths 3 beds |
show details | |

|
#48
Porter Rd
Wolcott, CT 06716
|
2,243 sq. feet
|
2 baths 2 beds |
show details | |

|
#49
Summer St
Waterbury, CT 06704
|
2,762 sq. feet
|
3 baths 6 beds |
show details | |

|
Check over 1 million property listings on Foreclosure.com!
|
browse all offers | |||


- 97171.4%White alone
- 1289.4%Two or more races
- 1017.4%Asian alone
- 755.5%Hispanic
- 624.6%Other race alone
- 382.8%Black alone
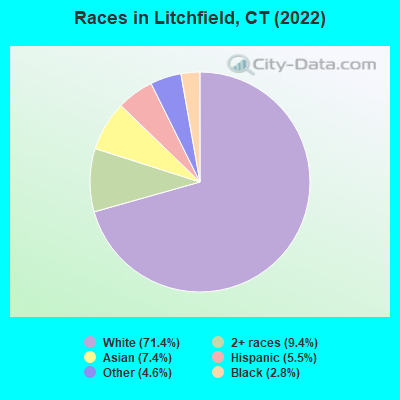
Races in Litchfield detailed stats: ancestries, foreign born residents, place of birth
According to our research of Connecticut and other state lists, there were 2 registered sex offenders living in Litchfield, Connecticut as of May 23, 2024.
The ratio of all residents to sex offenders in Litchfield is 662 to 1.
The ratio of registered sex offenders to all residents in this city is near the state average.
 Recent articles from our blog. Our writers, many of them Ph.D. graduates or candidates, create easy-to-read articles on a wide variety of topics.

 | 2024 Connecticut Town Tournament VI (Celebrating the 10-Year Anniversary & Dazzleman's Memorial) (1007 replies) |
| Major Art Publication Names Litchfield County Center of Contemporary Art (3 replies) |
| Connecticut TOWN TOURNAMENT V (2022) (831 replies) |
| Is Norwich Commutable to NYC? (100 replies) |
| CT nightlife sucks. (105 replies) |
| Litchfield County or Berkshires Mid Oct Trip? (16 replies) |
Latest news from Litchfield, CT collected exclusively by city-data.com from local newspapers, TV, and radio stations
Litchfield, CT City Guides:
Ancestries: American (11.5%), Irish (11.1%), Italian (10.5%), European (10.3%), English (8.1%), British (5.6%).
Current Local Time: EST time zone
Incorporated on 05/1719
Elevation: 1086 feet
Land area: 1.39 square miles.
Population density: 865 people per square mile (low).
124 residents are foreign born (6.1% Asia, 1.6% Europe, 1.0% Latin America).
| This borough: | 9.1% |
| Connecticut: | 15.0% |
Median real estate property taxes paid for housing units with mortgages in 2022: $5,809 (1.5%)
Median real estate property taxes paid for housing units with no mortgage in 2022: $5,638 (1.3%)
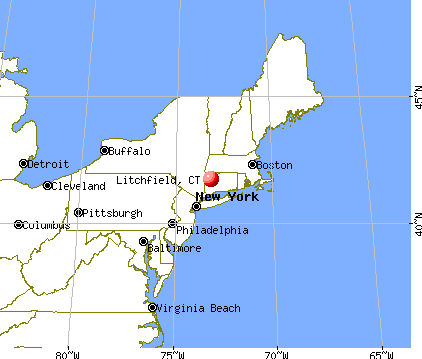
Nearest city with pop. 50,000+: Bristol, CT  (14.0 miles , pop. 60,062).
Nearest city with pop. 200,000+: North Hempstead, NY (71.5 miles , pop. 222,611).
Nearest city with pop. 1,000,000+: Bronx, NY (71.7 miles , pop. 1,332,650).
Nearest cities:
), ), ), ), Latitude: 41.75 N, Longitude: 73.19 W
Area code: 860

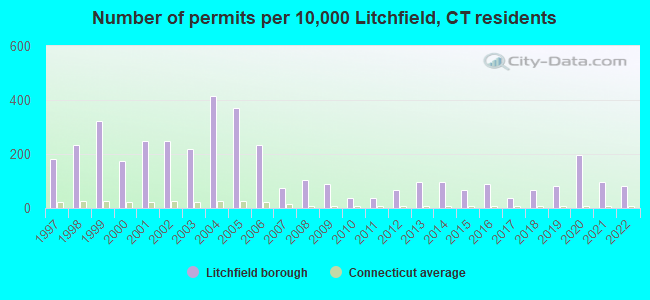
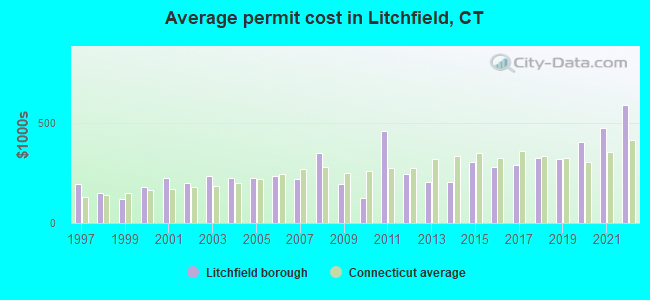
Single-family new house construction building permits:
- 2022: 11 buildings, average cost: $588,600
- 2021: 13 buildings, average cost: $475,000
- 2020: 26 buildings, average cost: $406,300
- 2019: 11 buildings, average cost: $321,300
- 2018: 9 buildings, average cost: $323,900
- 2017: 5 buildings, average cost: $291,400
- 2016: 12 buildings, average cost: $279,500
- 2015: 9 buildings, average cost: $303,500
- 2014: 13 buildings, average cost: $205,900
- 2013: 13 buildings, average cost: $205,500
- 2012: 9 buildings, average cost: $241,700
- 2011: 5 buildings, average cost: $459,000
- 2010: 5 buildings, average cost: $127,400
- 2009: 12 buildings, average cost: $193,800
- 2008: 14 buildings, average cost: $350,600
- 2007: 10 buildings, average cost: $219,600
- 2006: 31 buildings, average cost: $236,100
- 2005: 49 buildings, average cost: $225,600
- 2004: 55 buildings, average cost: $225,600
- 2003: 29 buildings, average cost: $231,800
- 2002: 33 buildings, average cost: $201,100
- 2001: 33 buildings, average cost: $222,700
- 2000: 23 buildings, average cost: $177,700
- 1999: 43 buildings, average cost: $121,000
- 1998: 31 buildings, average cost: $147,600
- 1997: 24 buildings, average cost: $194,900
| Here: | 3.6% |
| Connecticut: | 3.9% |
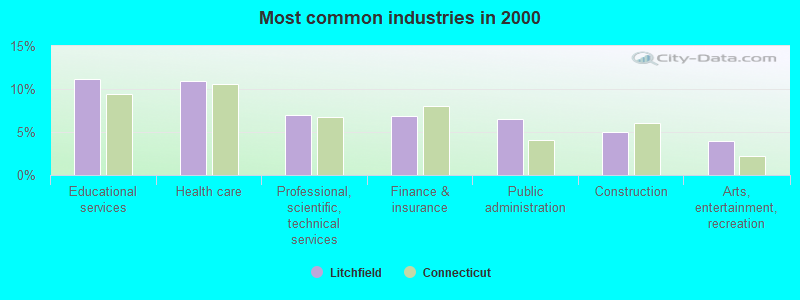
- Educational services (11.1%)
- Health care (11.0%)
- Professional, scientific, technical services (7.0%)
- Finance & insurance (6.8%)
- Public administration (6.5%)
- Construction (5.0%)
- Arts, entertainment, recreation (4.0%)
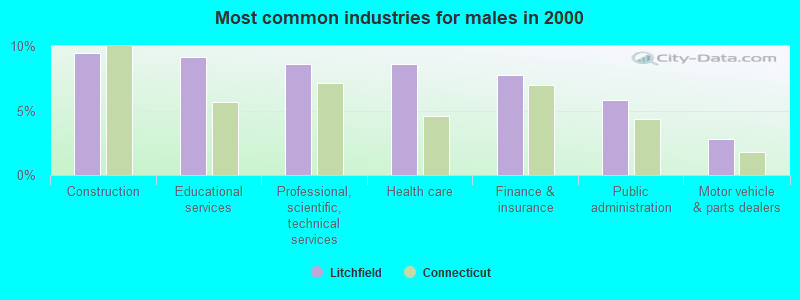
- Construction (9.4%)
- Educational services (9.2%)
- Professional, scientific, technical services (8.6%)
- Health care (8.6%)
- Finance & insurance (7.8%)
- Public administration (5.8%)
- Motor vehicle & parts dealers (2.8%)
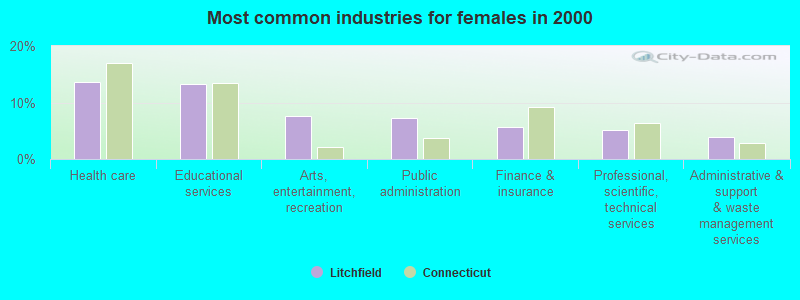
- Health care (13.7%)
- Educational services (13.3%)
- Arts, entertainment, recreation (7.6%)
- Public administration (7.3%)
- Finance & insurance (5.7%)
- Professional, scientific, technical services (5.1%)
- Administrative & support & waste management services (3.8%)
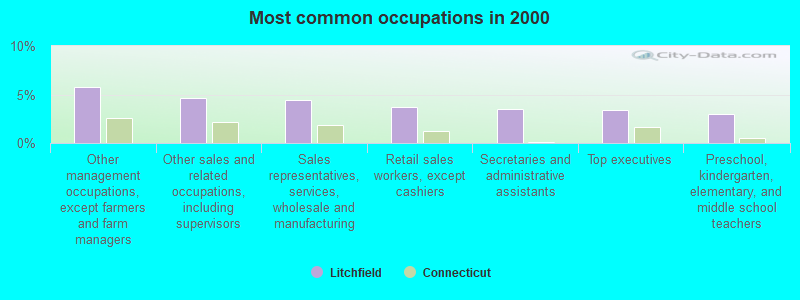
- Other management occupations, except farmers and farm managers (5.8%)
- Other sales and related occupations, including supervisors (4.6%)
- Sales representatives, services, wholesale and manufacturing (4.4%)
- Retail sales workers, except cashiers (3.7%)
- Secretaries and administrative assistants (3.6%)
- Top executives (3.4%)
- Preschool, kindergarten, elementary, and middle school teachers (3.0%)
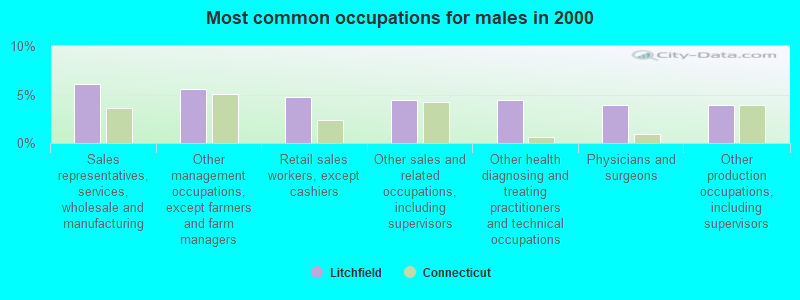
- Sales representatives, services, wholesale and manufacturing (6.1%)
- Other management occupations, except farmers and farm managers (5.6%)
- Retail sales workers, except cashiers (4.7%)
- Other sales and related occupations, including supervisors (4.4%)
- Other health diagnosing and treating practitioners and technical occupations (4.4%)
- Physicians and surgeons (3.9%)
- Other production occupations, including supervisors (3.9%)
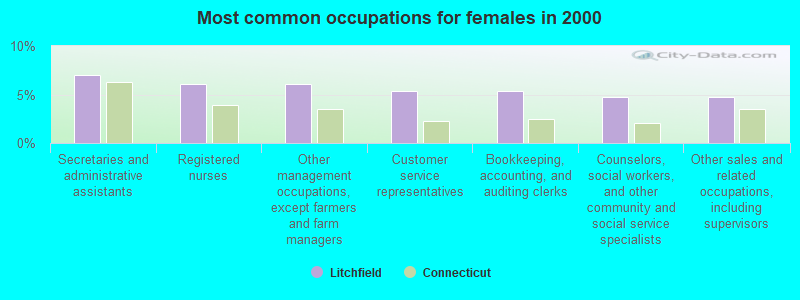
- Secretaries and administrative assistants (7.0%)
- Registered nurses (6.0%)
- Other management occupations, except farmers and farm managers (6.0%)
- Customer service representatives (5.4%)
- Bookkeeping, accounting, and auditing clerks (5.4%)
- Counselors, social workers, and other community and social service specialists (4.8%)
- Other sales and related occupations, including supervisors (4.8%)
Average climate in Litchfield, Connecticut
Based on data reported by over 4,000 weather stations


(lower is better)
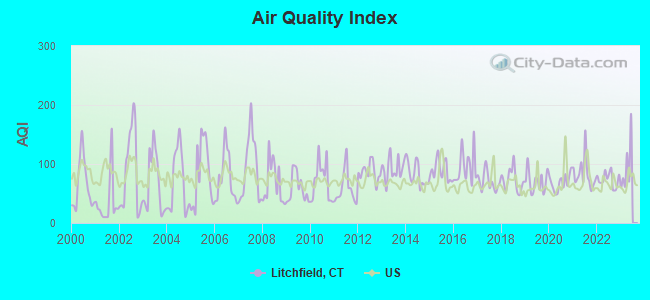
Air Quality Index (AQI) level in 2022 was 73.5. This is about average.
| City: | 73.5 |
| U.S.: | 72.6 |
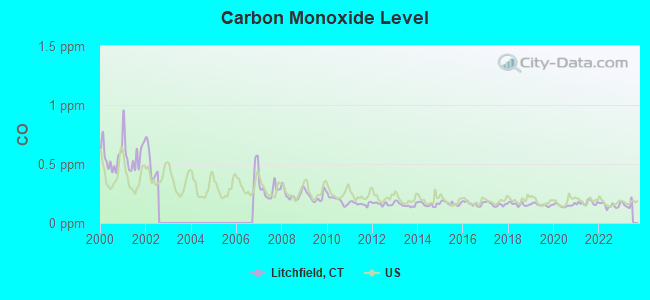
Carbon Monoxide (CO) [ppm] level in 2022 was 0.149. This is significantly better than average. Closest monitor was 7.5 miles away from the city center.
| City: | 0.149 |
| U.S.: | 0.251 |
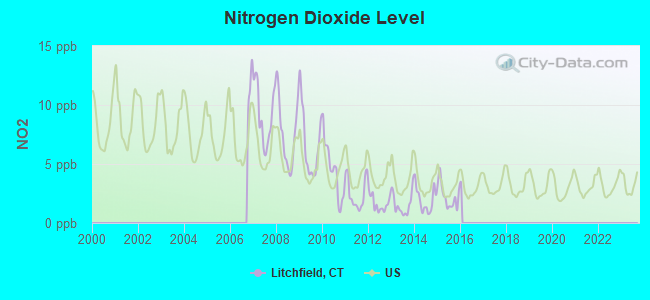
Nitrogen Dioxide (NO2) [ppb] level in 2015 was 2.27. This is significantly better than average. Closest monitor was 0.1 miles away from the city center.
| City: | 2.27 |
| U.S.: | 5.11 |
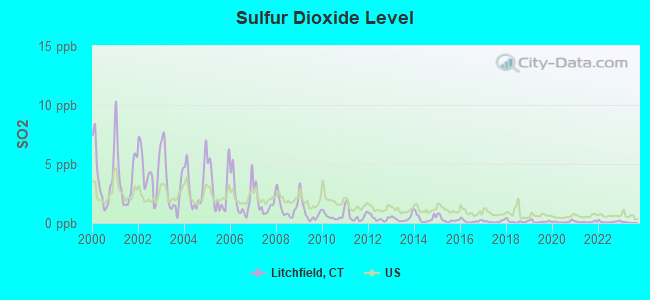
Sulfur Dioxide (SO2) [ppb] level in 2022 was 0.109. This is significantly better than average. Closest monitor was 0.1 miles away from the city center.
| City: | 0.109 |
| U.S.: | 1.515 |
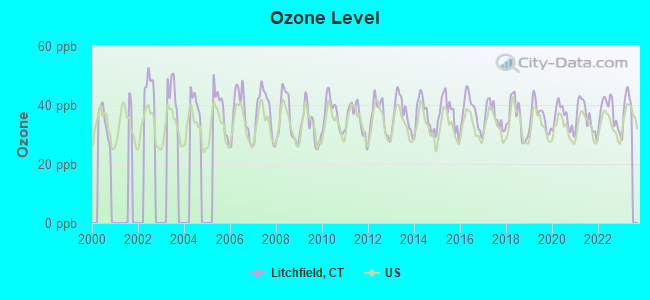
Ozone [ppb] level in 2022 was 37.6. This is about average. Closest monitor was 5.3 miles away from the city center.
| City: | 37.6 |
| U.S.: | 33.3 |
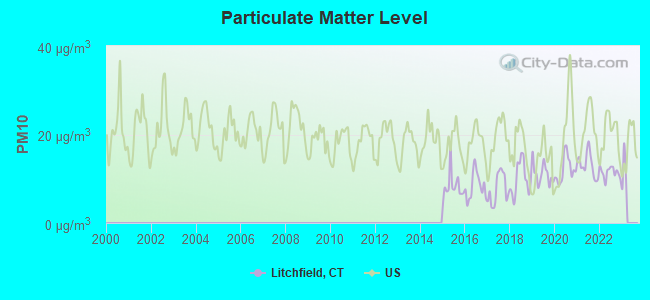
Particulate Matter (PM10) [µg/m3] level in 2022 was 11.4. This is significantly better than average. Closest monitor was 5.3 miles away from the city center.
| City: | 11.4 |
| U.S.: | 19.2 |
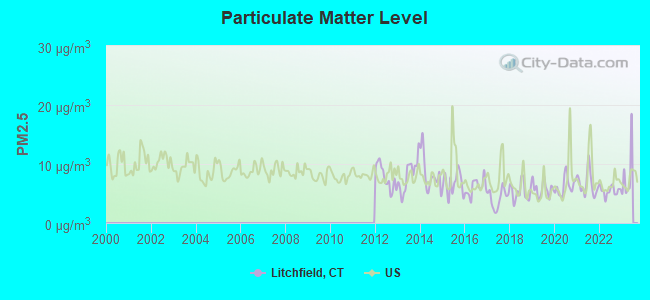
Particulate Matter (PM2.5) [µg/m3] level in 2022 was 5.45. This is significantly better than average. Closest monitor was 7.5 miles away from the city center.
| City: | 5.45 |
| U.S.: | 8.11 |
Tornado activity:
Litchfield-area historical tornado activity is slightly above Connecticut state average. It is 19% smaller than the overall U.S. average.
On 10/3/1979, a category F4 (max. wind speeds 207-260 mph) tornado 28.4 miles away from the Litchfield borough center killed 3 people and injured 500 people and caused between $50,000,000 and $500,000,000 in damages.
On 5/29/1995, a category F4 tornado 29.3 miles away from the borough center killed 3 people and injured 24 people and caused between $5,000,000 and $50,000,000 in damages.
Earthquake activity:
Litchfield-area historical earthquake activity is significantly above Connecticut state average. It is 69% smaller than the overall U.S. average.On 10/7/1983 at 10:18:46, a magnitude 5.3 (5.1 MB, 5.3 LG, 5.1 ML, Class: Moderate, Intensity: VI - VII) earthquake occurred 163.4 miles away from the city center
On 4/20/2002 at 10:50:47, a magnitude 5.3 (5.3 ML, Depth: 3.0 mi) earthquake occurred 193.0 miles away from the city center
On 4/20/2002 at 10:50:47, a magnitude 5.2 (5.2 MB, 4.2 MS, 5.2 MW, 5.0 MW) earthquake occurred 191.4 miles away from the city center
On 1/19/1982 at 00:14:42, a magnitude 4.7 (4.5 MB, 4.7 MD, 4.5 LG, Class: Light, Intensity: IV - V) earthquake occurred 145.8 miles away from Litchfield center
On 8/23/2011 at 17:51:04, a magnitude 5.8 (5.8 MW, Depth: 3.7 mi) earthquake occurred 365.9 miles away from Litchfield center
On 10/16/2012 at 23:12:25, a magnitude 4.7 (4.7 ML, Depth: 10.0 mi) earthquake occurred 181.6 miles away from the city center
Magnitude types: regional Lg-wave magnitude (LG), body-wave magnitude (MB), duration magnitude (MD), local magnitude (ML), surface-wave magnitude (MS), moment magnitude (MW)
Natural disasters:
The number of natural disasters in Litchfield County (23) is greater than the US average (15).Major Disasters (Presidential) Declared: 13
Emergencies Declared: 10
Causes of natural disasters: Storms: 7, Hurricanes: 5, Floods: 4, Snowstorms: 4, Blizzards: 3, Snows: 2, Tropical Storms: 2, Winter Storms: 2, Snowfall: 1, Tornado: 1, Wind: 1 (Note: some incidents may be assigned to more than one category).

Main business address for: FIRST LITCHFIELD FINANCIAL CORP (NATIONAL COMMERCIAL BANKS).
Hospitals and medical centers in Litchfield:
Colleges/universities with over 2000 students nearest to Litchfield:
- Naugatuck Valley Community College (about 15 miles; Waterbury, CT; Full-time enrollment: 4,491)
- University of Connecticut-Tri-Campus (about 16 miles; Waterbury, CT; FT enrollment: 2,250)
- Post University (about 16 miles; Waterbury, CT; FT enrollment: 5,808)
- Tunxis Community College (about 17 miles; Farmington, CT; FT enrollment: 2,787)
- Central Connecticut State University (about 23 miles; New Britain, CT; FT enrollment: 9,989)
- University of Hartford (about 25 miles; West Hartford, CT; FT enrollment: 6,398)
- Trinity College (about 26 miles; Hartford, CT; FT enrollment: 2,355)
Public high schools in Litchfield:
- LITCHFIELD HIGH SCHOOL (Students: 564, Location: 14 PLUMB HILL RD, Grades: 7-12)
- WAMOGO REGIONAL HIGH SCHOOL (Students: 506, Location: 98 WAMOGO ROAD, Grades: 7-12)
- EDUCATION CONNECTION SPECIAL EDUCATION (Students: 29, Location: 355 GOSHEN ROAD, Grades: PK-12)
Private high schools in Litchfield:
- THE FORMAN SCHOOL (Students: 164, Location: 12 NORFOLK RD, Grades: 9-12)
- TOUCHSTONE SCHOOL (Students: 15, Location: 11 COUNTRY PLACE, Grades: 9-11, Girls only)
Public elementary/middle schools in Litchfield:
- LITCHFIELD INTERMEDIATE SCHOOL (Students: 310, Location: 35 PLUMB HILL RD, Grades: 4-6)
- CENTER SCHOOL (Location: 125 WEST STREET BOX 110, Grades: PK-3)
Points of interest:
Notable locations in Litchfield: Oliver Wolcott Library (A), Noyes Memorial Building (B), Litchfield Town Hall (C), Litchfield Historical Society Museum (D), Litchfield Historical Society Building (E), Litchfield County Jail (F), Litchfield County Courthouse (G), H J Ingraham Memorial Research Library (H), Litchfield Volunteer Ambulance Association (I). Display/hide their locations on the map
Main business address in Litchfield: FIRST LITCHFIELD FINANCIAL CORP (A). Display/hide its location on the map
Church in Litchfield: Litchfield United Methodist Church (A). Display/hide its location on the map
Cemetery: East Cemetery (1). Display/hide its location on the map
River: West Branch Bantam River (A). Display/hide its location on the map
Parks in Litchfield include: Litchfield Green (1), Litchfield Historic District (2). Display/hide their locations on the map
Tourist attractions: Litchfield Historical Society (Museums; 7 South Street), Expo Garden Tours (Cultural Attractions- Events- & Facilities; 33 Fox Crossing Lane), Livingston Ripley Waterfowl Sanctuary-Barn (Cultural Attractions- Events- & Facilities; 55 Duck Pond Road), Connecticut State Of (Cultural Attractions- Events- & Facilities; State Law Library), White Memorial Foundation and Conservation Center (Nature Centers; 80 Whitehall Road).
Hotels: Tollgate Hill Inn (571 Torrington Rd), The Litchfield Inn (432 Bantam Road).
Courts: Judicial Branch - Prosecutor-Community Court- Litchfield Judicial District- Chief Clerk's Of (15 West Street), Litchfield County State's Attorney (West Street), Judicial Branch - Prosecutor-Community Court- Litchfield Judicial District- Public Defe (63 West Street), Connecticut State - Judicial Branch- Superior Court Housing- Ga 18- Housing Ses (80 Doyle Road).
Birthplace of: Henry Ward Beecher - Abolitionist, Abraham Bradley, Jr. - Assistant Postmaster General, Ethan Allen - (1738-1789), patriot leader, Harriet Beecher Stowe - (1811-1896), author, Isabella Beecher Hooker - Activist, John Pierpont - Poet, Oliver Wolcott, Jr. - Federal judge, Chuck Aleksinas - Basketball player, Horatio Seymour (Vermont) - Politician, Jack Jones (baseball) - Baseball player.
Drinking water stations with addresses in Litchfield and their reported violations in the past:
FERNWOOD REST HOME (Population served: 107, Groundwater):Past monitoring violations:TOUCHSTONE N.A.F.I. (Population served: 43, Groundwater):
- One minor monitoring violation
- 3 regular monitoring violations
Past monitoring violations:
- 2 routine major monitoring violations
Drinking water stations with addresses in Litchfield that have no violations reported:
- WHITE MEMORIAL CONF. CTR & MUSEUM (Population served: 36, Primary Water Source Type: Groundwater)
- WISDOM HOUSE (Population served: 31, Primary Water Source Type: Groundwater)
- WHITE MEMORIAL CAMPGROUND (Population served: 25, Primary Water Source Type: Groundwater)
| This borough: | 2.2 people |
| Connecticut: | 2.5 people |
| This borough: | 60.0% |
| Whole state: | 66.3% |
| This borough: | 3.5% |
| Whole state: | 6.6% |
Likely homosexual households (counted as self-reported same-sex unmarried-partner households)
- Lesbian couples: 0.0% of all households
- Gay men: 0.7% of all households
14 people in nursing facilities/skilled-nursing facilities in 2010
37 people in nursing homes in 2000
6 people in religious group quarters in 2000
Banks with branches in Litchfield (2011 data):
- Litchfield Bancorp: at 294 West Street P.O. Box 997, branch established on 1850/01/01; Litchfield Messenger Serivce Branch at 294 West Street, branch established on 2005/02/07. Info updated 2008/11/26: Bank assets: $213.6 mil, Deposits: $155.6 mil, local headquarters, positive income, Mortgage Lending Specialization, 6 total offices, Holding Company: Connecticut Mutual Holding Company
- Webster Bank, National Association: Litchfield Branch at 311 West Street, branch established on 1919/01/01. Info updated 2008/12/23: Bank assets: $18,674.3 mil, Deposits: $13,861.5 mil, headquarters in Waterbury, CT, positive income, Commercial Lending Specialization, 167 total offices, Holding Company: Webster Financial Corporation
- Union Savings Bank: First National Bank Of Litchfield Br at North Street, branch established on 1814/01/01. Info updated 2011/11/30: Bank assets: $2,496.5 mil, Deposits: $1,625.1 mil, headquarters in Danbury, CT, positive income, Mortgage Lending Specialization, 29 total offices
For population 15 years and over in Litchfield:
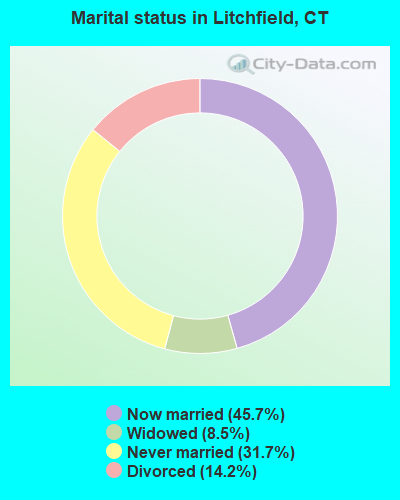
- Never married: 31.7%
- Now married: 45.7%
- Separated: 0.0%
- Widowed: 8.5%
- Divorced: 14.2%
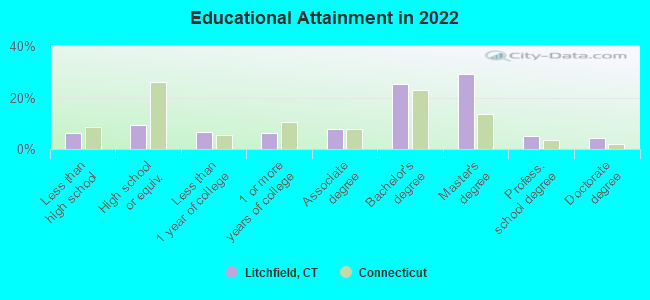
For population 25 years and over in Litchfield:
- High school or higher: 93.2%
- Bachelor's degree or higher: 62.9%
- Graduate or professional degree: 38.0%
- Unemployed: 0.3%
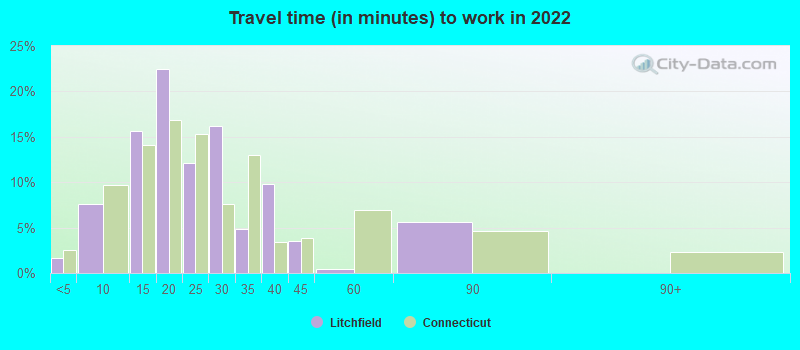
- Mean travel time to work (commute): 20.9 minutes
| Here: | 10.6 |
| Connecticut average: | 12.6 |
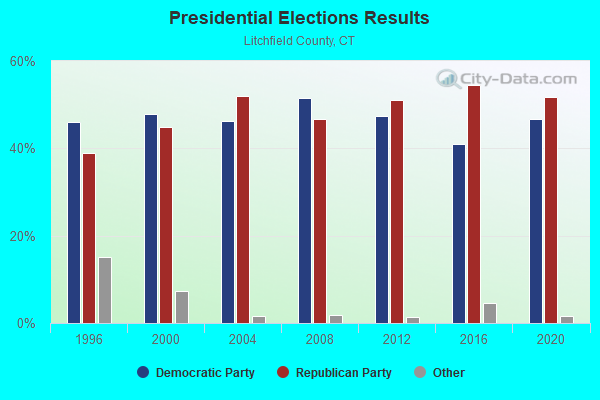
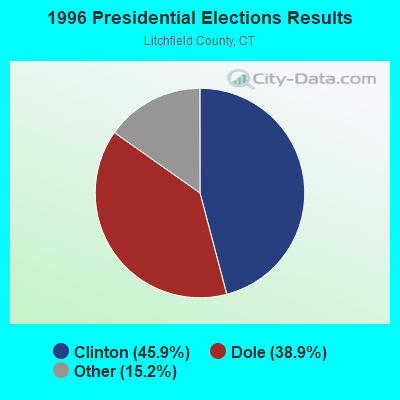
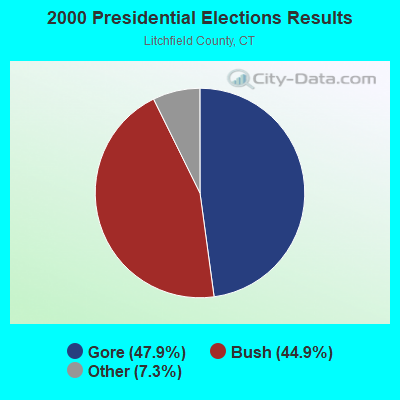
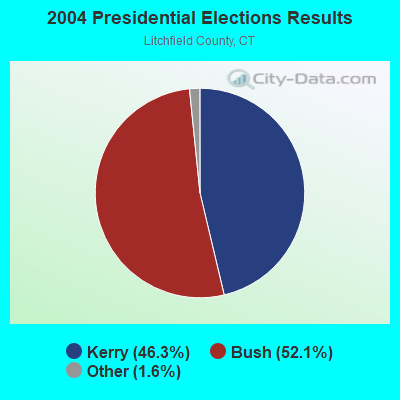
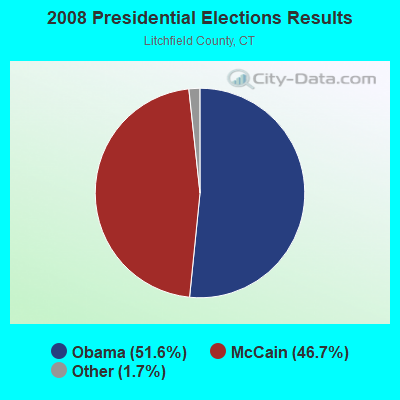
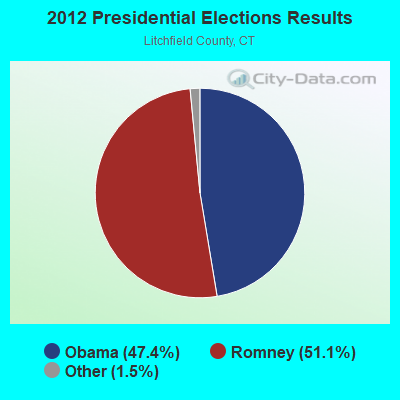
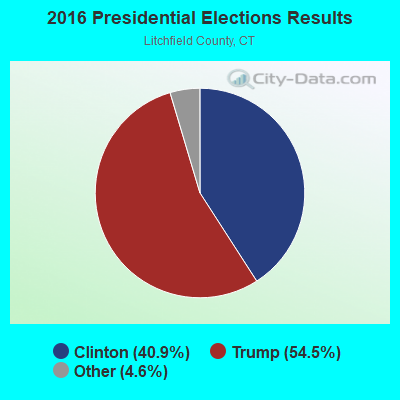
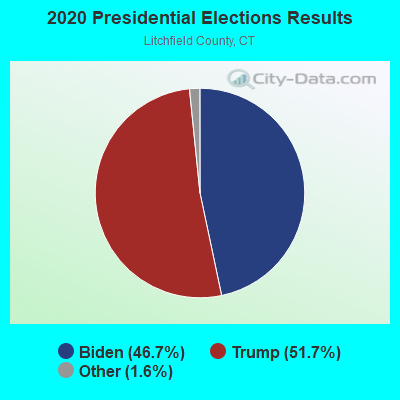
Graphs represent county-level data. Detailed 2008 Election Results
Religion statistics for Litchfield, CT (based on Litchfield County data)
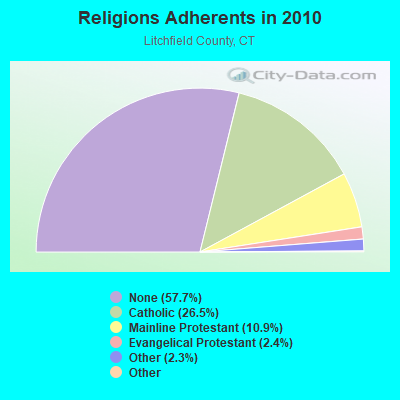
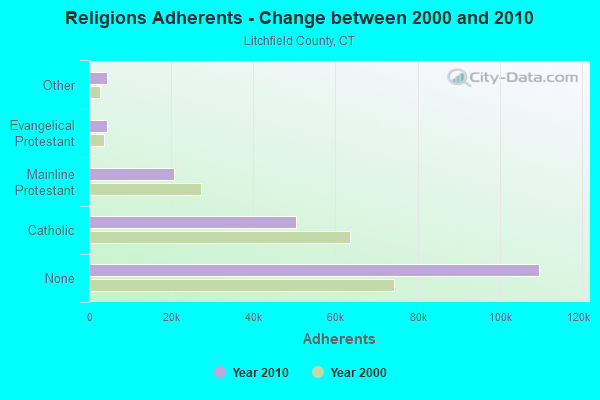
| Religion | Adherents | Congregations |
|---|---|---|
| Catholic | 50,354 | 30 |
| Mainline Protestant | 20,681 | 87 |
| Evangelical Protestant | 4,483 | 39 |
| Other | 4,420 | 16 |
| Orthodox | 175 | 2 |
| Black Protestant | 160 | 2 |
| None | 109,654 | - |
Food Environment Statistics:
| Litchfield County: | 2.29 / 10,000 pop. |
| Connecticut: | 2.21 / 10,000 pop. |
| This county: | 0.05 / 10,000 pop. |
| State: | 0.07 / 10,000 pop. |
| This county: | 0.64 / 10,000 pop. |
| Connecticut: | 1.02 / 10,000 pop. |
| This county: | 2.98 / 10,000 pop. |
| State: | 2.27 / 10,000 pop. |
| Here: | 11.07 / 10,000 pop. |
| Connecticut: | 9.19 / 10,000 pop. |
| Here: | 6.9% |
| Connecticut: | 7.3% |
| This county: | 21.1% |
| Connecticut: | 21.5% |
| This county: | 11.8% |
| State: | 15.8% |
Health and Nutrition:
| Litchfield: | 51.2% |
| Connecticut: | 50.0% |
| Litchfield: | 48.4% |
| Connecticut: | 47.5% |
| Litchfield: | 29.0 |
| Connecticut: | 28.7 |
| Litchfield: | 21.9% |
| Connecticut: | 20.9% |
| Litchfield: | 8.5% |
| State: | 10.5% |
| Litchfield: | 6.8 |
| State: | 6.8 |
| This city: | 38.7% |
| Connecticut: | 34.2% |
| Litchfield: | 56.8% |
| Connecticut: | 56.4% |
| Litchfield: | 76.7% |
| Connecticut: | 78.9% |
More about Health and Nutrition of Litchfield, CT Residents
| Local government employment and payroll (March 2017) | |||||
| Function | Full-time employees | Monthly full-time payroll | Average yearly full-time wage | Part-time employees | Monthly part-time payroll |
|---|---|---|---|---|---|
| Other and Unallocable | 0 | $0 | 0 | $0 | |
| Totals for Government | 0 | $0 | 0 | $0 | |
Litchfield government finances - Expenditure in 2017 (per resident):
- Current Operations - Financial Administration: $21,000 ($17.43)
Regular Highways: $14,000 ($11.62)
General - Other: $10,000 ($8.30)
Central Staff Services: $7,000 ($5.81)
- General - Interest on Debt: $54,000 ($44.81)
Litchfield government finances - Revenue in 2017 (per resident):
- Tax - Property: $277,000 ($229.88)
Litchfield government finances - Debt in 2017 (per resident):
- Long Term Debt - Beginning Outstanding - Unspecified Public Purpose: $1,344,000 ($1115.35)
Outstanding Unspecified Public Purpose: $1,160,000 ($962.66)
Retired Unspecified Public Purpose: $184,000 ($152.70)
Litchfield government finances - Cash and Securities in 2017 (per resident):
- Other Funds - Cash and Securities: $205,000 ($170.12)
| Businesses in Litchfield, CT | ||||
| Name | Count | Name | Count | |
|---|---|---|---|---|
| CVS | 1 | Stop & Shop | 1 | |
| Dunkin Donuts | 1 | Toyota | 1 | |
| FedEx | 2 | True Value | 1 | |
| Ford | 1 | UPS | 1 | |
| GNC | 1 | YMCA | 1 | |
| Rite Aid | 1 | |||
Strongest AM radio stations in Litchfield:
- WTIC (1080 AM; 50 kW; HARTFORD, CT; Owner: INFINITY RADIO OPERATIONS INC.)
- WNNZ (640 AM; 50 kW; WESTFIELD, MA; Owner: CLEAR CHANNEL BROADCASTING LICENSES, INC.)
- WSNG (610 AM; 1 kW; TORRINGTON, CT; Owner: BUCKLEY BROADCASTING CORPORATION OF)
- WFAN (660 AM; 50 kW; NEW YORK, NY; Owner: INFINITY BROADCASTING OPERATIONS, INC.)
- WLAT (910 AM; 5 kW; NEW BRITAIN, CT; Owner: MEGA COMMUNICATIONS OF NEW BRITAIN LICENSEE, LLC)
- WATR (1320 AM; 5 kW; WATERBURY, CT; Owner: WATR, INC.)
- WCBS (880 AM; 50 kW; NEW YORK, NY; Owner: INFINITY BROADCASTING OPERATIONS, INC.)
- WMCA (570 AM; 50 kW; NEW YORK, NY; Owner: SALEM MEDIA OF NEW YORK, LLC)
- WFNW (1380 AM; 5 kW; NAUGATUCK, CT; Owner: CANDIDO DIAS CARRELO)
- WABC (770 AM; 50 kW; NEW YORK, NY; Owner: WABC-AM RADIO, INC.)
- WCRN (830 AM; 50 kW; WORCESTER, MA; Owner: CARTER BROADCASTING CORPORATION)
- WOR (710 AM; 50 kW; NEW YORK, NY; Owner: BUCKLEY BROADCASTING CORPORATION)
- WGY (810 AM; 50 kW; SCHENECTADY, NY; Owner: CLEAR CHANNEL BROADCASTING LICENSES, INC.)
Strongest FM radio stations in Litchfield:
- WZBG (97.3 FM; LITCHFIELD, CT; Owner: LOCAL GIRLS & BOYS B/CASTING CORP.)
- W218AV (91.5 FM; WARREN, CT; Owner: MONROE BOARD OF EDUCATION)
- WJMJ (88.9 FM; HARTFORD, CT; Owner: ST. THOMAS SEMINARY)
- WRCH (100.5 FM; NEW BRITAIN, CT; Owner: INFINITY RADIO OPERATIONS INC.)
- WAPJ (89.9 FM; TORRINGTON, CT; Owner: NUTMEG CONSERVATORY FOR THE ARTS, INC.)
- WTIC-FM (96.5 FM; HARTFORD, CT; Owner: INFINITY RADIO OPERATIONS INC.)
- W206AW (89.1 FM; PAWLING, NY; Owner: SOUND OF LIFE, INC.)
- WKCI-FM (101.3 FM; HAMDEN, CT; Owner: CLEAR CHANNEL BROADCASTING LICENSES, INC.)
- WWUH (91.3 FM; WEST HARTFORD, CT; Owner: UNIVERSITY OF HARTFORD)
- WWYZ (92.5 FM; WATERBURY, CT; Owner: CAPSTAR TX LIMITED PARTNERSHIP)
- WKSS (95.7 FM; HARTFORD-MERIDEN, CT; Owner: CAPSTAR TX LIMITED PARTNERSHIP)
- WHCN (105.9 FM; HARTFORD, CT; Owner: CAPSTAR TX LIMITED PARTNERSHIP)
- WZMX (93.7 FM; HARTFORD, CT; Owner: INFINITY RADIO OPERATIONS INC.)
- WMRQ (104.1 FM; WATERBURY, CT; Owner: CAPSTAR TX LIMITED PARTNERSHIP)
- WPKT (90.5 FM; MERIDEN, CT; Owner: CONNECTICUT PUBLIC BROADCASTING, INC)
- WDRC-FM (102.9 FM; HARTFORD, CT; Owner: BUCKLEY BROADCASTING CORPORATION)
- WQQQ (103.3 FM; SHARON, CT; Owner: THE RIDGEFIELD BROADCASTING CORPORATION)
- WCCC-FM (106.9 FM; HARTFORD, CT; Owner: MARLIN BROADCASTING, LLC)
- WPLR (99.1 FM; NEW HAVEN, CT; Owner: COX RADIO, INC.)
- WRKI (95.1 FM; BROOKFIELD, CT; Owner: CUMULUS LICENSING CORP.)
TV broadcast stations around Litchfield:
- WTIC-TV (Channel 61; HARTFORD, CT; Owner: TRIBUNE TELEVISION COMPANY)
- W11BJ (Channel 11; HARTFORD, CT; Owner: COMMUNICATIONS SITE MANAGEMENT LLC)
- WTXX (Channel 20; WATERBURY, CT; Owner: WTXX INC.)
- WVIT (Channel 30; NEW BRITAIN, CT; Owner: OUTLET BROADCASTING, INC)
- WEDH (Channel 24; HARTFORD, CT; Owner: CONNECTICUT PUBLIC BROADCASTING, INC.)
- WUVN (Channel 18; HARTFORD, CT; Owner: ENTRAVISION HOLDINGS, LLC)
- WFSB (Channel 3; HARTFORD, CT; Owner: MEREDITH CORPORATION)
- WTNH (Channel 8; NEW HAVEN, CT; Owner: WTNH BROADCASTING, INC.)
- WCTX (Channel 59; NEW HAVEN, CT; Owner: WTNH BROADCASTING, INC.)
- WEDY (Channel 65; NEW HAVEN, CT; Owner: CONNECTICUT PUBLIC BROADCASTING, INC.)
- WHCT-LP (Channel 38; HARTFORD, CT; Owner: VENTURE TECHNOLOGIES GROUP, LLC)
- W12BH (Channel 12; WATERBURY, CT; Owner: CONN.PUBLIC BROADCASTING, INC.)
- Litchfield, Connecticut
- Fatal accident count61
- Vehicles involved in fatal accidents89
- Fatal accidents involving drunk persons:28
- Fatalities67
- Persons involved in fatal accidents155
- Pedestrians involved in fatal accidents1
- Connecticut average
- Fatal accident count10749
- Vehicles involved in fatal accidents15728
- Fatal accidents involving drunk persons4493
- Fatalities11606
- Persons involved in fatal accidents26121
- Pedestrians involved in fatal accidents978
- National Bridge Inventory (NBI) Statistics
- 4Number of bridges
- 30ft / 9.3mTotal length
- $5,186,000Total costs
- 27,400Total average daily traffic
- 1,147Total average daily truck traffic
- 40,713Total future (year 2037) average daily traffic
FCC Registered Cell Phone Towers:
1 (See the full list of FCC Registered Cell Phone Towers in Litchfield)FCC Registered Antenna Towers:
28 (See the full list of FCC Registered Antenna Towers)FCC Registered Broadcast Land Mobile Towers:
7- 365 E Litchfield Rd (Lat: 41.760083 Lon: -73.133167), Call Sign: WRW779, Licensee ID: L00980347,
Assigned Frequencies: 33.7000 MHz, Grant Date: 03/03/2005, Expiration Date: 05/14/2015, Cancellation Date: 07/18/2015, Registrant: East Litchfield Vol Fire Co Inc, 365 E Litchfield Dr, Litchfield, CT 06759, Phone: (203) 482-1929
- St Hwy Garage Us Rt 202 (Lat: 41.738417 Lon: -73.216778), Type: Upole, Structure height: 10 m, Overall height: 13 m, Call Sign: KCG282,
Assigned Frequencies: 47.0800 MHz, 47.1000 MHz, 47.3000 MHz, 47.3800 MHz, Grant Date: 08/05/2015, Expiration Date: 10/16/2025, Certifier: James H Bayer, Registrant: State Of Connecticut Dept. Of Transportation, 280 West Street, Rocky Hill, CT 06067, Phone: (860) 258-0376, Fax: (860) 258-0399, Email:
- State Police Troop L Rt 202 (Lat: 41.736194 Lon: -73.218167), Call Sign: KCR305,
Assigned Frequencies: 153.740 MHz, Grant Date: 06/01/2015, Expiration Date: 07/25/2025, Registrant: State Of Connecticut - Despp, 25 Sigourney Street, Hartford, CT 06106, Phone: (860) 256-0800, Fax: (860) 256-0821
- Lat: 41.738222 Lon: -73.204694, Call Sign: WQCB274,
Assigned Frequencies: 451.362 MHz, 451.387 MHz, 461.250 MHz, Grant Date: 01/21/2015, Expiration Date: 01/21/2025, Certifier: Kathy Johnson, Registrant: Northeastern Communications, Inc., 7 Great Hill Road, Naugatuck, CT 06770, Phone: (203) 575-9008, Fax: (203) 753-1739, Email:
- Lat: 41.740028 Lon: -73.205472, Call Sign: WQFC685,
Assigned Frequencies: 72.2800 MHz, Grant Date: 06/15/2006, Expiration Date: 06/15/2016, Cancellation Date: 08/20/2016, Certifier: Margaret Perusse, Registrant: Primex Wireles, Inc, N3211 County Rd H, Lake Geneva, WI 53147, Phone: (262) 248-3000, Fax: (262) 248-0061
- Lat: 41.738222 Lon: -73.204694, Call Sign: WQFN483,
Assigned Frequencies: 452.362 MHz, Grant Date: 06/14/2016, Expiration Date: 08/23/2026, Certifier: Kathy Johnson, Registrant: New England Comm. Systems, Inc., 427 Hayden Station Road, Windsor, CT 06095, Phone: (860) 640-6600, Fax: (860) 640-6601, Email:
- Lat: 41.742944 Lon: -73.207389, Call Sign: WQYL618,
Assigned Frequencies: 72.1400 MHz, 72.2200 MHz, Grant Date: 11/01/2016, Expiration Date: 11/01/2026, Certifier: Jamie Terry, Registrant: Primex Wireless Inc, 965 Wells St., Lake Geneva, WI 53147, Phone: (800) 537-0464, Email:
FCC Registered Microwave Towers:
2- TROOP L, Troop L/W D Hq 452a Bantam Rd (Lat: 41.736194 Lon: -73.218167), Type: Ltower, Structure height: 54.9 m, Call Sign: WPNB737,
Assigned Frequencies: 6625.00 MHz, 6286.19 MHz, Grant Date: 09/11/2021, Expiration Date: 12/03/2031, Registrant: State Of Connecticut, 1111 Country Club Rd, Middletown, CT 06457, Phone: (860) 685-8080, Fax: (860) 685-8362, Email:
- LITCHFIELD, Various Locations (Lat: 41.767306 Lon: -73.199833), Structure height: 3 m, Call Sign: WPOR359,
Assigned Frequencies: 956.393 MHz, Grant Date: 10/22/2008, Expiration Date: 12/10/2018, Cancellation Date: 02/16/2019, Registrant: Aquarion Water Company, 200 Monroe Turnpike, Monroe, CT 06468, Phone: (203) 445-7384, Fax: (203) 445-7392, Email:
FCC Registered Amateur Radio Licenses:
36 (See the full list of FCC Registered Amateur Radio Licenses in Litchfield)FAA Registered Aircraft Manufacturers and Dealers:
2 (See the full list of FAA Registered Manufacturers and Dealers in Litchfield)FAA Registered Aircraft:
12 (See the full list of FAA Registered Aircraft)2002 - 2018 National Fire Incident Reporting System (NFIRS) incidents
- Fire incident types reported to NFIRS in Litchfield, CT
- 21364.5%Structure Fires
- 6519.7%Outside Fires
- 4112.4%Mobile Property/Vehicle Fires
- 113.3%Other
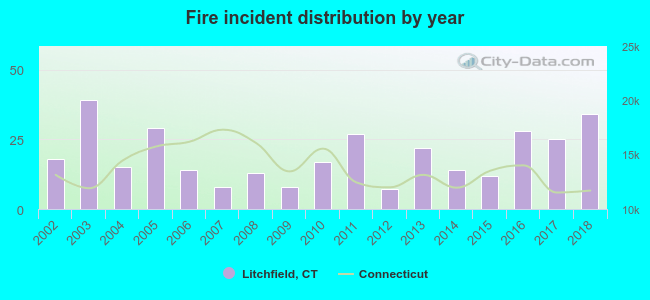 Based on the data from the years 2002 - 2018 the average number of fire incidents per year is 19. The highest number of reported fire incidents - 39 took place in 2003, and the least - 7 in 2012. The data has an increasing trend.
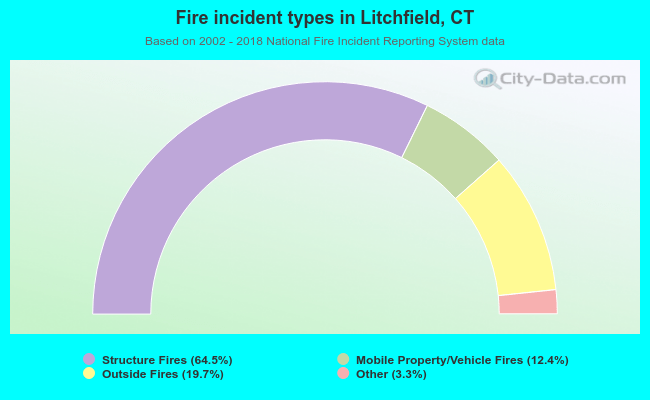 When looking into fire subcategories, the most incidents belonged to: Structure Fires (64.5%), and Outside Fires (19.7%).
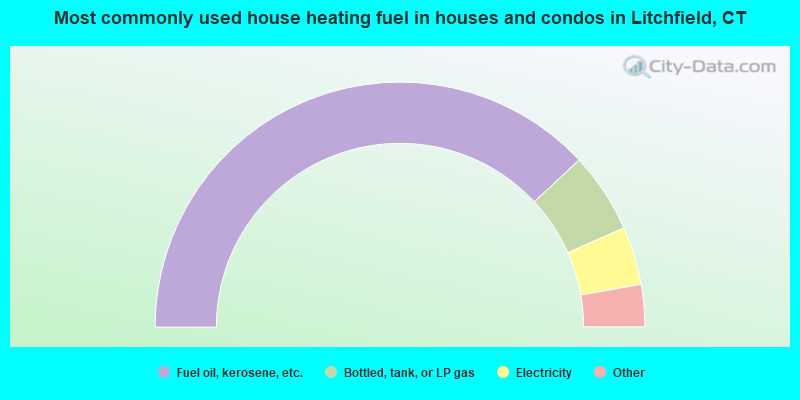
- 76.5%Fuel oil, kerosene, etc.
- 10.7%Bottled, tank, or LP gas
- 7.7%Electricity
- 1.8%Wood
- 1.8%Other fuel
- 1.5%Utility gas
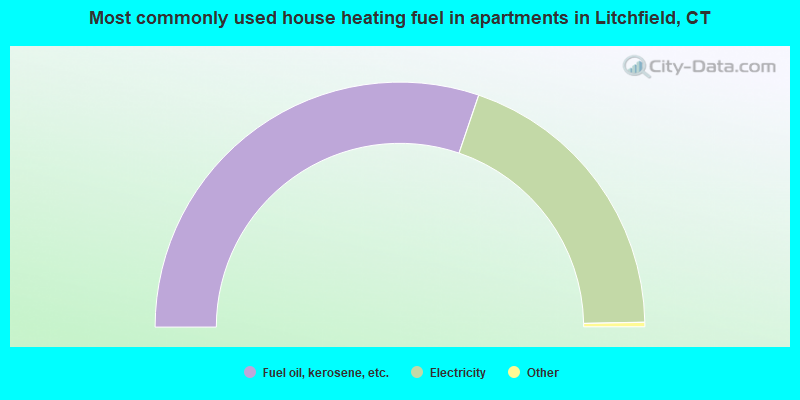
- 60.8%Fuel oil, kerosene, etc.
- 39.2%Electricity
Litchfield compared to Connecticut state average:
- Unemployed percentage significantly below state average.
- Black race population percentage significantly below state average.
- Hispanic race population percentage significantly below state average.
- Median age significantly above state average.
- Foreign-born population percentage below state average.
- Number of rooms per house above state average.
- House age above state average.
- Percentage of population with a bachelor's degree or higher above state average.
Litchfield on our top lists:
- #71 on the list of "Top 101 cities with the most residents born in United Kingdom (population 500+)"
- #71 on the list of "Top 101 cities with the most residents born in Yugoslavia (population 500+)"
- #71 on the list of "Top 101 cities with the most residents born in Asia, n.e.c. (population 500+)"
- #71 on the list of "Top 101 cities with the most residents born in Melanesia (population 500+)"
- #71 on the list of "Top 101 cities with the most residents born in Micronesia (population 500+)"
- #71 on the list of "Top 101 cities with the most residents born in Polynesia (population 500+)"
- #93 on the list of "Top 101 cities with the most residents born in Other South Eastern Asia (population 500+)"
- #99 on the list of "Top 101 cities with the most residents born in Born at sea (population 500+)"
- #7 on the list of "Top 101 counties with the lowest Particulate Matter (PM10) Annual air pollution readings in 2012 (µg/m3)"
- #10 on the list of "Top 101 counties with the lowest number of births per 1000 residents 2007-2013"
- #21 on the list of "Top 101 counties with the largest decrease in the number of births per 1000 residents 2000-2006 to 2007-2013 (pop 50,000+)"
- #38 on the list of "Top 101 counties with the lowest Particulate Matter (PM2.5) Annual air pollution readings in 2012 (µg/m3)"
- #39 on the list of "Top 101 counties with the highest carbon monoxide air pollution readings in 2012 (ppm)"

|
|
Total of 77 patent applications in 2008-2024.