Hiram, Georgia Submit your own pictures of this city and show them to the world
OSM Map
General Map
Google Map
MSN Map
OSM Map
General Map
Google Map
MSN Map
OSM Map
General Map
Google Map
MSN Map
OSM Map
General Map
Google Map
MSN Map
Please wait while loading the map...
Population in 2022: 5,209 (100% urban, 0% rural). Population change since 2000: +282.7%Males: 2,328 Females: 2,881
March 2022 cost of living index in Hiram: 101.9 (near average, U.S. average is 100) Percentage of residents living in poverty in 2022: 9.1%for White Non-Hispanic residents , 5.9% for Black residents , 40.1% for Hispanic or Latino residents , 100.0% for other race residents )
Profiles of local businesses
Business Search - 14 Million verified businesses
Data:
Median household income ($)
Median household income (% change since 2000)
Household income diversity
Ratio of average income to average house value (%)
Ratio of average income to average rent
Median household income ($) - White
Median household income ($) - Black or African American
Median household income ($) - Asian
Median household income ($) - Hispanic or Latino
Median household income ($) - American Indian and Alaska Native
Median household income ($) - Multirace
Median household income ($) - Other Race
Median household income for houses/condos with a mortgage ($)
Median household income for apartments without a mortgage ($)
Races - White alone (%)
Races - White alone (% change since 2000)
Races - Black alone (%)
Races - Black alone (% change since 2000)
Races - American Indian alone (%)
Races - American Indian alone (% change since 2000)
Races - Asian alone (%)
Races - Asian alone (% change since 2000)
Races - Hispanic (%)
Races - Hispanic (% change since 2000)
Races - Native Hawaiian and Other Pacific Islander alone (%)
Races - Native Hawaiian and Other Pacific Islander alone (% change since 2000)
Races - Two or more races (%)
Races - Two or more races (% change since 2000)
Races - Other race alone (%)
Races - Other race alone (% change since 2000)
Racial diversity
Unemployment (%)
Unemployment (% change since 2000)
Unemployment (%) - White
Unemployment (%) - Black or African American
Unemployment (%) - Asian
Unemployment (%) - Hispanic or Latino
Unemployment (%) - American Indian and Alaska Native
Unemployment (%) - Multirace
Unemployment (%) - Other Race
Population density (people per square mile)
Population - Males (%)
Population - Females (%)
Population - Males (%) - White
Population - Males (%) - Black or African American
Population - Males (%) - Asian
Population - Males (%) - Hispanic or Latino
Population - Males (%) - American Indian and Alaska Native
Population - Males (%) - Multirace
Population - Males (%) - Other Race
Population - Females (%) - White
Population - Females (%) - Black or African American
Population - Females (%) - Asian
Population - Females (%) - Hispanic or Latino
Population - Females (%) - American Indian and Alaska Native
Population - Females (%) - Multirace
Population - Females (%) - Other Race
Coronavirus confirmed cases (May 23, 2024)
Deaths caused by coronavirus (May 23, 2024)
Coronavirus confirmed cases (per 100k population) (May 23, 2024)
Deaths caused by coronavirus (per 100k population) (May 23, 2024)
Daily increase in number of cases (May 23, 2024)
Weekly increase in number of cases (May 23, 2024)
Cases doubled (in days) (May 23, 2024)
Hospitalized patients (Apr 18, 2022)
Negative test results (Apr 18, 2022)
Total test results (Apr 18, 2022)
COVID Vaccine doses distributed (per 100k population) (Sep 19, 2023)
COVID Vaccine doses administered (per 100k population) (Sep 19, 2023)
COVID Vaccine doses distributed (Sep 19, 2023)
COVID Vaccine doses administered (Sep 19, 2023)
Likely homosexual households (%)
Likely homosexual households (% change since 2000)
Likely homosexual households - Lesbian couples (%)
Likely homosexual households - Lesbian couples (% change since 2000)
Likely homosexual households - Gay men (%)
Likely homosexual households - Gay men (% change since 2000)
Cost of living index
Median gross rent ($)
Median contract rent ($)
Median monthly housing costs ($)
Median house or condo value ($)
Median house or condo value ($ change since 2000)
Mean house or condo value by units in structure - 1, detached ($)
Mean house or condo value by units in structure - 1, attached ($)
Mean house or condo value by units in structure - 2 ($)
Mean house or condo value by units in structure by units in structure - 3 or 4 ($)
Mean house or condo value by units in structure - 5 or more ($)
Mean house or condo value by units in structure - Boat, RV, van, etc. ($)
Mean house or condo value by units in structure - Mobile home ($)
Median house or condo value ($) - White
Median house or condo value ($) - Black or African American
Median house or condo value ($) - Asian
Median house or condo value ($) - Hispanic or Latino
Median house or condo value ($) - American Indian and Alaska Native
Median house or condo value ($) - Multirace
Median house or condo value ($) - Other Race
Median resident age
Resident age diversity
Median resident age - Males
Median resident age - Females
Median resident age - White
Median resident age - Black or African American
Median resident age - Asian
Median resident age - Hispanic or Latino
Median resident age - American Indian and Alaska Native
Median resident age - Multirace
Median resident age - Other Race
Median resident age - Males - White
Median resident age - Males - Black or African American
Median resident age - Males - Asian
Median resident age - Males - Hispanic or Latino
Median resident age - Males - American Indian and Alaska Native
Median resident age - Males - Multirace
Median resident age - Males - Other Race
Median resident age - Females - White
Median resident age - Females - Black or African American
Median resident age - Females - Asian
Median resident age - Females - Hispanic or Latino
Median resident age - Females - American Indian and Alaska Native
Median resident age - Females - Multirace
Median resident age - Females - Other Race
Commute - mean travel time to work (minutes)
Travel time to work - Less than 5 minutes (%)
Travel time to work - Less than 5 minutes (% change since 2000)
Travel time to work - 5 to 9 minutes (%)
Travel time to work - 5 to 9 minutes (% change since 2000)
Travel time to work - 10 to 19 minutes (%)
Travel time to work - 10 to 19 minutes (% change since 2000)
Travel time to work - 20 to 29 minutes (%)
Travel time to work - 20 to 29 minutes (% change since 2000)
Travel time to work - 30 to 39 minutes (%)
Travel time to work - 30 to 39 minutes (% change since 2000)
Travel time to work - 40 to 59 minutes (%)
Travel time to work - 40 to 59 minutes (% change since 2000)
Travel time to work - 60 to 89 minutes (%)
Travel time to work - 60 to 89 minutes (% change since 2000)
Travel time to work - 90 or more minutes (%)
Travel time to work - 90 or more minutes (% change since 2000)
Marital status - Never married (%)
Marital status - Now married (%)
Marital status - Separated (%)
Marital status - Widowed (%)
Marital status - Divorced (%)
Median family income ($)
Median family income (% change since 2000)
Median non-family income ($)
Median non-family income (% change since 2000)
Median per capita income ($)
Median per capita income (% change since 2000)
Median family income ($) - White
Median family income ($) - Black or African American
Median family income ($) - Asian
Median family income ($) - Hispanic or Latino
Median family income ($) - American Indian and Alaska Native
Median family income ($) - Multirace
Median family income ($) - Other Race
Median year house/condo built
Median year apartment built
Year house built - Built 2005 or later (%)
Year house built - Built 2000 to 2004 (%)
Year house built - Built 1990 to 1999 (%)
Year house built - Built 1980 to 1989 (%)
Year house built - Built 1970 to 1979 (%)
Year house built - Built 1960 to 1969 (%)
Year house built - Built 1950 to 1959 (%)
Year house built - Built 1940 to 1949 (%)
Year house built - Built 1939 or earlier (%)
Average household size
Household density (households per square mile)
Average household size - White
Average household size - Black or African American
Average household size - Asian
Average household size - Hispanic or Latino
Average household size - American Indian and Alaska Native
Average household size - Multirace
Average household size - Other Race
Occupied housing units (%)
Vacant housing units (%)
Owner occupied housing units (%)
Renter occupied housing units (%)
Vacancy status - For rent (%)
Vacancy status - For sale only (%)
Vacancy status - Rented or sold, not occupied (%)
Vacancy status - For seasonal, recreational, or occasional use (%)
Vacancy status - For migrant workers (%)
Vacancy status - Other vacant (%)
Residents with income below the poverty level (%)
Residents with income below 50% of the poverty level (%)
Children below poverty level (%)
Poor families by family type - Married-couple family (%)
Poor families by family type - Male, no wife present (%)
Poor families by family type - Female, no husband present (%)
Poverty status for native-born residents (%)
Poverty status for foreign-born residents (%)
Poverty among high school graduates not in families (%)
Poverty among people who did not graduate high school not in families (%)
Residents with income below the poverty level (%) - White
Residents with income below the poverty level (%) - Black or African American
Residents with income below the poverty level (%) - Asian
Residents with income below the poverty level (%) - Hispanic or Latino
Residents with income below the poverty level (%) - American Indian and Alaska Native
Residents with income below the poverty level (%) - Multirace
Residents with income below the poverty level (%) - Other Race
Air pollution - Air Quality Index (AQI)
Air pollution - CO
Air pollution - NO2
Air pollution - SO2
Air pollution - Ozone
Air pollution - PM10
Air pollution - PM25
Air pollution - Pb
Crime - Murders per 100,000 population
Crime - Rapes per 100,000 population
Crime - Robberies per 100,000 population
Crime - Assaults per 100,000 population
Crime - Burglaries per 100,000 population
Crime - Thefts per 100,000 population
Crime - Auto thefts per 100,000 population
Crime - Arson per 100,000 population
Crime - City-data.com crime index
Crime - Violent crime index
Crime - Property crime index
Crime - Murders per 100,000 population (5 year average)
Crime - Rapes per 100,000 population (5 year average)
Crime - Robberies per 100,000 population (5 year average)
Crime - Assaults per 100,000 population (5 year average)
Crime - Burglaries per 100,000 population (5 year average)
Crime - Thefts per 100,000 population (5 year average)
Crime - Auto thefts per 100,000 population (5 year average)
Crime - Arson per 100,000 population (5 year average)
Crime - City-data.com crime index (5 year average)
Crime - Violent crime index (5 year average)
Crime - Property crime index (5 year average)
1996 Presidential Elections Results (%) - Democratic Party (Clinton)
1996 Presidential Elections Results (%) - Republican Party (Dole)
1996 Presidential Elections Results (%) - Other
2000 Presidential Elections Results (%) - Democratic Party (Gore)
2000 Presidential Elections Results (%) - Republican Party (Bush)
2000 Presidential Elections Results (%) - Other
2004 Presidential Elections Results (%) - Democratic Party (Kerry)
2004 Presidential Elections Results (%) - Republican Party (Bush)
2004 Presidential Elections Results (%) - Other
2008 Presidential Elections Results (%) - Democratic Party (Obama)
2008 Presidential Elections Results (%) - Republican Party (McCain)
2008 Presidential Elections Results (%) - Other
2012 Presidential Elections Results (%) - Democratic Party (Obama)
2012 Presidential Elections Results (%) - Republican Party (Romney)
2012 Presidential Elections Results (%) - Other
2016 Presidential Elections Results (%) - Democratic Party (Clinton)
2016 Presidential Elections Results (%) - Republican Party (Trump)
2016 Presidential Elections Results (%) - Other
2020 Presidential Elections Results (%) - Democratic Party (Biden)
2020 Presidential Elections Results (%) - Republican Party (Trump)
2020 Presidential Elections Results (%) - Other
Ancestries Reported - Arab (%)
Ancestries Reported - Czech (%)
Ancestries Reported - Danish (%)
Ancestries Reported - Dutch (%)
Ancestries Reported - English (%)
Ancestries Reported - French (%)
Ancestries Reported - French Canadian (%)
Ancestries Reported - German (%)
Ancestries Reported - Greek (%)
Ancestries Reported - Hungarian (%)
Ancestries Reported - Irish (%)
Ancestries Reported - Italian (%)
Ancestries Reported - Lithuanian (%)
Ancestries Reported - Norwegian (%)
Ancestries Reported - Polish (%)
Ancestries Reported - Portuguese (%)
Ancestries Reported - Russian (%)
Ancestries Reported - Scotch-Irish (%)
Ancestries Reported - Scottish (%)
Ancestries Reported - Slovak (%)
Ancestries Reported - Subsaharan African (%)
Ancestries Reported - Swedish (%)
Ancestries Reported - Swiss (%)
Ancestries Reported - Ukrainian (%)
Ancestries Reported - United States (%)
Ancestries Reported - Welsh (%)
Ancestries Reported - West Indian (%)
Ancestries Reported - Other (%)
Educational Attainment - No schooling completed (%)
Educational Attainment - Less than high school (%)
Educational Attainment - High school or equivalent (%)
Educational Attainment - Less than 1 year of college (%)
Educational Attainment - 1 or more years of college (%)
Educational Attainment - Associate degree (%)
Educational Attainment - Bachelor's degree (%)
Educational Attainment - Master's degree (%)
Educational Attainment - Professional school degree (%)
Educational Attainment - Doctorate degree (%)
School Enrollment - Nursery, preschool (%)
School Enrollment - Kindergarten (%)
School Enrollment - Grade 1 to 4 (%)
School Enrollment - Grade 5 to 8 (%)
School Enrollment - Grade 9 to 12 (%)
School Enrollment - College undergrad (%)
School Enrollment - Graduate or professional (%)
School Enrollment - Not enrolled in school (%)
School enrollment - Public schools (%)
School enrollment - Private schools (%)
School enrollment - Not enrolled (%)
Median number of rooms in houses and condos
Median number of rooms in apartments
Housing units lacking complete plumbing facilities (%)
Housing units lacking complete kitchen facilities (%)
Density of houses
Urban houses (%)
Rural houses (%)
Households with people 60 years and over (%)
Households with people 65 years and over (%)
Households with people 75 years and over (%)
Households with one or more nonrelatives (%)
Households with no nonrelatives (%)
Population in households (%)
Family households (%)
Nonfamily households (%)
Population in families (%)
Family households with own children (%)
Median number of bedrooms in owner occupied houses
Mean number of bedrooms in owner occupied houses
Median number of bedrooms in renter occupied houses
Mean number of bedrooms in renter occupied houses
Median number of vehichles in owner occupied houses
Mean number of vehichles in owner occupied houses
Median number of vehichles in renter occupied houses
Mean number of vehichles in renter occupied houses
Mortgage status - with mortgage (%)
Mortgage status - with second mortgage (%)
Mortgage status - with home equity loan (%)
Mortgage status - with both second mortgage and home equity loan (%)
Mortgage status - without a mortgage (%)
Average family size
Average family size - White
Average family size - Black or African American
Average family size - Asian
Average family size - Hispanic or Latino
Average family size - American Indian and Alaska Native
Average family size - Multirace
Average family size - Other Race
Geographical mobility - Same house 1 year ago (%)
Geographical mobility - Moved within same county (%)
Geographical mobility - Moved from different county within same state (%)
Geographical mobility - Moved from different state (%)
Geographical mobility - Moved from abroad (%)
Place of birth - Born in state of residence (%)
Place of birth - Born in other state (%)
Place of birth - Native, outside of US (%)
Place of birth - Foreign born (%)
Housing units in structures - 1, detached (%)
Housing units in structures - 1, attached (%)
Housing units in structures - 2 (%)
Housing units in structures - 3 or 4 (%)
Housing units in structures - 5 to 9 (%)
Housing units in structures - 10 to 19 (%)
Housing units in structures - 20 to 49 (%)
Housing units in structures - 50 or more (%)
Housing units in structures - Mobile home (%)
Housing units in structures - Boat, RV, van, etc. (%)
House/condo owner moved in on average (years ago)
Renter moved in on average (years ago)
Year householder moved into unit - Moved in 1999 to March 2000 (%)
Year householder moved into unit - Moved in 1995 to 1998 (%)
Year householder moved into unit - Moved in 1990 to 1994 (%)
Year householder moved into unit - Moved in 1980 to 1989 (%)
Year householder moved into unit - Moved in 1970 to 1979 (%)
Year householder moved into unit - Moved in 1969 or earlier (%)
Means of transportation to work - Drove car alone (%)
Means of transportation to work - Carpooled (%)
Means of transportation to work - Public transportation (%)
Means of transportation to work - Bus or trolley bus (%)
Means of transportation to work - Streetcar or trolley car (%)
Means of transportation to work - Subway or elevated (%)
Means of transportation to work - Railroad (%)
Means of transportation to work - Ferryboat (%)
Means of transportation to work - Taxicab (%)
Means of transportation to work - Motorcycle (%)
Means of transportation to work - Bicycle (%)
Means of transportation to work - Walked (%)
Means of transportation to work - Other means (%)
Working at home (%)
Industry diversity
Most Common Industries - Agriculture, forestry, fishing and hunting, and mining (%)
Most Common Industries - Agriculture, forestry, fishing and hunting (%)
Most Common Industries - Mining, quarrying, and oil and gas extraction (%)
Most Common Industries - Construction (%)
Most Common Industries - Manufacturing (%)
Most Common Industries - Wholesale trade (%)
Most Common Industries - Retail trade (%)
Most Common Industries - Transportation and warehousing, and utilities (%)
Most Common Industries - Transportation and warehousing (%)
Most Common Industries - Utilities (%)
Most Common Industries - Information (%)
Most Common Industries - Finance and insurance, and real estate and rental and leasing (%)
Most Common Industries - Finance and insurance (%)
Most Common Industries - Real estate and rental and leasing (%)
Most Common Industries - Professional, scientific, and management, and administrative and waste management services (%)
Most Common Industries - Professional, scientific, and technical services (%)
Most Common Industries - Management of companies and enterprises (%)
Most Common Industries - Administrative and support and waste management services (%)
Most Common Industries - Educational services, and health care and social assistance (%)
Most Common Industries - Educational services (%)
Most Common Industries - Health care and social assistance (%)
Most Common Industries - Arts, entertainment, and recreation, and accommodation and food services (%)
Most Common Industries - Arts, entertainment, and recreation (%)
Most Common Industries - Accommodation and food services (%)
Most Common Industries - Other services, except public administration (%)
Most Common Industries - Public administration (%)
Occupation diversity
Most Common Occupations - Management, business, science, and arts occupations (%)
Most Common Occupations - Management, business, and financial occupations (%)
Most Common Occupations - Management occupations (%)
Most Common Occupations - Business and financial operations occupations (%)
Most Common Occupations - Computer, engineering, and science occupations (%)
Most Common Occupations - Computer and mathematical occupations (%)
Most Common Occupations - Architecture and engineering occupations (%)
Most Common Occupations - Life, physical, and social science occupations (%)
Most Common Occupations - Education, legal, community service, arts, and media occupations (%)
Most Common Occupations - Community and social service occupations (%)
Most Common Occupations - Legal occupations (%)
Most Common Occupations - Education, training, and library occupations (%)
Most Common Occupations - Arts, design, entertainment, sports, and media occupations (%)
Most Common Occupations - Healthcare practitioners and technical occupations (%)
Most Common Occupations - Health diagnosing and treating practitioners and other technical occupations (%)
Most Common Occupations - Health technologists and technicians (%)
Most Common Occupations - Service occupations (%)
Most Common Occupations - Healthcare support occupations (%)
Most Common Occupations - Protective service occupations (%)
Most Common Occupations - Fire fighting and prevention, and other protective service workers including supervisors (%)
Most Common Occupations - Law enforcement workers including supervisors (%)
Most Common Occupations - Food preparation and serving related occupations (%)
Most Common Occupations - Building and grounds cleaning and maintenance occupations (%)
Most Common Occupations - Personal care and service occupations (%)
Most Common Occupations - Sales and office occupations (%)
Most Common Occupations - Sales and related occupations (%)
Most Common Occupations - Office and administrative support occupations (%)
Most Common Occupations - Natural resources, construction, and maintenance occupations (%)
Most Common Occupations - Farming, fishing, and forestry occupations (%)
Most Common Occupations - Construction and extraction occupations (%)
Most Common Occupations - Installation, maintenance, and repair occupations (%)
Most Common Occupations - Production, transportation, and material moving occupations (%)
Most Common Occupations - Production occupations (%)
Most Common Occupations - Transportation occupations (%)
Most Common Occupations - Material moving occupations (%)
People in Group quarters - Institutionalized population (%)
People in Group quarters - Correctional institutions (%)
People in Group quarters - Federal prisons and detention centers (%)
People in Group quarters - Halfway houses (%)
People in Group quarters - Local jails and other confinement facilities (including police lockups) (%)
People in Group quarters - Military disciplinary barracks (%)
People in Group quarters - State prisons (%)
People in Group quarters - Other types of correctional institutions (%)
People in Group quarters - Nursing homes (%)
People in Group quarters - Hospitals/wards, hospices, and schools for the handicapped (%)
People in Group quarters - Hospitals/wards and hospices for chronically ill (%)
People in Group quarters - Hospices or homes for chronically ill (%)
People in Group quarters - Military hospitals or wards for chronically ill (%)
People in Group quarters - Other hospitals or wards for chronically ill (%)
People in Group quarters - Hospitals or wards for drug/alcohol abuse (%)
People in Group quarters - Mental (Psychiatric) hospitals or wards (%)
People in Group quarters - Schools, hospitals, or wards for the mentally retarded (%)
People in Group quarters - Schools, hospitals, or wards for the physically handicapped (%)
People in Group quarters - Institutions for the deaf (%)
People in Group quarters - Institutions for the blind (%)
People in Group quarters - Orthopedic wards and institutions for the physically handicapped (%)
People in Group quarters - Wards in general hospitals for patients who have no usual home elsewhere (%)
People in Group quarters - Wards in military hospitals for patients who have no usual home elsewhere (%)
People in Group quarters - Juvenile institutions (%)
People in Group quarters - Long-term care (%)
People in Group quarters - Homes for abused, dependent, and neglected children (%)
People in Group quarters - Residential treatment centers for emotionally disturbed children (%)
People in Group quarters - Training schools for juvenile delinquents (%)
People in Group quarters - Short-term care, detention or diagnostic centers for delinquent children (%)
People in Group quarters - Type of juvenile institution unknown (%)
People in Group quarters - Noninstitutionalized population (%)
People in Group quarters - College dormitories (includes college quarters off campus) (%)
People in Group quarters - Military quarters (%)
People in Group quarters - On base (%)
People in Group quarters - Barracks, unaccompanied personnel housing (UPH), (Enlisted/Officer), ;and similar group living quarters for military personnel (%)
People in Group quarters - Transient quarters for temporary residents (%)
People in Group quarters - Military ships (%)
People in Group quarters - Group homes (%)
People in Group quarters - Homes or halfway houses for drug/alcohol abuse (%)
People in Group quarters - Homes for the mentally ill (%)
People in Group quarters - Homes for the mentally retarded (%)
People in Group quarters - Homes for the physically handicapped (%)
People in Group quarters - Other group homes (%)
People in Group quarters - Religious group quarters (%)
People in Group quarters - Dormitories (%)
People in Group quarters - Agriculture workers' dormitories on farms (%)
People in Group quarters - Job Corps and vocational training facilities (%)
People in Group quarters - Other workers' dormitories (%)
People in Group quarters - Crews of maritime vessels (%)
People in Group quarters - Other nonhousehold living situations (%)
People in Group quarters - Other noninstitutional group quarters (%)
Residents speaking English at home (%)
Residents speaking English at home - Born in the United States (%)
Residents speaking English at home - Native, born elsewhere (%)
Residents speaking English at home - Foreign born (%)
Residents speaking Spanish at home (%)
Residents speaking Spanish at home - Born in the United States (%)
Residents speaking Spanish at home - Native, born elsewhere (%)
Residents speaking Spanish at home - Foreign born (%)
Residents speaking other language at home (%)
Residents speaking other language at home - Born in the United States (%)
Residents speaking other language at home - Native, born elsewhere (%)
Residents speaking other language at home - Foreign born (%)
Class of Workers - Employee of private company (%)
Class of Workers - Self-employed in own incorporated business (%)
Class of Workers - Private not-for-profit wage and salary workers (%)
Class of Workers - Local government workers (%)
Class of Workers - State government workers (%)
Class of Workers - Federal government workers (%)
Class of Workers - Self-employed workers in own not incorporated business and Unpaid family workers (%)
House heating fuel used in houses and condos - Utility gas (%)
House heating fuel used in houses and condos - Bottled, tank, or LP gas (%)
House heating fuel used in houses and condos - Electricity (%)
House heating fuel used in houses and condos - Fuel oil, kerosene, etc. (%)
House heating fuel used in houses and condos - Coal or coke (%)
House heating fuel used in houses and condos - Wood (%)
House heating fuel used in houses and condos - Solar energy (%)
House heating fuel used in houses and condos - Other fuel (%)
House heating fuel used in houses and condos - No fuel used (%)
House heating fuel used in apartments - Utility gas (%)
House heating fuel used in apartments - Bottled, tank, or LP gas (%)
House heating fuel used in apartments - Electricity (%)
House heating fuel used in apartments - Fuel oil, kerosene, etc. (%)
House heating fuel used in apartments - Coal or coke (%)
House heating fuel used in apartments - Wood (%)
House heating fuel used in apartments - Solar energy (%)
House heating fuel used in apartments - Other fuel (%)
House heating fuel used in apartments - No fuel used (%)
Armed forces status - In Armed Forces (%)
Armed forces status - Civilian (%)
Armed forces status - Civilian - Veteran (%)
Armed forces status - Civilian - Nonveteran (%)
Fatal accidents locations in years 2005-2021
Fatal accidents locations in 2005
Fatal accidents locations in 2006
Fatal accidents locations in 2007
Fatal accidents locations in 2008
Fatal accidents locations in 2009
Fatal accidents locations in 2010
Fatal accidents locations in 2011
Fatal accidents locations in 2012
Fatal accidents locations in 2013
Fatal accidents locations in 2014
Fatal accidents locations in 2015
Fatal accidents locations in 2016
Fatal accidents locations in 2017
Fatal accidents locations in 2018
Fatal accidents locations in 2019
Fatal accidents locations in 2020
Fatal accidents locations in 2021
Alcohol use - People drinking some alcohol every month (%)
Alcohol use - People not drinking at all (%)
Alcohol use - Average days/month drinking alcohol
Alcohol use - Average drinks/week
Alcohol use - Average days/year people drink much
Audiometry - Average condition of hearing (%)
Audiometry - People that can hear a whisper from across a quiet room (%)
Audiometry - People that can hear normal voice from across a quiet room (%)
Audiometry - Ears ringing, roaring, buzzing (%)
Audiometry - Had a job exposure to loud noise (%)
Audiometry - Had off-work exposure to loud noise (%)
Blood Pressure & Cholesterol - Has high blood pressure (%)
Blood Pressure & Cholesterol - Checking blood pressure at home (%)
Blood Pressure & Cholesterol - Frequently checking blood cholesterol (%)
Blood Pressure & Cholesterol - Has high cholesterol level (%)
Consumer Behavior - Money monthly spent on food at supermarket/grocery store
Consumer Behavior - Money monthly spent on food at other stores
Consumer Behavior - Money monthly spent on eating out
Consumer Behavior - Money monthly spent on carryout/delivered foods
Consumer Behavior - Income spent on food at supermarket/grocery store (%)
Consumer Behavior - Income spent on food at other stores (%)
Consumer Behavior - Income spent on eating out (%)
Consumer Behavior - Income spent on carryout/delivered foods (%)
Current Health Status - General health condition (%)
Current Health Status - Blood donors (%)
Current Health Status - Has blood ever tested for HIV virus (%)
Current Health Status - Left-handed people (%)
Dermatology - People using sunscreen (%)
Diabetes - Diabetics (%)
Diabetes - Had a blood test for high blood sugar (%)
Diabetes - People taking insulin (%)
Diet Behavior & Nutrition - Diet health (%)
Diet Behavior & Nutrition - Milk product consumption (# of products/month)
Diet Behavior & Nutrition - Meals not home prepared (#/week)
Diet Behavior & Nutrition - Meals from fast food or pizza place (#/week)
Diet Behavior & Nutrition - Ready-to-eat foods (#/month)
Diet Behavior & Nutrition - Frozen meals/pizza (#/month)
Drug Use - People that ever used marijuana or hashish (%)
Drug Use - Ever used hard drugs (%)
Drug Use - Ever used any form of cocaine (%)
Drug Use - Ever used heroin (%)
Drug Use - Ever used methamphetamine (%)
Health Insurance - People covered by health insurance (%)
Kidney Conditions-Urology - Avg. # of times urinating at night
Medical Conditions - People with asthma (%)
Medical Conditions - People with anemia (%)
Medical Conditions - People with psoriasis (%)
Medical Conditions - People with overweight (%)
Medical Conditions - Elderly people having difficulties in thinking or remembering (%)
Medical Conditions - People who ever received blood transfusion (%)
Medical Conditions - People having trouble seeing even with glass/contacts (%)
Medical Conditions - People with arthritis (%)
Medical Conditions - People with gout (%)
Medical Conditions - People with congestive heart failure (%)
Medical Conditions - People with coronary heart disease (%)
Medical Conditions - People with angina pectoris (%)
Medical Conditions - People who ever had heart attack (%)
Medical Conditions - People who ever had stroke (%)
Medical Conditions - People with emphysema (%)
Medical Conditions - People with thyroid problem (%)
Medical Conditions - People with chronic bronchitis (%)
Medical Conditions - People with any liver condition (%)
Medical Conditions - People who ever had cancer or malignancy (%)
Mental Health - People who have little interest in doing things (%)
Mental Health - People feeling down, depressed, or hopeless (%)
Mental Health - People who have trouble sleeping or sleeping too much (%)
Mental Health - People feeling tired or having little energy (%)
Mental Health - People with poor appetite or overeating (%)
Mental Health - People feeling bad about themself (%)
Mental Health - People who have trouble concentrating on things (%)
Mental Health - People moving or speaking slowly or too fast (%)
Mental Health - People having thoughts they would be better off dead (%)
Oral Health - Average years since last visit a dentist
Oral Health - People embarrassed because of mouth (%)
Oral Health - People with gum disease (%)
Oral Health - General health of teeth and gums (%)
Oral Health - Average days a week using dental floss/device
Oral Health - Average days a week using mouthwash for dental problem
Oral Health - Average number of teeth
Pesticide Use - Households using pesticides to control insects (%)
Pesticide Use - Households using pesticides to kill weeds (%)
Physical Activity - People doing vigorous-intensity work activities (%)
Physical Activity - People doing moderate-intensity work activities (%)
Physical Activity - People walking or bicycling (%)
Physical Activity - People doing vigorous-intensity recreational activities (%)
Physical Activity - People doing moderate-intensity recreational activities (%)
Physical Activity - Average hours a day doing sedentary activities
Physical Activity - Average hours a day watching TV or videos
Physical Activity - Average hours a day using computer
Physical Functioning - People having limitations keeping them from working (%)
Physical Functioning - People limited in amount of work they can do (%)
Physical Functioning - People that need special equipment to walk (%)
Physical Functioning - People experiencing confusion/memory problems (%)
Physical Functioning - People requiring special healthcare equipment (%)
Prescription Medications - Average number of prescription medicines taking
Preventive Aspirin Use - Adults 40+ taking low-dose aspirin (%)
Reproductive Health - Vaginal deliveries (%)
Reproductive Health - Cesarean deliveries (%)
Reproductive Health - Deliveries resulted in a live birth (%)
Reproductive Health - Pregnancies resulted in a delivery (%)
Reproductive Health - Women breastfeeding newborns (%)
Reproductive Health - Women that had a hysterectomy (%)
Reproductive Health - Women that had both ovaries removed (%)
Reproductive Health - Women that have ever taken birth control pills (%)
Reproductive Health - Women taking birth control pills (%)
Reproductive Health - Women that have ever used Depo-Provera or injectables (%)
Reproductive Health - Women that have ever used female hormones (%)
Sexual Behavior - People 18+ that ever had sex (vaginal, anal, or oral) (%)
Sexual Behavior - Males 18+ that ever had vaginal sex with a woman (%)
Sexual Behavior - Males 18+ that ever performed oral sex on a woman (%)
Sexual Behavior - Males 18+ that ever had anal sex with a woman (%)
Sexual Behavior - Males 18+ that ever had any sex with a man (%)
Sexual Behavior - Females 18+ that ever had vaginal sex with a man (%)
Sexual Behavior - Females 18+ that ever performed oral sex on a man (%)
Sexual Behavior - Females 18+ that ever had anal sex with a man (%)
Sexual Behavior - Females 18+ that ever had any kind of sex with a woman (%)
Sexual Behavior - Average age people first had sex
Sexual Behavior - Average number of female sex partners in lifetime (males 18+)
Sexual Behavior - Average number of female vaginal sex partners in lifetime (males 18+)
Sexual Behavior - Average age people first performed oral sex on a woman (18+)
Sexual Behavior - Average number of woman performed oral sex on in lifetime (18+)
Sexual Behavior - Average number of male sex partners in lifetime (males 18+)
Sexual Behavior - Average number of male anal sex partners in lifetime (males 18+)
Sexual Behavior - Average age people first performed oral sex on a man (18+)
Sexual Behavior - Average number of male oral sex partners in lifetime (18+)
Sexual Behavior - People using protection when performing oral sex (%)
Sexual Behavior - Average number of times people have vaginal or anal sex a year
Sexual Behavior - People having sex without condom (%)
Sexual Behavior - Average number of male sex partners in lifetime (females 18+)
Sexual Behavior - Average number of male vaginal sex partners in lifetime (females 18+)
Sexual Behavior - Average number of female sex partners in lifetime (females 18+)
Sexual Behavior - Circumcised males 18+ (%)
Sleep Disorders - Average hours sleeping at night
Sleep Disorders - People that has trouble sleeping (%)
Smoking-Cigarette Use - People smoking cigarettes (%)
Taste & Smell - People 40+ having problems with smell (%)
Taste & Smell - People 40+ having problems with taste (%)
Taste & Smell - People 40+ that ever had wisdom teeth removed (%)
Taste & Smell - People 40+ that ever had tonsils teeth removed (%)
Taste & Smell - People 40+ that ever had a loss of consciousness because of a head injury (%)
Taste & Smell - People 40+ that ever had a broken nose or other serious injury to face or skull (%)
Taste & Smell - People 40+ that ever had two or more sinus infections (%)
Weight - Average height (inches)
Weight - Average weight (pounds)
Weight - Average BMI
Weight - People that are obese (%)
Weight - People that ever were obese (%)
Weight - People trying to lose weight (%)
Officers per 1,000 residents here:
3.94Georgia average:
2.45
Latest news from Hiram, GA collected exclusively by city-data.com from local newspapers, TV, and radio stations
Ancestries: American (8.0%), Haitian (5.5%), English (4.2%), Scottish (1.2%).
Current Local Time:
Land area: 3.01 square miles.
Population density: 1,732 people per square mile (low).
913 residents are foreign born (9.2% Latin America , 8.6% Asia ).
This city:
17.7%Georgia:
10.4%
Median real estate property taxes paid for housing units with mortgages in 2022: $1,667 (0.6%)Median real estate property taxes paid for housing units with no mortgage in 2022: $981 (0.4%)
Nearest city with pop. 50,000+: Marietta, GA
Nearest city with pop. 200,000+: Atlanta, GA
Nearest city with pop. 1,000,000+: Chicago, IL
Nearest cities:
Latitude: 33.87 N, Longitude: 84.77 W
Daytime population change due to commuting: +5,046 (+97.8%)Workers who live and work in this city: 974 (36.8%)
Unemployment in December 2023:
Most common occupations in Hiram, GA (%)
Both Males Females
Retail sales workers, except cashiers (5.2%)
Other office and administrative support workers, including supervisors (4.2%)
Computer specialists (4.1%)
Other production occupations, including supervisors (4.1%)
Electrical equipment mechanics and other installation, maintenance, and repair workers, including supervisors (4.1%)
Information and record clerks, except customer service representatives (3.8%)
Driver/sales workers and truck drivers (3.6%)
Electrical equipment mechanics and other installation, maintenance, and repair workers, including supervisors (7.0%)
Driver/sales workers and truck drivers (6.3%)
Construction traders workers except carpenters, electricians, painters, plumbers, and construction laborers (5.0%)
Supervisors, construction and extraction workers (5.0%)
Computer specialists (5.0%)
Construction laborers (4.8%)
Retail sales workers, except cashiers (4.8%)
Information and record clerks, except customer service representatives (9.0%)
Other office and administrative support workers, including supervisors (6.6%)
Retail sales workers, except cashiers (5.9%)
Other teachers, instructors, education, training, and library occupations (4.9%)
Child care workers (4.2%)
Secretaries and administrative assistants (4.2%)
Other sales and related occupations, including supervisors (3.8%)
Tornado activity:
Hiram-area historical tornado activity is slightly above Georgia state average. It is 77% greater than the overall U.S. average.
On 11/22/1992, a category F4 (max. wind speeds 207-260 mph) tornado 7.1 miles away from the Hiram city center injured 46 people and caused between $5,000,000 and $50,000,000 in damages.
On 3/27/1994, a category F4 tornado 23.4 miles away from the city center killed 3 people and injured 20 people and caused between $5,000,000 and $50,000,000 in damages.
Earthquake activity:
Hiram-area historical earthquake activity is significantly above Georgia state average. It is 68% greater than the overall U.S. average. On 4/29/2003 at 08:59:39, a magnitude 4.9 (4.4 MB, 4.6 MW, 4.9 LG, Class: Light, Intensity: IV - V) earthquake occurred 65.4 miles away from Hiram center On 4/29/2003 at 08:59:39, a magnitude 4.6 (4.6 MW, Depth: 12.3 mi) earthquake occurred 65.4 miles away from the city center On 8/2/1974 at 08:52:09, a magnitude 4.9 (4.3 MB, 4.9 LG) earthquake occurred 131.3 miles away from Hiram center On 1/18/1999 at 07:00:53, a magnitude 4.8 (4.8 MB, 4.0 LG, Depth: 0.6 mi) earthquake occurred 146.3 miles away from the city center On 11/30/1973 at 07:48:41, a magnitude 4.7 (4.7 MB, 4.6 ML) earthquake occurred 141.5 miles away from the city center On 12/12/2018 at 09:14:43, a magnitude 4.4 (4.4 MW, Depth: 4.9 mi) earthquake occurred 120.8 miles away from the city center Magnitude types: regional Lg-wave magnitude (LG), body-wave magnitude (MB), local magnitude (ML), moment magnitude (MW) Natural disasters: The number of natural disasters in Paulding County (11) is smaller than the US average (15).Major Disasters (Presidential) Declared: 6Emergencies Declared: 4Floods: 3, Winter Storms: 3, Hurricanes: 2, Storms: 2, Tornadoes: 2, Drought: 1, Snowfall: 1, Other: 1 (Note: some incidents may be assigned to more than one category). Hospitals and medical centers in Hiram: FRESENIUS MEDICAL CARE HIRAM (3919 ATLANTA HIGHWAY)
Other hospitals and medical centers near Hiram: WALTON NURSING HOSPICE SERVICES INC (Hospital, about 5 miles away; POWDER SPRINGS, GA)
WELLSTAR PAULDING HOSPITAL (about 6 miles away; DALLAS, GA)
PAULDING DIALYSIS (Dialysis Facility, about 6 miles away; DALLAS, GA)
POWDER SPRINGS NURSING AND REHAB CENTER (Nursing Home, about 7 miles away; POWDER SPRINGS, GA)
FMC DIALYSIS SERVICES SOUTH COBB (Dialysis Facility, about 7 miles away; AUSTELL, GA)
COLONIAL SPRINGS DIALYSIS (Dialysis Facility, about 9 miles away; AUSTELL, GA)
SWEETWATER DIALYSIS (Dialysis Facility, about 9 miles away; LITHIA SPRINGS, GA)
Heliports located in Hiram:
College/University in Hiram: Vogue Beauty and Barber School Full-time enrollment: 136; Location: 3655 MacLand Rd; Private, for-profit; Website: www.VogueBeautySchool.com)
Colleges/universities with over 2000 students nearest to Hiram:
Chattahoochee Technical College (about 14 miles; Marietta, GA ; Full-time enrollment: 8,173)
Southern Polytechnic State University (about 16 miles; Marietta, GA ; FT enrollment: 5,258)
Kennesaw State University (about 17 miles; Kennesaw, GA ; FT enrollment: 21,215)
Morehouse College (about 23 miles; Atlanta, GA ; FT enrollment: 2,379)
Clark Atlanta University (about 23 miles; Atlanta, GA ; FT enrollment: 3,201)
Spelman College (about 23 miles; Atlanta, GA ; FT enrollment: 2,383)
Georgia Institute of Technology-Main Campus (about 23 miles; Atlanta, GA ; FT enrollment: 24,183)
Public high school in Hiram: HIRAM HIGH SCHOOL Students: 1,700, Location: 702 VIRGIE BALLENTINE DR, Grades: 9-12)Private high schools in Hiram: GRACE BAPTIST CHRISTIAN SCHOOL Students: 340, Location: 5790 POWDER SPRINGS DALLAS RD SW, Grades: PK-12)
GRACE BAPTIST CHRISTIAN SCHOOL Students: 334, Location: 5790 POWDER SPRINGS DALLAS RD SW, Grades: PK-12)
Public elementary/middle schools in Hiram:
See full list of schools located in Hiram Birthplace of: Ryan Lamb - College basketball player (Marshall Thundering Herd).
Paulding County has a predicted average indoor radon screening level between 2 and 4 pCi/L (pico curies per liter) - Moderate Potential Average household size: This city:
2.6 peopleGeorgia:
2.6 people
Percentage of family households: This city:
66.3%Whole state:
68.5%
Percentage of households with unmarried partners: This city:
7.0%Whole state:
5.9%
Likely homosexual households (counted as self-reported same-sex unmarried-partner households)
Lesbian couples: 0.5% of all households Gay men: 0.3% of all households
5 people in group homes intended for adults in 2010
Banks with most branches in Hiram (2011 data):
SunTrust Bank: Branch Messenger Service - Paulding, Community Trust Bank Branch, Hiram Pavilion Branch. Info updated 2010/05/27: Bank assets: $171,291.7 mil, Deposits: $129,833.2 mil, headquarters in Atlanta, GA, positive income , Commercial Lending Specialization, 1716 total offices , Holding Company: Suntrust Banks, Inc.
PNC Bank, National Association: Hiram Branch at 5749 Wendy Bagwell Pkwy, branch established on 2007/01/10; Hiram Paulding County Branch at 1430 Pace Road, branch established on 2008/04/12. Info updated 2012/03/20: Bank assets: $263,309.6 mil, Deposits: $197,343.0 mil, headquarters in Wilmington, DE, positive income , Commercial Lending Specialization, 3085 total offices , Holding Company: Pnc Financial Services Group, Inc., The
Branch Banking and Trust Company: Hiram Branch at 5071 Jimmy Lee Smith Parkway, branch established on 1996/03/22; Hiram-Plo Branch at 3357 Jimmy Lee Smith Parkway, branch established on 1998/07/06. Info updated 2010/03/29: Bank assets: $168,867.6 mil, Deposits: $127,549.5 mil, headquarters in Winston Salem, NC, positive income , Commercial Lending Specialization, 1793 total offices , Holding Company: Bb&T Corporation
Synovus Bank: Hiram Branch at 75 Metromont Road, branch established on 2003/09/02. Info updated 2011/01/25: Bank assets: $26,863.3 mil, Deposits: $22,415.0 mil, headquarters in Columbus, GA, positive income , Commercial Lending Specialization, 296 total offices , Holding Company: Synovus Financial Corp.
Wells Fargo Bank, National Association: Hiram Branch at 4580 Jimmy Lee Smith Pkwy, branch established on 1999/08/01. Info updated 2011/04/05: Bank assets: $1,161,490.0 mil, Deposits: $905,653.0 mil, headquarters in Sioux Falls, SD, positive income , 6395 total offices , Holding Company: Wells Fargo & Company
Regions Bank: Paulding Commons Branch at 4271 Jimmy Lee Smith Parkway, branch established on 1999/05/30. Info updated 2011/02/24: Bank assets: $123,368.2 mil, Deposits: $98,301.3 mil, headquarters in Birmingham, AL, positive income , Commercial Lending Specialization, 1778 total offices , Holding Company: Regions Financial Corporation
Bank of America, National Association: Hiram Banking Center Branch at 4900 Jimmy Lee Smith Parkway, branch established on 2002/04/01. Info updated 2009/11/18: Bank assets: $1,451,969.3 mil, Deposits: $1,077,176.8 mil, headquarters in Charlotte, NC, positive income , 5782 total offices , Holding Company: Bank Of America Corporation
United Community Bank: Hiram Branch at 226 Douglasville Highway, branch established on 1996/10/21. Info updated 2009/06/23: Bank assets: $6,977.4 mil, Deposits: $6,170.1 mil, headquarters in Blairsville, GA, negative income in the last year , Commercial Lending Specialization, 106 total offices , Holding Company: United Community Banks, Inc.
JPMorgan Chase Bank, National Association: Hiram Pavilion Branch at 5218 Jimmy Lee Smith Pkwy, Ste 11, branch established on 2002/07/15. Info updated 2011/11/10: Bank assets: $1,811,678.0 mil, Deposits: $1,190,738.0 mil, headquarters in Columbus, OH, positive income , International Specialization, 5577 total offices , Holding Company: Jpmorgan Chase & Co.
For population 15 years and over in Hiram:
Never married: 32.8%Now married: 47.4%Separated: 2.2%Widowed: 2.2%Divorced: 15.4% For population 25 years and over in Hiram:
High school or higher: 90.2%Bachelor's degree or higher: 37.3%Graduate or professional degree: 15.4%Unemployed: 5.9%Mean travel time to work (commute): 22.1 minutes
Education Gini index (Inequality in education) Here:
12.3Georgia average:
12.2
Religion statistics for Hiram, GA (based on Paulding County data)
Religion Adherents Congregations Evangelical Protestant 27,282 62 Mainline Protestant 5,138 14 Catholic 2,714 1 Other 1,163 4 Black Protestant 1,112 6 Orthodox 160 1 None 104,755 -
Source: Clifford Grammich, Kirk Hadaway, Richard Houseal, Dale E.Jones, Alexei Krindatch, Richie Stanley and Richard H.Taylor. 2012. 2010 U.S.Religion Census: Religious Congregations & Membership Study. Association of Statisticians of American Religious Bodies. Jones, Dale E., et al. 2002. Congregations and Membership in the United States 2000. Nashville, TN: Glenmary Research Center. Graphs represent county-level data
Food Environment Statistics: Number of grocery stores : 10Here :
0.78 / 10,000 pop.Georgia :
1.91 / 10,000 pop.
Number of supercenters and club stores : 3Paulding County :
0.24 / 10,000 pop.State :
0.15 / 10,000 pop.
Number of convenience stores (no gas) : 4This county :
0.31 / 10,000 pop.Georgia :
0.86 / 10,000 pop.
Number of convenience stores (with gas) : 36Paulding County :
2.82 / 10,000 pop.Georgia :
5.12 / 10,000 pop.
Number of full-service restaurants : 55Here :
4.31 / 10,000 pop.Georgia :
7.41 / 10,000 pop.
Adult diabetes rate : This county :
10.0%Georgia :
10.4%
Adult obesity rate : Paulding County :
29.5%State :
27.8%
Low-income preschool obesity rate : Health and Nutrition:
Average overall health of teeth and gums : Average BMI : This city:
29.3Georgia:
28.9
People feeling badly about themselves : People not drinking alcohol at all : Average hours sleeping at night : General health condition : Average condition of hearing : More about Health and Nutrition of Hiram, GA Residents
Local government employment and payroll (March 2022)
Function
Full-time employees
Monthly full-time payroll
Average yearly full-time wage
Part-time employees
Monthly part-time payroll
Police Protection - Officers
17 $77,735 $54,872 1 $166 Other Government Administration
12 $52,886 $52,886 1 $789 Water Supply
4 $23,879 $71,637 0 $0 Police - Other
3 $10,414 $41,656 0 $0 Judicial and Legal
3 $11,067 $44,268 0 $0 Financial Administration
2 $7,967 $47,802 0 $0
Totals for Government
41 $183,947 $53,838 2 $955
Hiram government finances - Expenditure in 2017 (per resident):
Construction - Regular Highways: $599,000 ($114.99)
Current Operations - Police Protection: $1,551,000 ($297.75)
Financial Administration: $664,000 ($127.47)Regular Highways: $487,000 ($93.49)Judicial and Legal Services: $349,000 ($67.00)Parks and Recreation: $163,000 ($31.29)Solid Waste Management: $129,000 ($24.76)General - Other: $126,000 ($24.19)Central Staff Services: $71,000 ($13.63)Correctional Institutions: $53,000 ($10.17)Intergovernmental to Local - Other - Correctional Institutions: $53,000 ($10.17)
Other Capital Outlay - Police Protection: $154,000 ($29.56)
Parks and Recreation: $53,000 ($10.17)
Hiram government finances - Revenue in 2017 (per resident):
Charges - Solid Waste Management: $125,000 ($24.00)
Sewerage: $41,000 ($7.87)Parks and Recreation: $41,000 ($7.87)Other: $28,000 ($5.38)Local Intergovernmental - Other: $882,000 ($169.32)
General Local Government Support: $620,000 ($119.02)Miscellaneous - Fines and Forfeits: $906,000 ($173.93)
Rents: $82,000 ($15.74)Sale of Property: $23,000 ($4.42)Donations From Private Sources: $23,000 ($4.42)Interest Earnings: $22,000 ($4.22)General Revenue - Other: $3,000 ($0.58)Revenue - Water Utilities: $62,000 ($11.90)
State Intergovernmental - General Local Government Support: $1,000 ($0.19)
Tax - Occupation and Business License - Other: $475,000 ($91.19)
Alcoholic Beverage Sales: $470,000 ($90.23)Public Utilities Sales: $439,000 ($84.28)Insurance Premiums Sales: $222,000 ($42.62)Other Selective Sales: $175,000 ($33.60)Alcoholic Beverage License: $139,000 ($26.68)Property: $118,000 ($22.65)Other: $91,000 ($17.47)Other License: $7,000 ($1.34)
Hiram government finances - Cash and Securities in 2017 (per resident):
Other Funds - Cash and Securities: $5,321,000 ($1021.50)
Businesses in Hiram, GA
Name Count Name Count
AT&T 1 McDonald's 1 Academy Sports + Outdoors 1 OfficeMax 1 Advance Auto Parts 1 Panda Express 1 Applebee's 1 Payless 1 Arby's 1 Penske 1 AutoZone 1 PetSmart 1 Best Western 1 Quiznos 1 Blockbuster 1 RadioShack 1 Buffalo Wild Wings 1 Rite Aid 1 Burger King 1 Rue21 1 Chick-Fil-A 1 Ryan's Grill 1 Cold Stone Creamery 1 Sam's Club 1 DHL 1 Sears 2 Dairy Queen 1 Sephora 1 Discount Tire 1 Sleep Inn 1 Domino's Pizza 1 Sprint Nextel 1 Dunkin Donuts 1 Staples 1 Famous Footwear 1 Starbucks 2 FedEx 5 Steak 'n Shake 1 Firestone Complete Auto Care 1 T-Mobile 3 GNC 1 Taco Bell 1 GameStop 1 Target 1 H&R Block 1 U-Haul 3 Home Depot 1 UPS 6 IHOP 1 Vans 1 JCPenney 1 Verizon Wireless 1 Kmart 1 Waffle House 1 Kohl's 1 Walmart 1 Kroger 1 Wendy's 1 Marshalls 1
Strongest AM radio stations in Hiram:
WMLB (1160 AM; 50 kW; EAST POINT, GA; Owner: ATLANTA AREA BROADCASTING, INC.)
WFTD (1080 AM; daytime; 50 kW; MARIETTA, GA; Owner: PRIETO ENTERPRISES, INC.)
WAOS (1600 AM; 20 kW; AUSTELL, GA; Owner: LA FAVORITA, INC.)
WGST (640 AM; 50 kW; ATLANTA, GA; Owner: CITICASTERS LICENSES, L.P.)
WAZX (1550 AM; 50 kW; SMYRNA, GA; Owner: GA-MEX BROADCASTING, INC.)
WDWD (590 AM; 5 kW; ATLANTA, GA; Owner: ABC, INC.)
WAOK (1380 AM; 50 kW; ATLANTA, GA; Owner: INFINITY BROADCASTING OPERATIONS, INC.)
WDPC (1500 AM; 5 kW; DALLAS, GA; Owner: WORD CHRISTIAN BROADCASTING, INC.)
WCNN (680 AM; 50 kW; NORTH ATLANTA, GA; Owner: DICKEY BROADCASTING COMPANY)
WSB (750 AM; 50 kW; ATLANTA, GA; Owner: CXR HOLDINGS, INC.)
WQXI (790 AM; 28 kW; ATLANTA, GA; Owner: JEFFERSON-PILOT COMMUNICATIONS COMPANY OF GEORGIA)
WKNG (1060 AM; daytime; 50 kW; TALLAPOOSA, GA; Owner: WKNG, INC.)
WGUN (1010 AM; 50 kW; ATLANTA, GA; Owner: WGUN, INC.)
Strongest FM radio stations in Hiram:
WWWQ (100.5 FM; ANNISTON, AL; Owner: WNNX LICO, INC.)
WNNX (99.7 FM; ATLANTA, GA; Owner: WNNX LICO, INC.)
WRFG (89.3 FM; ATLANTA, GA; Owner: RADIO FREE GEORGIA BROADCASTING FOUNDATION INC)
WKHX-FM (101.5 FM; MARIETTA, GA; Owner: ABC, INC.)
WCCV (91.7 FM; CARTERSVILLE, GA; Owner: IMMANUEL BROADCASTING NETWORK, INC.)
W214AS (90.7 FM; WALESKA, GA; Owner: CALVARY CHAPEL OF TWIN FALLS, INC.)
WKLS (96.1 FM; ATLANTA, GA; Owner: CITICASTERS LICENSES, L.P.)
WLTM (94.9 FM; ATLANTA, GA; Owner: CITICASTERS LICENSES, L.P.)
W221AW (92.1 FM; NORTH CANTON, GA; Owner: IMMANUEL BROADCASTING NETWORK, INC.)
WSB-FM (98.5 FM; ATLANTA, GA; Owner: CXR HOLDINGS, INC.)
WSTR (94.1 FM; SMYRNA, GA; Owner: JEFFERSON-PILOT COMMUNICATIONS COMPANY OF GEORGIA)
WVEE (103.3 FM; ATLANTA, GA; Owner: INFINITY BROADCASTING OPERATIONS, INC.)
WZGC (92.9 FM; ATLANTA, GA; Owner: INFINITY BROADCASTING CORP. OF ATLANTA)
WLCL (105.7 FM; CANTON, GA; Owner: CHEROKEE BROADCASTING CO., INC.)
WALR-FM (104.1 FM; LA GRANGE, GA; Owner: CXR HOLDINGS, INC.)
W265BD (100.9 FM; WOODSTOCK, GA; Owner: IMMANUEL BROADCASTING NETWORK, INC.)
WJCK (88.3 FM; PIEDMONT, AL; Owner: IMMANUEL BROADCASTING NETWORK, INC.)
WAMJ (102.5 FM; MABLETON, GA; Owner: NEW MABLETON BROADCASTING CORPORATION)
WBTR-FM (92.1 FM; CARROLLTON, GA; Owner: WYAI, INC.)
WMAX-FM (105.3 FM; BOWDON, GA; Owner: CLEAR CHANNEL BROADCASTING LICENSES, INC.)
TV broadcast stations around Hiram:
WUVG (Channel 34; ATHENS, GA; Owner: UNIVISION ATLANTA LLC)
WAGA (Channel 5; ATLANTA, GA; Owner: FOX TELEVISION STATIONS, INC.)
WSB-TV (Channel 2; ATLANTA, GA; Owner: WSB-TV HOLDINGS, INC.)
WXIA-TV (Channel 11; ATLANTA, GA; Owner: GANNETT GEORGIA, L.P.)
WATL (Channel 36; ATLANTA, GA; Owner: WATL, LLC)
WTBS (Channel 17; ATLANTA, GA; Owner: SUPERSTATION, INC.)
WGCL-TV (Channel 46; ATLANTA, GA; Owner: MEREDITH CORPORATION)
WANN-LP (Channel 32; ATLANTA, GA; Owner: PRISM BROADCASTING NETWORK, INC.)
WDTA-LP (Channel 53; FAYETTEVILLE, GA; Owner: WORD OF GOD FELLOWSHIP, INC.)
WHSG (Channel 63; MONROE, GA; Owner: TRINITY BROADCASTING NETWORK)
WUPA (Channel 69; ATLANTA, GA; Owner: VIACOM STATIONS GROUP OF ATLANTA INC.)
WSKC-LP (Channel 59; ATLANTA, GA; Owner: KM LPTV OF ATLANTA, L.L.C.)
WTHC-LP (Channel 42; ATLANTA, GA; Owner: THE ATLANTA CHANNEL, INC.)
WPBA (Channel 30; ATLANTA, GA; Owner: BOARD OF EDUCATION OF THE CITY OF ATLANTA)
WANX-LP (Channel 26; ATLANTA, GA; Owner: PRISM BROADCASTING NETWORK, INC.)
WIRE-CA (Channel 40; ATLANTA, GA; Owner: COMMERCIAL BROADCASTING CORP.)
W04DB (Channel 4; ATLANTA, GA; Owner: VVILPTV, INC.)
W24AL (Channel 24; ATLANTA, GA; Owner: VENTANA TELEVISION, INC.)
WPXA (Channel 14; ROME, GA; Owner: PAXSON ATLANTA LICENSE, INC.)
WATC (Channel 57; ATLANTA, GA; Owner: COMMUNITY TELEVISION, INC.)
W38CU (Channel 38; ATLANTA, GA; Owner: KOREAN AMERICAN TV BROADCASTING CORP.)
Hiram, Georgia
Fatal accident count 61 Vehicles involved in fatal accidents 103 Fatal accidents involving drunk persons: 8 Fatalities 61 Persons involved in fatal accidents 162 Pedestrians involved in fatal accidents 9
Georgia average
Fatal accident count 43300 Vehicles involved in fatal accidents 66635 Fatal accidents involving drunk persons 13008 Fatalities 47977 Persons involved in fatal accidents 108812 Pedestrians involved in fatal accidents 4914
See more detailed statistics of Hiram fatal car crashes and road traffic accidents for 1975 - 2021 here
National Bridge Inventory (NBI) Statistics 33 Number of bridges436ft / 133m Total length $246,013,000 Total costs292,856 Total average daily traffic9,282 Total average daily truck traffic
New bridges - historical statistics
1 1930-1939 2 1940-1949 1 1950-1959 4 1960-1969 4 1970-1979 3 1980-1989 4 1990-1999 5 2000-2009 5 2010-2019 1 2020-2022
See full National Bridge Inventory statistics for Hiram, GA
FCC Registered Antenna Towers: 69 (
See the full list of FCC Registered Antenna Towers in Hiram )
FCC Registered Broadcast Land Mobile Towers: 13 (
See the full list of FCC Registered Broadcast Land Mobile Towers in Hiram, GA )
FCC Registered Microwave Towers: 6
ATL DRN, 9090 Ridge Rd (Lat: 33.831750 Lon: -84.784083), Overall height: 60 m, Call Sign: WMS422, Assigned Frequencies: 2144.40 MHz, Grant Date: 02/06/2001, Expiration Date: 02/01/2011, Cancellation Date: 04/10/2001, Registrant: Cingular Wireless LLC, 17330 Preston Road, Suite 100a, Dallas, TX 75252, Phone: (972) 733-2349, Fax: (972) 733-2852, Email:
North Austell, 3708 Rosedale Rd (Lat: 33.879722 Lon: -84.726000), Type: Pole, Structure height: 54.9 m, Overall height: 56.7 m, Call Sign: WQIE417, Assigned Frequencies: 11525.0 MHz, Grant Date: 01/16/2008, Expiration Date: 01/16/2018, Cancellation Date: 07/16/2009, Certifier: William Chastain, Registrant: Radio Dynamics Corporation, 774 Mays Blvd., #10-465, Silver Spring, MD 20914, Phone: (301) 493-5171, Fax: (301) 576-4553, Email:
HIRAM, Lat: 33.876000 Lon: -84.760056, Call Sign: WQKI505, Assigned Frequencies: 956.368 MHz, Grant Date: 06/04/2019, Expiration Date: 06/02/2029, Certifier: Joseph Palmer, Registrant: Sensus, 450 N Gallatin Avenue, Uniontown, PA 15401, Phone: (800) 638-3748, Fax: (800) 888-2403, Email:
AT72XC012, 814 Phillips Lee Road (Lat: 33.878806 Lon: -84.797639), Type: Mtower, Structure height: 58 m, Overall height: 60.3 m, Call Sign: WQQZ251, Assigned Frequencies: 11505.0 MHz, 11505.0 MHz, 11505.0 MHz, 11505.0 MHz, 11505.0 MHz, 11505.0 MHz, Grant Date: 03/28/2013, Expiration Date: 03/28/2023, Cancellation Date: 08/09/2013, Certifier: Kyle B Entz, Registrant: Sprint Nextel Corporation, 12502 Sunrise Valley Drive, Reston, VA 20196, Phone: (703) 433-4000, Fax: (703) 433-4483 SUDIE, Parcel 6130-07-03.01 Off Hiram Suide Rd (At2132) (Lat: 33.863944 Lon: -84.794750), Type: Mtower, Structure height: 59.7 m, Overall height: 60.6 m, Call Sign: WQTR709, Assigned Frequencies: 11115.0 MHz, 11185.0 MHz, Grant Date: 02/27/2024, Expiration Date: 03/31/2034, Certifier: Gregory M Romano, Registrant: Verizon, 5055 Northpointe Pkwy, Alpharetta, GA 30022, Phone: (770) 797-1070, Email:
POAG CRSSING, 8024 Poag Crossing (Lat: 33.878889 Lon: -84.747500), Type: Ltower, Structure height: 76.8 m, Overall height: 78.6 m, Call Sign: WRER459, Assigned Frequencies: 10975.0 MHz, 11015.0 MHz, 10975.0 MHz, 11015.0 MHz, 10975.0 MHz, 11015.0 MHz, 10975.0 MHz, 11015.0 MHz, 10975.0 MHz, 11015.0 MHz, Grant Date: 12/05/2019, Expiration Date: 12/05/2029, Certifier: Laurie Gebhardt, Registrant: Cellco Partnership, 5055 North Point Pkwy Np2ne Network Engineering, Alpharetta, GA 30022, Phone: (770) 797-1070, Email:
FCC Registered Amateur Radio Licenses: 88 (
See the full list of FCC Registered Amateur Radio Licenses in Hiram )
FAA Registered Aircraft: 7
Aircraft: BELL 206L-3 (Category: Land, Seats: 7, Weight: 12,500 - 19,999 Pounds), Engine: ALLISON 250-C30 SER (650 HP) (Turbo-shaft)N-Number: 426HA, N426HA, N-426HA, Serial Number: 51394, Year manufactured: 1990, Airworthiness Date: 07/01/1996, Certificate Issue Date: 11/10/2010Registrant (LLC): Rotorworks LLC, 165 Commodore Path, Hiram, GA 30141Aircraft: MCDONNELL DOUGLAS HELICOPTER 600N (Category: Land, Seats: 6, Weight: Up to 12,499 Pounds), Engine: ROLLS-ROYC 250-C47M (650 HP) (Turbo-shaft)N-Number: 507CC, N507CC, N-507CC, Serial Number: RN007, Year manufactured: 1997, Airworthiness Date: 06/09/2009, Certificate Issue Date: 09/17/2008Registrant (LLC): Rotorworks LLC, 204 Greenfield Rd, Hiram, GA 30141Aircraft: CESSNA 150M (Category: Land, Seats: 2, Weight: Up to 12,499 Pounds, Speed: 81 mph), Engine: CONT MOTOR 0-200 SERIES (100 HP) (4 Cycle)N-Number: 66199, N66199, N-66199, Serial Number: 15075914, Year manufactured: 1974, Airworthiness Date: 07/26/1974, Certificate Issue Date: 08/22/2006Registrant (Individual): Chris S Cunningham, 171 Poplar Farms Dr, Hiram, GA 30141Aircraft: PIPER PA-28-180 (Category: Land, Seats: 4, Weight: Up to 12,499 Pounds, Speed: 107 mph), Engine: LYCOMING O&VO-360 SER (180 HP) (Reciprocating)N-Number: 8599N, N8599N, N-8599N, Serial Number: 28-7105146, Year manufactured: 1971, Airworthiness Date: 05/07/1971, Certificate Issue Date: 11/16/2019Registrant (LLC): Eaglewood Estates LLC, 226 Five Oaks Dr, Hiram, GA 30141Aircraft: CESSNA 150L (Category: Land, Seats: 2, Weight: Up to 12,499 Pounds, Speed: 90 mph), Engine: CONT MOTOR 0-200 SERIES (100 HP) (Reciprocating)N-Number: 1472Q, N1472Q, N-1472Q, Serial Number: 15072772, Year manufactured: 1972, Airworthiness Date: 05/13/1977, Certificate Issue Date: 02/03/2010Registrant (Individual): Louis E Clemmons, 198 Lake Swan Ct, Hiram, GA 30141Deregistered: Cancel Date: 01/11/2018Aircraft: CESSNA 150L (Category: Land, Seats: 2, Weight: Up to 12,499 Pounds, Speed: 90 mph), Engine: CONT MOTOR 0-200 SERIES (100 HP) (Reciprocating)N-Number: 5261Q, N5261Q, N-5261Q, Serial Number: 15073161, Year manufactured: 1972, Airworthiness Date: 01/19/1972, Certificate Issue Date: 07/28/2015Registrant (Individual): Louis E Clemmons, 198 Lake Swan Ct, Hiram, GA 30141Deregistered: Cancel Date: 09/05/2018, Exported to: CanadaAircraft: MCDONNELL DOUGLAS HELICOPTER 369E (Category: Land, Seats: 4, Weight: Up to 12,499 Pounds), Engine: ALLISON 250-C20 SER (420 HP) (Turbo-shaft)N-Number: 444RS, N444RS, N-444RS, Serial Number: 0441E, Year manufactured: 1990, Airworthiness Date: 11/28/1991, Certificate Issue Date: 10/28/2009Registrant (Corporation): Rotorworks LLC, 165 Commodore Path, Hiram, GA 30141Deregistered: Cancel Date: 05/26/2016
Home Mortgage Disclosure Act Aggregated Statistics For Year 2009(Based on 6 partial tracts) A) FHA, FSA/RHS & VA B) Conventional C) Refinancings D) Home Improvement Loans F) Non-occupant Loans on Number Average Value Number Average Value Number Average Value Number Average Value Number Average Value
LOANS ORIGINATED 20 $116,897 5 $101,904 28 $149,759 1 $46,910 4 $105,662 APPLICATIONS APPROVED, NOT ACCEPTED 1 $69,030 0 $0 3 $152,603 0 $0 0 $0 APPLICATIONS DENIED 3 $127,087 1 $81,840 16 $141,597 1 $51,710 0 $0 APPLICATIONS WITHDRAWN 2 $111,630 1 $104,140 11 $153,710 0 $0 1 $68,610 FILES CLOSED FOR INCOMPLETENESS 1 $92,490 0 $0 2 $162,800 0 $0 0 $0
Aggregated Statistics For Year 2008(Based on 6 partial tracts) A) FHA, FSA/RHS & VA B) Conventional C) Refinancings D) Home Improvement Loans F) Non-occupant Loans on G) Loans On Manufactured Number Average Value Number Average Value Number Average Value Number Average Value Number Average Value Number Average Value
LOANS ORIGINATED 17 $141,470 11 $127,611 25 $140,082 2 $37,995 6 $115,887 1 $44,930 APPLICATIONS APPROVED, NOT ACCEPTED 1 $139,720 0 $0 4 $141,900 0 $0 0 $0 0 $0 APPLICATIONS DENIED 2 $112,630 3 $100,137 22 $144,511 4 $52,278 1 $131,000 0 $0 APPLICATIONS WITHDRAWN 2 $182,350 2 $87,380 10 $145,965 0 $0 1 $70,710 0 $0 FILES CLOSED FOR INCOMPLETENESS 0 $0 1 $100,280 1 $237,070 0 $0 0 $0 0 $0
Aggregated Statistics For Year 2007(Based on 6 partial tracts) A) FHA, FSA/RHS & VA B) Conventional C) Refinancings D) Home Improvement Loans F) Non-occupant Loans on G) Loans On Manufactured Number Average Value Number Average Value Number Average Value Number Average Value Number Average Value Number Average Value
LOANS ORIGINATED 9 $147,747 32 $132,491 32 $125,957 4 $45,758 8 $114,476 0 $0 APPLICATIONS APPROVED, NOT ACCEPTED 0 $0 3 $114,857 8 $131,550 1 $63,240 1 $136,810 0 $0 APPLICATIONS DENIED 2 $118,360 8 $132,594 40 $139,376 8 $62,150 3 $95,723 1 $47,480 APPLICATIONS WITHDRAWN 1 $112,460 5 $121,654 17 $142,363 2 $68,725 1 $104,640 0 $0 FILES CLOSED FOR INCOMPLETENESS 0 $0 2 $172,920 4 $170,410 0 $0 0 $0 0 $0
Aggregated Statistics For Year 2006(Based on 6 partial tracts) A) FHA, FSA/RHS & VA B) Conventional C) Refinancings D) Home Improvement Loans F) Non-occupant Loans on Number Average Value Number Average Value Number Average Value Number Average Value Number Average Value
LOANS ORIGINATED 12 $156,125 65 $106,664 39 $121,791 5 $49,806 15 $99,706 APPLICATIONS APPROVED, NOT ACCEPTED 0 $0 6 $107,600 7 $115,450 2 $29,205 1 $103,400 APPLICATIONS DENIED 1 $189,500 15 $105,571 39 $129,183 7 $40,753 3 $97,330 APPLICATIONS WITHDRAWN 2 $146,190 10 $97,346 24 $127,358 2 $75,925 1 $112,610 FILES CLOSED FOR INCOMPLETENESS 0 $0 2 $128,710 6 $131,577 0 $0 0 $0
Aggregated Statistics For Year 2005(Based on 6 partial tracts) A) FHA, FSA/RHS & VA B) Conventional C) Refinancings D) Home Improvement Loans F) Non-occupant Loans on G) Loans On Manufactured Number Average Value Number Average Value Number Average Value Number Average Value Number Average Value Number Average Value
LOANS ORIGINATED 11 $138,970 63 $103,567 46 $113,255 6 $34,845 13 $96,894 0 $0 APPLICATIONS APPROVED, NOT ACCEPTED 0 $0 5 $99,200 8 $116,829 1 $48,410 2 $85,190 0 $0 APPLICATIONS DENIED 1 $100,760 11 $103,633 38 $122,530 6 $44,497 3 $102,380 1 $83,400 APPLICATIONS WITHDRAWN 1 $177,870 8 $102,072 24 $125,266 4 $118,582 2 $75,500 0 $0 FILES CLOSED FOR INCOMPLETENESS 0 $0 2 $88,895 12 $133,314 0 $0 0 $0 0 $0
Aggregated Statistics For Year 2004(Based on 6 partial tracts) A) FHA, FSA/RHS & VA B) Conventional C) Refinancings D) Home Improvement Loans F) Non-occupant Loans on G) Loans On Manufactured Number Average Value Number Average Value Number Average Value Number Average Value Number Average Value Number Average Value
LOANS ORIGINATED 15 $127,518 44 $107,486 47 $119,611 5 $49,436 9 $109,701 1 $32,930 APPLICATIONS APPROVED, NOT ACCEPTED 0 $0 3 $117,283 10 $119,289 0 $0 1 $106,520 0 $0 APPLICATIONS DENIED 1 $181,350 7 $100,096 31 $122,806 6 $35,440 2 $71,555 1 $66,420 APPLICATIONS WITHDRAWN 1 $148,790 3 $100,833 17 $120,494 1 $26,580 1 $75,000 0 $0 FILES CLOSED FOR INCOMPLETENESS 0 $0 2 $106,285 8 $133,110 0 $0 0 $0 0 $0
Aggregated Statistics For Year 2003(Based on 6 partial tracts) A) FHA, FSA/RHS & VA B) Conventional C) Refinancings D) Home Improvement Loans F) Non-occupant Loans on Number Average Value Number Average Value Number Average Value Number Average Value Number Average Value
LOANS ORIGINATED 13 $125,182 30 $116,395 86 $115,434 3 $27,650 7 $83,391 APPLICATIONS APPROVED, NOT ACCEPTED 0 $0 3 $94,237 9 $113,853 1 $13,370 0 $0 APPLICATIONS DENIED 1 $161,420 5 $113,694 23 $109,634 4 $25,142 1 $128,490 APPLICATIONS WITHDRAWN 1 $64,520 3 $111,290 15 $114,518 0 $0 1 $69,650 FILES CLOSED FOR INCOMPLETENESS 0 $0 1 $96,360 4 $114,482 0 $0 0 $0
Aggregated Statistics For Year 2002(Based on 4 partial tracts) A) FHA, FSA/RHS & VA B) Conventional C) Refinancings D) Home Improvement Loans F) Non-occupant Loans on Number Average Value Number Average Value Number Average Value Number Average Value Number Average Value
LOANS ORIGINATED 15 $131,130 24 $117,107 56 $108,525 3 $39,643 4 $87,082 APPLICATIONS APPROVED, NOT ACCEPTED 0 $0 2 $113,620 7 $104,214 1 $14,890 0 $0 APPLICATIONS DENIED 1 $112,580 3 $107,353 21 $92,829 3 $22,977 0 $0 APPLICATIONS WITHDRAWN 1 $79,860 2 $138,165 16 $107,405 1 $18,750 1 $80,190 FILES CLOSED FOR INCOMPLETENESS 0 $0 1 $129,660 8 $102,281 0 $0 0 $0
Aggregated Statistics For Year 2001(Based on 4 partial tracts) A) FHA, FSA/RHS & VA B) Conventional C) Refinancings D) Home Improvement Loans F) Non-occupant Loans on Number Average Value Number Average Value Number Average Value Number Average Value Number Average Value
LOANS ORIGINATED 18 $125,178 23 $118,780 49 $103,009 3 $30,943 5 $98,092 APPLICATIONS APPROVED, NOT ACCEPTED 0 $0 2 $72,425 5 $98,604 1 $35,000 0 $0 APPLICATIONS DENIED 1 $139,580 4 $91,232 23 $79,613 3 $14,257 1 $77,150 APPLICATIONS WITHDRAWN 1 $103,720 2 $86,450 12 $95,656 1 $24,380 1 $67,140 FILES CLOSED FOR INCOMPLETENESS 0 $0 0 $0 4 $90,622 0 $0 0 $0
Aggregated Statistics For Year 2000(Based on 4 partial tracts) A) FHA, FSA/RHS & VA B) Conventional C) Refinancings D) Home Improvement Loans F) Non-occupant Loans on Number Average Value Number Average Value Number Average Value Number Average Value Number Average Value
LOANS ORIGINATED 14 $113,194 15 $97,829 14 $73,621 3 $17,457 3 $97,907 APPLICATIONS APPROVED, NOT ACCEPTED 0 $0 1 $118,740 3 $73,907 2 $19,140 0 $0 APPLICATIONS DENIED 2 $84,460 4 $62,232 13 $61,240 4 $25,150 1 $36,880 APPLICATIONS WITHDRAWN 2 $83,005 2 $115,195 7 $87,840 1 $19,740 1 $36,610 FILES CLOSED FOR INCOMPLETENESS 0 $0 0 $0 2 $74,755 0 $0 0 $0
Aggregated Statistics For Year 1999(Based on 5 partial tracts) A) FHA, FSA/RHS & VA B) Conventional C) Refinancings D) Home Improvement Loans F) Non-occupant Loans on Number Average Value Number Average Value Number Average Value Number Average Value Number Average Value
LOANS ORIGINATED 15 $101,404 17 $101,312 20 $81,336 4 $14,252 2 $44,775 APPLICATIONS APPROVED, NOT ACCEPTED 0 $0 2 $64,750 4 $77,415 1 $27,230 0 $0 APPLICATIONS DENIED 2 $84,440 5 $72,004 11 $64,457 4 $23,925 0 $0 APPLICATIONS WITHDRAWN 1 $59,960 2 $55,820 6 $79,180 1 $23,060 0 $0 FILES CLOSED FOR INCOMPLETENESS 0 $0 0 $0 2 $77,660 0 $0 0 $0
Detailed HMDA statistics for the following Tracts:
1202.01
, 1202.02 , 1203.00 , 1205.00
Private Mortgage Insurance Companies Aggregated Statistics For Year 2009(Based on 6 partial tracts) A) Conventional B) Refinancings Number Average Value Number Average Value
LOANS ORIGINATED 1 $77,290 2 $124,465 APPLICATIONS APPROVED, NOT ACCEPTED 1 $68,100 0 $0 APPLICATIONS DENIED 0 $0 0 $0 APPLICATIONS WITHDRAWN 0 $0 0 $0 FILES CLOSED FOR INCOMPLETENESS 0 $0 0 $0
Aggregated Statistics For Year 2008(Based on 6 partial tracts) A) Conventional B) Refinancings C) Non-occupant Loans on Number Average Value Number Average Value Number Average Value
LOANS ORIGINATED 5 $146,976 4 $136,860 1 $135,040 APPLICATIONS APPROVED, NOT ACCEPTED 2 $128,860 2 $211,265 1 $77,220 APPLICATIONS DENIED 1 $70,040 0 $0 0 $0 APPLICATIONS WITHDRAWN 0 $0 0 $0 0 $0 FILES CLOSED FOR INCOMPLETENESS 0 $0 0 $0 0 $0
Aggregated Statistics For Year 2007(Based on 6 partial tracts) A) Conventional B) Refinancings C) Non-occupant Loans on Number Average Value Number Average Value Number Average Value
LOANS ORIGINATED 15 $157,959 6 $155,900 2 $114,295 APPLICATIONS APPROVED, NOT ACCEPTED 2 $186,110 1 $203,630 0 $0 APPLICATIONS DENIED 0 $0 0 $0 0 $0 APPLICATIONS WITHDRAWN 1 $96,610 1 $100,070 0 $0 FILES CLOSED FOR INCOMPLETENESS 0 $0 0 $0 0 $0
Aggregated Statistics For Year 2006(Based on 6 partial tracts) A) Conventional B) Refinancings C) Non-occupant Loans on Number Average Value Number Average Value Number Average Value
LOANS ORIGINATED 8 $152,721 3 $149,833 1 $178,620 APPLICATIONS APPROVED, NOT ACCEPTED 1 $141,900 1 $100,150 0 $0 APPLICATIONS DENIED 0 $0 0 $0 0 $0 APPLICATIONS WITHDRAWN 0 $0 0 $0 0 $0 FILES CLOSED FOR INCOMPLETENESS 0 $0 0 $0 0 $0
Aggregated Statistics For Year 2005(Based on 6 partial tracts) A) Conventional B) Refinancings C) Non-occupant Loans on Number Average Value Number Average Value Number Average Value
LOANS ORIGINATED 7 $147,043 4 $145,840 2 $108,995 APPLICATIONS APPROVED, NOT ACCEPTED 1 $112,640 0 $0 0 $0 APPLICATIONS DENIED 0 $0 0 $0 0 $0 APPLICATIONS WITHDRAWN 0 $0 0 $0 0 $0 FILES CLOSED FOR INCOMPLETENESS 0 $0 0 $0 0 $0
Aggregated Statistics For Year 2004(Based on 6 partial tracts) A) Conventional B) Refinancings C) Non-occupant Loans on Number Average Value Number Average Value Number Average Value
LOANS ORIGINATED 7 $131,814 6 $149,140 1 $146,450 APPLICATIONS APPROVED, NOT ACCEPTED 1 $183,860 2 $155,725 0 $0 APPLICATIONS DENIED 0 $0 0 $0 0 $0 APPLICATIONS WITHDRAWN 0 $0 1 $87,050 0 $0 FILES CLOSED FOR INCOMPLETENESS 0 $0 0 $0 0 $0
Aggregated Statistics For Year 2003(Based on 6 partial tracts) A) Conventional B) Refinancings C) Non-occupant Loans on Number Average Value Number Average Value Number Average Value
LOANS ORIGINATED 9 $129,622 16 $128,845 1 $141,590 APPLICATIONS APPROVED, NOT ACCEPTED 1 $102,920 3 $138,217 0 $0 APPLICATIONS DENIED 0 $0 0 $0 0 $0 APPLICATIONS WITHDRAWN 1 $70,250 1 $203,090 0 $0 FILES CLOSED FOR INCOMPLETENESS 0 $0 0 $0 0 $0
Aggregated Statistics For Year 2002(Based on 4 partial tracts) A) Conventional B) Refinancings C) Non-occupant Loans on Number Average Value Number Average Value Number Average Value
LOANS ORIGINATED 10 $140,011 12 $121,557 1 $54,940 APPLICATIONS APPROVED, NOT ACCEPTED 1 $194,660 2 $118,190 0 $0 APPLICATIONS DENIED 0 $0 0 $0 0 $0 APPLICATIONS WITHDRAWN 1 $71,870 1 $81,990 0 $0 FILES CLOSED FOR INCOMPLETENESS 0 $0 0 $0 0 $0
Aggregated Statistics For Year 2001(Based on 4 partial tracts) A) Conventional B) Refinancings C) Non-occupant Loans on Number Average Value Number Average Value Number Average Value
LOANS ORIGINATED 11 $129,846 9 $121,750 1 $104,650 APPLICATIONS APPROVED, NOT ACCEPTED 1 $162,260 1 $142,010 0 $0 APPLICATIONS DENIED 0 $0 0 $0 0 $0 APPLICATIONS WITHDRAWN 0 $0 0 $0 0 $0 FILES CLOSED FOR INCOMPLETENESS 0 $0 0 $0 0 $0
Aggregated Statistics For Year 2000(Based on 4 partial tracts) A) Conventional B) Refinancings Number Average Value Number Average Value
LOANS ORIGINATED 7 $112,544 1 $156,140 APPLICATIONS APPROVED, NOT ACCEPTED 0 $0 0 $0 APPLICATIONS DENIED 0 $0 0 $0 APPLICATIONS WITHDRAWN 0 $0 0 $0 FILES CLOSED FOR INCOMPLETENESS 0 $0 0 $0
Aggregated Statistics For Year 1999(Based on 5 partial tracts) A) Conventional B) Refinancings Number Average Value Number Average Value
LOANS ORIGINATED 6 $116,092 3 $122,780 APPLICATIONS APPROVED, NOT ACCEPTED 1 $80,950 0 $0 APPLICATIONS DENIED 0 $0 0 $0 APPLICATIONS WITHDRAWN 0 $0 0 $0 FILES CLOSED FOR INCOMPLETENESS 0 $0 0 $0
Detailed PMIC statistics for the following Tracts:
1202.01
, 1202.02 , 1203.00 , 1205.00 Fire-safe hotels and motels in Hiram, Georgia:
Country Inn & Suites Hiram, 70 Enterprise Path, Hiram, Georgia 30141 Phone: (770) 222-0456, Fax: (770) 222-7436
Sleep Inn & Suites, 181 Metromont Rd, Hiram, Georgia 30141 Phone: (770) 222-9161, Fax: (770) 222-9173
All 2 fire-safe hotels and motels in Hiram, Georgia
Most common first names in Hiram, GA among deceased individuals Name Count Lived (average)
James 66 68.1 years William 45 70.6 years Mary 39 76.0 years John 36 76.1 years Ruby 20 78.3 years Robert 18 67.4 years Ruth 16 76.9 years Annie 16 75.9 years George 16 75.0 years Charles 15 71.5 years
Most common last names in Hiram, GA among deceased individuals Last name Count Lived (average)
Smith 42 76.8 years Jones 17 69.9 years Hardy 15 74.3 years Turner 15 76.3 years Rakestraw 13 77.7 years Brown 12 64.9 years Harris 11 79.6 years Driskell 11 77.3 years Mitchell 11 76.4 years Lester 11 75.4 years
Hiram compared to Georgia state average:
Unemployed percentage below state average. Black race population percentage significantly above state average. Hispanic race population percentage significantly above state average. Median age below state average. Foreign-born population percentage significantly above state average. House age below state average. Number of college students significantly above state average. Percentage of population with a bachelor's degree or higher above state average.
#12 on the list of "Top 100 least-safe cities (highest city-data.com crime index)"
#20 on the list of "Top 101 cities with the most residents born in Nigeria (population 500+)"
#76 on the list of "Top 101 cities with the most residents born in Western Africa (population 500+)"
#9 on the list of "Top 101 counties with the lowest lead air pollution readings in 2012 (µg/m3 )"
#14 on the list of "Top 101 counties with the highest lead air pollution readings in 2012 (µg/m3 )"
#21 on the list of "Top 101 counties with the highest carbon monoxide air pollution readings in 2012 (ppm)"
#30 on the list of "Top 101 counties with the lowest number of deaths per 1000 residents 2007-2013 (pop. 50,000+)"
#43 on the list of "Top 101 counties with the lowest ground withdrawal of fresh water for public supply (pop. 50,000+)"
Top Patent Applicants
Timothy M. Waters (42)
Kenneth Charles Smith (22)
Timothy Moffett Waters (15)
Kenneth C. Smith (7)
Stanley G. Stratton (6)
Christopher Nelson (6)
Marcus Lee Hutchins (4)
Edward W. Jones (4)
Thomas M. Dean (2)
Christopher Briggs (2)
Total of 132 patent applications in 2008-2024.
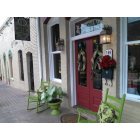
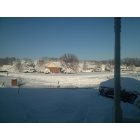
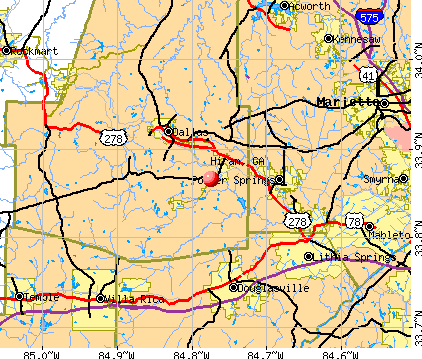


 Recent articles from our blog. Our writers, many of them Ph.D. graduates or candidates, create easy-to-read articles on a wide variety of topics.

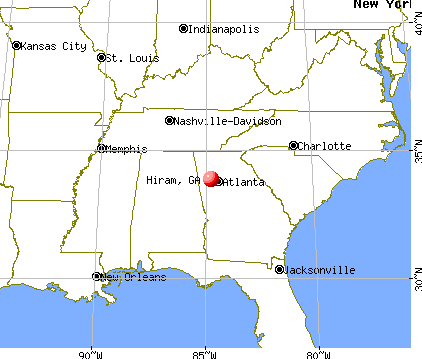
 (14.7 miles
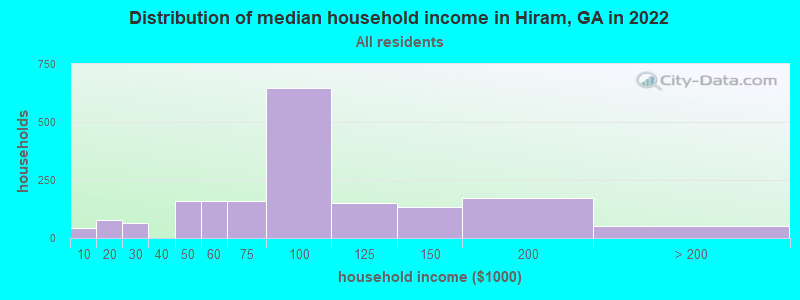


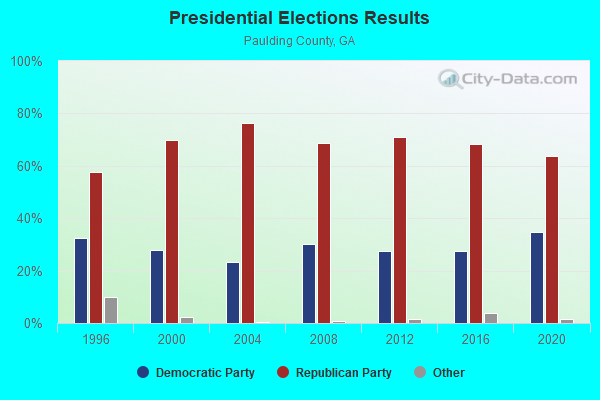
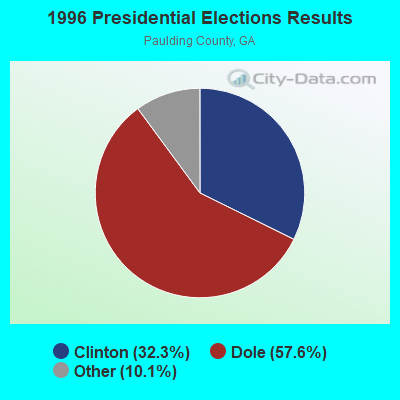
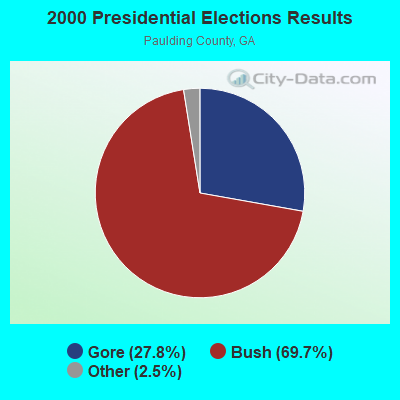
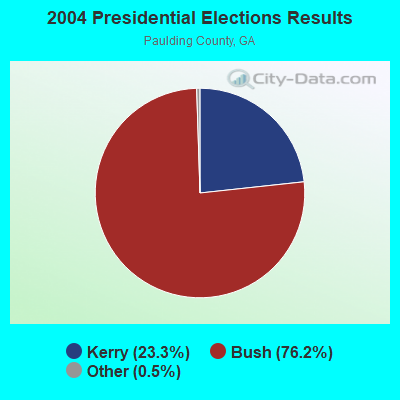
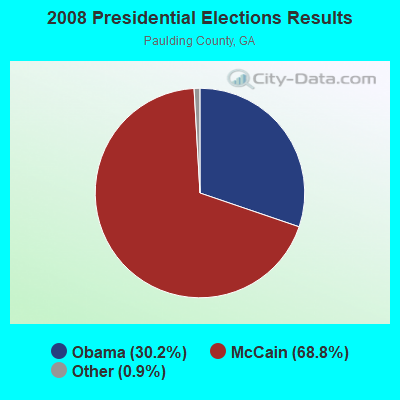

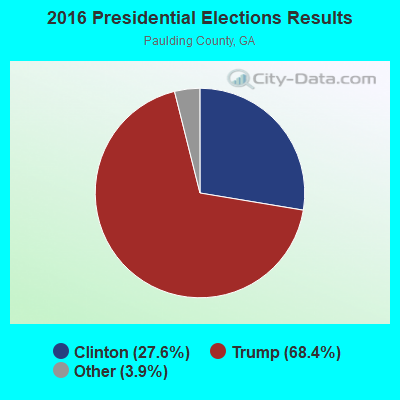

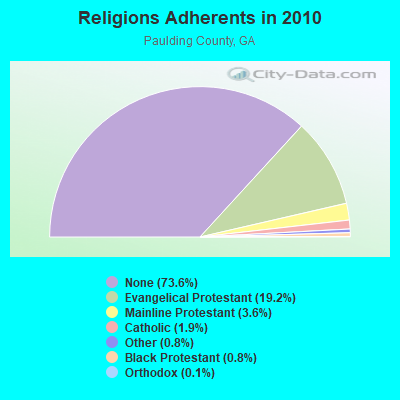
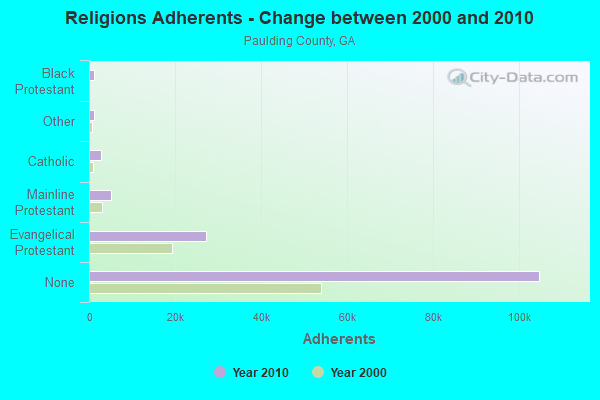


 According to the data from the years 2002 - 2018 the average number of fire incidents per year is 71. The highest number of fires - 159 took place in 2009, and the least - 10 in 2005. The data has a growing trend.
 When looking into fire subcategories, the most incidents belonged to: Outside Fires (51.8%), and Structure Fires (24.4%).

