Florida City, Florida Submit your own pictures of this city and show them to the world
OSM Map
General Map
Google Map
MSN Map
OSM Map
General Map
Google Map
MSN Map
OSM Map
General Map
Google Map
MSN Map
OSM Map
General Map
Google Map
MSN Map
Please wait while loading the map...
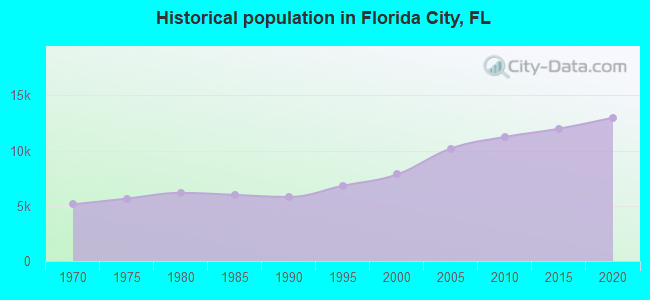
Population in 2022: 12,644 (100% urban, 0% rural). Population change since 2000: +61.2%Males: 5,963 Females: 6,681
March 2022 cost of living index in Florida City: 102.7 (near average, U.S. average is 100) Percentage of residents living in poverty in 2022: 32.6%for White Non-Hispanic residents , 35.8% for Black residents , 30.3% for Hispanic or Latino residents , 15.1% for other race residents , 25.4% for two or more races residents )
Profiles of local businesses
Business Search - 14 Million verified businesses
Data:
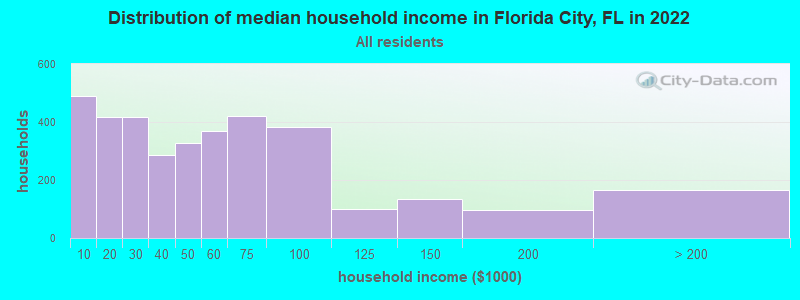
Median household income ($)
Median household income (% change since 2000)
Household income diversity
Ratio of average income to average house value (%)
Ratio of average income to average rent
Median household income ($) - White
Median household income ($) - Black or African American
Median household income ($) - Asian
Median household income ($) - Hispanic or Latino
Median household income ($) - American Indian and Alaska Native
Median household income ($) - Multirace
Median household income ($) - Other Race
Median household income for houses/condos with a mortgage ($)
Median household income for apartments without a mortgage ($)
Races - White alone (%)
Races - White alone (% change since 2000)
Races - Black alone (%)
Races - Black alone (% change since 2000)
Races - American Indian alone (%)
Races - American Indian alone (% change since 2000)
Races - Asian alone (%)
Races - Asian alone (% change since 2000)
Races - Hispanic (%)
Races - Hispanic (% change since 2000)
Races - Native Hawaiian and Other Pacific Islander alone (%)
Races - Native Hawaiian and Other Pacific Islander alone (% change since 2000)
Races - Two or more races (%)
Races - Two or more races (% change since 2000)
Races - Other race alone (%)
Races - Other race alone (% change since 2000)
Racial diversity
Unemployment (%)
Unemployment (% change since 2000)
Unemployment (%) - White
Unemployment (%) - Black or African American
Unemployment (%) - Asian
Unemployment (%) - Hispanic or Latino
Unemployment (%) - American Indian and Alaska Native
Unemployment (%) - Multirace
Unemployment (%) - Other Race
Population density (people per square mile)
Population - Males (%)
Population - Females (%)
Population - Males (%) - White
Population - Males (%) - Black or African American
Population - Males (%) - Asian
Population - Males (%) - Hispanic or Latino
Population - Males (%) - American Indian and Alaska Native
Population - Males (%) - Multirace
Population - Males (%) - Other Race
Population - Females (%) - White
Population - Females (%) - Black or African American
Population - Females (%) - Asian
Population - Females (%) - Hispanic or Latino
Population - Females (%) - American Indian and Alaska Native
Population - Females (%) - Multirace
Population - Females (%) - Other Race
Coronavirus confirmed cases (May 09, 2024)
Deaths caused by coronavirus (May 09, 2024)
Coronavirus confirmed cases (per 100k population) (May 09, 2024)
Deaths caused by coronavirus (per 100k population) (May 09, 2024)
Daily increase in number of cases (May 09, 2024)
Weekly increase in number of cases (May 09, 2024)
Cases doubled (in days) (May 09, 2024)
Hospitalized patients (Apr 18, 2022)
Negative test results (Apr 18, 2022)
Total test results (Apr 18, 2022)
COVID Vaccine doses distributed (per 100k population) (Sep 19, 2023)
COVID Vaccine doses administered (per 100k population) (Sep 19, 2023)
COVID Vaccine doses distributed (Sep 19, 2023)
COVID Vaccine doses administered (Sep 19, 2023)
Likely homosexual households (%)
Likely homosexual households (% change since 2000)
Likely homosexual households - Lesbian couples (%)
Likely homosexual households - Lesbian couples (% change since 2000)
Likely homosexual households - Gay men (%)
Likely homosexual households - Gay men (% change since 2000)
Cost of living index
Median gross rent ($)
Median contract rent ($)
Median monthly housing costs ($)
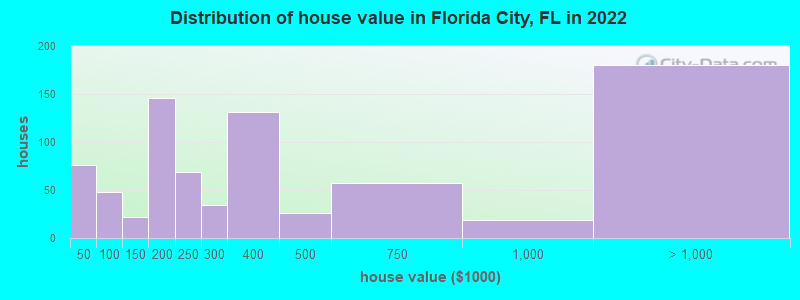
Median house or condo value ($)
Median house or condo value ($ change since 2000)
Mean house or condo value by units in structure - 1, detached ($)
Mean house or condo value by units in structure - 1, attached ($)
Mean house or condo value by units in structure - 2 ($)
Mean house or condo value by units in structure by units in structure - 3 or 4 ($)
Mean house or condo value by units in structure - 5 or more ($)
Mean house or condo value by units in structure - Boat, RV, van, etc. ($)
Mean house or condo value by units in structure - Mobile home ($)
Median house or condo value ($) - White
Median house or condo value ($) - Black or African American
Median house or condo value ($) - Asian
Median house or condo value ($) - Hispanic or Latino
Median house or condo value ($) - American Indian and Alaska Native
Median house or condo value ($) - Multirace
Median house or condo value ($) - Other Race
Median resident age
Resident age diversity
Median resident age - Males
Median resident age - Females
Median resident age - White
Median resident age - Black or African American
Median resident age - Asian
Median resident age - Hispanic or Latino
Median resident age - American Indian and Alaska Native
Median resident age - Multirace
Median resident age - Other Race
Median resident age - Males - White
Median resident age - Males - Black or African American
Median resident age - Males - Asian
Median resident age - Males - Hispanic or Latino
Median resident age - Males - American Indian and Alaska Native
Median resident age - Males - Multirace
Median resident age - Males - Other Race
Median resident age - Females - White
Median resident age - Females - Black or African American
Median resident age - Females - Asian
Median resident age - Females - Hispanic or Latino
Median resident age - Females - American Indian and Alaska Native
Median resident age - Females - Multirace
Median resident age - Females - Other Race
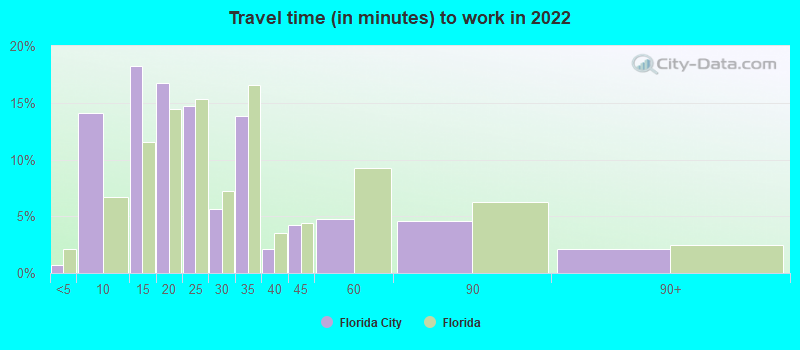
Commute - mean travel time to work (minutes)
Travel time to work - Less than 5 minutes (%)
Travel time to work - Less than 5 minutes (% change since 2000)
Travel time to work - 5 to 9 minutes (%)
Travel time to work - 5 to 9 minutes (% change since 2000)
Travel time to work - 10 to 19 minutes (%)
Travel time to work - 10 to 19 minutes (% change since 2000)
Travel time to work - 20 to 29 minutes (%)
Travel time to work - 20 to 29 minutes (% change since 2000)
Travel time to work - 30 to 39 minutes (%)
Travel time to work - 30 to 39 minutes (% change since 2000)
Travel time to work - 40 to 59 minutes (%)
Travel time to work - 40 to 59 minutes (% change since 2000)
Travel time to work - 60 to 89 minutes (%)
Travel time to work - 60 to 89 minutes (% change since 2000)
Travel time to work - 90 or more minutes (%)
Travel time to work - 90 or more minutes (% change since 2000)
Marital status - Never married (%)
Marital status - Now married (%)
Marital status - Separated (%)
Marital status - Widowed (%)
Marital status - Divorced (%)
Median family income ($)
Median family income (% change since 2000)
Median non-family income ($)
Median non-family income (% change since 2000)
Median per capita income ($)
Median per capita income (% change since 2000)
Median family income ($) - White
Median family income ($) - Black or African American
Median family income ($) - Asian
Median family income ($) - Hispanic or Latino
Median family income ($) - American Indian and Alaska Native
Median family income ($) - Multirace
Median family income ($) - Other Race
Median year house/condo built
Median year apartment built
Year house built - Built 2005 or later (%)
Year house built - Built 2000 to 2004 (%)
Year house built - Built 1990 to 1999 (%)
Year house built - Built 1980 to 1989 (%)
Year house built - Built 1970 to 1979 (%)
Year house built - Built 1960 to 1969 (%)
Year house built - Built 1950 to 1959 (%)
Year house built - Built 1940 to 1949 (%)
Year house built - Built 1939 or earlier (%)
Average household size
Household density (households per square mile)
Average household size - White
Average household size - Black or African American
Average household size - Asian
Average household size - Hispanic or Latino
Average household size - American Indian and Alaska Native
Average household size - Multirace
Average household size - Other Race
Occupied housing units (%)
Vacant housing units (%)
Owner occupied housing units (%)
Renter occupied housing units (%)
Vacancy status - For rent (%)
Vacancy status - For sale only (%)
Vacancy status - Rented or sold, not occupied (%)
Vacancy status - For seasonal, recreational, or occasional use (%)
Vacancy status - For migrant workers (%)
Vacancy status - Other vacant (%)
Residents with income below the poverty level (%)
Residents with income below 50% of the poverty level (%)
Children below poverty level (%)
Poor families by family type - Married-couple family (%)
Poor families by family type - Male, no wife present (%)
Poor families by family type - Female, no husband present (%)
Poverty status for native-born residents (%)
Poverty status for foreign-born residents (%)
Poverty among high school graduates not in families (%)
Poverty among people who did not graduate high school not in families (%)
Residents with income below the poverty level (%) - White
Residents with income below the poverty level (%) - Black or African American
Residents with income below the poverty level (%) - Asian
Residents with income below the poverty level (%) - Hispanic or Latino
Residents with income below the poverty level (%) - American Indian and Alaska Native
Residents with income below the poverty level (%) - Multirace
Residents with income below the poverty level (%) - Other Race
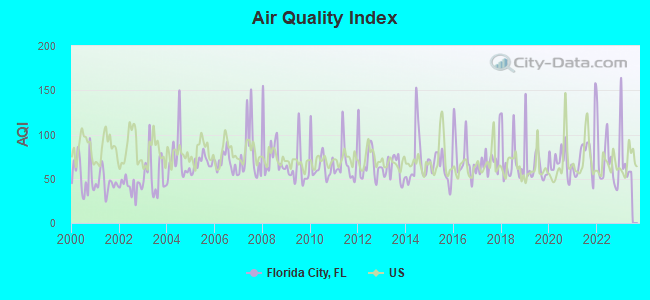
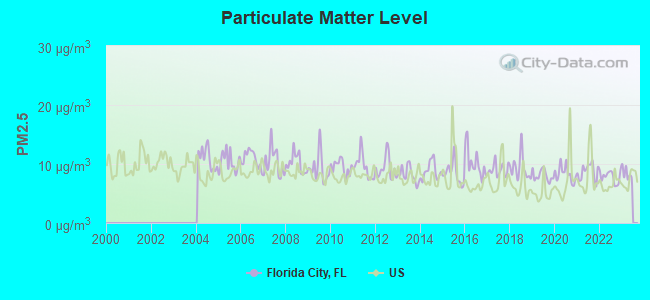
Air pollution - Air Quality Index (AQI)
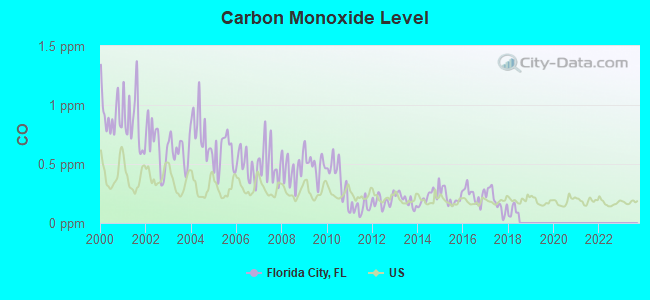
Air pollution - CO
Air pollution - NO2
Air pollution - SO2
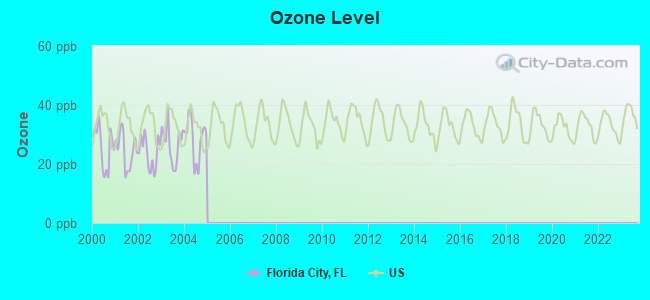
Air pollution - Ozone
Air pollution - PM10
Air pollution - PM25
Air pollution - Pb
Crime - Murders per 100,000 population
Crime - Rapes per 100,000 population
Crime - Robberies per 100,000 population
Crime - Assaults per 100,000 population
Crime - Burglaries per 100,000 population
Crime - Thefts per 100,000 population
Crime - Auto thefts per 100,000 population
Crime - Arson per 100,000 population
Crime - City-data.com crime index
Crime - Violent crime index
Crime - Property crime index
Crime - Murders per 100,000 population (5 year average)
Crime - Rapes per 100,000 population (5 year average)
Crime - Robberies per 100,000 population (5 year average)
Crime - Assaults per 100,000 population (5 year average)
Crime - Burglaries per 100,000 population (5 year average)
Crime - Thefts per 100,000 population (5 year average)
Crime - Auto thefts per 100,000 population (5 year average)
Crime - Arson per 100,000 population (5 year average)
Crime - City-data.com crime index (5 year average)
Crime - Violent crime index (5 year average)
Crime - Property crime index (5 year average)
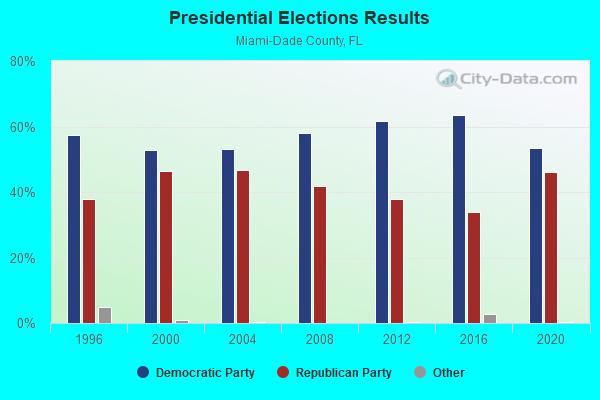
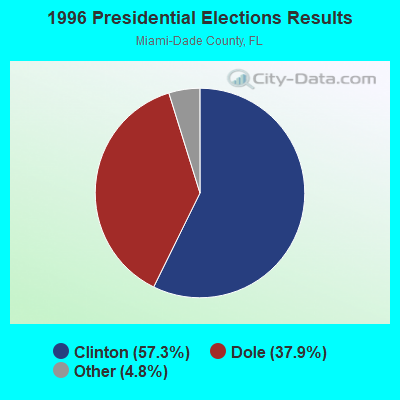
1996 Presidential Elections Results (%) - Democratic Party (Clinton)
1996 Presidential Elections Results (%) - Republican Party (Dole)
1996 Presidential Elections Results (%) - Other
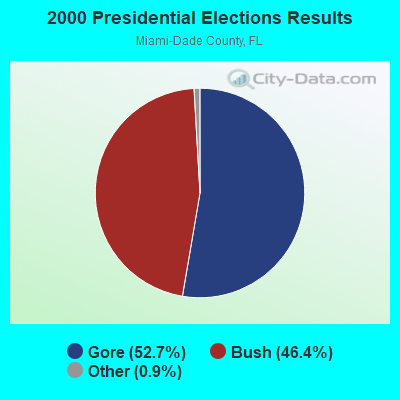
2000 Presidential Elections Results (%) - Democratic Party (Gore)
2000 Presidential Elections Results (%) - Republican Party (Bush)
2000 Presidential Elections Results (%) - Other
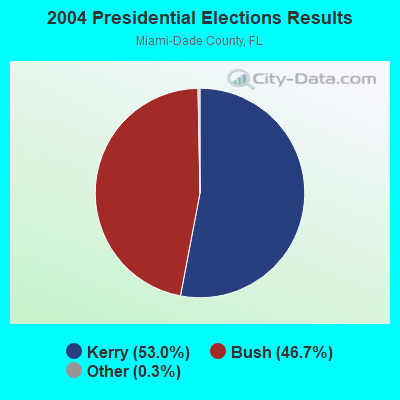
2004 Presidential Elections Results (%) - Democratic Party (Kerry)
2004 Presidential Elections Results (%) - Republican Party (Bush)
2004 Presidential Elections Results (%) - Other
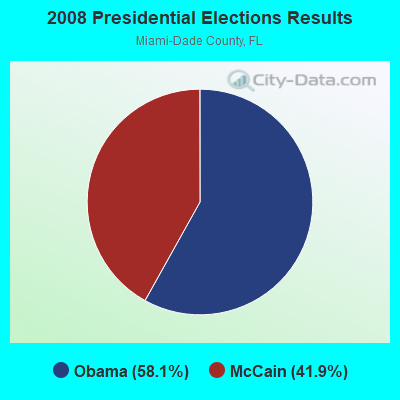
2008 Presidential Elections Results (%) - Democratic Party (Obama)
2008 Presidential Elections Results (%) - Republican Party (McCain)
2008 Presidential Elections Results (%) - Other
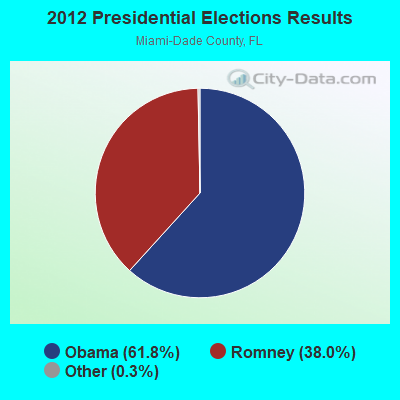
2012 Presidential Elections Results (%) - Democratic Party (Obama)
2012 Presidential Elections Results (%) - Republican Party (Romney)
2012 Presidential Elections Results (%) - Other
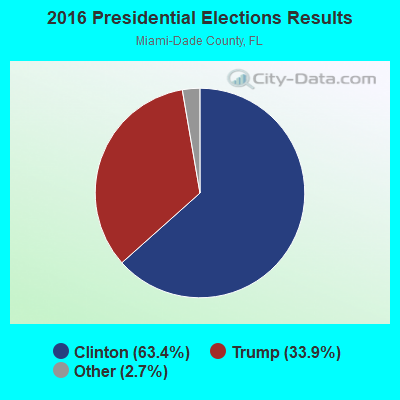
2016 Presidential Elections Results (%) - Democratic Party (Clinton)
2016 Presidential Elections Results (%) - Republican Party (Trump)
2016 Presidential Elections Results (%) - Other
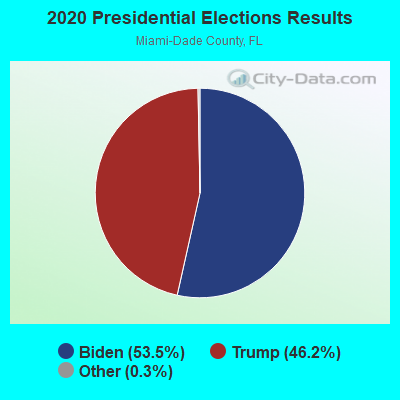
2020 Presidential Elections Results (%) - Democratic Party (Biden)
2020 Presidential Elections Results (%) - Republican Party (Trump)
2020 Presidential Elections Results (%) - Other
Ancestries Reported - Arab (%)
Ancestries Reported - Czech (%)
Ancestries Reported - Danish (%)
Ancestries Reported - Dutch (%)
Ancestries Reported - English (%)
Ancestries Reported - French (%)
Ancestries Reported - French Canadian (%)
Ancestries Reported - German (%)
Ancestries Reported - Greek (%)
Ancestries Reported - Hungarian (%)
Ancestries Reported - Irish (%)
Ancestries Reported - Italian (%)
Ancestries Reported - Lithuanian (%)
Ancestries Reported - Norwegian (%)
Ancestries Reported - Polish (%)
Ancestries Reported - Portuguese (%)
Ancestries Reported - Russian (%)
Ancestries Reported - Scotch-Irish (%)
Ancestries Reported - Scottish (%)
Ancestries Reported - Slovak (%)
Ancestries Reported - Subsaharan African (%)
Ancestries Reported - Swedish (%)
Ancestries Reported - Swiss (%)
Ancestries Reported - Ukrainian (%)
Ancestries Reported - United States (%)
Ancestries Reported - Welsh (%)
Ancestries Reported - West Indian (%)
Ancestries Reported - Other (%)
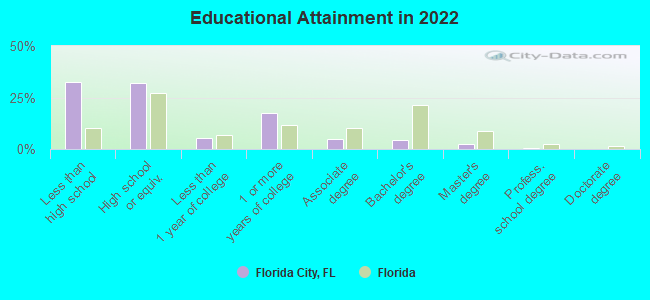
Educational Attainment - No schooling completed (%)
Educational Attainment - Less than high school (%)
Educational Attainment - High school or equivalent (%)
Educational Attainment - Less than 1 year of college (%)
Educational Attainment - 1 or more years of college (%)
Educational Attainment - Associate degree (%)
Educational Attainment - Bachelor's degree (%)
Educational Attainment - Master's degree (%)
Educational Attainment - Professional school degree (%)
Educational Attainment - Doctorate degree (%)
School Enrollment - Nursery, preschool (%)
School Enrollment - Kindergarten (%)
School Enrollment - Grade 1 to 4 (%)
School Enrollment - Grade 5 to 8 (%)
School Enrollment - Grade 9 to 12 (%)
School Enrollment - College undergrad (%)
School Enrollment - Graduate or professional (%)
School Enrollment - Not enrolled in school (%)
School enrollment - Public schools (%)
School enrollment - Private schools (%)
School enrollment - Not enrolled (%)
Median number of rooms in houses and condos
Median number of rooms in apartments
Housing units lacking complete plumbing facilities (%)
Housing units lacking complete kitchen facilities (%)
Density of houses
Urban houses (%)
Rural houses (%)
Households with people 60 years and over (%)
Households with people 65 years and over (%)
Households with people 75 years and over (%)
Households with one or more nonrelatives (%)
Households with no nonrelatives (%)
Population in households (%)
Family households (%)
Nonfamily households (%)
Population in families (%)
Family households with own children (%)
Median number of bedrooms in owner occupied houses
Mean number of bedrooms in owner occupied houses
Median number of bedrooms in renter occupied houses
Mean number of bedrooms in renter occupied houses
Median number of vehichles in owner occupied houses
Mean number of vehichles in owner occupied houses
Median number of vehichles in renter occupied houses
Mean number of vehichles in renter occupied houses
Mortgage status - with mortgage (%)
Mortgage status - with second mortgage (%)
Mortgage status - with home equity loan (%)
Mortgage status - with both second mortgage and home equity loan (%)
Mortgage status - without a mortgage (%)
Average family size
Average family size - White
Average family size - Black or African American
Average family size - Asian
Average family size - Hispanic or Latino
Average family size - American Indian and Alaska Native
Average family size - Multirace
Average family size - Other Race
Geographical mobility - Same house 1 year ago (%)
Geographical mobility - Moved within same county (%)
Geographical mobility - Moved from different county within same state (%)
Geographical mobility - Moved from different state (%)
Geographical mobility - Moved from abroad (%)
Place of birth - Born in state of residence (%)
Place of birth - Born in other state (%)
Place of birth - Native, outside of US (%)
Place of birth - Foreign born (%)
Housing units in structures - 1, detached (%)
Housing units in structures - 1, attached (%)
Housing units in structures - 2 (%)
Housing units in structures - 3 or 4 (%)
Housing units in structures - 5 to 9 (%)
Housing units in structures - 10 to 19 (%)
Housing units in structures - 20 to 49 (%)
Housing units in structures - 50 or more (%)
Housing units in structures - Mobile home (%)
Housing units in structures - Boat, RV, van, etc. (%)
House/condo owner moved in on average (years ago)
Renter moved in on average (years ago)
Year householder moved into unit - Moved in 1999 to March 2000 (%)
Year householder moved into unit - Moved in 1995 to 1998 (%)
Year householder moved into unit - Moved in 1990 to 1994 (%)
Year householder moved into unit - Moved in 1980 to 1989 (%)
Year householder moved into unit - Moved in 1970 to 1979 (%)
Year householder moved into unit - Moved in 1969 or earlier (%)
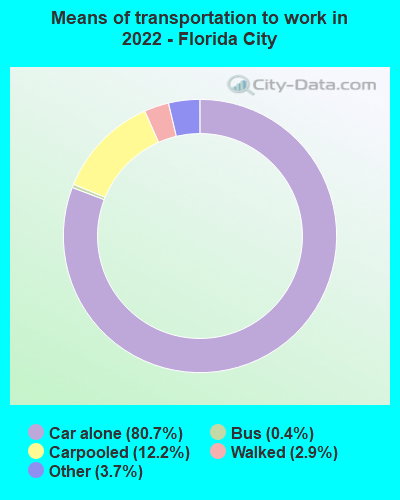
Means of transportation to work - Drove car alone (%)
Means of transportation to work - Carpooled (%)
Means of transportation to work - Public transportation (%)
Means of transportation to work - Bus or trolley bus (%)
Means of transportation to work - Streetcar or trolley car (%)
Means of transportation to work - Subway or elevated (%)
Means of transportation to work - Railroad (%)
Means of transportation to work - Ferryboat (%)
Means of transportation to work - Taxicab (%)
Means of transportation to work - Motorcycle (%)
Means of transportation to work - Bicycle (%)
Means of transportation to work - Walked (%)
Means of transportation to work - Other means (%)
Working at home (%)
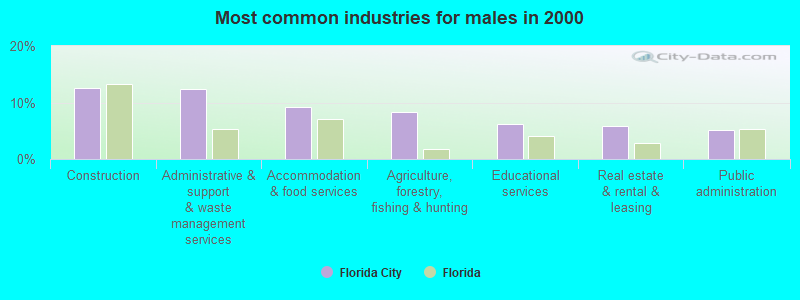
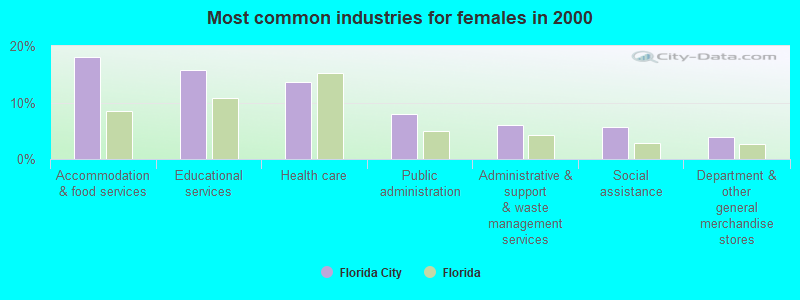
Industry diversity
Most Common Industries - Agriculture, forestry, fishing and hunting, and mining (%)
Most Common Industries - Agriculture, forestry, fishing and hunting (%)
Most Common Industries - Mining, quarrying, and oil and gas extraction (%)
Most Common Industries - Construction (%)
Most Common Industries - Manufacturing (%)
Most Common Industries - Wholesale trade (%)
Most Common Industries - Retail trade (%)
Most Common Industries - Transportation and warehousing, and utilities (%)
Most Common Industries - Transportation and warehousing (%)
Most Common Industries - Utilities (%)
Most Common Industries - Information (%)
Most Common Industries - Finance and insurance, and real estate and rental and leasing (%)
Most Common Industries - Finance and insurance (%)
Most Common Industries - Real estate and rental and leasing (%)
Most Common Industries - Professional, scientific, and management, and administrative and waste management services (%)
Most Common Industries - Professional, scientific, and technical services (%)
Most Common Industries - Management of companies and enterprises (%)
Most Common Industries - Administrative and support and waste management services (%)
Most Common Industries - Educational services, and health care and social assistance (%)
Most Common Industries - Educational services (%)
Most Common Industries - Health care and social assistance (%)
Most Common Industries - Arts, entertainment, and recreation, and accommodation and food services (%)
Most Common Industries - Arts, entertainment, and recreation (%)
Most Common Industries - Accommodation and food services (%)
Most Common Industries - Other services, except public administration (%)
Most Common Industries - Public administration (%)
Occupation diversity
Most Common Occupations - Management, business, science, and arts occupations (%)
Most Common Occupations - Management, business, and financial occupations (%)
Most Common Occupations - Management occupations (%)
Most Common Occupations - Business and financial operations occupations (%)
Most Common Occupations - Computer, engineering, and science occupations (%)
Most Common Occupations - Computer and mathematical occupations (%)
Most Common Occupations - Architecture and engineering occupations (%)
Most Common Occupations - Life, physical, and social science occupations (%)
Most Common Occupations - Education, legal, community service, arts, and media occupations (%)
Most Common Occupations - Community and social service occupations (%)
Most Common Occupations - Legal occupations (%)
Most Common Occupations - Education, training, and library occupations (%)
Most Common Occupations - Arts, design, entertainment, sports, and media occupations (%)
Most Common Occupations - Healthcare practitioners and technical occupations (%)
Most Common Occupations - Health diagnosing and treating practitioners and other technical occupations (%)
Most Common Occupations - Health technologists and technicians (%)
Most Common Occupations - Service occupations (%)
Most Common Occupations - Healthcare support occupations (%)
Most Common Occupations - Protective service occupations (%)
Most Common Occupations - Fire fighting and prevention, and other protective service workers including supervisors (%)
Most Common Occupations - Law enforcement workers including supervisors (%)
Most Common Occupations - Food preparation and serving related occupations (%)
Most Common Occupations - Building and grounds cleaning and maintenance occupations (%)
Most Common Occupations - Personal care and service occupations (%)
Most Common Occupations - Sales and office occupations (%)
Most Common Occupations - Sales and related occupations (%)
Most Common Occupations - Office and administrative support occupations (%)
Most Common Occupations - Natural resources, construction, and maintenance occupations (%)
Most Common Occupations - Farming, fishing, and forestry occupations (%)
Most Common Occupations - Construction and extraction occupations (%)
Most Common Occupations - Installation, maintenance, and repair occupations (%)
Most Common Occupations - Production, transportation, and material moving occupations (%)
Most Common Occupations - Production occupations (%)
Most Common Occupations - Transportation occupations (%)
Most Common Occupations - Material moving occupations (%)
People in Group quarters - Institutionalized population (%)
People in Group quarters - Correctional institutions (%)
People in Group quarters - Federal prisons and detention centers (%)
People in Group quarters - Halfway houses (%)
People in Group quarters - Local jails and other confinement facilities (including police lockups) (%)
People in Group quarters - Military disciplinary barracks (%)
People in Group quarters - State prisons (%)
People in Group quarters - Other types of correctional institutions (%)
People in Group quarters - Nursing homes (%)
People in Group quarters - Hospitals/wards, hospices, and schools for the handicapped (%)
People in Group quarters - Hospitals/wards and hospices for chronically ill (%)
People in Group quarters - Hospices or homes for chronically ill (%)
People in Group quarters - Military hospitals or wards for chronically ill (%)
People in Group quarters - Other hospitals or wards for chronically ill (%)
People in Group quarters - Hospitals or wards for drug/alcohol abuse (%)
People in Group quarters - Mental (Psychiatric) hospitals or wards (%)
People in Group quarters - Schools, hospitals, or wards for the mentally retarded (%)
People in Group quarters - Schools, hospitals, or wards for the physically handicapped (%)
People in Group quarters - Institutions for the deaf (%)
People in Group quarters - Institutions for the blind (%)
People in Group quarters - Orthopedic wards and institutions for the physically handicapped (%)
People in Group quarters - Wards in general hospitals for patients who have no usual home elsewhere (%)
People in Group quarters - Wards in military hospitals for patients who have no usual home elsewhere (%)
People in Group quarters - Juvenile institutions (%)
People in Group quarters - Long-term care (%)
People in Group quarters - Homes for abused, dependent, and neglected children (%)
People in Group quarters - Residential treatment centers for emotionally disturbed children (%)
People in Group quarters - Training schools for juvenile delinquents (%)
People in Group quarters - Short-term care, detention or diagnostic centers for delinquent children (%)
People in Group quarters - Type of juvenile institution unknown (%)
People in Group quarters - Noninstitutionalized population (%)
People in Group quarters - College dormitories (includes college quarters off campus) (%)
People in Group quarters - Military quarters (%)
People in Group quarters - On base (%)
People in Group quarters - Barracks, unaccompanied personnel housing (UPH), (Enlisted/Officer), ;and similar group living quarters for military personnel (%)
People in Group quarters - Transient quarters for temporary residents (%)
People in Group quarters - Military ships (%)
People in Group quarters - Group homes (%)
People in Group quarters - Homes or halfway houses for drug/alcohol abuse (%)
People in Group quarters - Homes for the mentally ill (%)
People in Group quarters - Homes for the mentally retarded (%)
People in Group quarters - Homes for the physically handicapped (%)
People in Group quarters - Other group homes (%)
People in Group quarters - Religious group quarters (%)
People in Group quarters - Dormitories (%)
People in Group quarters - Agriculture workers' dormitories on farms (%)
People in Group quarters - Job Corps and vocational training facilities (%)
People in Group quarters - Other workers' dormitories (%)
People in Group quarters - Crews of maritime vessels (%)
People in Group quarters - Other nonhousehold living situations (%)
People in Group quarters - Other noninstitutional group quarters (%)
Residents speaking English at home (%)
Residents speaking English at home - Born in the United States (%)
Residents speaking English at home - Native, born elsewhere (%)
Residents speaking English at home - Foreign born (%)
Residents speaking Spanish at home (%)
Residents speaking Spanish at home - Born in the United States (%)
Residents speaking Spanish at home - Native, born elsewhere (%)
Residents speaking Spanish at home - Foreign born (%)
Residents speaking other language at home (%)
Residents speaking other language at home - Born in the United States (%)
Residents speaking other language at home - Native, born elsewhere (%)
Residents speaking other language at home - Foreign born (%)
Class of Workers - Employee of private company (%)
Class of Workers - Self-employed in own incorporated business (%)
Class of Workers - Private not-for-profit wage and salary workers (%)
Class of Workers - Local government workers (%)
Class of Workers - State government workers (%)
Class of Workers - Federal government workers (%)
Class of Workers - Self-employed workers in own not incorporated business and Unpaid family workers (%)
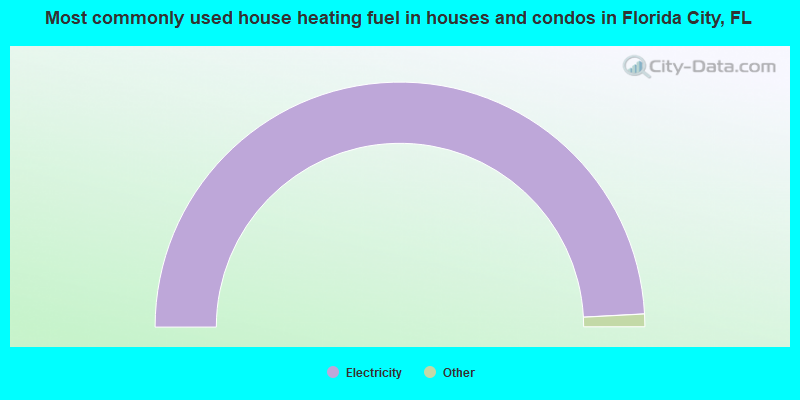
House heating fuel used in houses and condos - Utility gas (%)
House heating fuel used in houses and condos - Bottled, tank, or LP gas (%)
House heating fuel used in houses and condos - Electricity (%)
House heating fuel used in houses and condos - Fuel oil, kerosene, etc. (%)
House heating fuel used in houses and condos - Coal or coke (%)
House heating fuel used in houses and condos - Wood (%)
House heating fuel used in houses and condos - Solar energy (%)
House heating fuel used in houses and condos - Other fuel (%)
House heating fuel used in houses and condos - No fuel used (%)
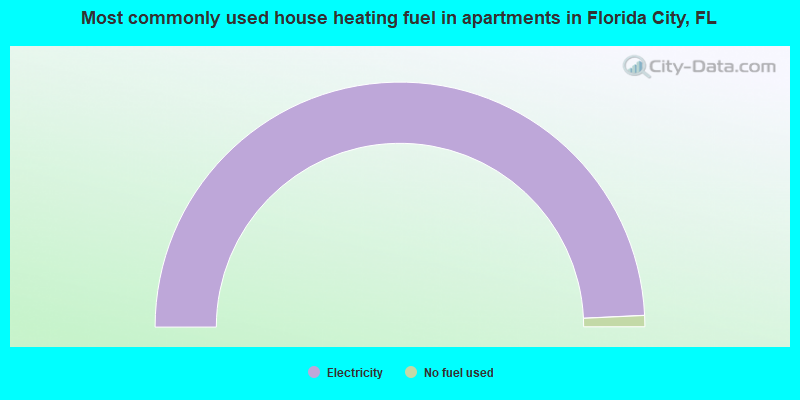
House heating fuel used in apartments - Utility gas (%)
House heating fuel used in apartments - Bottled, tank, or LP gas (%)
House heating fuel used in apartments - Electricity (%)
House heating fuel used in apartments - Fuel oil, kerosene, etc. (%)
House heating fuel used in apartments - Coal or coke (%)
House heating fuel used in apartments - Wood (%)
House heating fuel used in apartments - Solar energy (%)
House heating fuel used in apartments - Other fuel (%)
House heating fuel used in apartments - No fuel used (%)
Armed forces status - In Armed Forces (%)
Armed forces status - Civilian (%)
Armed forces status - Civilian - Veteran (%)
Armed forces status - Civilian - Nonveteran (%)
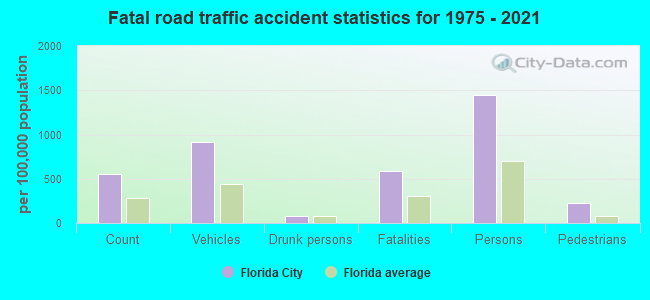
Fatal accidents locations in years 2005-2021
Fatal accidents locations in 2005
Fatal accidents locations in 2006
Fatal accidents locations in 2007
Fatal accidents locations in 2008
Fatal accidents locations in 2009
Fatal accidents locations in 2010
Fatal accidents locations in 2011
Fatal accidents locations in 2012
Fatal accidents locations in 2013
Fatal accidents locations in 2014
Fatal accidents locations in 2015
Fatal accidents locations in 2016
Fatal accidents locations in 2017
Fatal accidents locations in 2018
Fatal accidents locations in 2019
Fatal accidents locations in 2020
Fatal accidents locations in 2021
Alcohol use - People drinking some alcohol every month (%)
Alcohol use - People not drinking at all (%)
Alcohol use - Average days/month drinking alcohol
Alcohol use - Average drinks/week
Alcohol use - Average days/year people drink much
Audiometry - Average condition of hearing (%)
Audiometry - People that can hear a whisper from across a quiet room (%)
Audiometry - People that can hear normal voice from across a quiet room (%)
Audiometry - Ears ringing, roaring, buzzing (%)
Audiometry - Had a job exposure to loud noise (%)
Audiometry - Had off-work exposure to loud noise (%)
Blood Pressure & Cholesterol - Has high blood pressure (%)
Blood Pressure & Cholesterol - Checking blood pressure at home (%)
Blood Pressure & Cholesterol - Frequently checking blood cholesterol (%)
Blood Pressure & Cholesterol - Has high cholesterol level (%)
Consumer Behavior - Money monthly spent on food at supermarket/grocery store
Consumer Behavior - Money monthly spent on food at other stores
Consumer Behavior - Money monthly spent on eating out
Consumer Behavior - Money monthly spent on carryout/delivered foods
Consumer Behavior - Income spent on food at supermarket/grocery store (%)
Consumer Behavior - Income spent on food at other stores (%)
Consumer Behavior - Income spent on eating out (%)
Consumer Behavior - Income spent on carryout/delivered foods (%)
Current Health Status - General health condition (%)
Current Health Status - Blood donors (%)
Current Health Status - Has blood ever tested for HIV virus (%)
Current Health Status - Left-handed people (%)
Dermatology - People using sunscreen (%)
Diabetes - Diabetics (%)
Diabetes - Had a blood test for high blood sugar (%)
Diabetes - People taking insulin (%)
Diet Behavior & Nutrition - Diet health (%)
Diet Behavior & Nutrition - Milk product consumption (# of products/month)
Diet Behavior & Nutrition - Meals not home prepared (#/week)
Diet Behavior & Nutrition - Meals from fast food or pizza place (#/week)
Diet Behavior & Nutrition - Ready-to-eat foods (#/month)
Diet Behavior & Nutrition - Frozen meals/pizza (#/month)
Drug Use - People that ever used marijuana or hashish (%)
Drug Use - Ever used hard drugs (%)
Drug Use - Ever used any form of cocaine (%)
Drug Use - Ever used heroin (%)
Drug Use - Ever used methamphetamine (%)
Health Insurance - People covered by health insurance (%)
Kidney Conditions-Urology - Avg. # of times urinating at night
Medical Conditions - People with asthma (%)
Medical Conditions - People with anemia (%)
Medical Conditions - People with psoriasis (%)
Medical Conditions - People with overweight (%)
Medical Conditions - Elderly people having difficulties in thinking or remembering (%)
Medical Conditions - People who ever received blood transfusion (%)
Medical Conditions - People having trouble seeing even with glass/contacts (%)
Medical Conditions - People with arthritis (%)
Medical Conditions - People with gout (%)
Medical Conditions - People with congestive heart failure (%)
Medical Conditions - People with coronary heart disease (%)
Medical Conditions - People with angina pectoris (%)
Medical Conditions - People who ever had heart attack (%)
Medical Conditions - People who ever had stroke (%)
Medical Conditions - People with emphysema (%)
Medical Conditions - People with thyroid problem (%)
Medical Conditions - People with chronic bronchitis (%)
Medical Conditions - People with any liver condition (%)
Medical Conditions - People who ever had cancer or malignancy (%)
Mental Health - People who have little interest in doing things (%)
Mental Health - People feeling down, depressed, or hopeless (%)
Mental Health - People who have trouble sleeping or sleeping too much (%)
Mental Health - People feeling tired or having little energy (%)
Mental Health - People with poor appetite or overeating (%)
Mental Health - People feeling bad about themself (%)
Mental Health - People who have trouble concentrating on things (%)
Mental Health - People moving or speaking slowly or too fast (%)
Mental Health - People having thoughts they would be better off dead (%)
Oral Health - Average years since last visit a dentist
Oral Health - People embarrassed because of mouth (%)
Oral Health - People with gum disease (%)
Oral Health - General health of teeth and gums (%)
Oral Health - Average days a week using dental floss/device
Oral Health - Average days a week using mouthwash for dental problem
Oral Health - Average number of teeth
Pesticide Use - Households using pesticides to control insects (%)
Pesticide Use - Households using pesticides to kill weeds (%)
Physical Activity - People doing vigorous-intensity work activities (%)
Physical Activity - People doing moderate-intensity work activities (%)
Physical Activity - People walking or bicycling (%)
Physical Activity - People doing vigorous-intensity recreational activities (%)
Physical Activity - People doing moderate-intensity recreational activities (%)
Physical Activity - Average hours a day doing sedentary activities
Physical Activity - Average hours a day watching TV or videos
Physical Activity - Average hours a day using computer
Physical Functioning - People having limitations keeping them from working (%)
Physical Functioning - People limited in amount of work they can do (%)
Physical Functioning - People that need special equipment to walk (%)
Physical Functioning - People experiencing confusion/memory problems (%)
Physical Functioning - People requiring special healthcare equipment (%)
Prescription Medications - Average number of prescription medicines taking
Preventive Aspirin Use - Adults 40+ taking low-dose aspirin (%)
Reproductive Health - Vaginal deliveries (%)
Reproductive Health - Cesarean deliveries (%)
Reproductive Health - Deliveries resulted in a live birth (%)
Reproductive Health - Pregnancies resulted in a delivery (%)
Reproductive Health - Women breastfeeding newborns (%)
Reproductive Health - Women that had a hysterectomy (%)
Reproductive Health - Women that had both ovaries removed (%)
Reproductive Health - Women that have ever taken birth control pills (%)
Reproductive Health - Women taking birth control pills (%)
Reproductive Health - Women that have ever used Depo-Provera or injectables (%)
Reproductive Health - Women that have ever used female hormones (%)
Sexual Behavior - People 18+ that ever had sex (vaginal, anal, or oral) (%)
Sexual Behavior - Males 18+ that ever had vaginal sex with a woman (%)
Sexual Behavior - Males 18+ that ever performed oral sex on a woman (%)
Sexual Behavior - Males 18+ that ever had anal sex with a woman (%)
Sexual Behavior - Males 18+ that ever had any sex with a man (%)
Sexual Behavior - Females 18+ that ever had vaginal sex with a man (%)
Sexual Behavior - Females 18+ that ever performed oral sex on a man (%)
Sexual Behavior - Females 18+ that ever had anal sex with a man (%)
Sexual Behavior - Females 18+ that ever had any kind of sex with a woman (%)
Sexual Behavior - Average age people first had sex
Sexual Behavior - Average number of female sex partners in lifetime (males 18+)
Sexual Behavior - Average number of female vaginal sex partners in lifetime (males 18+)
Sexual Behavior - Average age people first performed oral sex on a woman (18+)
Sexual Behavior - Average number of woman performed oral sex on in lifetime (18+)
Sexual Behavior - Average number of male sex partners in lifetime (males 18+)
Sexual Behavior - Average number of male anal sex partners in lifetime (males 18+)
Sexual Behavior - Average age people first performed oral sex on a man (18+)
Sexual Behavior - Average number of male oral sex partners in lifetime (18+)
Sexual Behavior - People using protection when performing oral sex (%)
Sexual Behavior - Average number of times people have vaginal or anal sex a year
Sexual Behavior - People having sex without condom (%)
Sexual Behavior - Average number of male sex partners in lifetime (females 18+)
Sexual Behavior - Average number of male vaginal sex partners in lifetime (females 18+)
Sexual Behavior - Average number of female sex partners in lifetime (females 18+)
Sexual Behavior - Circumcised males 18+ (%)
Sleep Disorders - Average hours sleeping at night
Sleep Disorders - People that has trouble sleeping (%)
Smoking-Cigarette Use - People smoking cigarettes (%)
Taste & Smell - People 40+ having problems with smell (%)
Taste & Smell - People 40+ having problems with taste (%)
Taste & Smell - People 40+ that ever had wisdom teeth removed (%)
Taste & Smell - People 40+ that ever had tonsils teeth removed (%)
Taste & Smell - People 40+ that ever had a loss of consciousness because of a head injury (%)
Taste & Smell - People 40+ that ever had a broken nose or other serious injury to face or skull (%)
Taste & Smell - People 40+ that ever had two or more sinus infections (%)
Weight - Average height (inches)
Weight - Average weight (pounds)
Weight - Average BMI
Weight - People that are obese (%)
Weight - People that ever were obese (%)
Weight - People trying to lose weight (%)
Officers per 1,000 residents here:
2.82Florida average:
2.33
Latest news from Florida City, FL collected exclusively by city-data.com from local newspapers, TV, and radio stations
Ancestries: Haitian (9.9%), American (2.3%).
Current Local Time:
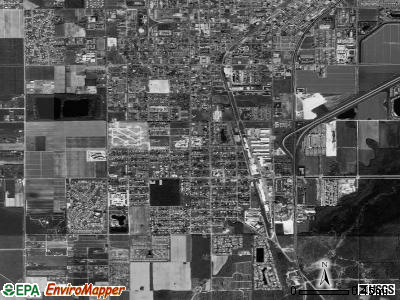
Land area: 3.22 square miles.
Population density: 3,927 people per square mile (average).
4,291 residents are foreign born (33.3% Latin America ).
This city:
33.6%Florida:
21.1%
Median real estate property taxes paid for housing units in 2000: Florida City city:
0.9% ($628)Florida:
1.4% ($1,262)
Nearest city with pop. 50,000+: Kendall-Perrine, FL (16.8 miles
Nearest city with pop. 200,000+: Kendale Lakes-Lindgren Acres, FL (17.2 miles
Nearest city with pop. 1,000,000+: Houston, TX
Nearest cities:
Latitude: 25.45 N, Longitude: 80.48 W
Daytime population change due to commuting: +112 (+0.9%)Workers who live and work in this city: 645 (14.5%)
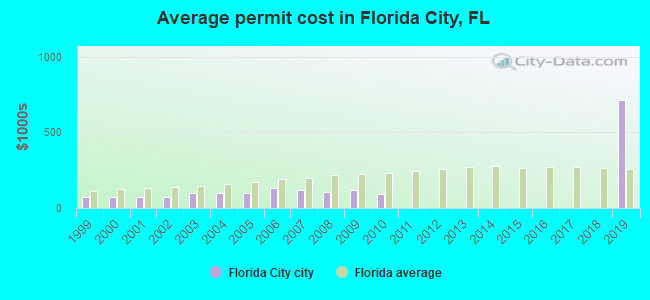
Property values in Florida City, FL
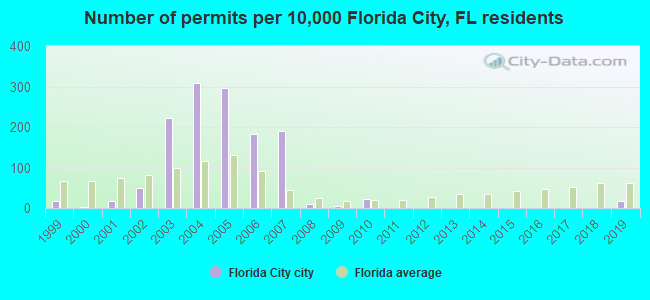
Single-family new house construction building permits:
2019: 14 buildings , average cost: $713,3002010: 18 buildings , average cost: $94,8002009: 4 buildings , average cost: $116,3002008: 9 buildings , average cost: $104,8002007: 148 buildings , average cost: $116,5002006: 143 buildings , average cost: $134,2002005: 233 buildings , average cost: $102,4002004: 242 buildings , average cost: $100,9002003: 174 buildings , average cost: $95,8002002: 39 buildings , average cost: $74,9002001: 13 buildings , average cost: $75,2002000: 2 buildings , average cost: $74,0001999: 14 buildings , average cost: $75,100Unemployment in December 2023:
Population change in the 1990s: +1,799 (+29.8%).
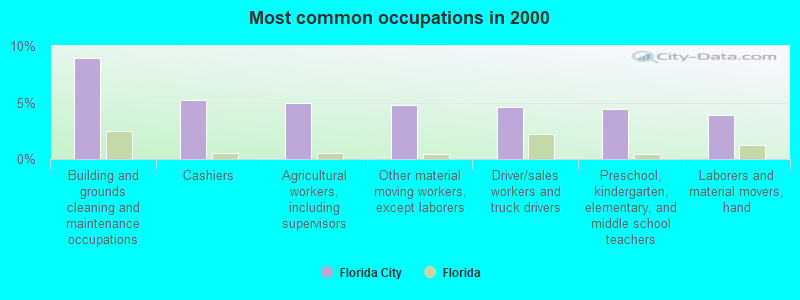
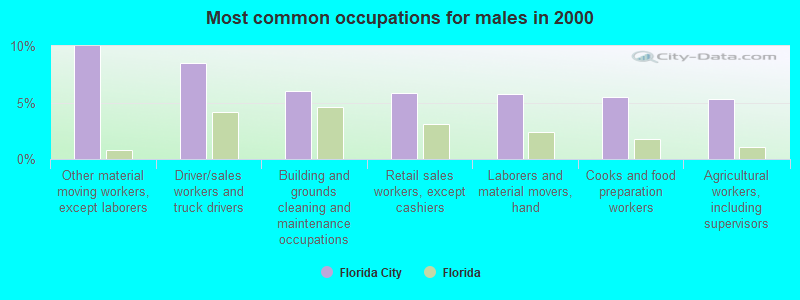
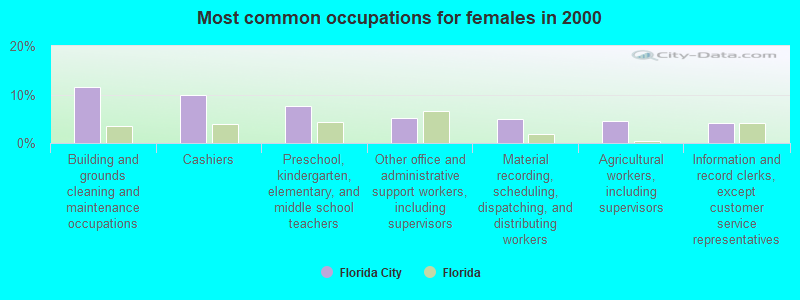
Most common occupations in Florida City, FL (%)
Both Males Females
Building and grounds cleaning and maintenance occupations (9.0%)
Cashiers (5.3%)
Agricultural workers, including supervisors (4.9%)
Other material moving workers, except laborers (4.8%)
Driver/sales workers and truck drivers (4.6%)
Preschool, kindergarten, elementary, and middle school teachers (4.4%)
Laborers and material movers, hand (3.9%)
Other material moving workers, except laborers (10.0%)
Driver/sales workers and truck drivers (8.5%)
Building and grounds cleaning and maintenance occupations (6.0%)
Retail sales workers, except cashiers (5.8%)
Laborers and material movers, hand (5.7%)
Cooks and food preparation workers (5.4%)
Agricultural workers, including supervisors (5.3%)
Building and grounds cleaning and maintenance occupations (11.6%)
Cashiers (10.0%)
Preschool, kindergarten, elementary, and middle school teachers (7.6%)
Other office and administrative support workers, including supervisors (5.3%)
Material recording, scheduling, dispatching, and distributing workers (4.9%)
Agricultural workers, including supervisors (4.6%)
Information and record clerks, except customer service representatives (4.1%)
Tornado activity:
Florida City-area historical tornado activity is significantly below Florida state average. It is 53% smaller than the overall U.S. average.
On 6/17/1959, a category F3 (max. wind speeds 158-206 mph) tornado 23.1 miles away from the Florida City city center injured 77 people and caused between $500,000 and $5,000,000 in damages.
On 12/20/1973, a category F2 (max. wind speeds 113-157 mph) tornado 4.6 miles away from the city center injured 9 people and caused between $500,000 and $5,000,000 in damages.
Earthquake activity:
Florida City-area historical earthquake activity is significantly below Florida state average. It is 99% smaller than the overall U.S. average. On 9/10/2006 at 14:56:08, a magnitude 5.9 (5.9 MB, 5.5 MS, 5.8 MW, Class: Moderate, Intensity: VI - VII) earthquake occurred 386.5 miles away from Florida City center On 2/22/1992 at 04:21:34, a magnitude 3.2 (3.2 MB, Depth: 6.2 mi, Class: Light, Intensity: II - III) earthquake occurred 117.4 miles away from the city center On 6/23/2016 at 17:20:29, a magnitude 3.8 (3.8 ML) earthquake occurred 320.6 miles away from Florida City center On 7/16/2016 at 20:00:10, a magnitude 3.7 (3.7 MB) earthquake occurred 305.2 miles away from Florida City center On 9/21/2016 at 16:30:52, a magnitude 3.8 (3.8 ML) earthquake occurred 325.3 miles away from the city center On 9/4/2016 at 18:29:29, a magnitude 3.8 (3.8 ML) earthquake occurred 326.3 miles away from Florida City center Magnitude types: body-wave magnitude (MB), local magnitude (ML), surface-wave magnitude (MS), moment magnitude (MW) Natural disasters: The number of natural disasters in Miami-Dade County (10) is smaller than the US average (15).Major Disasters (Presidential) Declared: 5Emergencies Declared: 3Hurricanes: 7, Tropical Storms: 2, Tornado: 1, Other: 1 (Note: some incidents may be assigned to more than one category). Hospitals and medical centers in Florida City: PROFESSIONAL CARE HOME HEALTH AGENCY INC (1452 NORTH KROME AVE SUITE 102E)
Other hospitals and medical centers near Florida City: ALTUS HOME HEALTH SERVICES LLC (Home Health Center, about 2 miles away; HOMESTEAD, FL)
STARLITE HOME HEALTH AGENCY INC (Home Health Center, about 2 miles away; HOMESTEAD, FL)
A PLUS HOME CARE AGENCY INC (Home Health Center, about 2 miles away; HOMESTEAD, FL)
CARI HOME CARE, INC (Home Health Center, about 2 miles away; HOMESTEAD, FL)
HOMESTEAD ARTIFICIAL KIDNEY CENTER (Dialysis Facility, about 2 miles away; HOMESTEAD, FL)
HORIZON HOME HEALTH CARE INC (Home Health Center, about 2 miles away; HOMESTEAD, FL)
TODAY'S HOME HEALTH SERVICES INC (Home Health Center, about 3 miles away; HOMESTEAD, FL)
Amtrak station near Florida City: 2 miles: HOMESTEAD (5 N.E. 3RD RD.) - Bus Station Services: enclosed waiting area, public restrooms, public payphones, vending machines.
Nuclear power plants:
Turkey Point 3. Westinghouse Electric Corp.Bechtel Corp.Westinghouse Electric Corp.Florida Power and Light Co.Pressurized Water Reactor (PWR). Net Output: 666 MWe. Operable. Initial criticality: 10/1972. Commercial start: 12/1972..
Turkey Point 4. Westinghouse Electric Corp.Bechtel Corp.Westinghouse Electric Corp.Florida Power and Light Co.Pressurized Water Reactor (PWR). Net Output: 666 MWe. Operable. Initial criticality: 06/1973. Commercial start: 09/1973..
Colleges/universities with over 2000 students nearest to Florida City:
Florida International University (about 23 miles; Miami, FL ; Full-time enrollment: 41,234)
Florida Career College-Miami (about 23 miles; Miami, FL ; FT enrollment: 10,133)
University of Miami (about 23 miles; Coral Gables, FL ; FT enrollment: 13,674)
Miami Dade College (about 30 miles; Miami, FL ; FT enrollment: 53,787)
AI Miami International University of Art and Design (about 30 miles; Miami, FL ; FT enrollment: 3,578)
Florida National University-Main Campus (about 31 miles; Hialeah, FL ; FT enrollment: 4,106)
Barry University (about 35 miles; Miami, FL ; FT enrollment: 7,181)
Public high schools in Florida City: LAWRENCE ACADEMY SENIOR HIGH CHARTER SCHOOL Students: 76, Location: 530 SW 1ST ST, Grades: 9-12, Charter school )DADE JUVENILE RESIDENTIAL FACILITY Location: 18500 SW 424TH ST, Grades: 6-12)
MIAMI COMMUNITY CHARTER HIGH SCHOOL Location: 18720 SW 352ND ST, Grades: 9-12, Charter school )
Private high school in Florida City: BARRINGTON CHRISTIAN ACADEMY Students: 304, Location: 1013 N REDLAND RD, Grades: PK-12)
Public elementary/middle schools in Florida City: FLORIDA CITY ELEMENTARY SCHOOL Students: 1,278, Location: 364 NW 6TH AVE, Grades: PK-5)MIAMI COMMUNITY CHARTER SCHOOL Students: 332, Location: 101 S REDLAND RD, Grades: PK-5, Charter school )LAWRENCE ACADEMY Students: 148, Location: 530 SW 1ST ST, Grades: 6-8, Charter school )MIAMI COMMUNITY CHARTER MIDDLE SCHOOL Students: 100, Location: 18720 SW 352ND ST, Grades: 6-8, Charter school )LINCOLN-MARTI SCHOOLS INTERNATIONAL CAMPUS Location: 103 E LUCY ST, Grades: KG-6, Charter school )Private elementary/middle school in Florida City: BETHEL SDA ELEMENTARY SCHOOL Students: 47, Location: 32920 SW 187TH AVE, Grades: PK-8)
See full list of schools located in Florida City User-submitted facts and corrections:
Florida City Elementary was changed to Laura C Saunders Elementary
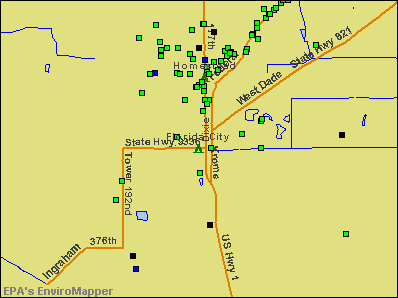
Notable locations in Florida City: (A) , Florida Camper Site (B) , Prime Outlets at Florida City (C) , Southern Comfort Recreational Vehicle Park (D) , YMCA Tatum Park (E) , YWCA Florida City (F) , Pioneer Museum (G) , Lucy Street Clinic (H) , Hudson Early Childhood Education Center (I) , Florida City Police Station (J) , Everglades Visitors Center (K) , Arc Project Thrive Number 4 Day Care Center (L) , Homestead-Florida City Neighborhood Service Center (M) . Display/hide their locations on the map
Churches in Florida City include: (A) , First Presbyterian Church of Homestead (B) , First Pentecostal Church (C) , Church of God (D) , New Hope Assembly of God (E) , Old Curer Presbyterian Church (F) . Display/hide their locations on the map
Parks in Florida City include: (1) , Roberts Park (2) , Community Center (3) , Fasulo Park (4) . Display/hide their locations on the map
Hotels:
Miami-Dade County has a predicted average indoor radon screening level between 2 and 4 pCi/L (pico curies per liter) - Moderate Potential Drinking water stations with addresses in Florida City and their reported violations in the past:
FLORIDA CITY (Population served: 9,445, Groundwater):
Past health violations:
MCL, Monthly (TCR) - In NOV-2007, Contaminant: Coliform
Past monitoring violations:
Follow-up Or Routine LCR Tap M/R - In JAN-01-2011, Contaminant: Lead and Copper Rule. Follow-up actions: St Violation/Reminder Notice (JUN-27-2012)
Monitoring and Reporting (DBP) - Between JUL-2010 and SEP-2010, Contaminant: TTHM. Follow-up actions: St Public Notif requested (JAN-04-2011)
Monitoring and Reporting (DBP) - Between JUL-2010 and SEP-2010, Contaminant: Total Haloacetic Acids (HAA5). Follow-up actions: St Public Notif requested (JAN-04-2011)
Monitoring and Reporting (DBP) - Between OCT-2005 and DEC-2005, Contaminant: Total Haloacetic Acids (HAA5). Follow-up actions: St Violation/Reminder Notice (MAY-01-2006)
Follow-up Or Routine LCR Tap M/R - In SEP-30-2005, Contaminant: Lead and Copper Rule. Follow-up actions: St Violation/Reminder Notice (JAN-09-2006), St Formal NOV issued (JAN-26-2006), St Violation/Reminder Notice (JUL-11-2006), St BCA signed (AUG-14-2006)
One routine major monitoring violation
Population served: 75, Groundwater):
Past health violations:
MCL, Monthly (TCR) - In JUN-2013, Contaminant: Coliform. Follow-up actions: St Public Notif requested (JUN-14-2013), St Intentional no-action (JUL-30-2013), St Compliance achieved (AUG-19-2013)
MCL, Monthly (TCR) - In MAY-2013, Contaminant: Coliform. Follow-up actions: St Public Notif requested (MAY-15-2013), St Compliance achieved (AUG-19-2013)
MCL, Monthly (TCR) - In NOV-2007, Contaminant: Coliform
Past monitoring violations:
Monitoring and Reporting (DBP) - Between OCT-2011 and DEC-2011, Contaminant: Total Haloacetic Acids (HAA5). Follow-up actions: St Public Notif requested (JAN-20-2012), St Violation/Reminder Notice (JAN-20-2012), St Compliance achieved (AUG-15-2013)
Monitoring and Reporting (DBP) - Between OCT-2011 and DEC-2011, Contaminant: TTHM. Follow-up actions: St Public Notif requested (JAN-20-2012), St Violation/Reminder Notice (JAN-20-2012), St Compliance achieved (AUG-15-2013)
Follow-up Or Routine LCR Tap M/R - In JAN-01-2010, Contaminant: Lead and Copper Rule
Monitoring, Repeat Major (TCR) - In NOV-2007, Contaminant: Coliform (TCR)
2 routine major monitoring violations
4 minor monitoring violations
Drinking water stations with addresses in Florida City that have no violations reported:
LAST CHANCE LOUNGE (Population served: 100, Primary Water Source Type: Groundwater)
Average household size: This city:
3.4 peopleFlorida:
2.5 people
Percentage of family households: This city:
74.8%Whole state:
65.2%
Percentage of households with unmarried partners: This city:
11.0%Whole state:
7.3%
Likely homosexual households (counted as self-reported same-sex unmarried-partner households)
Lesbian couples: 0.3% of all households Gay men: 0.4% of all households
12 people in emergency and transitional shelters (with sleeping facilities) for people experiencing homelessness in 2010people in group homes intended for adults in 2010People in group quarters in Florida City in 2000:
10 people in homes for the mentally retarded
6 people in other group homes
4 people in other noninstitutional group quarters
Banks with branches in Florida City (2011 data):
Community Bank of Florida, Inc.: Florida City Branch at 302 West Palm Drive, branch established on 1979/09/27. Info updated 2006/11/03: Bank assets: $525.2 mil, Deposits: $459.3 mil, headquarters in Homestead, FL, negative income in the last year , Commercial Lending Specialization, 12 total offices , Holding Company: Community Bank Of South Florida, Inc.
JPMorgan Chase Bank, National Association: Florida City Banking Center at 33390 South Dixie Highway, branch established on 2012/02/23. Info updated 2011/11/10: Bank assets: $1,811,678.0 mil, Deposits: $1,190,738.0 mil, headquarters in Columbus, OH, positive income , International Specialization, 5577 total offices , Holding Company: Jpmorgan Chase & Co.
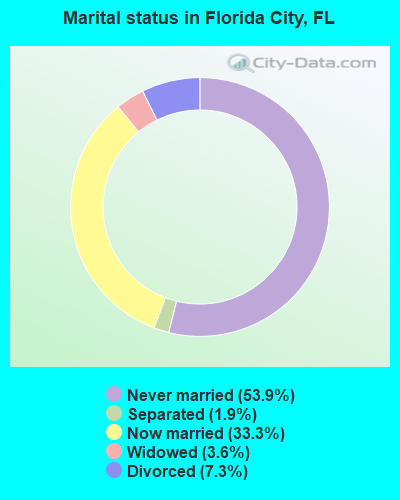
For population 15 years and over in Florida City:
Never married: 53.9%Now married: 33.3%Separated: 1.9%Widowed: 3.6%Divorced: 7.3% For population 25 years and over in Florida City:
High school or higher: 65.5%Bachelor's degree or higher: 6.6%Graduate or professional degree: 2.7%Unemployed: 18.6%Mean travel time to work (commute): 29.7 minutes
Education Gini index (Inequality in education) Here:
20.1Florida average:
12.2
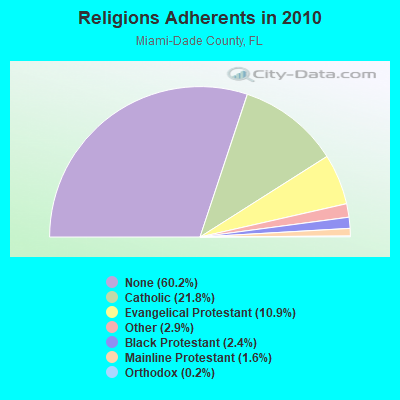
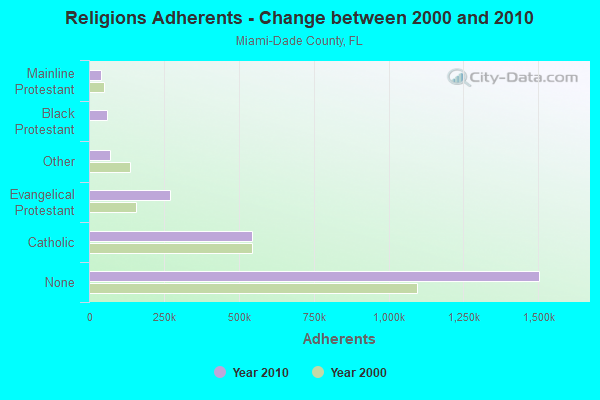
Religion statistics for Florida City, FL (based on Miami-Dade County data)
Religion Adherents Congregations Catholic 544,449 65 Evangelical Protestant 271,814 922 Other 71,458 200 Black Protestant 60,074 94 Mainline Protestant 40,287 146 Orthodox 4,440 10 None 1,503,913 -
Source: Clifford Grammich, Kirk Hadaway, Richard Houseal, Dale E.Jones, Alexei Krindatch, Richie Stanley and Richard H.Taylor. 2012. 2010 U.S.Religion Census: Religious Congregations & Membership Study. Association of Statisticians of American Religious Bodies. Jones, Dale E., et al. 2002. Congregations and Membership in the United States 2000. Nashville, TN: Glenmary Research Center. Graphs represent county-level data
Food Environment Statistics: Number of grocery stores : 597Miami-Dade County :
2.51 / 10,000 pop.State :
2.04 / 10,000 pop.
Number of supercenters and club stores : 15Miami-Dade County :
0.06 / 10,000 pop.State :
0.11 / 10,000 pop.
Number of convenience stores (no gas) : 285This county :
1.20 / 10,000 pop.Florida :
1.28 / 10,000 pop.
Number of convenience stores (with gas) : 473Here :
1.98 / 10,000 pop.Florida :
3.04 / 10,000 pop.
Number of full-service restaurants : 1,610Miami-Dade County :
6.76 / 10,000 pop.State :
7.45 / 10,000 pop.
Adult diabetes rate : Miami-Dade County :
7.9%Florida :
9.2%
Adult obesity rate : This county :
20.5%Florida :
23.7%
Low-income preschool obesity rate : This county :
15.8%Florida :
14.0%
Health and Nutrition: Healthy diet rate : Florida City:
46.2%State:
51.4%
Average overall health of teeth and gums : Florida City:
44.3%Florida:
49.4%
Average BMI : This city:
29.5Florida:
28.6
People feeling badly about themselves : Florida City:
20.8%Florida:
19.5%
People not drinking alcohol at all : Florida City:
12.0%Florida:
10.7%
Average hours sleeping at night : Florida City:
6.7Florida:
6.9
General health condition : This city:
53.2%Florida:
57.0%
Average condition of hearing : Florida City:
82.9%State:
79.2%
More about Health and Nutrition of Florida City, FL Residents
Local government employment and payroll (March 2022)
Function
Full-time employees
Monthly full-time payroll
Average yearly full-time wage
Part-time employees
Monthly part-time payroll
Police Protection - Officers
37 $251,338 $81,515 0 $0 Streets and Highways
17 $57,260 $40,419 1 $2,312 Water Supply
14 $62,435 $53,516 1 $1,478 Other Government Administration
12 $80,480 $80,480 5 $5,956 Police - Other
12 $34,286 $34,286 4 $3,008 Financial Administration
6 $37,781 $75,562 0 $0 Other and Unallocable
3 $13,047 $52,188 0 $0 Housing and Community Development (Local)
1 $14,124 $169,488 0 $0 Sewerage
1 $4,140 $49,680 0 $0 Parks and Recreation
0 $0 2 $5,051
Totals for Government
103 $554,891 $64,647 13 $17,805
Florida City government finances - Expenditure in 2017 (per resident):
Construction - General - Other: $991,000 ($78.38)
Current Operations - Police Protection: $4,053,000 ($320.55)
Natural Resources - Other: $3,195,000 ($252.69)General - Other: $3,088,000 ($244.23)Sewerage: $2,337,000 ($184.83)Water Utilities: $1,527,000 ($120.77)Central Staff Services: $1,083,000 ($85.65)Financial Administration: $469,000 ($37.09)Parks and Recreation: $310,000 ($24.52)Judicial and Legal Services: $148,000 ($11.71)Housing and Community Development: $100,000 ($7.91)Other Capital Outlay - Natural Resources - Other: $73,000 ($5.77)
Police Protection: $44,000 ($3.48)Parks and Recreation: $21,000 ($1.66)Water Utilities - Interest on Debt: $3,000 ($0.24)
Florida City government finances - Revenue in 2017 (per resident):
Charges - Solid Waste Management: $2,494,000 ($197.25)
Sewerage: $2,335,000 ($184.67)Housing and Community Development: $830,000 ($65.64)Natural Resources - Other: $206,000 ($16.29)Other: $166,000 ($13.13)Parks and Recreation: $30,000 ($2.37)Federal Intergovernmental - Other: $43,000 ($3.40)
Local Intergovernmental - General Local Government Support: $1,700,000 ($134.45)
Other: $459,000 ($36.30)Miscellaneous - Fines and Forfeits: $1,493,000 ($118.08)
General Revenue - Other: $554,000 ($43.82)Interest Earnings: $334,000 ($26.42)Rents: $224,000 ($17.72)Special Assessments: $175,000 ($13.84)Revenue - Water Utilities: $1,139,000 ($90.08)
State Intergovernmental - General Local Government Support: $1,292,000 ($102.18)
Other: $161,000 ($12.73)Water Utilities: $63,000 ($4.98)Tax - Property: $1,863,000 ($147.34)
Occupation and Business License - Other: $928,000 ($73.39)Public Utilities Sales: $840,000 ($66.43)Other License: $468,000 ($37.01)Other Selective Sales: $416,000 ($32.90)Motor Fuels Sales: $242,000 ($19.14)
Florida City government finances - Debt in 2017 (per resident):
Long Term Debt - Beginning Outstanding - Unspecified Public Purpose: $260,000 ($20.56)
Retired Unspecified Public Purpose: $145,000 ($11.47)Outstanding Unspecified Public Purpose: $110,000 ($8.70)
Florida City government finances - Cash and Securities in 2017 (per resident):
Other Funds - Cash and Securities: $27,748,000 ($2194.56)
4.04% of this county's 2021 resident taxpayers lived in other counties in 2020 ($229,296 average adjusted gross income )
Here:
4.04%Florida average:
8.80%
0.03% of residents moved from foreign countries ($357 average AGI )Miami-Dade County:
0.03%Florida average:
0.05%
Top counties from which taxpayers relocated into this county between 2020 and 2021:
5.24% of this county's 2020 resident taxpayers moved to other counties in 2021 ($66,399 average adjusted gross income )
Here:
5.24%Florida average:
7.45%
0.03% of residents moved to foreign countries ($505 average AGI )Miami-Dade County:
0.03%Florida average:
0.04%
Top counties to which taxpayers relocated from this county between 2020 and 2021:
Businesses in Florida City, FL
Name Count Name Count
Aeropostale 1 Knights Inn 1 Best Western 1 La-Z-Boy 1 Burger King 1 Levi Strauss & Co. 1 Circle K 1 Long John Silver's 1 Comfort Inn 1 McDonald's 2 Cracker Barrel 1 Nike 3 Dennys 1 Office Depot 1 Domino's Pizza 1 Panda Express 1 DressBarn 1 Payless 1 Dressbarn 1 RadioShack 1 Dunkin Donuts 1 Ramada 1 Econo Lodge 1 Starbucks 1 Famous Footwear 1 Super 8 1 FedEx 3 T-Mobile 1 GameStop 1 Taco Bell 1 Gap 1 Toys"R"Us 1 Gymboree 1 Travelodge 1 H&R Block 2 U-Haul 4 Holiday Inn 1 UPS 1 Home Depot 1 Verizon Wireless 1 Honda 1 Walgreens 1 IZOD 1 Walmart 1 KFC 1
Strongest AM radio stations in Florida City:
WOIR (1430 AM; 5 kW; HOMESTEAD, FL; Owner: AMANECER CHRISTIAN NETWORK, INC.)
WVCG (1080 AM; 50 kW; CORAL GABLES, FL; Owner: RADIO ONE LICENSES, LLC)
WQBA (1140 AM; 50 kW; MIAMI, FL; Owner: WQBA-AM LICENSE CORP.)
WWFE (670 AM; 50 kW; MIAMI, FL; Owner: FENIX BROADCASTING CORP.)
WSUA (1260 AM; 50 kW; MIAMI, FL; Owner: WSUA BROADCASTING CORPORATION)
WRHB (1020 AM; 9 kW; KENDALL, FL; Owner: NEW WORLD BROADCASTING, INC.)
WAQI (710 AM; 50 kW; MIAMI, FL; Owner: LICENSE CORPORATION #1)
WNMA (1210 AM; 49 kW; MIAMI SPRINGS, FL; Owner: RADIO UNICA OF MIAMI LICENSE CORP.)
WRHC (1550 AM; 45 kW; CORAL GABLES, FL; Owner: WRHC BROADCASTING CORP.)
WRFX (940 AM; 50 kW; MIAMI, FL; Owner: CLEAR CHANNEL BROADCASTING LICENSES, INC.)
WWNN (1470 AM; 50 kW; POMPANO BEACH, FL; Owner: WWNN LICENSE, LLC)
WACC (830 AM; 5 kW; HIALEAH, FL; Owner: RADIO PEACE CATHOLIC BROADCASTING, INC.)
WAXY (790 AM; 5 kW; SOUTH MIAMI, FL; Owner: JEFFERSON-PILOT COMMUNICATIONS CO. OF FLORIDA)
Strongest FM radio stations in Florida City:
WRTO (98.3 FM; GOULDS, FL; Owner: LICENSE CORPORATION #2)
WMCU (89.7 FM; MIAMI, FL; Owner: TRINITY INTERNATIONAL FOUNDATION, INC.)
WMFL (88.5 FM; FLORIDA CITY, FL; Owner: FAMILY STATIONS, INC.)
WZMQ (106.3 FM; KEY LARGO, FL; Owner: SOUTH BROADCASTING SYSTEM, INC.)
WRGP (88.1 FM; HOMESTEAD, FL; Owner: FLORIDA INTERNATIONAL UNIVERSITY)
WDNA (88.9 FM; MIAMI, FL; Owner: BASCOMB MEMORIAL BROADCASTING FOUNDATION)
WXDJ (95.7 FM; NORTH MIAMI BEACH, FL; Owner: WXDJ LICENSING, INC.)
WAMR-FM (107.5 FM; MIAMI, FL; Owner: WQBA-FM LICENSE CORP.)
WHQT (105.1 FM; CORAL GABLES, FL; Owner: COX RADIO, INC.)
WLVE (93.9 FM; MIAMI BEACH, FL; Owner: CLEAR CHANNEL BROADCASTING LICENSES, INC.)
WMIB (103.5 FM; FORT LAUDERDALE, FL; Owner: CLEAR CHANNEL BROADCASTING LICENSES, INC.)
WMXJ (102.7 FM; POMPANO BEACH, FL; Owner: JEFFERSON-PILOT COMMUNICATIONS CO. OF FLORIDA)
WPOW (96.5 FM; MIAMI, FL; Owner: WPOW LICENSE LIMITED PARTNERSHIP)
WZTA (94.9 FM; MIAMI BEACH, FL; Owner: CLEAR CHANNEL BROADCASTING LICENSES, INC.)
WFLC (97.3 FM; MIAMI, FL; Owner: COX RADIO, INC.)
WPYM (93.1 FM; MIAMI, FL; Owner: COX RADIO-MIAMI, LLC)
WBGG-FM (105.9 FM; FORT LAUDERDALE, FL; Owner: CLEAR CHANNEL BROADCASTING LICENSES, INC.)
WCMQ-FM (92.3 FM; HIALEAH, FL; Owner: WCMQ LICENSING, INC.)
WHYI-FM (100.7 FM; FORT LAUDERDALE, FL; Owner: CLEAR CHANNEL BROADCASTING LICENSES, INC.)
WKIS (99.9 FM; BOCA RATON, FL; Owner: WKIS LICENSE LIMITED PARTNERSHIP)
TV broadcast stations around Florida City:
WTVJ (Channel 6; MIAMI, FL; Owner: NBC STATIONS MANAGEMENT, INC.)
WGEN-LP (Channel 55; MIAMI, FL; Owner: WDLP BROADCASTING COMPANY, LLC)
WPMF-LP (Channel 31; MIAMI, FL; Owner: JAMES J. CHLADEK)
W54BB (Channel 54; ROCK HARBOR, FL; Owner: WDLP BROADCASTING COMPANY, LLC)
WEYS-LP (Channel 56; ROCK HARBOR, FL; Owner: CAYO HUESO NETWORKS, LLC)
WIMP-CA (Channel 25; MIAMI, FL; Owner: SUNSHINE BROADCASTING COMPANY, INC.)
W67AP (Channel 67; ROCK HARBOR, FL; Owner: MAKO COMMUNICATIONS, LLC)
WPBT (Channel 2; MIAMI, FL; Owner: COMMUNITY TV FOUNDATION OF S. FLORIDA, INC.)
WJAN-CA (Channel 41; MIAMI, FL; Owner: SHERJAN BROADCASTING COMPANY, INC.)
WSVN (Channel 7; MIAMI, FL; Owner: SUNBEAM TELEVISION CORP.)
WVEB-CA (Channel 21; MIAMI, ETC., FL; Owner: HISPANIC KEYS BROADCASTING CORPORATION)
W32AB (Channel 32; MATECUMBE, FL; Owner: KEY COMMUNICATIONS OF TEXAS)
WPLG (Channel 10; MIAMI, FL; Owner: POST-NEWSWEEK STATIONS, FLORIDA, INC.)
WLTV (Channel 23; MIAMI, FL; Owner: WLTV LICENSE PARTNERSHIP, G.P.)
WLRN-TV (Channel 17; MIAMI, FL; Owner: THE SCHOOL BOARD OF MIAMI - DADE COUNTY, FL)
WAMI-TV (Channel 69; HOLLYWOOD, FL; Owner: TELEFUTURA MIAMI LLC)
WSCV (Channel 51; FORT LAUDERDALE, FL; Owner: TELEMUNDO OF FLORIDA LICENSE CORP.)
WPPB-TV (Channel 63; BOCA RATON, FL; Owner: THE SCHOOL BOARD OF BROWARD COUNTY, FLORIDA)
WBFS-TV (Channel 33; MIAMI, FL; Owner: VIACOM STATIONS GROUP OF MIAMI INC.)
W58BU (Channel 58; HALLANDALE, FL; Owner: NBC STATIONS MANAGEMENT,INC.)
WHFT-TV (Channel 45; MIAMI, FL; Owner: TRINITY BROADCASTING OF FLORIDA, INC.)
WPXM (Channel 35; MIAMI, FL; Owner: PAXSON COMMUNICATIONS LICENSE COMPANY, LLC)
WBZL (Channel 39; MIAMI, FL; Owner: CHANNEL 39, INC.)
W24CA (Channel 24; MARATHON, FL; Owner: KEY COMMUNICATIONS OF TEXAS)
WLMF-LP (Channel 53; MIAMI, FL; Owner: PAGING SYSTEMS, INC.)
National Bridge Inventory (NBI) Statistics 8 Number of bridges62ft / 18.9m Total length $25,000 Total costs103,850 Total average daily traffic7,426 Total average daily truck traffic
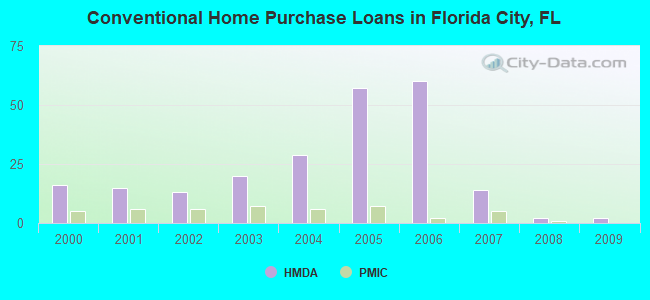
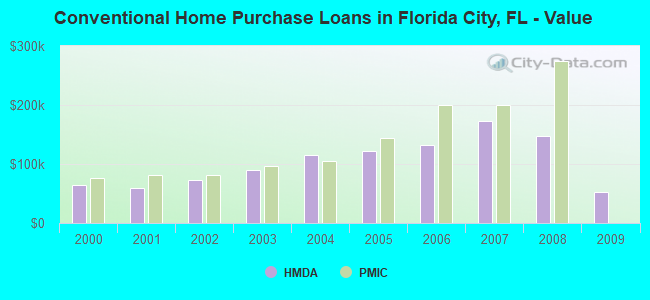
Home Mortgage Disclosure Act Aggregated Statistics For Year 2009(Based on 1 partial tract) A) FHA, FSA/RHS & VA B) Conventional C) Refinancings D) Home Improvement Loans F) Non-occupant Loans on Number Average Value Number Average Value Number Average Value Number Average Value Number Average Value
LOANS ORIGINATED 2 $89,130 2 $52,110 2 $100,535 0 $0 1 $36,840 APPLICATIONS APPROVED, NOT ACCEPTED 1 $89,830 0 $0 0 $0 0 $0 0 $0 APPLICATIONS DENIED 0 $0 1 $231,590 5 $181,906 1 $21,050 2 $171,765 APPLICATIONS WITHDRAWN 0 $0 1 $44,560 1 $200,010 0 $0 0 $0 FILES CLOSED FOR INCOMPLETENESS 0 $0 0 $0 0 $0 0 $0 0 $0
Aggregated Statistics For Year 2008(Based on 1 partial tract) A) FHA, FSA/RHS & VA B) Conventional C) Refinancings D) Home Improvement Loans E) Loans on Dwellings For 5+ Families F) Non-occupant Loans on Number Average Value Number Average Value Number Average Value Number Average Value Number Average Value Number Average Value
LOANS ORIGINATED 0 $0 2 $148,080 7 $152,290 1 $92,290 1 $1,173,760 3 $160,713 APPLICATIONS APPROVED, NOT ACCEPTED 0 $0 2 $158,780 2 $107,375 0 $0 0 $0 1 $144,220 APPLICATIONS DENIED 1 $221,070 4 $122,902 16 $211,001 4 $52,810 0 $0 7 $116,800 APPLICATIONS WITHDRAWN 0 $0 2 $94,040 4 $165,362 0 $0 1 $233,350 2 $171,065 FILES CLOSED FOR INCOMPLETENESS 0 $0 2 $134,570 2 $154,570 0 $0 0 $0 0 $0
Aggregated Statistics For Year 2007(Based on 1 partial tract) A) FHA, FSA/RHS & VA B) Conventional C) Refinancings D) Home Improvement Loans E) Loans on Dwellings For 5+ Families F) Non-occupant Loans on G) Loans On Manufactured Number Average Value Number Average Value Number Average Value Number Average Value Number Average Value Number Average Value Number Average Value
LOANS ORIGINATED 1 $157,550 14 $173,344 31 $172,813 3 $62,810 3 $542,023 12 $187,527 0 $0 APPLICATIONS APPROVED, NOT ACCEPTED 0 $0 10 $170,818 10 $156,817 0 $0 0 $0 4 $163,870 0 $0 APPLICATIONS DENIED 1 $163,520 30 $157,110 31 $169,677 9 $120,047 0 $0 16 $145,141 1 $60,350 APPLICATIONS WITHDRAWN 0 $0 7 $170,687 10 $154,922 1 $254,400 0 $0 2 $202,645 0 $0 FILES CLOSED FOR INCOMPLETENESS 0 $0 2 $225,100 4 $152,730 1 $60,000 0 $0 1 $153,340 0 $0
Aggregated Statistics For Year 2006(Based on 1 partial tract) B) Conventional C) Refinancings D) Home Improvement Loans E) Loans on Dwellings For 5+ Families F) Non-occupant Loans on G) Loans On Manufactured Number Average Value Number Average Value Number Average Value Number Average Value Number Average Value Number Average Value
LOANS ORIGINATED 60 $131,968 36 $146,822 3 $156,737 3 $334,290 29 $142,502 0 $0 APPLICATIONS APPROVED, NOT ACCEPTED 9 $117,434 5 $124,570 0 $0 0 $0 4 $107,728 1 $19,300 APPLICATIONS DENIED 36 $132,455 30 $156,735 7 $98,201 0 $0 18 $145,273 1 $44,210 APPLICATIONS WITHDRAWN 14 $119,857 26 $134,206 4 $163,432 1 $809,880 7 $127,727 0 $0 FILES CLOSED FOR INCOMPLETENESS 4 $80,445 6 $142,465 0 $0 0 $0 2 $128,780 0 $0
Aggregated Statistics For Year 2005(Based on 1 partial tract) A) FHA, FSA/RHS & VA B) Conventional C) Refinancings D) Home Improvement Loans E) Loans on Dwellings For 5+ Families F) Non-occupant Loans on Number Average Value Number Average Value Number Average Value Number Average Value Number Average Value Number Average Value
LOANS ORIGINATED 1 $131,240 57 $121,516 29 $119,076 4 $96,585 1 $262,120 20 $146,886 APPLICATIONS APPROVED, NOT ACCEPTED 0 $0 7 $111,837 7 $86,823 0 $0 0 $0 2 $128,605 APPLICATIONS DENIED 0 $0 26 $109,899 27 $115,589 5 $87,304 0 $0 8 $97,681 APPLICATIONS WITHDRAWN 0 $0 9 $105,426 21 $122,163 1 $88,080 1 $283,530 7 $111,687 FILES CLOSED FOR INCOMPLETENESS 0 $0 2 $126,850 8 $123,210 0 $0 0 $0 0 $0
Aggregated Statistics For Year 2004(Based on 1 partial tract) B) Conventional C) Refinancings D) Home Improvement Loans E) Loans on Dwellings For 5+ Families F) Non-occupant Loans on Number Average Value Number Average Value Number Average Value Number Average Value Number Average Value
LOANS ORIGINATED 29 $114,563 25 $102,378 1 $125,970 1 $370,900 21 $115,095 APPLICATIONS APPROVED, NOT ACCEPTED 7 $85,920 4 $72,548 0 $0 0 $0 3 $87,607 APPLICATIONS DENIED 16 $114,306 28 $96,460 3 $60,940 0 $0 11 $100,900 APPLICATIONS WITHDRAWN 8 $153,475 12 $84,977 0 $0 0 $0 6 $159,660 FILES CLOSED FOR INCOMPLETENESS 1 $132,990 6 $105,562 0 $0 0 $0 2 $80,705
Aggregated Statistics For Year 2003(Based on 1 partial tract) A) FHA, FSA/RHS & VA B) Conventional C) Refinancings D) Home Improvement Loans E) Loans on Dwellings For 5+ Families F) Non-occupant Loans on Number Average Value Number Average Value Number Average Value Number Average Value Number Average Value Number Average Value
LOANS ORIGINATED 2 $82,810 20 $89,848 27 $76,899 0 $0 2 $457,045 15 $78,719 APPLICATIONS APPROVED, NOT ACCEPTED 0 $0 6 $100,357 8 $79,874 0 $0 0 $0 2 $52,635 APPLICATIONS DENIED 0 $0 9 $83,787 27 $87,309 4 $22,108 1 $117,900 8 $76,189 APPLICATIONS WITHDRAWN 1 $58,600 2 $131,590 11 $73,275 0 $0 1 $471,960 2 $104,040 FILES CLOSED FOR INCOMPLETENESS 0 $0 1 $142,470 2 $64,215 0 $0 0 $0 0 $0
Aggregated Statistics For Year 2002(Based on 1 partial tract) A) FHA, FSA/RHS & VA B) Conventional C) Refinancings D) Home Improvement Loans E) Loans on Dwellings For 5+ Families F) Non-occupant Loans on Number Average Value Number Average Value Number Average Value Number Average Value Number Average Value Number Average Value
LOANS ORIGINATED 2 $82,460 13 $72,960 12 $64,508 0 $0 2 $475,820 8 $75,224 APPLICATIONS APPROVED, NOT ACCEPTED 0 $0 3 $64,917 6 $62,577 1 $11,930 1 $111,590 3 $55,090 APPLICATIONS DENIED 1 $88,080 6 $65,385 19 $63,125 4 $29,300 0 $0 4 $80,795 APPLICATIONS WITHDRAWN 0 $0 2 $109,130 8 $80,619 0 $0 0 $0 2 $92,815 FILES CLOSED FOR INCOMPLETENESS 0 $0 1 $51,930 4 $56,582 0 $0 0 $0 0 $0
Aggregated Statistics For Year 2001(Based on 1 partial tract) A) FHA, FSA/RHS & VA B) Conventional C) Refinancings D) Home Improvement Loans E) Loans on Dwellings For 5+ Families F) Non-occupant Loans on Number Average Value Number Average Value Number Average Value Number Average Value Number Average Value Number Average Value
LOANS ORIGINATED 5 $100,638 15 $58,717 10 $55,688 1 $13,330 4 $298,880 5 $66,742 APPLICATIONS APPROVED, NOT ACCEPTED 0 $0 3 $87,373 4 $49,212 0 $0 1 $127,030 1 $61,760 APPLICATIONS DENIED 0 $0 8 $63,512 22 $52,779 5 $14,036 0 $0 4 $53,250 APPLICATIONS WITHDRAWN 0 $0 2 $76,145 8 $57,635 1 $34,390 0 $0 0 $0 FILES CLOSED FOR INCOMPLETENESS 0 $0 1 $112,640 1 $107,020 0 $0 0 $0 0 $0
Aggregated Statistics For Year 2000(Based on 1 partial tract) A) FHA, FSA/RHS & VA B) Conventional C) Refinancings D) Home Improvement Loans E) Loans on Dwellings For 5+ Families F) Non-occupant Loans on Number Average Value Number Average Value Number Average Value Number Average Value Number Average Value Number Average Value
LOANS ORIGINATED 3 $73,457 16 $64,192 8 $48,906 2 $6,665 2 $509,155 2 $73,340 APPLICATIONS APPROVED, NOT ACCEPTED 0 $0 5 $79,234 2 $56,320 1 $8,070 0 $0 1 $98,950 APPLICATIONS DENIED 1 $104,920 17 $87,415 14 $51,031 4 $23,160 0 $0 6 $105,503 APPLICATIONS WITHDRAWN 1 $46,670 4 $79,568 6 $49,652 0 $0 0 $0 2 $72,810 FILES CLOSED FOR INCOMPLETENESS 0 $0 1 $55,790 4 $55,268 0 $0 0 $0 1 $30,880
Detailed HMDA statistics for the following Tracts:
0113.00
Private Mortgage Insurance Companies Aggregated Statistics For Year 2008(Based on 1 partial tract) A) Conventional B) Refinancings Number Average Value Number Average Value
LOANS ORIGINATED 1 $274,400 0 $0 APPLICATIONS APPROVED, NOT ACCEPTED 4 $168,870 1 $229,140 APPLICATIONS DENIED 0 $0 0 $0 APPLICATIONS WITHDRAWN 0 $0 0 $0 FILES CLOSED FOR INCOMPLETENESS 0 $0 0 $0
Aggregated Statistics For Year 2007(Based on 1 partial tract) A) Conventional B) Refinancings C) Non-occupant Loans on Number Average Value Number Average Value Number Average Value
LOANS ORIGINATED 5 $199,872 2 $232,120 1 $221,070 APPLICATIONS APPROVED, NOT ACCEPTED 2 $175,275 1 $204,220 1 $172,990 APPLICATIONS DENIED 0 $0 1 $199,310 0 $0 APPLICATIONS WITHDRAWN 1 $294,760 0 $0 0 $0 FILES CLOSED FOR INCOMPLETENESS 0 $0 0 $0 0 $0
Aggregated Statistics For Year 2006(Based on 1 partial tract) A) Conventional C) Non-occupant Loans on Number Average Value Number Average Value
LOANS ORIGINATED 2 $200,015 1 $134,040 APPLICATIONS APPROVED, NOT ACCEPTED 1 $158,960 0 $0 APPLICATIONS DENIED 0 $0 0 $0 APPLICATIONS WITHDRAWN 0 $0 0 $0 FILES CLOSED FOR INCOMPLETENESS 0 $0 0 $0
Aggregated Statistics For Year 2005(Based on 1 partial tract) A) Conventional B) Refinancings C) Non-occupant Loans on Number Average Value Number Average Value Number Average Value
LOANS ORIGINATED 7 $143,267 0 $0 2 $142,815 APPLICATIONS APPROVED, NOT ACCEPTED 1 $100,710 1 $87,730 0 $0 APPLICATIONS DENIED 1 $79,650 0 $0 0 $0 APPLICATIONS WITHDRAWN 1 $150,190 0 $0 0 $0 FILES CLOSED FOR INCOMPLETENESS 0 $0 0 $0 0 $0
Aggregated Statistics For Year 2004(Based on 1 partial tract) A) Conventional B) Refinancings C) Non-occupant Loans on Number Average Value Number Average Value Number Average Value
LOANS ORIGINATED 6 $104,275 0 $0 2 $119,480 APPLICATIONS APPROVED, NOT ACCEPTED 1 $163,170 1 $135,800 1 $69,830 APPLICATIONS DENIED 1 $150,540 0 $0 0 $0 APPLICATIONS WITHDRAWN 3 $72,987 0 $0 0 $0 FILES CLOSED FOR INCOMPLETENESS 0 $0 0 $0 0 $0
Aggregated Statistics For Year 2003(Based on 1 partial tract) A) Conventional B) Refinancings C) Non-occupant Loans on Number Average Value Number Average Value Number Average Value
LOANS ORIGINATED 7 $95,796 2 $102,285 1 $60,000 APPLICATIONS APPROVED, NOT ACCEPTED 2 $86,850 1 $67,720 1 $56,850 APPLICATIONS DENIED 1 $69,830 0 $0 1 $69,830 APPLICATIONS WITHDRAWN 2 $68,775 0 $0 1 $74,390 FILES CLOSED FOR INCOMPLETENESS 0 $0 0 $0 0 $0
Aggregated Statistics For Year 2002(Based on 1 partial tract) A) Conventional B) Refinancings C) Non-occupant Loans on Number Average Value Number Average Value Number Average Value
LOANS ORIGINATED 6 $80,942 1 $74,040 2 $90,885 APPLICATIONS APPROVED, NOT ACCEPTED 1 $70,180 0 $0 0 $0 APPLICATIONS DENIED 0 $0 0 $0 0 $0 APPLICATIONS WITHDRAWN 1 $31,230 0 $0 1 $52,990 FILES CLOSED FOR INCOMPLETENESS 0 $0 0 $0 0 $0
Aggregated Statistics For Year 2001(Based on 1 partial tract) A) Conventional C) Non-occupant Loans on Number Average Value Number Average Value
LOANS ORIGINATED 6 $81,760 1 $100,710 APPLICATIONS APPROVED, NOT ACCEPTED 1 $124,570 0 $0 APPLICATIONS DENIED 0 $0 0 $0 APPLICATIONS WITHDRAWN 0 $0 0 $0 FILES CLOSED FOR INCOMPLETENESS 0 $0 0 $0
Aggregated Statistics For Year 2000(Based on 1 partial tract) A) Conventional B) Refinancings C) Non-occupant Loans on Number Average Value Number Average Value Number Average Value
LOANS ORIGINATED 5 $76,146 1 $80,010 1 $66,320 APPLICATIONS APPROVED, NOT ACCEPTED 1 $118,600 0 $0 0 $0 APPLICATIONS DENIED 1 $112,640 0 $0 0 $0 APPLICATIONS WITHDRAWN 1 $40,700 0 $0 0 $0 FILES CLOSED FOR INCOMPLETENESS 0 $0 0 $0 0 $0
Detailed PMIC statistics for the following Tracts:
0113.00
Fire-safe hotels and motels in Florida City, Florida:
Park Royal Inn, 100 US 1, Florida City, Florida 33034 Fax: (305) 245-8578
A-1 Executive Motel, 815 N Krome Ave, Florida City, Florida 33030
Best Western Florida City, 411 S Krome Ave, Florida City, Florida 33034 Phone: (305) 246-5100, Fax: (305) 242-0056
Baymont Florida City, 553 NE 1st Ave, Florida City, Florida 33034 Phone: (305) 248-9300
Days Inn Florida City, 124 E Palm Dr, Florida City, Florida 33034 Phone: (305) 247-8833, Fax: (305) 247-6456
Travelodge, 409 SE 1st Ave, Florida City, Florida 33034 Phone: (305) 248-9777, Fax: (305) 248-9750
All 6 fire-safe hotels and motels in Florida City, Florida Florida City compared to Florida state average:
Black race population percentage significantly above state average. Hispanic race population percentage significantly above state average. Median age significantly below state average. Foreign-born population percentage significantly above state average. Renting percentage above state average. Length of stay since moving in above state average. Percentage of population with a bachelor's degree or higher significantly below state average. Florida City on our top lists :
#11 on the list of "Top 101 cities with the highest city-data.com crime index, excludes tourist destinations and others with a lot of outsiders visiting based on city industries data (population 5,000+)"
#14 on the list of "Top 101 cities with the largest household incomes disparities (population 5,000+)"
#17 on the list of "Top 101 cities with the highest number of robberies per 100,000 residents, excludes tourist destinations and others with a lot of outsiders visiting based on city industries data (population 5,000+)"
#23 on the list of "Top 101 cities with the most residents born in Panama (population 500+)"
#34 on the list of "Top 101 cities with largest percentage of males in occupations: building and grounds cleaning and maintenance occupations (population 5,000+)"
#38 on the list of "Top 101 cities with the most residents born in Haiti (population 500+)"
#40 on the list of "Top 101 cities with the highest number of thefts per 100,000 residents, excludes tourist destinations and others with a lot of outsiders visiting based on city industries data (population 5,000+)"
#42 on the list of "Top 101 cities with the highest number of assaults per 100,000 residents, excludes tourist destinations and others with a lot of outsiders visiting based on city industries data (population 5,000+)"
#63 on the list of "Top 101 cities with largest percentage of males in industries: administrative and support and waste management services (population 5,000+)"
#63 on the list of "Top 100 least-safe cities (highest city-data.com crime index)"
#64 on the list of "Top 101 cities with largest percentage of males in occupations: health technologists and technicians (population 5,000+)"
#88 on the list of "Top 101 cities with the most recent year of entry for the foreign-born population (2,000+ people)+"
#95 on the list of "Top 101 cities with largest percentage of females in occupations: farming, fishing, and forestry occupations (population 5,000+)"
#96 on the list of "Top 101 cities with the largest city-data.com crime index per police officer (population 5,000+)"
#96 on the list of "Top 101 cities with the most residents born in Cuba (population 500+)"
#99 on the list of "Top 101 cities with the highest number of murders per 100,000 residents, excludes tourist destinations and others with a lot of outsiders visiting based on city industries data (population 5,000+)"
#2 on the list of "Top 101 counties with the highest ground withdrawal of fresh water for public supply"
#8 on the list of "Top 101 counties with the most Evangelical Protestant congregations"
#9 on the list of "Top 101 counties with the most Black Protestant adherents"
#11 on the list of "Top 101 counties with the highest total withdrawal of fresh water for public supply (pop. 50,000+)"
#12 on the list of "Top 101 counties with the most Evangelical Protestant adherents (pop. 50,000+)"


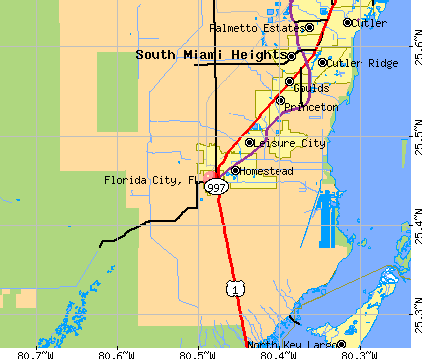


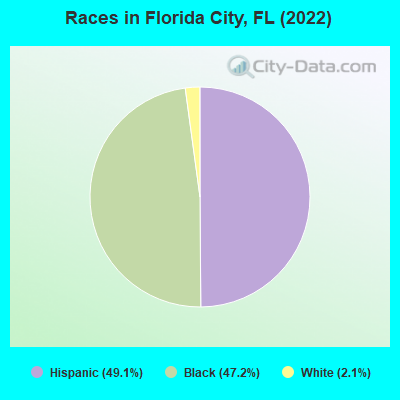
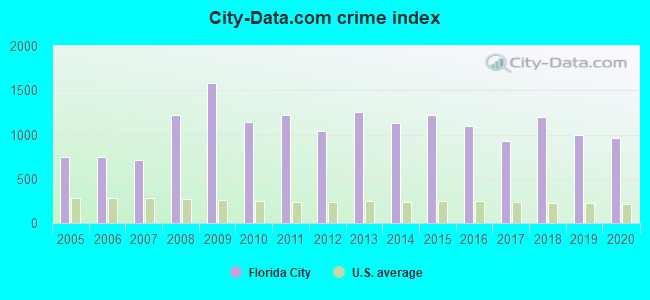
 Recent articles from our blog. Our writers, many of them Ph.D. graduates or candidates, create easy-to-read articles on a wide variety of topics.


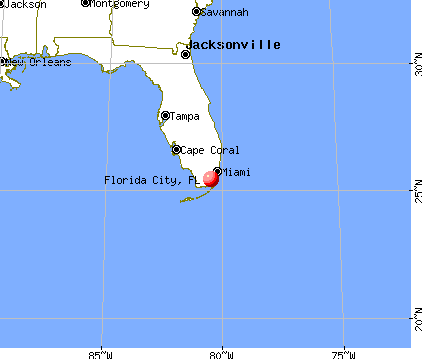
 , pop. 155,589).