DeForest, Wisconsin Submit your own pictures of this village and show them to the world
OSM Map
General Map
Google Map
MSN Map
OSM Map
General Map
Google Map
MSN Map
OSM Map
General Map
Google Map
MSN Map
OSM Map
General Map
Google Map
MSN Map
Please wait while loading the map...
Population in 2022: 10,893 (96% urban, 4% rural). Population change since 2000: +47.8%Males: 5,148 Females: 5,745
March 2022 cost of living index in DeForest: 96.2 (near average, U.S. average is 100) Percentage of residents living in poverty in 2022: 9.1%for White Non-Hispanic residents , 47.7% for Hispanic or Latino residents , 54.1% for other race residents , 20.1% for two or more races residents )
Profiles of local businesses
Business Search - 14 Million verified businesses
Data:
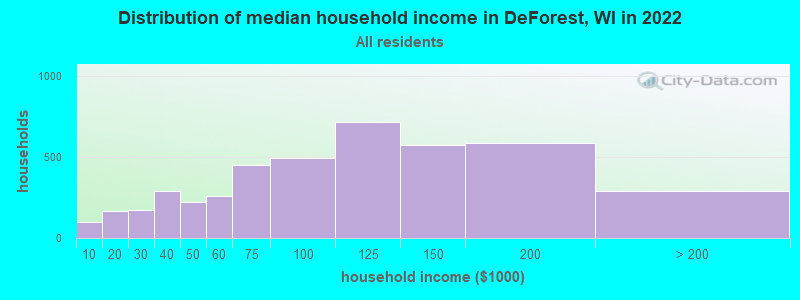
Median household income ($)
Median household income (% change since 2000)
Household income diversity
Ratio of average income to average house value (%)
Ratio of average income to average rent
Median household income ($) - White
Median household income ($) - Black or African American
Median household income ($) - Asian
Median household income ($) - Hispanic or Latino
Median household income ($) - American Indian and Alaska Native
Median household income ($) - Multirace
Median household income ($) - Other Race
Median household income for houses/condos with a mortgage ($)
Median household income for apartments without a mortgage ($)
Races - White alone (%)
Races - White alone (% change since 2000)
Races - Black alone (%)
Races - Black alone (% change since 2000)
Races - American Indian alone (%)
Races - American Indian alone (% change since 2000)
Races - Asian alone (%)
Races - Asian alone (% change since 2000)
Races - Hispanic (%)
Races - Hispanic (% change since 2000)
Races - Native Hawaiian and Other Pacific Islander alone (%)
Races - Native Hawaiian and Other Pacific Islander alone (% change since 2000)
Races - Two or more races (%)
Races - Two or more races (% change since 2000)
Races - Other race alone (%)
Races - Other race alone (% change since 2000)
Racial diversity
Unemployment (%)
Unemployment (% change since 2000)
Unemployment (%) - White
Unemployment (%) - Black or African American
Unemployment (%) - Asian
Unemployment (%) - Hispanic or Latino
Unemployment (%) - American Indian and Alaska Native
Unemployment (%) - Multirace
Unemployment (%) - Other Race
Population density (people per square mile)
Population - Males (%)
Population - Females (%)
Population - Males (%) - White
Population - Males (%) - Black or African American
Population - Males (%) - Asian
Population - Males (%) - Hispanic or Latino
Population - Males (%) - American Indian and Alaska Native
Population - Males (%) - Multirace
Population - Males (%) - Other Race
Population - Females (%) - White
Population - Females (%) - Black or African American
Population - Females (%) - Asian
Population - Females (%) - Hispanic or Latino
Population - Females (%) - American Indian and Alaska Native
Population - Females (%) - Multirace
Population - Females (%) - Other Race
Coronavirus confirmed cases (May 23, 2024)
Deaths caused by coronavirus (May 23, 2024)
Coronavirus confirmed cases (per 100k population) (May 23, 2024)
Deaths caused by coronavirus (per 100k population) (May 23, 2024)
Daily increase in number of cases (May 23, 2024)
Weekly increase in number of cases (May 23, 2024)
Cases doubled (in days) (May 23, 2024)
Hospitalized patients (Apr 18, 2022)
Negative test results (Apr 18, 2022)
Total test results (Apr 18, 2022)
COVID Vaccine doses distributed (per 100k population) (Sep 19, 2023)
COVID Vaccine doses administered (per 100k population) (Sep 19, 2023)
COVID Vaccine doses distributed (Sep 19, 2023)
COVID Vaccine doses administered (Sep 19, 2023)
Likely homosexual households (%)
Likely homosexual households (% change since 2000)
Likely homosexual households - Lesbian couples (%)
Likely homosexual households - Lesbian couples (% change since 2000)
Likely homosexual households - Gay men (%)
Likely homosexual households - Gay men (% change since 2000)
Cost of living index
Median gross rent ($)
Median contract rent ($)
Median monthly housing costs ($)
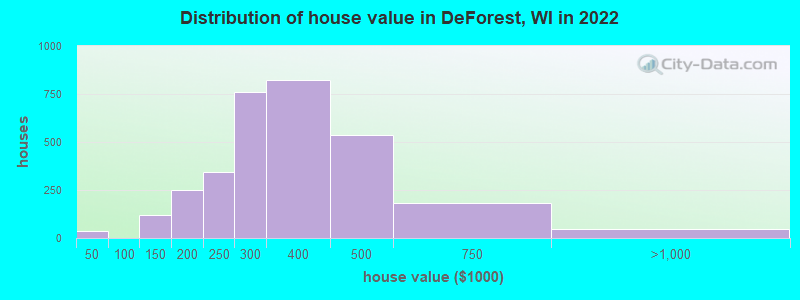
Median house or condo value ($)
Median house or condo value ($ change since 2000)
Mean house or condo value by units in structure - 1, detached ($)
Mean house or condo value by units in structure - 1, attached ($)
Mean house or condo value by units in structure - 2 ($)
Mean house or condo value by units in structure by units in structure - 3 or 4 ($)
Mean house or condo value by units in structure - 5 or more ($)
Mean house or condo value by units in structure - Boat, RV, van, etc. ($)
Mean house or condo value by units in structure - Mobile home ($)
Median house or condo value ($) - White
Median house or condo value ($) - Black or African American
Median house or condo value ($) - Asian
Median house or condo value ($) - Hispanic or Latino
Median house or condo value ($) - American Indian and Alaska Native
Median house or condo value ($) - Multirace
Median house or condo value ($) - Other Race
Median resident age
Resident age diversity
Median resident age - Males
Median resident age - Females
Median resident age - White
Median resident age - Black or African American
Median resident age - Asian
Median resident age - Hispanic or Latino
Median resident age - American Indian and Alaska Native
Median resident age - Multirace
Median resident age - Other Race
Median resident age - Males - White
Median resident age - Males - Black or African American
Median resident age - Males - Asian
Median resident age - Males - Hispanic or Latino
Median resident age - Males - American Indian and Alaska Native
Median resident age - Males - Multirace
Median resident age - Males - Other Race
Median resident age - Females - White
Median resident age - Females - Black or African American
Median resident age - Females - Asian
Median resident age - Females - Hispanic or Latino
Median resident age - Females - American Indian and Alaska Native
Median resident age - Females - Multirace
Median resident age - Females - Other Race
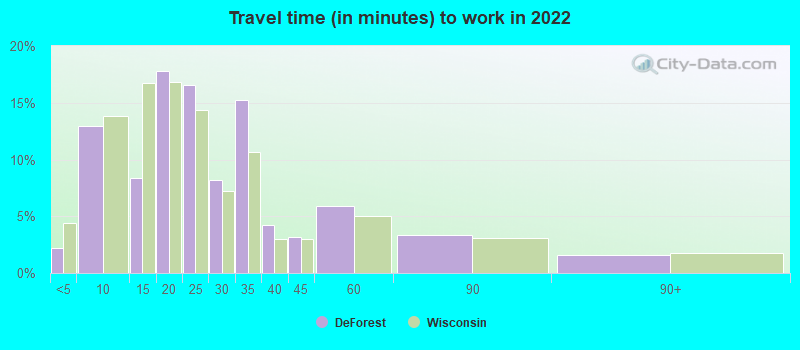
Commute - mean travel time to work (minutes)
Travel time to work - Less than 5 minutes (%)
Travel time to work - Less than 5 minutes (% change since 2000)
Travel time to work - 5 to 9 minutes (%)
Travel time to work - 5 to 9 minutes (% change since 2000)
Travel time to work - 10 to 19 minutes (%)
Travel time to work - 10 to 19 minutes (% change since 2000)
Travel time to work - 20 to 29 minutes (%)
Travel time to work - 20 to 29 minutes (% change since 2000)
Travel time to work - 30 to 39 minutes (%)
Travel time to work - 30 to 39 minutes (% change since 2000)
Travel time to work - 40 to 59 minutes (%)
Travel time to work - 40 to 59 minutes (% change since 2000)
Travel time to work - 60 to 89 minutes (%)
Travel time to work - 60 to 89 minutes (% change since 2000)
Travel time to work - 90 or more minutes (%)
Travel time to work - 90 or more minutes (% change since 2000)
Marital status - Never married (%)
Marital status - Now married (%)
Marital status - Separated (%)
Marital status - Widowed (%)
Marital status - Divorced (%)
Median family income ($)
Median family income (% change since 2000)
Median non-family income ($)
Median non-family income (% change since 2000)
Median per capita income ($)
Median per capita income (% change since 2000)
Median family income ($) - White
Median family income ($) - Black or African American
Median family income ($) - Asian
Median family income ($) - Hispanic or Latino
Median family income ($) - American Indian and Alaska Native
Median family income ($) - Multirace
Median family income ($) - Other Race
Median year house/condo built
Median year apartment built
Year house built - Built 2005 or later (%)
Year house built - Built 2000 to 2004 (%)
Year house built - Built 1990 to 1999 (%)
Year house built - Built 1980 to 1989 (%)
Year house built - Built 1970 to 1979 (%)
Year house built - Built 1960 to 1969 (%)
Year house built - Built 1950 to 1959 (%)
Year house built - Built 1940 to 1949 (%)
Year house built - Built 1939 or earlier (%)
Average household size
Household density (households per square mile)
Average household size - White
Average household size - Black or African American
Average household size - Asian
Average household size - Hispanic or Latino
Average household size - American Indian and Alaska Native
Average household size - Multirace
Average household size - Other Race
Occupied housing units (%)
Vacant housing units (%)
Owner occupied housing units (%)
Renter occupied housing units (%)
Vacancy status - For rent (%)
Vacancy status - For sale only (%)
Vacancy status - Rented or sold, not occupied (%)
Vacancy status - For seasonal, recreational, or occasional use (%)
Vacancy status - For migrant workers (%)
Vacancy status - Other vacant (%)
Residents with income below the poverty level (%)
Residents with income below 50% of the poverty level (%)
Children below poverty level (%)
Poor families by family type - Married-couple family (%)
Poor families by family type - Male, no wife present (%)
Poor families by family type - Female, no husband present (%)
Poverty status for native-born residents (%)
Poverty status for foreign-born residents (%)
Poverty among high school graduates not in families (%)
Poverty among people who did not graduate high school not in families (%)
Residents with income below the poverty level (%) - White
Residents with income below the poverty level (%) - Black or African American
Residents with income below the poverty level (%) - Asian
Residents with income below the poverty level (%) - Hispanic or Latino
Residents with income below the poverty level (%) - American Indian and Alaska Native
Residents with income below the poverty level (%) - Multirace
Residents with income below the poverty level (%) - Other Race
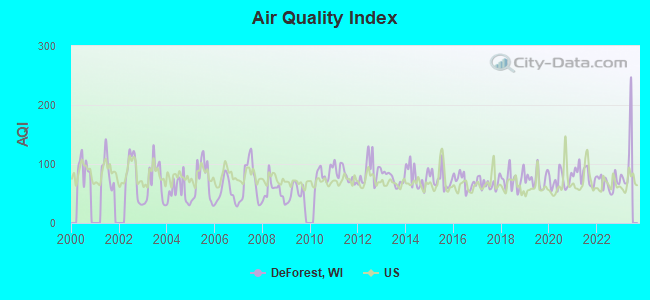
Air pollution - Air Quality Index (AQI)
Air pollution - CO
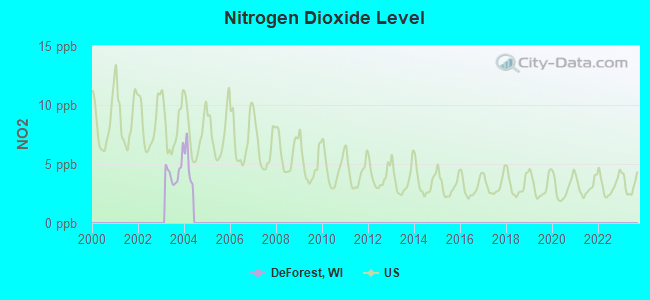
Air pollution - NO2
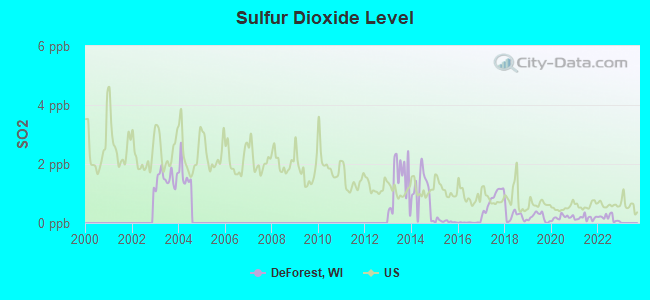
Air pollution - SO2
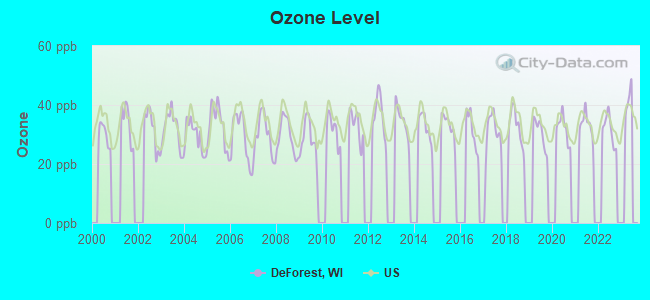
Air pollution - Ozone
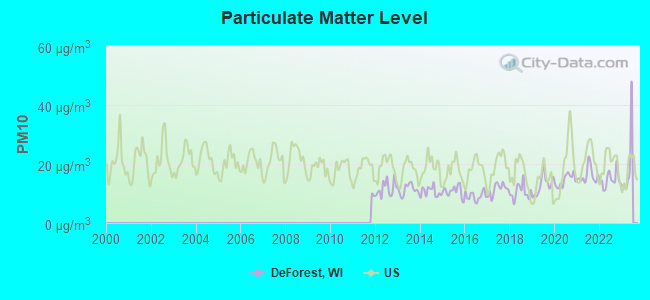
Air pollution - PM10
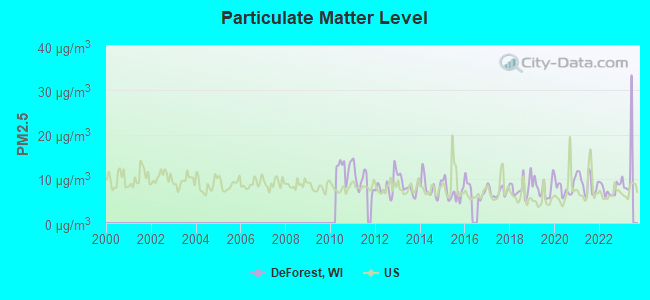
Air pollution - PM25
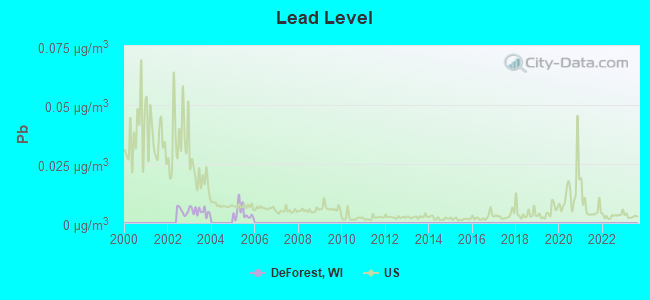
Air pollution - Pb
Crime - Murders per 100,000 population
Crime - Rapes per 100,000 population
Crime - Robberies per 100,000 population
Crime - Assaults per 100,000 population
Crime - Burglaries per 100,000 population
Crime - Thefts per 100,000 population
Crime - Auto thefts per 100,000 population
Crime - Arson per 100,000 population
Crime - City-data.com crime index
Crime - Violent crime index
Crime - Property crime index
Crime - Murders per 100,000 population (5 year average)
Crime - Rapes per 100,000 population (5 year average)
Crime - Robberies per 100,000 population (5 year average)
Crime - Assaults per 100,000 population (5 year average)
Crime - Burglaries per 100,000 population (5 year average)
Crime - Thefts per 100,000 population (5 year average)
Crime - Auto thefts per 100,000 population (5 year average)
Crime - Arson per 100,000 population (5 year average)
Crime - City-data.com crime index (5 year average)
Crime - Violent crime index (5 year average)
Crime - Property crime index (5 year average)
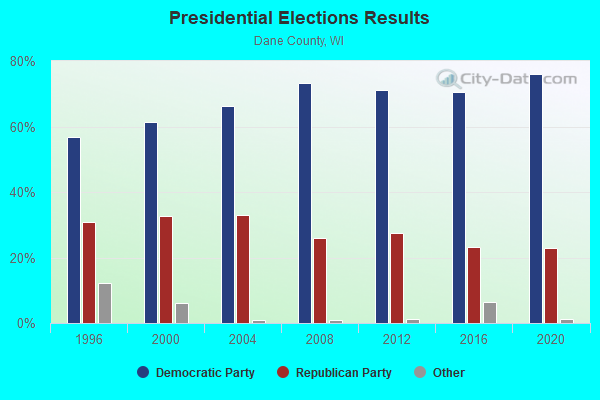
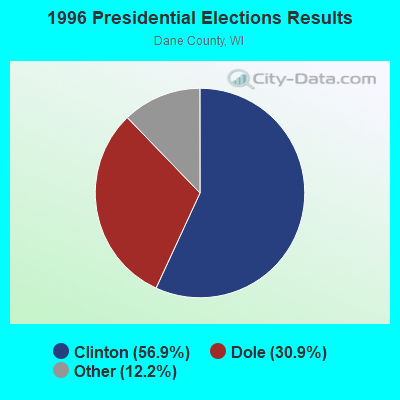
1996 Presidential Elections Results (%) - Democratic Party (Clinton)
1996 Presidential Elections Results (%) - Republican Party (Dole)
1996 Presidential Elections Results (%) - Other
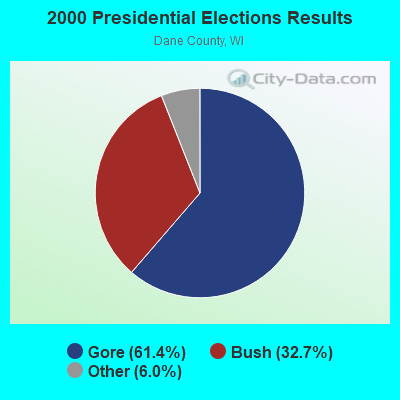
2000 Presidential Elections Results (%) - Democratic Party (Gore)
2000 Presidential Elections Results (%) - Republican Party (Bush)
2000 Presidential Elections Results (%) - Other
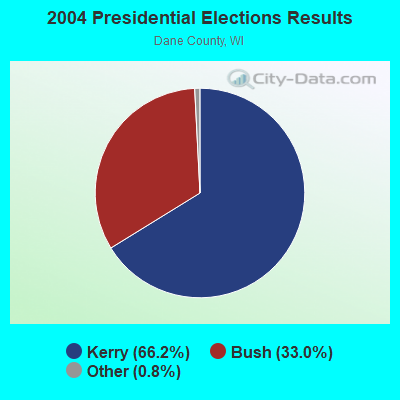
2004 Presidential Elections Results (%) - Democratic Party (Kerry)
2004 Presidential Elections Results (%) - Republican Party (Bush)
2004 Presidential Elections Results (%) - Other
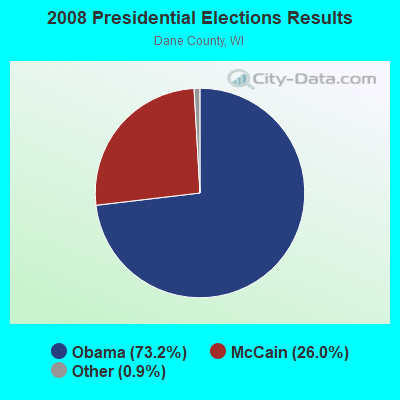
2008 Presidential Elections Results (%) - Democratic Party (Obama)
2008 Presidential Elections Results (%) - Republican Party (McCain)
2008 Presidential Elections Results (%) - Other
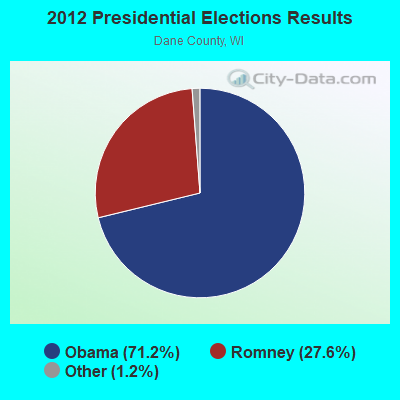
2012 Presidential Elections Results (%) - Democratic Party (Obama)
2012 Presidential Elections Results (%) - Republican Party (Romney)
2012 Presidential Elections Results (%) - Other
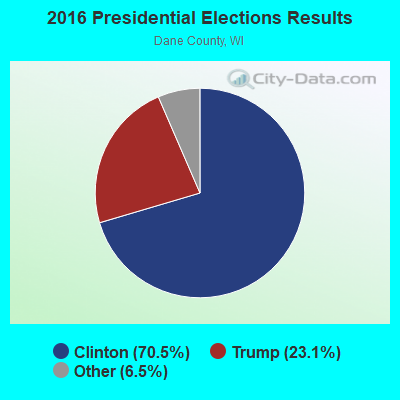
2016 Presidential Elections Results (%) - Democratic Party (Clinton)
2016 Presidential Elections Results (%) - Republican Party (Trump)
2016 Presidential Elections Results (%) - Other
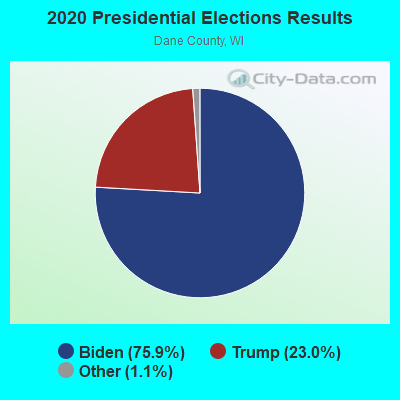
2020 Presidential Elections Results (%) - Democratic Party (Biden)
2020 Presidential Elections Results (%) - Republican Party (Trump)
2020 Presidential Elections Results (%) - Other
Ancestries Reported - Arab (%)
Ancestries Reported - Czech (%)
Ancestries Reported - Danish (%)
Ancestries Reported - Dutch (%)
Ancestries Reported - English (%)
Ancestries Reported - French (%)
Ancestries Reported - French Canadian (%)
Ancestries Reported - German (%)
Ancestries Reported - Greek (%)
Ancestries Reported - Hungarian (%)
Ancestries Reported - Irish (%)
Ancestries Reported - Italian (%)
Ancestries Reported - Lithuanian (%)
Ancestries Reported - Norwegian (%)
Ancestries Reported - Polish (%)
Ancestries Reported - Portuguese (%)
Ancestries Reported - Russian (%)
Ancestries Reported - Scotch-Irish (%)
Ancestries Reported - Scottish (%)
Ancestries Reported - Slovak (%)
Ancestries Reported - Subsaharan African (%)
Ancestries Reported - Swedish (%)
Ancestries Reported - Swiss (%)
Ancestries Reported - Ukrainian (%)
Ancestries Reported - United States (%)
Ancestries Reported - Welsh (%)
Ancestries Reported - West Indian (%)
Ancestries Reported - Other (%)
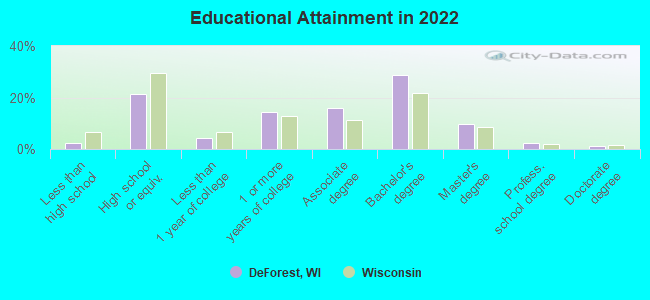
Educational Attainment - No schooling completed (%)
Educational Attainment - Less than high school (%)
Educational Attainment - High school or equivalent (%)
Educational Attainment - Less than 1 year of college (%)
Educational Attainment - 1 or more years of college (%)
Educational Attainment - Associate degree (%)
Educational Attainment - Bachelor's degree (%)
Educational Attainment - Master's degree (%)
Educational Attainment - Professional school degree (%)
Educational Attainment - Doctorate degree (%)
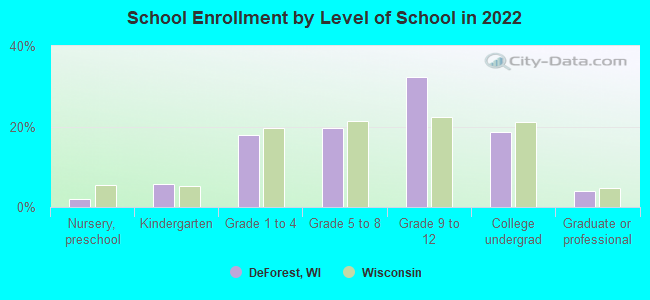
School Enrollment - Nursery, preschool (%)
School Enrollment - Kindergarten (%)
School Enrollment - Grade 1 to 4 (%)
School Enrollment - Grade 5 to 8 (%)
School Enrollment - Grade 9 to 12 (%)
School Enrollment - College undergrad (%)
School Enrollment - Graduate or professional (%)
School Enrollment - Not enrolled in school (%)
School enrollment - Public schools (%)
School enrollment - Private schools (%)
School enrollment - Not enrolled (%)
Median number of rooms in houses and condos
Median number of rooms in apartments
Housing units lacking complete plumbing facilities (%)
Housing units lacking complete kitchen facilities (%)
Density of houses
Urban houses (%)
Rural houses (%)
Households with people 60 years and over (%)
Households with people 65 years and over (%)
Households with people 75 years and over (%)
Households with one or more nonrelatives (%)
Households with no nonrelatives (%)
Population in households (%)
Family households (%)
Nonfamily households (%)
Population in families (%)
Family households with own children (%)
Median number of bedrooms in owner occupied houses
Mean number of bedrooms in owner occupied houses
Median number of bedrooms in renter occupied houses
Mean number of bedrooms in renter occupied houses
Median number of vehichles in owner occupied houses
Mean number of vehichles in owner occupied houses
Median number of vehichles in renter occupied houses
Mean number of vehichles in renter occupied houses
Mortgage status - with mortgage (%)
Mortgage status - with second mortgage (%)
Mortgage status - with home equity loan (%)
Mortgage status - with both second mortgage and home equity loan (%)
Mortgage status - without a mortgage (%)
Average family size
Average family size - White
Average family size - Black or African American
Average family size - Asian
Average family size - Hispanic or Latino
Average family size - American Indian and Alaska Native
Average family size - Multirace
Average family size - Other Race
Geographical mobility - Same house 1 year ago (%)
Geographical mobility - Moved within same county (%)
Geographical mobility - Moved from different county within same state (%)
Geographical mobility - Moved from different state (%)
Geographical mobility - Moved from abroad (%)
Place of birth - Born in state of residence (%)
Place of birth - Born in other state (%)
Place of birth - Native, outside of US (%)
Place of birth - Foreign born (%)
Housing units in structures - 1, detached (%)
Housing units in structures - 1, attached (%)
Housing units in structures - 2 (%)
Housing units in structures - 3 or 4 (%)
Housing units in structures - 5 to 9 (%)
Housing units in structures - 10 to 19 (%)
Housing units in structures - 20 to 49 (%)
Housing units in structures - 50 or more (%)
Housing units in structures - Mobile home (%)
Housing units in structures - Boat, RV, van, etc. (%)
House/condo owner moved in on average (years ago)
Renter moved in on average (years ago)
Year householder moved into unit - Moved in 1999 to March 2000 (%)
Year householder moved into unit - Moved in 1995 to 1998 (%)
Year householder moved into unit - Moved in 1990 to 1994 (%)
Year householder moved into unit - Moved in 1980 to 1989 (%)
Year householder moved into unit - Moved in 1970 to 1979 (%)
Year householder moved into unit - Moved in 1969 or earlier (%)
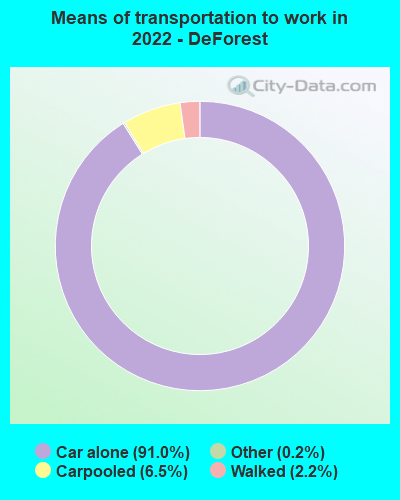
Means of transportation to work - Drove car alone (%)
Means of transportation to work - Carpooled (%)
Means of transportation to work - Public transportation (%)
Means of transportation to work - Bus or trolley bus (%)
Means of transportation to work - Streetcar or trolley car (%)
Means of transportation to work - Subway or elevated (%)
Means of transportation to work - Railroad (%)
Means of transportation to work - Ferryboat (%)
Means of transportation to work - Taxicab (%)
Means of transportation to work - Motorcycle (%)
Means of transportation to work - Bicycle (%)
Means of transportation to work - Walked (%)
Means of transportation to work - Other means (%)
Working at home (%)
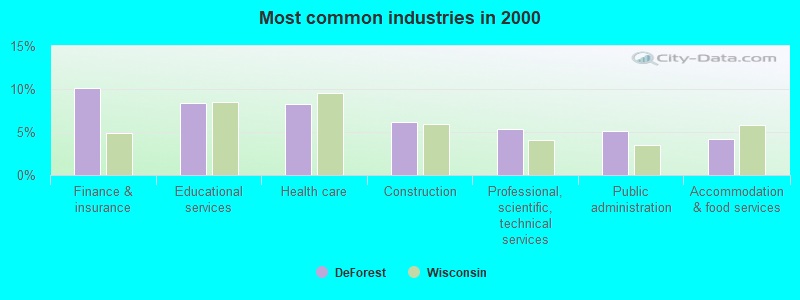
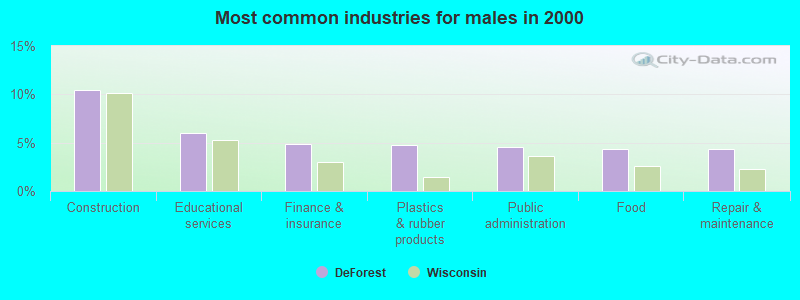
Industry diversity
Most Common Industries - Agriculture, forestry, fishing and hunting, and mining (%)
Most Common Industries - Agriculture, forestry, fishing and hunting (%)
Most Common Industries - Mining, quarrying, and oil and gas extraction (%)
Most Common Industries - Construction (%)
Most Common Industries - Manufacturing (%)
Most Common Industries - Wholesale trade (%)
Most Common Industries - Retail trade (%)
Most Common Industries - Transportation and warehousing, and utilities (%)
Most Common Industries - Transportation and warehousing (%)
Most Common Industries - Utilities (%)
Most Common Industries - Information (%)
Most Common Industries - Finance and insurance, and real estate and rental and leasing (%)
Most Common Industries - Finance and insurance (%)
Most Common Industries - Real estate and rental and leasing (%)
Most Common Industries - Professional, scientific, and management, and administrative and waste management services (%)
Most Common Industries - Professional, scientific, and technical services (%)
Most Common Industries - Management of companies and enterprises (%)
Most Common Industries - Administrative and support and waste management services (%)
Most Common Industries - Educational services, and health care and social assistance (%)
Most Common Industries - Educational services (%)
Most Common Industries - Health care and social assistance (%)
Most Common Industries - Arts, entertainment, and recreation, and accommodation and food services (%)
Most Common Industries - Arts, entertainment, and recreation (%)
Most Common Industries - Accommodation and food services (%)
Most Common Industries - Other services, except public administration (%)
Most Common Industries - Public administration (%)
Occupation diversity
Most Common Occupations - Management, business, science, and arts occupations (%)
Most Common Occupations - Management, business, and financial occupations (%)
Most Common Occupations - Management occupations (%)
Most Common Occupations - Business and financial operations occupations (%)
Most Common Occupations - Computer, engineering, and science occupations (%)
Most Common Occupations - Computer and mathematical occupations (%)
Most Common Occupations - Architecture and engineering occupations (%)
Most Common Occupations - Life, physical, and social science occupations (%)
Most Common Occupations - Education, legal, community service, arts, and media occupations (%)
Most Common Occupations - Community and social service occupations (%)
Most Common Occupations - Legal occupations (%)
Most Common Occupations - Education, training, and library occupations (%)
Most Common Occupations - Arts, design, entertainment, sports, and media occupations (%)
Most Common Occupations - Healthcare practitioners and technical occupations (%)
Most Common Occupations - Health diagnosing and treating practitioners and other technical occupations (%)
Most Common Occupations - Health technologists and technicians (%)
Most Common Occupations - Service occupations (%)
Most Common Occupations - Healthcare support occupations (%)
Most Common Occupations - Protective service occupations (%)
Most Common Occupations - Fire fighting and prevention, and other protective service workers including supervisors (%)
Most Common Occupations - Law enforcement workers including supervisors (%)
Most Common Occupations - Food preparation and serving related occupations (%)
Most Common Occupations - Building and grounds cleaning and maintenance occupations (%)
Most Common Occupations - Personal care and service occupations (%)
Most Common Occupations - Sales and office occupations (%)
Most Common Occupations - Sales and related occupations (%)
Most Common Occupations - Office and administrative support occupations (%)
Most Common Occupations - Natural resources, construction, and maintenance occupations (%)
Most Common Occupations - Farming, fishing, and forestry occupations (%)
Most Common Occupations - Construction and extraction occupations (%)
Most Common Occupations - Installation, maintenance, and repair occupations (%)
Most Common Occupations - Production, transportation, and material moving occupations (%)
Most Common Occupations - Production occupations (%)
Most Common Occupations - Transportation occupations (%)
Most Common Occupations - Material moving occupations (%)
People in Group quarters - Institutionalized population (%)
People in Group quarters - Correctional institutions (%)
People in Group quarters - Federal prisons and detention centers (%)
People in Group quarters - Halfway houses (%)
People in Group quarters - Local jails and other confinement facilities (including police lockups) (%)
People in Group quarters - Military disciplinary barracks (%)
People in Group quarters - State prisons (%)
People in Group quarters - Other types of correctional institutions (%)
People in Group quarters - Nursing homes (%)
People in Group quarters - Hospitals/wards, hospices, and schools for the handicapped (%)
People in Group quarters - Hospitals/wards and hospices for chronically ill (%)
People in Group quarters - Hospices or homes for chronically ill (%)
People in Group quarters - Military hospitals or wards for chronically ill (%)
People in Group quarters - Other hospitals or wards for chronically ill (%)
People in Group quarters - Hospitals or wards for drug/alcohol abuse (%)
People in Group quarters - Mental (Psychiatric) hospitals or wards (%)
People in Group quarters - Schools, hospitals, or wards for the mentally retarded (%)
People in Group quarters - Schools, hospitals, or wards for the physically handicapped (%)
People in Group quarters - Institutions for the deaf (%)
People in Group quarters - Institutions for the blind (%)
People in Group quarters - Orthopedic wards and institutions for the physically handicapped (%)
People in Group quarters - Wards in general hospitals for patients who have no usual home elsewhere (%)
People in Group quarters - Wards in military hospitals for patients who have no usual home elsewhere (%)
People in Group quarters - Juvenile institutions (%)
People in Group quarters - Long-term care (%)
People in Group quarters - Homes for abused, dependent, and neglected children (%)
People in Group quarters - Residential treatment centers for emotionally disturbed children (%)
People in Group quarters - Training schools for juvenile delinquents (%)
People in Group quarters - Short-term care, detention or diagnostic centers for delinquent children (%)
People in Group quarters - Type of juvenile institution unknown (%)
People in Group quarters - Noninstitutionalized population (%)
People in Group quarters - College dormitories (includes college quarters off campus) (%)
People in Group quarters - Military quarters (%)
People in Group quarters - On base (%)
People in Group quarters - Barracks, unaccompanied personnel housing (UPH), (Enlisted/Officer), ;and similar group living quarters for military personnel (%)
People in Group quarters - Transient quarters for temporary residents (%)
People in Group quarters - Military ships (%)
People in Group quarters - Group homes (%)
People in Group quarters - Homes or halfway houses for drug/alcohol abuse (%)
People in Group quarters - Homes for the mentally ill (%)
People in Group quarters - Homes for the mentally retarded (%)
People in Group quarters - Homes for the physically handicapped (%)
People in Group quarters - Other group homes (%)
People in Group quarters - Religious group quarters (%)
People in Group quarters - Dormitories (%)
People in Group quarters - Agriculture workers' dormitories on farms (%)
People in Group quarters - Job Corps and vocational training facilities (%)
People in Group quarters - Other workers' dormitories (%)
People in Group quarters - Crews of maritime vessels (%)
People in Group quarters - Other nonhousehold living situations (%)
People in Group quarters - Other noninstitutional group quarters (%)
Residents speaking English at home (%)
Residents speaking English at home - Born in the United States (%)
Residents speaking English at home - Native, born elsewhere (%)
Residents speaking English at home - Foreign born (%)
Residents speaking Spanish at home (%)
Residents speaking Spanish at home - Born in the United States (%)
Residents speaking Spanish at home - Native, born elsewhere (%)
Residents speaking Spanish at home - Foreign born (%)
Residents speaking other language at home (%)
Residents speaking other language at home - Born in the United States (%)
Residents speaking other language at home - Native, born elsewhere (%)
Residents speaking other language at home - Foreign born (%)
Class of Workers - Employee of private company (%)
Class of Workers - Self-employed in own incorporated business (%)
Class of Workers - Private not-for-profit wage and salary workers (%)
Class of Workers - Local government workers (%)
Class of Workers - State government workers (%)
Class of Workers - Federal government workers (%)
Class of Workers - Self-employed workers in own not incorporated business and Unpaid family workers (%)
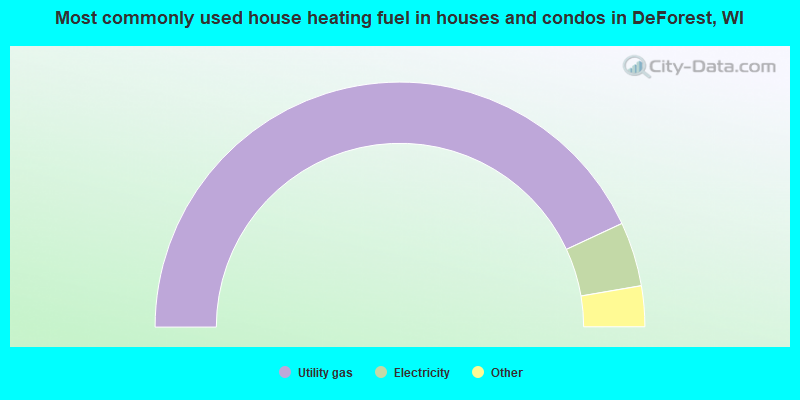
House heating fuel used in houses and condos - Utility gas (%)
House heating fuel used in houses and condos - Bottled, tank, or LP gas (%)
House heating fuel used in houses and condos - Electricity (%)
House heating fuel used in houses and condos - Fuel oil, kerosene, etc. (%)
House heating fuel used in houses and condos - Coal or coke (%)
House heating fuel used in houses and condos - Wood (%)
House heating fuel used in houses and condos - Solar energy (%)
House heating fuel used in houses and condos - Other fuel (%)
House heating fuel used in houses and condos - No fuel used (%)
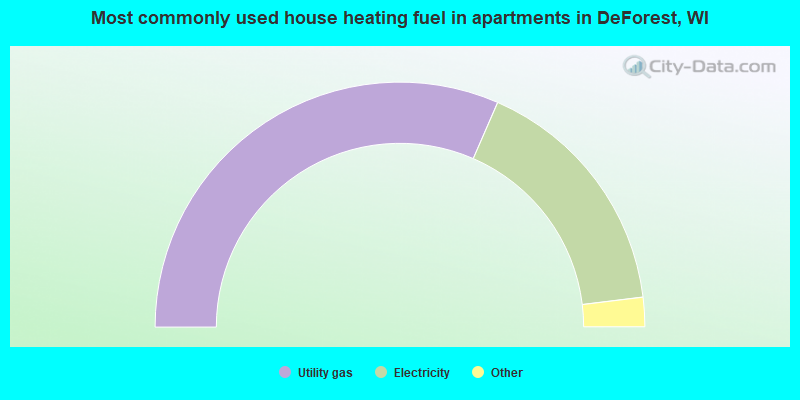
House heating fuel used in apartments - Utility gas (%)
House heating fuel used in apartments - Bottled, tank, or LP gas (%)
House heating fuel used in apartments - Electricity (%)
House heating fuel used in apartments - Fuel oil, kerosene, etc. (%)
House heating fuel used in apartments - Coal or coke (%)
House heating fuel used in apartments - Wood (%)
House heating fuel used in apartments - Solar energy (%)
House heating fuel used in apartments - Other fuel (%)
House heating fuel used in apartments - No fuel used (%)
Armed forces status - In Armed Forces (%)
Armed forces status - Civilian (%)
Armed forces status - Civilian - Veteran (%)
Armed forces status - Civilian - Nonveteran (%)
Fatal accidents locations in years 2005-2021
Fatal accidents locations in 2005
Fatal accidents locations in 2006
Fatal accidents locations in 2007
Fatal accidents locations in 2008
Fatal accidents locations in 2009
Fatal accidents locations in 2010
Fatal accidents locations in 2011
Fatal accidents locations in 2012
Fatal accidents locations in 2013
Fatal accidents locations in 2014
Fatal accidents locations in 2015
Fatal accidents locations in 2016
Fatal accidents locations in 2017
Fatal accidents locations in 2018
Fatal accidents locations in 2019
Fatal accidents locations in 2020
Fatal accidents locations in 2021
Alcohol use - People drinking some alcohol every month (%)
Alcohol use - People not drinking at all (%)
Alcohol use - Average days/month drinking alcohol
Alcohol use - Average drinks/week
Alcohol use - Average days/year people drink much
Audiometry - Average condition of hearing (%)
Audiometry - People that can hear a whisper from across a quiet room (%)
Audiometry - People that can hear normal voice from across a quiet room (%)
Audiometry - Ears ringing, roaring, buzzing (%)
Audiometry - Had a job exposure to loud noise (%)
Audiometry - Had off-work exposure to loud noise (%)
Blood Pressure & Cholesterol - Has high blood pressure (%)
Blood Pressure & Cholesterol - Checking blood pressure at home (%)
Blood Pressure & Cholesterol - Frequently checking blood cholesterol (%)
Blood Pressure & Cholesterol - Has high cholesterol level (%)
Consumer Behavior - Money monthly spent on food at supermarket/grocery store
Consumer Behavior - Money monthly spent on food at other stores
Consumer Behavior - Money monthly spent on eating out
Consumer Behavior - Money monthly spent on carryout/delivered foods
Consumer Behavior - Income spent on food at supermarket/grocery store (%)
Consumer Behavior - Income spent on food at other stores (%)
Consumer Behavior - Income spent on eating out (%)
Consumer Behavior - Income spent on carryout/delivered foods (%)
Current Health Status - General health condition (%)
Current Health Status - Blood donors (%)
Current Health Status - Has blood ever tested for HIV virus (%)
Current Health Status - Left-handed people (%)
Dermatology - People using sunscreen (%)
Diabetes - Diabetics (%)
Diabetes - Had a blood test for high blood sugar (%)
Diabetes - People taking insulin (%)
Diet Behavior & Nutrition - Diet health (%)
Diet Behavior & Nutrition - Milk product consumption (# of products/month)
Diet Behavior & Nutrition - Meals not home prepared (#/week)
Diet Behavior & Nutrition - Meals from fast food or pizza place (#/week)
Diet Behavior & Nutrition - Ready-to-eat foods (#/month)
Diet Behavior & Nutrition - Frozen meals/pizza (#/month)
Drug Use - People that ever used marijuana or hashish (%)
Drug Use - Ever used hard drugs (%)
Drug Use - Ever used any form of cocaine (%)
Drug Use - Ever used heroin (%)
Drug Use - Ever used methamphetamine (%)
Health Insurance - People covered by health insurance (%)
Kidney Conditions-Urology - Avg. # of times urinating at night
Medical Conditions - People with asthma (%)
Medical Conditions - People with anemia (%)
Medical Conditions - People with psoriasis (%)
Medical Conditions - People with overweight (%)
Medical Conditions - Elderly people having difficulties in thinking or remembering (%)
Medical Conditions - People who ever received blood transfusion (%)
Medical Conditions - People having trouble seeing even with glass/contacts (%)
Medical Conditions - People with arthritis (%)
Medical Conditions - People with gout (%)
Medical Conditions - People with congestive heart failure (%)
Medical Conditions - People with coronary heart disease (%)
Medical Conditions - People with angina pectoris (%)
Medical Conditions - People who ever had heart attack (%)
Medical Conditions - People who ever had stroke (%)
Medical Conditions - People with emphysema (%)
Medical Conditions - People with thyroid problem (%)
Medical Conditions - People with chronic bronchitis (%)
Medical Conditions - People with any liver condition (%)
Medical Conditions - People who ever had cancer or malignancy (%)
Mental Health - People who have little interest in doing things (%)
Mental Health - People feeling down, depressed, or hopeless (%)
Mental Health - People who have trouble sleeping or sleeping too much (%)
Mental Health - People feeling tired or having little energy (%)
Mental Health - People with poor appetite or overeating (%)
Mental Health - People feeling bad about themself (%)
Mental Health - People who have trouble concentrating on things (%)
Mental Health - People moving or speaking slowly or too fast (%)
Mental Health - People having thoughts they would be better off dead (%)
Oral Health - Average years since last visit a dentist
Oral Health - People embarrassed because of mouth (%)
Oral Health - People with gum disease (%)
Oral Health - General health of teeth and gums (%)
Oral Health - Average days a week using dental floss/device
Oral Health - Average days a week using mouthwash for dental problem
Oral Health - Average number of teeth
Pesticide Use - Households using pesticides to control insects (%)
Pesticide Use - Households using pesticides to kill weeds (%)
Physical Activity - People doing vigorous-intensity work activities (%)
Physical Activity - People doing moderate-intensity work activities (%)
Physical Activity - People walking or bicycling (%)
Physical Activity - People doing vigorous-intensity recreational activities (%)
Physical Activity - People doing moderate-intensity recreational activities (%)
Physical Activity - Average hours a day doing sedentary activities
Physical Activity - Average hours a day watching TV or videos
Physical Activity - Average hours a day using computer
Physical Functioning - People having limitations keeping them from working (%)
Physical Functioning - People limited in amount of work they can do (%)
Physical Functioning - People that need special equipment to walk (%)
Physical Functioning - People experiencing confusion/memory problems (%)
Physical Functioning - People requiring special healthcare equipment (%)
Prescription Medications - Average number of prescription medicines taking
Preventive Aspirin Use - Adults 40+ taking low-dose aspirin (%)
Reproductive Health - Vaginal deliveries (%)
Reproductive Health - Cesarean deliveries (%)
Reproductive Health - Deliveries resulted in a live birth (%)
Reproductive Health - Pregnancies resulted in a delivery (%)
Reproductive Health - Women breastfeeding newborns (%)
Reproductive Health - Women that had a hysterectomy (%)
Reproductive Health - Women that had both ovaries removed (%)
Reproductive Health - Women that have ever taken birth control pills (%)
Reproductive Health - Women taking birth control pills (%)
Reproductive Health - Women that have ever used Depo-Provera or injectables (%)
Reproductive Health - Women that have ever used female hormones (%)
Sexual Behavior - People 18+ that ever had sex (vaginal, anal, or oral) (%)
Sexual Behavior - Males 18+ that ever had vaginal sex with a woman (%)
Sexual Behavior - Males 18+ that ever performed oral sex on a woman (%)
Sexual Behavior - Males 18+ that ever had anal sex with a woman (%)
Sexual Behavior - Males 18+ that ever had any sex with a man (%)
Sexual Behavior - Females 18+ that ever had vaginal sex with a man (%)
Sexual Behavior - Females 18+ that ever performed oral sex on a man (%)
Sexual Behavior - Females 18+ that ever had anal sex with a man (%)
Sexual Behavior - Females 18+ that ever had any kind of sex with a woman (%)
Sexual Behavior - Average age people first had sex
Sexual Behavior - Average number of female sex partners in lifetime (males 18+)
Sexual Behavior - Average number of female vaginal sex partners in lifetime (males 18+)
Sexual Behavior - Average age people first performed oral sex on a woman (18+)
Sexual Behavior - Average number of woman performed oral sex on in lifetime (18+)
Sexual Behavior - Average number of male sex partners in lifetime (males 18+)
Sexual Behavior - Average number of male anal sex partners in lifetime (males 18+)
Sexual Behavior - Average age people first performed oral sex on a man (18+)
Sexual Behavior - Average number of male oral sex partners in lifetime (18+)
Sexual Behavior - People using protection when performing oral sex (%)
Sexual Behavior - Average number of times people have vaginal or anal sex a year
Sexual Behavior - People having sex without condom (%)
Sexual Behavior - Average number of male sex partners in lifetime (females 18+)
Sexual Behavior - Average number of male vaginal sex partners in lifetime (females 18+)
Sexual Behavior - Average number of female sex partners in lifetime (females 18+)
Sexual Behavior - Circumcised males 18+ (%)
Sleep Disorders - Average hours sleeping at night
Sleep Disorders - People that has trouble sleeping (%)
Smoking-Cigarette Use - People smoking cigarettes (%)
Taste & Smell - People 40+ having problems with smell (%)
Taste & Smell - People 40+ having problems with taste (%)
Taste & Smell - People 40+ that ever had wisdom teeth removed (%)
Taste & Smell - People 40+ that ever had tonsils teeth removed (%)
Taste & Smell - People 40+ that ever had a loss of consciousness because of a head injury (%)
Taste & Smell - People 40+ that ever had a broken nose or other serious injury to face or skull (%)
Taste & Smell - People 40+ that ever had two or more sinus infections (%)
Weight - Average height (inches)
Weight - Average weight (pounds)
Weight - Average BMI
Weight - People that are obese (%)
Weight - People that ever were obese (%)
Weight - People trying to lose weight (%)
According to our research of Wisconsin and other state lists, there were 13 registered sex offenders living in DeForest, Wisconsin as of May 23, 2024 . The ratio of all residents to sex offenders in DeForest is 749 to 1.The ratio of registered sex offenders to all residents in this city is lower than the state average.
Officers per 1,000 residents here:
1.80Wisconsin average:
2.07
Latest news from DeForest, WI collected exclusively by city-data.com from local newspapers, TV, and radio stations
Ancestries: German (37.0%), European (5.0%), Irish (4.8%), American (4.8%), Norwegian (4.4%), English (3.5%).
Current Local Time:
Land area: 4.83 square miles.
Population density: 2,255 people per square mile (low).
290 residents are foreign born (1.6% Latin America , 1.0% Asia ).
This village:
2.7%Wisconsin:
5.0%
Median real estate property taxes paid for housing units with mortgages in 2022: $5,279 (1.6%)Median real estate property taxes paid for housing units with no mortgage in 2022: $4,522 (1.6%)
Nearest city with pop. 50,000+: Madison, WI
Nearest city with pop. 1,000,000+: Chicago, IL
Nearest cities:
Latitude: 43.25 N, Longitude: 89.35 W
Daytime population change due to commuting: +99 (+0.9%)Workers who live and work in this village: 1,639 (28.0%)
Area code commonly used in this area: 608
Unemployment in December 2023: Population change in the 1990s: +2,328 (+46.2%).
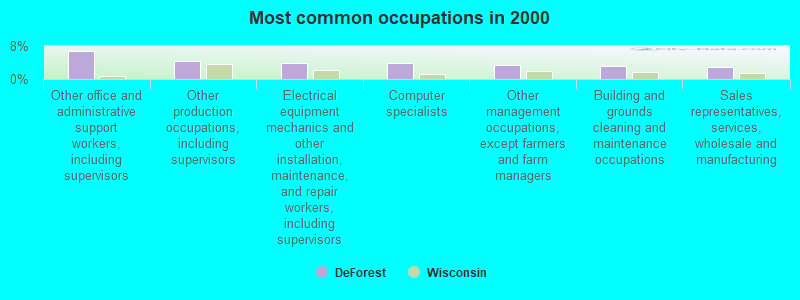
Most common occupations in DeForest, WI (%)
Both Males Females
Other office and administrative support workers, including supervisors (6.8%)
Other production occupations, including supervisors (4.5%)
Electrical equipment mechanics and other installation, maintenance, and repair workers, including supervisors (4.0%)
Computer specialists (3.9%)
Other management occupations, except farmers and farm managers (3.5%)
Building and grounds cleaning and maintenance occupations (3.2%)
Sales representatives, services, wholesale and manufacturing (3.0%)
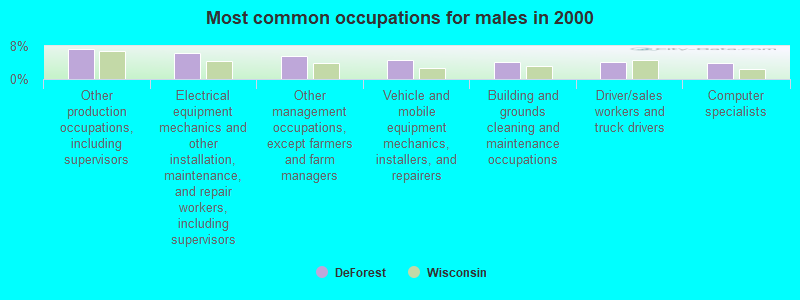
Other production occupations, including supervisors (7.2%)
Electrical equipment mechanics and other installation, maintenance, and repair workers, including supervisors (6.2%)
Other management occupations, except farmers and farm managers (5.6%)
Vehicle and mobile equipment mechanics, installers, and repairers (4.6%)
Building and grounds cleaning and maintenance occupations (4.1%)
Driver/sales workers and truck drivers (4.0%)
Computer specialists (4.0%)
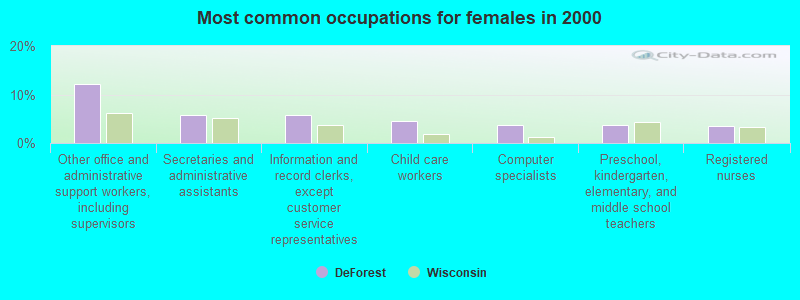
Other office and administrative support workers, including supervisors (12.2%)
Secretaries and administrative assistants (5.9%)
Information and record clerks, except customer service representatives (5.7%)
Child care workers (4.5%)
Computer specialists (3.8%)
Preschool, kindergarten, elementary, and middle school teachers (3.7%)
Registered nurses (3.5%)
Tornado activity:
DeForest-area historical tornado activity is above Wisconsin state average. It is 75% greater than the overall U.S. average.
On 6/7/1984, a category F5 (max. wind speeds 261-318 mph) tornado 9.1 miles away from the DeForest village center killed 9 people and injured 200 people and caused between $50,000 and $500,000 in damages.
On 9/26/1951, a category F4 (max. wind speeds 207-260 mph) tornado 16.2 miles away from the village center killed one person and injured 9 people and caused between $50,000 and $500,000 in damages.
Earthquake activity:
DeForest-area historical earthquake activity is significantly above Wisconsin state average. It is 31% greater than the overall U.S. average. On 4/18/2008 at 09:36:59, a magnitude 5.4 (5.1 MB, 4.8 MS, 5.4 MW, 5.2 MW, Class: Moderate, Intensity: VI - VII) earthquake occurred 340.2 miles away from DeForest center On 6/28/2004 at 06:10:52, a magnitude 4.2 (4.2 MW, Depth: 6.2 mi, Class: Light, Intensity: IV - V) earthquake occurred 125.6 miles away from DeForest center On 6/10/1987 at 23:48:54, a magnitude 5.1 (4.9 MB, 4.4 MS, 4.6 MS, 5.1 LG) earthquake occurred 315.4 miles away from the city center On 4/18/2008 at 09:36:59, a magnitude 5.2 (5.2 MW, Depth: 8.9 mi) earthquake occurred 340.3 miles away from the city center On 2/10/2010 at 09:59:35, a magnitude 3.8 (3.8 MW, Depth: 6.2 mi, Class: Light, Intensity: II - III) earthquake occurred 98.3 miles away from the city center On 5/2/2015 at 16:23:07, a magnitude 4.2 (4.2 MW, Depth: 2.8 mi) earthquake occurred 210.9 miles away from DeForest center Magnitude types: regional Lg-wave magnitude (LG), body-wave magnitude (MB), surface-wave magnitude (MS), moment magnitude (MW) Natural disasters: The number of natural disasters in Dane County (18) is near the US average (15).Major Disasters (Presidential) Declared: 13Emergencies Declared: 4Storms: 12, Floods: 9, Tornadoes: 8, Winds: 2, Winter Storms: 2, Drought: 1, Hurricane: 1, Landslide: 1, Snow: 1, Snowstorm: 1, Other: 1 (Note: some incidents may be assigned to more than one category). Hospitals and medical centers near DeForest: OAKWOOD VILLAGE EAST HEALTH AND REHAB CENTER (Nursing Home, about 7 miles away; MADISON, WI)
THE WILLOWS NURSING AND REHAB (Nursing Home, about 8 miles away; SUN PRAIRIE, WI)
WAUNAKEE MNR HLTH CARE CTR (Nursing Home, about 8 miles away; WAUNAKEE, WI)
WI DIALYSIS INC - EAST (Dialysis Facility, about 8 miles away; MADISON, WI)
CENTRAL WI CTR FDD (Hospital, about 8 miles away; MADISON, WI)
SUN PRAIRIE HEALTH CARE CTR (Nursing Home, about 8 miles away; SUN PRAIRIE, WI)
MENDOTA MENTAL HLTH INSTITUTE (Hospital, about 9 miles away; MADISON, WI)
Amtrak stations near DeForest: 13 miles: MADISON (800 LANGDON ST.) - Bus Station Services: enclosed waiting area, public payphones, public transit connection.
19 miles: COLUMBUS (359 LUDINGTON ST.) Services: ticket office, partially wheelchair accessible, enclosed waiting area, public restrooms, public payphones, free short-term parking, free long-term parking, call for car rental service, call for taxi service.
Colleges/universities with over 2000 students nearest to DeForest:
Herzing University-Madison (about 8 miles; Madison, WI ; Full-time enrollment: 3,160)
Madison Area Technical College (about 9 miles; Madison, WI ; FT enrollment: 9,603)
University of Wisconsin-Madison (about 13 miles; Madison, WI ; FT enrollment: 34,621)
University of Wisconsin Colleges (about 13 miles; Madison, WI ; FT enrollment: 10,019)
Edgewood College (about 14 miles; Madison, WI ; FT enrollment: 2,455)
University of Wisconsin-Whitewater (about 42 miles; Whitewater, WI ; FT enrollment: 11,124)
Waukesha County Technical College (about 57 miles; Pewaukee, WI ; FT enrollment: 4,415)
Public high school in DeForest: DE FOREST HIGH Students: 978, Location: 815 JEFFERSON ST, Grades: 9-12)Public elementary/middle schools in DeForest:
See full list of schools located in DeForest Library in DeForest: DEFOREST AREA PUBLIC LIBRARY Operating income: $695,931; Location: 203 LIBRARY ST.; 65,821 books ; 8,370 e-books ; 10,169 audio materials ; 10,212 video materials ; 28 state licensed databases ; 10 other licensed databases ; 193 print serial subscriptions )
Notable locations in DeForest: (A) , De Forest Public Library (B) , De Forest Museum (C) , De Forest Area Community Center (D) , DeForest Area Fire Department and Emergency Medical Services (E) . Display/hide their locations on the map
Churches in DeForest include: (A) , Christ Lutheran Church (B) , De Forest Moravian Church (C) , Lord of Love Lutheran Church (D) , Saint Olafs Catholic Church (E) . Display/hide their locations on the map
Parks in DeForest include: (1) , Western Green Area Park (2) . Display/hide their locations on the map
Dane County has a predicted average indoor radon screening level greater than 4 pCi/L (pico curies per liter) - Highest Potential Drinking water stations with addresses in DeForest and their reported violations in the past:
MONSANTO VEGETABLES RESEARCH - CORN SHOP (Population served: 48, Groundwater):
Past health violations:
MCL, Monthly (TCR) - In MAY-2012, Contaminant: Coliform. Follow-up actions: St Public Notif requested (MAY-21-2012), St Boil Water Order (MAY-21-2012), St Violation/Reminder Notice (MAY-21-2012), St Public Notif received (MAY-24-2012), St Compliance achieved (MAY-31-2012)
Population served: 35, Groundwater):
Past health violations:
MCL, Monthly (TCR) - In JUN-2008, Contaminant: Coliform. Follow-up actions: St Public Notif requested (JUL-02-2008), St Violation/Reminder Notice (JUL-02-2008), St Boil Water Order (JUL-02-2008), St Public Notif received (JUL-15-2008), St Compliance achieved (JUL-17-2008)
Population served: 25, Groundwater):
Past monitoring violations:
Monitoring and Reporting (DBP) - Between APR-2010 and JUN-2010, Contaminant: Chlorine. Follow-up actions: St Violation/Reminder Notice (MAY-04-2010), St Public Notif requested (MAY-04-2010), St Compliance achieved (MAY-05-2010), St Public Notif issued (MAY-14-2010), St Public Notif received (MAY-20-2010)
One minor monitoring violation
Drinking water stations with addresses in DeForest that have no violations reported:
DEFOREST WATERWORKS (Population served: 9,400, Primary Water Source Type: Groundwater)
MADISON CAMPGROUND LLC (Population served: 131, Primary Water Source Type: Groundwater)
MONSANTO VEGETABLES RESEARCH - OFFICE (Population served: 48, Primary Water Source Type: Groundwater)
WINDSOR SPORTS COMMONS - LINDE FIELDS (Population served: 25, Primary Water Source Type: Groundwater)
STOP N GO (Population served: 25, Primary Water Source Type: Groundwater)
Average household size: This village:
2.6 peopleWisconsin:
2.4 people
Percentage of family households: This village:
71.9%Whole state:
64.4%
Percentage of households with unmarried partners: This village:
8.1%Whole state:
7.3%
Likely homosexual households (counted as self-reported same-sex unmarried-partner households)
Lesbian couples: 0.4% of all households Gay men: 0.2% of all households
31 people in other noninstitutional group quarters in 2000people in nursing homes in 2000
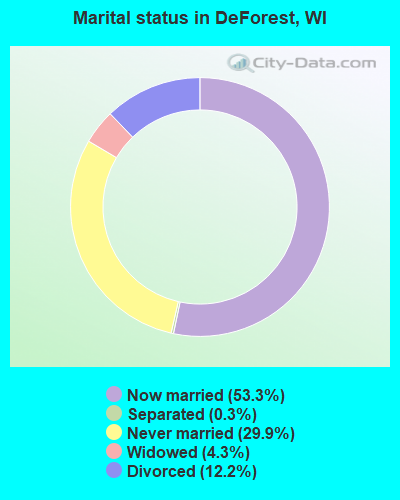
For population 15 years and over in DeForest:
Never married: 29.9%Now married: 53.3%Separated: 0.3%Widowed: 4.3%Divorced: 12.2% For population 25 years and over in DeForest:
High school or higher: 97.6%Bachelor's degree or higher: 40.6%Graduate or professional degree: 12.5%Unemployed: 1.9%Mean travel time to work (commute): 18.4 minutes
Education Gini index (Inequality in education) Here:
8.3Wisconsin average:
10.4
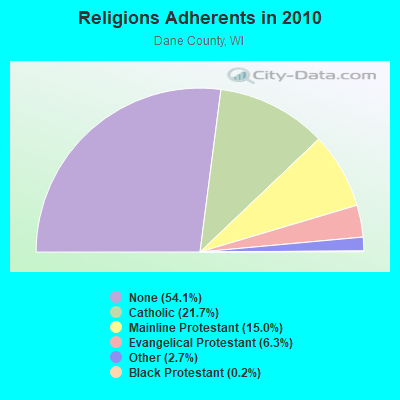
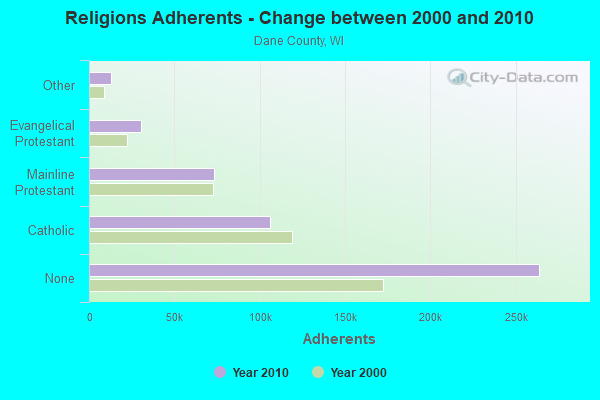
Religion statistics for DeForest, WI (based on Dane County data)
Religion Adherents Congregations Catholic 106,036 34 Mainline Protestant 73,128 113 Evangelical Protestant 30,727 146 Other 12,968 49 Black Protestant 779 5 Orthodox 445 4 None 263,990 -
Source: Clifford Grammich, Kirk Hadaway, Richard Houseal, Dale E.Jones, Alexei Krindatch, Richie Stanley and Richard H.Taylor. 2012. 2010 U.S.Religion Census: Religious Congregations & Membership Study. Association of Statisticians of American Religious Bodies. Jones, Dale E., et al. 2002. Congregations and Membership in the United States 2000. Nashville, TN: Glenmary Research Center. Graphs represent county-level data
Food Environment Statistics: Number of grocery stores : 73Here :
1.53 / 10,000 pop.Wisconsin :
1.86 / 10,000 pop.
Number of supercenters and club stores : 2Dane County :
0.04 / 10,000 pop.Wisconsin :
0.11 / 10,000 pop.
Number of convenience stores (no gas) : 5This county :
0.11 / 10,000 pop.Wisconsin :
0.38 / 10,000 pop.
Number of convenience stores (with gas) : 154Dane County :
3.24 / 10,000 pop.State :
4.12 / 10,000 pop.
Number of full-service restaurants : 382Dane County :
8.03 / 10,000 pop.Wisconsin :
8.64 / 10,000 pop.
Adult diabetes rate : This county :
6.0%Wisconsin :
7.6%
Adult obesity rate : Dane County :
23.9%Wisconsin :
27.5%
Low-income preschool obesity rate : Dane County :
11.1%Wisconsin :
13.0%
Health and Nutrition: Healthy diet rate : DeForest:
52.9%State:
49.5%
Average overall health of teeth and gums : DeForest:
52.7%State:
46.6%
Average BMI : DeForest:
28.1Wisconsin:
28.7
People feeling badly about themselves : DeForest:
19.1%Wisconsin:
21.4%
People not drinking alcohol at all : Average hours sleeping at night : DeForest:
6.9Wisconsin:
6.8
General health condition : This city:
61.4%Wisconsin:
56.3%
Average condition of hearing : DeForest:
81.8%Wisconsin:
78.5%
More about Health and Nutrition of DeForest, WI Residents
DeForest government finances - Expenditure in 2018 (per resident):
Construction - Regular Highways: $1,796,000 ($164.88)
Parks and Recreation: $1,562,000 ($143.39)General - Other: $724,000 ($66.46)General Public Buildings: $508,000 ($46.64)Natural Resources - Other: $232,000 ($21.30)Current Operations - Police Protection: $2,423,000 ($222.44)
Sewerage: $2,053,000 ($188.47)Regular Highways: $1,597,000 ($146.61)Water Utilities: $1,580,000 ($145.05)General - Other: $955,000 ($87.67)Libraries: $820,000 ($75.28)Solid Waste Management: $583,000 ($53.52)Central Staff Services: $577,000 ($52.97)Local Fire Protection: $575,000 ($52.79)Parks and Recreation: $536,000 ($49.21)Natural Resources - Other: $231,000 ($21.21)Judicial and Legal Services: $141,000 ($12.94)Housing and Community Development: $53,000 ($4.87)Financial Administration: $39,000 ($3.58)General - Interest on Debt: $1,715,000 ($157.44)
Other Capital Outlay - Police Protection: $835,000 ($76.65)
Central Staff Services: $23,000 ($2.11)
DeForest government finances - Revenue in 2018 (per resident):
Charges - Sewerage: $2,086,000 ($191.50)
Regular Highways: $503,000 ($46.18)Parks and Recreation: $361,000 ($33.14)Other: $355,000 ($32.59)Federal Intergovernmental - Highways: $7,000 ($0.64)
Local Intergovernmental - Highways: $759,000 ($69.68)
Other: $414,000 ($38.01)Miscellaneous - General Revenue - Other: $478,000 ($43.88)
Rents: $268,000 ($24.60)Fines and Forfeits: $115,000 ($10.56)Special Assessments: $103,000 ($9.46)Donations From Private Sources: $48,000 ($4.41)Sale of Property: $17,000 ($1.56)Interest Earnings: $0 ($0.00)Revenue - Water Utilities: $1,154,000 ($105.94)
State Intergovernmental - Transit Utilities: $609,000 ($55.91)
Highways: $568,000 ($52.14)General Local Government Support: $358,000 ($32.87)Other: $262,000 ($24.05)Education: $197,000 ($18.09)Tax - Property: $7,338,000 ($673.64)
Other License: $233,000 ($21.39)Occupation and Business License - Other: $139,000 ($12.76)Other: $80,000 ($7.34)
DeForest government finances - Debt in 2018 (per resident):
Long Term Debt - Outstanding Unspecified Public Purpose: $43,418,000 ($3985.86)
Beginning Outstanding - Unspecified Public Purpose: $38,341,000 ($3519.78)Issue, Unspecified Public Purpose: $31,035,000 ($2849.08)Retired Unspecified Public Purpose: $25,958,000 ($2383.00)
5.62% of this county's 2021 resident taxpayers lived in other counties in 2020 ($67,560 average adjusted gross income )
Here:
5.62%Wisconsin average:
6.07%
0.01% of residents moved from foreign countries ($96 average AGI )Dane County:
0.01%Wisconsin average:
0.00%
Top counties from which taxpayers relocated into this county between 2020 and 2021:
6.55% of this county's 2020 resident taxpayers moved to other counties in 2021 ($75,791 average adjusted gross income )
Here:
6.55%Wisconsin average:
6.10%
0.01% of residents moved to foreign countries ($41 average AGI )Dane County:
0.01%Wisconsin average:
0.00%
Top counties to which taxpayers relocated from this county between 2020 and 2021:
Businesses in DeForest, WI
Name Count Name Count
Comfort Inn 1 Jones New York 2 Holiday Inn 1 McDonald's 1 Jimmy John's 1
Strongest AM radio stations in DeForest:
WNWC (1190 AM; daytime; 5 kW; SUN PRAIRIE, WI; Owner: NORTHWESTERN COLLEGE)
WTSO (1070 AM; 10 kW; MADISON, WI; Owner: CAPSTAR TX LIMITED PARTNERSHIP)
WLMV (1480 AM; 10 kW; MADISON, WI; Owner: MID-WEST MANAGEMENT, INC.)
WTDY (1670 AM; 10 kW; MADISON, WI; Owner: MID-WEST MANAGEMENT, INC.)
WHA (970 AM; 5 kW; MADISON, WI; Owner: BOARD REGENTS OF UNIV OF WI SYSTEM)
WTMJ (620 AM; 50 kW; MILWAUKEE, WI; Owner: JOURNAL BROADCAST CORPORATION)
WIBA (1310 AM; 5 kW; MADISON, WI; Owner: CAPSTAR TX LIMITED PARTNERSHIP)
WTUX (1550 AM; daytime; 5 kW; MADISON, WI)
WHFA (1240 AM; 1 kW; POYNETTE, WI; Owner: STARBOARD BROADCASTING, INC.)
WISN (1130 AM; 50 kW; MILWAUKEE, WI; Owner: CAPSTAR TX LIMITED PARTNERSHIP)
WNAM (1280 AM; 50 kW; NEENAH-MENASHA, WI; Owner: CUMULUS LICENSING CORP.)
WSPT (1010 AM; 50 kW; STEVENS POINT, WI)
WSCR (670 AM; 50 kW; CHICAGO, IL; Owner: INFINITY BROADCASTING OPERATIONS, INC.)
Strongest FM radio stations in DeForest:
WBZU (105.1 FM; WAUNAKEE, WI; Owner: ENTERCOM MADISON LICENSE, LLC.)
WMAD-FM (92.1 FM; SUN PRAIRIE, WI; Owner: CAPSTAR TX LIMITED PARTNERSHIP)
WERN (88.7 FM; MADISON, WI; Owner: STATE OF WISCONSIN - EDUCATIONAL COMMUNICATIONS BOARD)
WZEE (104.1 FM; MADISON, WI; Owner: CAPSTAR TX LIMITED PARTNERSHIP)
WORT (89.9 FM; MADISON, WI; Owner: BACK PORCH RADIO BROADCASTING, INC.)
WIBA-FM (101.5 FM; MADISON, WI; Owner: CAPSTAR TX LIMITED PARTNERSHIP)
WOLX-FM (94.9 FM; BARABOO, WI; Owner: ENTERCOM MADISON LICENSE, LLC.)
WCJZ (96.3 FM; SAUK CITY, WI; Owner: CAPSTAR TX LIMITED PARTNERSHIP)
WHIT-FM (93.1 FM; DE FOREST, WI; Owner: MID-WEST MANAGEMENT, INC.)
W215AQ (90.9 FM; MADISON, WI; Owner: STATE OF WISCONSIN - EDUCATIONAL COMMUNICATIONS BOARD)
WMGN (98.1 FM; MADISON, WI; Owner: MID-WEST MANAGEMENT, INC.)
WNWC-FM (102.5 FM; MADISON, WI; Owner: NORTHWESTERN COLLEGE)
WWQM-FM (106.3 FM; MIDDLETON, WI; Owner: MID-WEST MANAGEMENT INC.)
WMMM-FM (105.5 FM; VERONA, WI; Owner: ENTERCOM MADISON LICENSE, LLC.)
WJWD (90.3 FM; MARSHALL, WI; Owner: CSN INTERNATIONAL)
WJJO (94.1 FM; WATERTOWN, WI; Owner: MID-WEST MANAGMENT, INC.)
WTLX (100.5 FM; COLUMBUS, WI; Owner: GOOD KARMA BROADCASTING, L.L.C.)
WDDC (100.1 FM; PORTAGE, WI; Owner: ZOE COMMUNICATIONS, INC.)
WSJY (107.3 FM; FORT ATKINSON, WI; Owner: NEWRADIO GROUP, LLC)
WSUM (91.7 FM; MADISON, WI; Owner: BD. OF REGENTS OF UNIVERSITY OF WISCONSIN SYSTEM)
TV broadcast stations around DeForest:
WISC-TV (Channel 3; MADISON, WI; Owner: TELEVISION WISCONSIN, INC.)
WMSN-TV (Channel 47; MADISON, WI; Owner: WMSN LICENSEE, LLC)
WKOW-TV (Channel 27; MADISON, WI; Owner: WKOW TELEVISION, INC.)
WHA-TV (Channel 21; MADISON, WI; Owner: BOARD OF REGENTS OF THE UNIV. OF WISCONSIN SYSTEM)
WMTV (Channel 15; MADISON, WI; Owner: GRAY MIDAMERICA TV LICENSEE CORP.)
W23BW (Channel 23; MADISON, WI; Owner: THREE ANGELS BROADCASTING NETWORK)
W58CO (Channel 58; SAULT STE. MARIE, MI; Owner: MS COMMUNICATIONS, LLC)
W38CT (Channel 38; MADISON, WI; Owner: TRINITY BROADCASTING NETWORK)
WWRS-TV (Channel 52; MAYVILLE, WI; Owner: NATIONAL MINORITY T.V., INC.)
W08CK (Channel 8; MADISON-MIDDLETON, WI; Owner: HEALTHY'S, INC.)
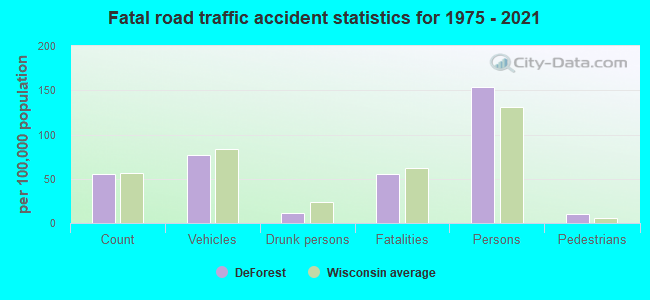
DeForest fatal accident statistics for 1975 - 2021
DeForest fatal accident list:
Sep 18, 2017 07:09 PM, Cr-V, Lat: 43.252675, Lon: -89.347644, Vehicles: 1, Persons: 1, Pedestrians: 1, Fatalities: 1Lat: 43.244836, Lon: -89.374536, Vehicles: 2, Persons: 5, Fatalities: 1Lat: 43.243075, Lon: -89.373331, Vehicles: 1, Persons: 5, Fatalities: 1Lat: 43.258420, Lon: -89.336640, Vehicles: 1, Persons: 1, Fatalities: 1, Drunk persons involved: 1Lat: 43.241940, Lon: -89.372740, Vehicles: 2, Persons: 2, Fatalities: 1
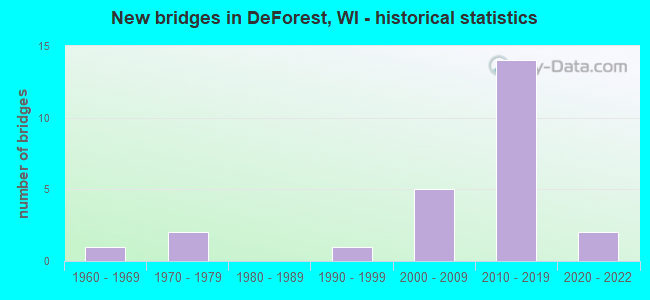
National Bridge Inventory (NBI) Statistics 25 Number of bridges171ft / 52.1m Total length $702,000 Total costs316,679 Total average daily traffic2,794 Total average daily truck traffic
New bridges - historical statistics
1 1960-1969 2 1970-1979 1 1990-1999 5 2000-2009 14 2010-2019 2 2020-2022
See full National Bridge Inventory statistics for DeForest, WI
FCC Registered Cell Phone Towers: 1 (
See the full list of FCC Registered Cell Phone Towers in DeForest )
FCC Registered Antenna Towers: 12 (
See the full list of FCC Registered Antenna Towers )
FCC Registered Broadcast Land Mobile Towers: 11 (
See the full list of FCC Registered Broadcast Land Mobile Towers in DeForest, WI )
FCC Registered Microwave Towers: 4
DEFOREST, 911 W North St (Lat: 43.250000 Lon: -89.369167), Type: Ltower, Structure height: 78.9 m, Call Sign: WPJA206, Assigned Frequencies: 6123.10 MHz, 6034.15 MHz, 6034.15 MHz, 6034.15 MHz, 6034.15 MHz, 6034.15 MHz, 6725.00 MHz, 5945.20 MHz, 6123.10 MHz, 6725.00 MHz... (+25 more), Grant Date: 11/08/2019, Expiration Date: 01/04/2030, Registrant: Wisconsin State Patrol, 4822 Madison Yards Way - 9th Fl South, Madison, WI 53705, Phone: (608) 709-0095, Email:
DEFOREST, Cty "dm" And Patton Road (Lat: 43.276389 Lon: -89.423056), Type: Tower, Structure height: 51.8 m, Overall height: 57.9 m, Call Sign: WPTN683, Assigned Frequencies: 5945.20 MHz, 6855.00 MHz, 6256.54 MHz, Grant Date: 10/05/2021, Expiration Date: 11/09/2031, Certifier: John E Rooney, Registrant: Wilkinson Barker Knauer, LLP, 1800 M Street Nw, Suite 800n, Washington, DC 20036, Phone: (202) 383-3420, Fax: (202) 783-5851, Email:
ML60XC629, 103 River Road (Lat: 43.250472 Lon: -89.366694), Type: Tank, Structure height: 42.7 m, Call Sign: WQRF389, Assigned Frequencies: 11345.0 MHz, Grant Date: 05/01/2013, Expiration Date: 05/01/2023, Cancellation Date: 04/28/2023, Certifier: David Werblow, Registrant: T-Mobile Usa, Inc., 12920 Se 38th Street, Bellevue, WA 98006, Phone: (425) 383-8401, Email:
HWY C, 879 County Road C (Lat: 43.310444 Lon: -89.247750), Type: Silo, Structure height: 42.7 m, Call Sign: WRZE626, Licensee ID: L02118645, Assigned Frequencies: 11565.0 MHz, 11565.0 MHz, 11565.0 MHz, 11565.0 MHz, Grant Date: 10/24/2023, Expiration Date: 10/24/2033, Certifier: Abel Salas, Registrant: Upnetwi LLC, 2354 County Highway N #2, Stoughton, WI 53589, Phone: (608) 852-2036, Email:
FCC Registered Amateur Radio Licenses: 10 (
See the full list of FCC Registered Amateur Radio Licenses in DeForest )
FAA Registered Aircraft: 3
Aircraft: CESSNA 150L (Category: Land, Seats: 2, Weight: Up to 12,499 Pounds, Speed: 90 mph), Engine: CONT MOTOR 0-200 SERIES (100 HP) (Reciprocating)N-Number: 219RA, N219RA, N-219RA, Serial Number: 15072929, Year manufactured: 1971, Airworthiness Date: 10/25/1971, Certificate Issue Date: 08/29/2017Registrant (Individual): Dustin J Dorshorst, 7315 Patton Rd, Deforest, WI 53532Aircraft: FULLER RANDALL D SEA REY (Category: Amphibian, Seats: 2, Weight: Up to 12,499 Pounds), Engine: BOMBARDIER ROTAX (ALL) (Reciprocating)N-Number: 677G, N677G, N-677G, Serial Number: 034, Airworthiness Date: 06/24/1995, Certificate Issue Date: 11/28/2018Registrant (Individual): Randall D Fuller, Po Box 143, Deforest, WI 53532Aircraft: ENSTROM F-28A (Category: Land, Seats: 3, Weight: Up to 12,499 Pounds, Speed: 75 mph), Engine: LYCOMING I0-360-B1E (180 HP) (Reciprocating)N-Number: 9266, N9266, N-9266, Serial Number: 216, Year manufactured: 1974, Airworthiness Date: 08/08/1974, Certificate Issue Date: 02/19/2016Registrant (Individual): William R Ciszewski, 536 Dennis Dr, Deforest, WI 53532
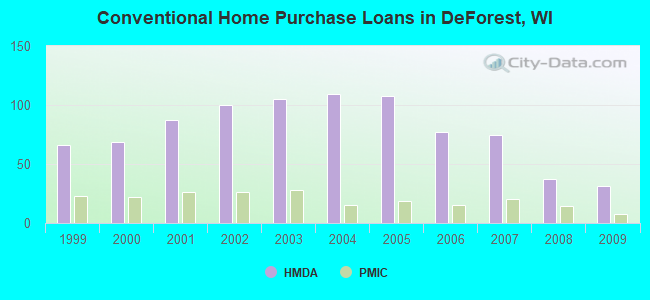
Home Mortgage Disclosure Act Aggregated Statistics For Year 2009(Based on 1 partial tract) A) FHA, FSA/RHS & VA B) Conventional C) Refinancings D) Home Improvement Loans F) Non-occupant Loans on Number Average Value Number Average Value Number Average Value Number Average Value Number Average Value
LOANS ORIGINATED 19 $194,577 31 $154,113 271 $155,801 11 $67,011 10 $153,114 APPLICATIONS APPROVED, NOT ACCEPTED 2 $170,540 2 $211,560 14 $182,148 1 $9,030 0 $0 APPLICATIONS DENIED 2 $181,530 5 $119,792 44 $186,794 5 $31,950 0 $0 APPLICATIONS WITHDRAWN 2 $149,150 2 $155,235 29 $170,047 1 $63,980 0 $0 FILES CLOSED FOR INCOMPLETENESS 0 $0 1 $113,040 4 $165,340 0 $0 0 $0
Aggregated Statistics For Year 2008(Based on 1 partial tract) A) FHA, FSA/RHS & VA B) Conventional C) Refinancings D) Home Improvement Loans E) Loans on Dwellings For 5+ Families F) Non-occupant Loans on Number Average Value Number Average Value Number Average Value Number Average Value Number Average Value Number Average Value
LOANS ORIGINATED 7 $187,727 37 $160,840 133 $154,188 16 $43,543 2 $1,337,445 9 $154,122 APPLICATIONS APPROVED, NOT ACCEPTED 1 $188,790 1 $80,460 9 $207,589 2 $17,860 0 $0 0 $0 APPLICATIONS DENIED 1 $136,200 2 $224,510 42 $151,870 5 $51,418 0 $0 2 $105,585 APPLICATIONS WITHDRAWN 2 $191,540 1 $256,300 20 $170,502 2 $167,010 0 $0 0 $0 FILES CLOSED FOR INCOMPLETENESS 0 $0 1 $154,650 3 $221,240 0 $0 0 $0 0 $0
Aggregated Statistics For Year 2007(Based on 1 partial tract) A) FHA, FSA/RHS & VA B) Conventional C) Refinancings D) Home Improvement Loans E) Loans on Dwellings For 5+ Families F) Non-occupant Loans on Number Average Value Number Average Value Number Average Value Number Average Value Number Average Value Number Average Value
LOANS ORIGINATED 2 $181,925 75 $142,750 112 $132,150 26 $55,448 1 $261,800 11 $164,600 APPLICATIONS APPROVED, NOT ACCEPTED 0 $0 5 $125,286 15 $138,631 2 $15,895 0 $0 1 $88,310 APPLICATIONS DENIED 1 $183,690 9 $152,682 53 $170,560 5 $63,350 0 $0 1 $62,410 APPLICATIONS WITHDRAWN 1 $261,010 5 $159,120 28 $171,901 2 $95,770 0 $0 2 $101,855 FILES CLOSED FOR INCOMPLETENESS 0 $0 2 $248,255 9 $201,266 0 $0 0 $0 0 $0
Aggregated Statistics For Year 2006(Based on 1 partial tract) A) FHA, FSA/RHS & VA B) Conventional C) Refinancings D) Home Improvement Loans E) Loans on Dwellings For 5+ Families F) Non-occupant Loans on Number Average Value Number Average Value Number Average Value Number Average Value Number Average Value Number Average Value
LOANS ORIGINATED 2 $211,360 77 $155,629 119 $126,220 29 $42,377 4 $415,168 12 $178,620 APPLICATIONS APPROVED, NOT ACCEPTED 0 $0 9 $120,584 23 $123,364 4 $37,485 0 $0 0 $0 APPLICATIONS DENIED 0 $0 11 $145,332 53 $148,439 8 $71,925 0 $0 3 $119,973 APPLICATIONS WITHDRAWN 0 $0 9 $126,778 39 $151,123 3 $96,293 0 $0 2 $129,525 FILES CLOSED FOR INCOMPLETENESS 0 $0 4 $96,652 14 $203,175 1 $27,480 0 $0 0 $0
Aggregated Statistics For Year 2005(Based on 1 partial tract) A) FHA, FSA/RHS & VA B) Conventional C) Refinancings D) Home Improvement Loans E) Loans on Dwellings For 5+ Families F) Non-occupant Loans on Number Average Value Number Average Value Number Average Value Number Average Value Number Average Value Number Average Value
LOANS ORIGINATED 5 $203,944 108 $141,013 155 $139,097 22 $49,205 2 $1,377,675 12 $157,360 APPLICATIONS APPROVED, NOT ACCEPTED 0 $0 12 $132,371 14 $130,479 3 $27,213 0 $0 1 $166,030 APPLICATIONS DENIED 2 $152,095 10 $124,972 40 $146,687 8 $20,606 0 $0 2 $149,740 APPLICATIONS WITHDRAWN 0 $0 8 $170,640 43 $147,178 3 $78,107 0 $0 1 $33,760 FILES CLOSED FOR INCOMPLETENESS 0 $0 5 $128,270 22 $151,880 0 $0 0 $0 0 $0
Aggregated Statistics For Year 2004(Based on 1 partial tract) A) FHA, FSA/RHS & VA B) Conventional C) Refinancings D) Home Improvement Loans F) Non-occupant Loans on Number Average Value Number Average Value Number Average Value Number Average Value Number Average Value
LOANS ORIGINATED 4 $152,780 109 $140,087 175 $129,635 20 $28,986 16 $155,528 APPLICATIONS APPROVED, NOT ACCEPTED 0 $0 6 $118,797 11 $123,388 1 $23,940 0 $0 APPLICATIONS DENIED 0 $0 7 $139,730 43 $132,930 7 $48,950 0 $0 APPLICATIONS WITHDRAWN 0 $0 5 $175,056 24 $165,488 1 $47,890 1 $141,300 FILES CLOSED FOR INCOMPLETENESS 0 $0 2 $103,425 20 $149,935 1 $140,910 0 $0
Aggregated Statistics For Year 2003(Based on 1 partial tract) A) FHA, FSA/RHS & VA B) Conventional C) Refinancings D) Home Improvement Loans E) Loans on Dwellings For 5+ Families F) Non-occupant Loans on Number Average Value Number Average Value Number Average Value Number Average Value Number Average Value Number Average Value
LOANS ORIGINATED 5 $159,434 105 $142,874 441 $126,260 19 $36,792 2 $988,510 25 $177,912 APPLICATIONS APPROVED, NOT ACCEPTED 0 $0 7 $137,711 15 $123,271 0 $0 0 $0 2 $123,835 APPLICATIONS DENIED 1 $124,420 10 $122,696 60 $136,119 4 $44,450 0 $0 3 $167,990 APPLICATIONS WITHDRAWN 0 $0 10 $171,326 33 $121,889 1 $11,780 0 $0 2 $101,070 FILES CLOSED FOR INCOMPLETENESS 0 $0 1 $149,940 7 $134,516 0 $0 0 $0 0 $0
Aggregated Statistics For Year 2002(Based on 1 partial tract) A) FHA, FSA/RHS & VA B) Conventional C) Refinancings D) Home Improvement Loans F) Non-occupant Loans on Number Average Value Number Average Value Number Average Value Number Average Value Number Average Value
LOANS ORIGINATED 13 $142,175 100 $128,567 363 $121,383 15 $29,987 24 $150,328 APPLICATIONS APPROVED, NOT ACCEPTED 1 $189,190 6 $144,048 18 $108,941 2 $15,895 2 $168,775 APPLICATIONS DENIED 0 $0 7 $111,750 32 $118,805 4 $22,668 2 $83,015 APPLICATIONS WITHDRAWN 0 $0 9 $133,668 29 $121,066 2 $39,055 2 $146,990 FILES CLOSED FOR INCOMPLETENESS 0 $0 1 $55,340 7 $109,283 0 $0 0 $0
Aggregated Statistics For Year 2001(Based on 1 partial tract) A) FHA, FSA/RHS & VA B) Conventional C) Refinancings D) Home Improvement Loans E) Loans on Dwellings For 5+ Families F) Non-occupant Loans on Number Average Value Number Average Value Number Average Value Number Average Value Number Average Value Number Average Value
LOANS ORIGINATED 10 $134,510 87 $126,200 247 $117,868 22 $18,840 1 $263,760 14 $162,859 APPLICATIONS APPROVED, NOT ACCEPTED 1 $93,020 6 $139,795 12 $95,541 1 $24,730 0 $0 1 $109,900 APPLICATIONS DENIED 1 $108,720 9 $106,673 32 $108,465 4 $17,760 0 $0 1 $213,130 APPLICATIONS WITHDRAWN 1 $85,170 7 $110,293 21 $118,535 2 $34,935 0 $0 1 $77,720 FILES CLOSED FOR INCOMPLETENESS 0 $0 1 $176,230 5 $125,128 0 $0 0 $0 0 $0
Aggregated Statistics For Year 2000(Based on 1 partial tract) A) FHA, FSA/RHS & VA B) Conventional C) Refinancings D) Home Improvement Loans F) Non-occupant Loans on Number Average Value Number Average Value Number Average Value Number Average Value Number Average Value
LOANS ORIGINATED 5 $125,364 69 $128,291 40 $81,356 27 $18,709 7 $163,280 APPLICATIONS APPROVED, NOT ACCEPTED 1 $109,510 4 $147,678 7 $74,070 2 $14,130 0 $0 APPLICATIONS DENIED 1 $78,500 6 $88,835 18 $91,823 2 $17,270 1 $56,520 APPLICATIONS WITHDRAWN 0 $0 7 $110,069 7 $85,453 1 $59,660 0 $0 FILES CLOSED FOR INCOMPLETENESS 0 $0 2 $113,435 7 $99,527 0 $0 0 $0
Aggregated Statistics For Year 1999(Based on 1 partial tract) A) FHA, FSA/RHS & VA B) Conventional C) Refinancings D) Home Improvement Loans E) Loans on Dwellings For 5+ Families F) Non-occupant Loans on Number Average Value Number Average Value Number Average Value Number Average Value Number Average Value Number Average Value
LOANS ORIGINATED 6 $113,412 66 $123,894 90 $92,542 29 $19,916 2 $286,625 11 $132,793 APPLICATIONS APPROVED, NOT ACCEPTED 0 $0 4 $127,172 8 $75,961 2 $11,350 0 $0 0 $0 APPLICATIONS DENIED 0 $0 3 $118,957 29 $91,740 2 $33,455 0 $0 1 $99,390 APPLICATIONS WITHDRAWN 0 $0 4 $108,098 18 $104,977 0 $0 0 $0 0 $0 FILES CLOSED FOR INCOMPLETENESS 0 $0 1 $80,220 8 $114,015 0 $0 0 $0 0 $0
Detailed HMDA statistics for the following Tracts:
0133.00
Private Mortgage Insurance Companies Aggregated Statistics For Year 2009(Based on 1 partial tract) A) Conventional B) Refinancings Number Average Value Number Average Value
LOANS ORIGINATED 8 $187,518 13 $199,692 APPLICATIONS APPROVED, NOT ACCEPTED 3 $185,523 4 $201,940 APPLICATIONS DENIED 1 $166,420 2 $154,055 APPLICATIONS WITHDRAWN 0 $0 1 $161,320 FILES CLOSED FOR INCOMPLETENESS 0 $0 0 $0
Aggregated Statistics For Year 2008(Based on 1 partial tract) A) Conventional B) Refinancings Number Average Value Number Average Value
LOANS ORIGINATED 14 $191,989 11 $212,985 APPLICATIONS APPROVED, NOT ACCEPTED 2 $134,235 6 $217,772 APPLICATIONS DENIED 0 $0 0 $0 APPLICATIONS WITHDRAWN 1 $155,040 0 $0 FILES CLOSED FOR INCOMPLETENESS 0 $0 0 $0
Aggregated Statistics For Year 2007(Based on 1 partial tract) A) Conventional B) Refinancings C) Non-occupant Loans on Number Average Value Number Average Value Number Average Value
LOANS ORIGINATED 20 $184,710 10 $197,388 1 $122,850 APPLICATIONS APPROVED, NOT ACCEPTED 4 $177,410 0 $0 0 $0 APPLICATIONS DENIED 0 $0 0 $0 0 $0 APPLICATIONS WITHDRAWN 2 $191,540 0 $0 0 $0 FILES CLOSED FOR INCOMPLETENESS 0 $0 0 $0 0 $0
Aggregated Statistics For Year 2006(Based on 1 partial tract) A) Conventional B) Refinancings Number Average Value Number Average Value
LOANS ORIGINATED 15 $190,833 3 $187,223 APPLICATIONS APPROVED, NOT ACCEPTED 4 $209,105 1 $220,190 APPLICATIONS DENIED 0 $0 0 $0 APPLICATIONS WITHDRAWN 0 $0 0 $0 FILES CLOSED FOR INCOMPLETENESS 0 $0 0 $0
Aggregated Statistics For Year 2005(Based on 1 partial tract) A) Conventional B) Refinancings Number Average Value Number Average Value
LOANS ORIGINATED 19 $179,786 9 $181,728 APPLICATIONS APPROVED, NOT ACCEPTED 2 $112,450 2 $198,800 APPLICATIONS DENIED 0 $0 0 $0 APPLICATIONS WITHDRAWN 2 $175,450 0 $0 FILES CLOSED FOR INCOMPLETENESS 0 $0 0 $0
Aggregated Statistics For Year 2004(Based on 1 partial tract) A) Conventional B) Refinancings C) Non-occupant Loans on Number Average Value Number Average Value Number Average Value
LOANS ORIGINATED 15 $176,573 9 $167,859 1 $191,930 APPLICATIONS APPROVED, NOT ACCEPTED 4 $210,282 4 $145,030 0 $0 APPLICATIONS DENIED 0 $0 0 $0 0 $0 APPLICATIONS WITHDRAWN 1 $189,580 2 $149,345 0 $0 FILES CLOSED FOR INCOMPLETENESS 0 $0 0 $0 0 $0
Aggregated Statistics For Year 2003(Based on 1 partial tract) A) Conventional B) Refinancings C) Non-occupant Loans on Number Average Value Number Average Value Number Average Value
LOANS ORIGINATED 28 $166,462 39 $156,567 1 $215,880 APPLICATIONS APPROVED, NOT ACCEPTED 4 $152,388 4 $145,225 0 $0 APPLICATIONS DENIED 0 $0 1 $126,390 0 $0 APPLICATIONS WITHDRAWN 1 $148,760 2 $164,065 0 $0 FILES CLOSED FOR INCOMPLETENESS 0 $0 0 $0 0 $0
Aggregated Statistics For Year 2002(Based on 1 partial tract) A) Conventional B) Refinancings Number Average Value Number Average Value
LOANS ORIGINATED 26 $153,196 35 $153,142 APPLICATIONS APPROVED, NOT ACCEPTED 4 $165,340 4 $148,365 APPLICATIONS DENIED 0 $0 0 $0 APPLICATIONS WITHDRAWN 1 $131,100 1 $189,190 FILES CLOSED FOR INCOMPLETENESS 0 $0 0 $0
Aggregated Statistics For Year 2001(Based on 1 partial tract) A) Conventional B) Refinancings Number Average Value Number Average Value
LOANS ORIGINATED 26 $147,550 30 $150,040 APPLICATIONS APPROVED, NOT ACCEPTED 2 $143,850 3 $139,600 APPLICATIONS DENIED 0 $0 0 $0 APPLICATIONS WITHDRAWN 1 $102,840 1 $104,410 FILES CLOSED FOR INCOMPLETENESS 0 $0 0 $0
Aggregated Statistics For Year 2000(Based on 1 partial tract) A) Conventional B) Refinancings Number Average Value Number Average Value
LOANS ORIGINATED 22 $144,940 3 $150,720 APPLICATIONS APPROVED, NOT ACCEPTED 2 $104,600 0 $0 APPLICATIONS DENIED 0 $0 1 $89,490 APPLICATIONS WITHDRAWN 0 $0 1 $90,280 FILES CLOSED FOR INCOMPLETENESS 0 $0 0 $0
Aggregated Statistics For Year 1999(Based on 1 partial tract) A) Conventional B) Refinancings Number Average Value Number Average Value
LOANS ORIGINATED 23 $133,093 9 $143,433 APPLICATIONS APPROVED, NOT ACCEPTED 1 $167,870 0 $0 APPLICATIONS DENIED 0 $0 0 $0 APPLICATIONS WITHDRAWN 1 $186,260 0 $0 FILES CLOSED FOR INCOMPLETENESS 0 $0 0 $0
Detailed PMIC statistics for the following Tracts:
0133.00
DeForest compared to Wisconsin state average:
Unemployed percentage significantly below state average. Black race population percentage below state average. Median age below state average. Length of stay since moving in above state average. House age below state average. Percentage of population with a bachelor's degree or higher above state average.
#58 on the list of "Top 101 cities with the smallest household incomes disparities (population 5,000+)"
#61 on the list of "Top 101 cities with the most full-time local library workers per 1000 residents (population 5,000+)"
#85 on the list of "Top 101 cities with largest percentage of females in industries: finance and insurance (population 5,000+)"
#4 on the list of "Top 101 counties with the largest increase in the number of infant deaths per 1000 residents 2000-2006 to 2007-2013 (pop. 50,000+)"
#39 on the list of "Top 101 counties with the most Mainline Protestant adherents"
#45 on the list of "Top 101 counties with highest percentage of residents voting for Obama (Democrat) in the 2012 Presidential Election (pop. 50,000+)"
#48 on the list of "Top 101 counties with the highest ground withdrawal of fresh water for public supply"
#64 on the list of "Top 101 counties with the lowest percentage of residents relocating from foreign countries between 2010 and 2011"

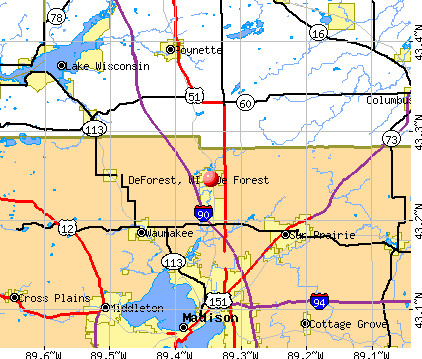


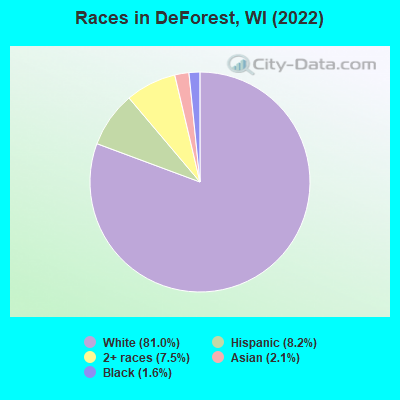
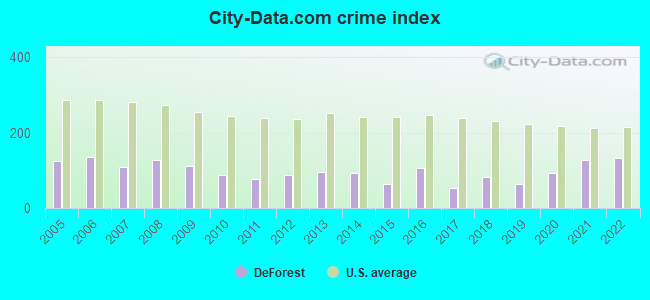
 Recent articles from our blog. Our writers, many of them Ph.D. graduates or candidates, create easy-to-read articles on a wide variety of topics.

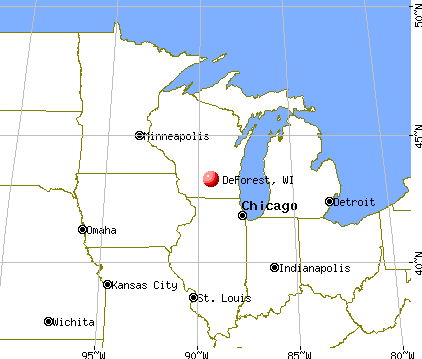
 (12.1 miles