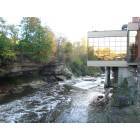
Cuyahoga Falls, Ohio

Cuyahoga Falls: This is the fountain in the downtown mall area.
Cuyahoga Falls: Cuyahoga Falls Sheraton

Cuyahoga Falls: Cuyahoga Falls River Square
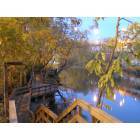
Cuyahoga Falls: This is a picture of the river walking area. It's like a big porch that goes along the Cuyahoga River.

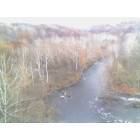
Cuyahoga Falls: Winter - Cuyahoga Falls, OH
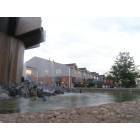
Cuyahoga Falls: Some locals by the fountain
Cuyahoga Falls
- add
your
Submit your own pictures of this city and show them to the world
- OSM Map
- General Map
- Google Map
- MSN Map
Population change since 2000: +2.6%
 |
| Males: 24,287 | |
| Females: 26,368 |
| Median resident age: | 38.2 years |
| Ohio median age: | 39.9 years |
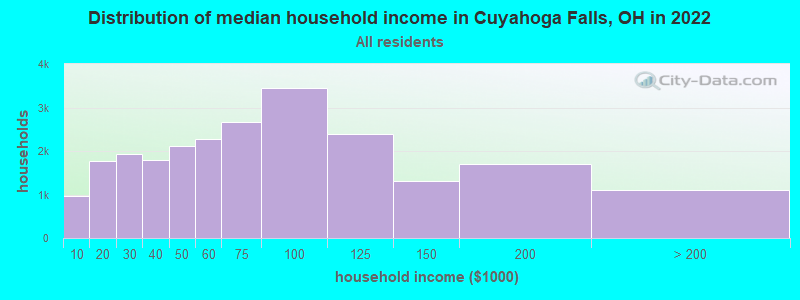
| Cuyahoga Falls: | $65,342 |
| OH: | $65,720 |
Estimated per capita income in 2022: $38,836 (it was $22,550 in 2000)
Cuyahoga Falls city income, earnings, and wages data
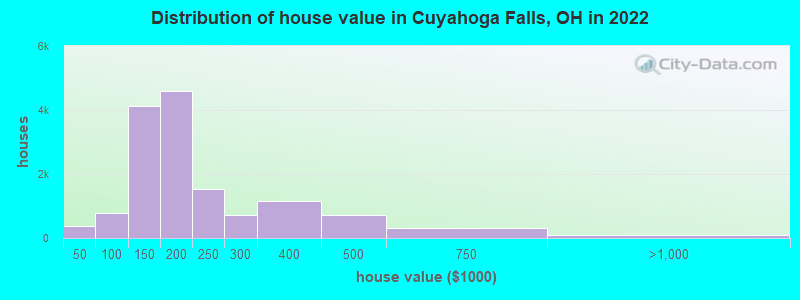
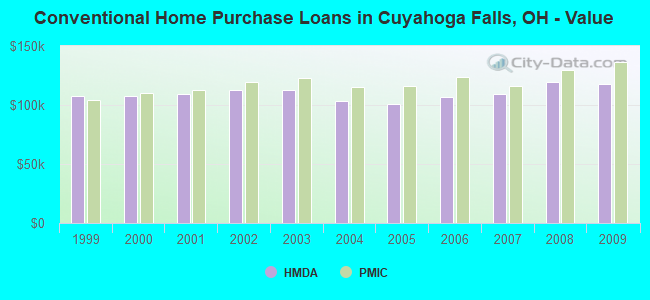
Estimated median house or condo value in 2022: $171,914 (it was $106,000 in 2000)
| Cuyahoga Falls: | $171,914 |
| OH: | $204,100 |
Mean prices in 2022: all housing units: $226,263; detached houses: $215,973; townhouses or other attached units: $489,602; in 2-unit structures: $107,228; in 3-to-4-unit structures: $234,097; in 5-or-more-unit structures: $183,750; mobile homes: $48,154
Median gross rent in 2022: $959.
Cuyahoga Falls, OH residents, houses, and apartments details
(7.6% for White Non-Hispanic residents, 40.4% for Black residents, 3.4% for Hispanic or Latino residents, 7.3% for other race residents, 12.2% for two or more races residents)
Detailed information about poverty and poor residents in Cuyahoga Falls, OH


Compare current foreclosures in Cuyahoga Falls, OH:
| Photo | Address | Area | Beds / Baths | Price | Details |
|---|---|---|---|---|---|

|
#1
Bailey Rd
Cuyahoga Falls, OH 44221
|
960 sq. feet
|
1 baths 2 beds |
$164,900
|
show details |

|
#2
11th St
Cuyahoga Falls, OH 44221
|
1,424 sq. feet
|
2 baths 3 beds |
show details | |

|
#3
Issaquah St
Cuyahoga Falls, OH 44221
|
1,404 sq. feet
|
1 baths 3 beds |
show details | |

|
#4
May Ave
Cuyahoga Falls, OH 44221
|
1,144 sq. feet
|
1 baths 3 beds |
show details | |

|
#5
Hanover St
Cuyahoga Falls, OH 44221
|
1,120 sq. feet
|
1 baths 3 beds |
show details | |

|
#6
Tyler Ave
Cuyahoga Falls, OH 44221
|
1,056 sq. feet
|
1 baths 3 beds |
show details | |

|
#7
Harding Rd
Cuyahoga Falls, OH 44223
|
1,008 sq. feet
|
1 baths 2 beds |
show details | |

|
#8
Tyler Ave
Cuyahoga Falls, OH 44221
|
1,056 sq. feet
|
1 baths 3 beds |
show details | |

|
#9
Madison Ave
Cuyahoga Falls, OH 44221
|
1,332 sq. feet
|
1 baths 3 beds |
show details | |

|
#10
Sutton Dr
Cuyahoga Falls, OH 44221
|
1,262 sq. feet
|
1 baths 4 beds |
show details |
| Photo | Address | Area | Beds / Baths | Price | Details |
|---|---|---|---|---|---|

|
#11
Ridgecrest Dr
Cuyahoga Falls, OH 44221
|
1,440 sq. feet
|
2 baths 3 beds |
show details | |

|
#12
15th St
Cuyahoga Falls, OH 44223
|
1,768 sq. feet
|
2 baths 3 beds |
show details | |

|
#13
Oakwood Dr
Cuyahoga Falls, OH 44221
|
1,464 sq. feet
|
2 baths 4 beds |
show details | |

|
#14
12th St
Cuyahoga Falls, OH 44223
|
826 sq. feet
|
1 baths 2 beds |
show details | |

|
#15
17th St
Cuyahoga Falls, OH 44223
|
768 sq. feet
|
1 baths 2 beds |
show details | |

|
#16
13th St
Cuyahoga Falls, OH 44223
|
1,736 sq. feet
|
2 baths 4 beds |
show details | |

|
#17
Falls Ave
Cuyahoga Falls, OH 44221
|
1,954 sq. feet
|
1 baths 2 beds |
show details | |

|
#18
Berk St
Cuyahoga Falls, OH 44221
|
1,274 sq. feet
|
1 baths 3 beds |
show details | |

|
#19
Sutton Dr
Cuyahoga Falls, OH 44221
|
1,190 sq. feet
|
1 baths 4 beds |
show details | |

|
#20
Byrd Ave
Cuyahoga Falls, OH 44223
|
1,394 sq. feet
|
1 baths 3 beds |
show details |
| Photo | Address | Area | Beds / Baths | Price | Details |
|---|---|---|---|---|---|

|
#21
Northland St
Cuyahoga Falls, OH 44221
|
1,109 sq. feet
|
1 baths 3 beds |
show details | |

|
#22
Christy Dr
Cuyahoga Falls, OH 44223
|
1,018 sq. feet
|
1 baths 2 beds |
show details | |

|
#23
Hanover St
Cuyahoga Falls, OH 44221
|
1,190 sq. feet
|
1 baths 3 beds |
show details | |

|
#24
Sutton Dr
Cuyahoga Falls, OH 44221
|
1,670 sq. feet
|
1 baths 3 beds |
show details | |

|
#25
Meredith Ln
Cuyahoga Falls, OH 44223
|
1,096 sq. feet
|
1 baths 2 beds |
show details | |

|
#26
W Prescott Cir
Cuyahoga Falls, OH 44223
|
1,561 sq. feet
|
2 baths 3 beds |
show details | |

|
#27
Richmond Rd
Cuyahoga Falls, OH 44221
|
1,600 sq. feet
|
1 baths 4 beds |
show details | |

|
#28
7th St
Cuyahoga Falls, OH 44221
|
1,008 sq. feet
|
1 baths 3 beds |
show details | |

|
#29
Atterbury St
Cuyahoga Falls, OH 44221
|
1,275 sq. feet
|
1 baths 4 beds |
show details | |

|
#30
Wichert Dr
Cuyahoga Falls, OH 44221
|
1,190 sq. feet
|
1 baths 4 beds |
show details |
| Photo | Address | Area | Beds / Baths | Price | Details |
|---|---|---|---|---|---|

|
#31
Marcia Blvd
Cuyahoga Falls, OH 44223
|
2,147 sq. feet
|
2 baths 3 beds |
show details | |

|
#32
Tallmadge Rd
Cuyahoga Falls, OH 44221
|
1,498 sq. feet
|
2 baths 3 beds |
show details | |

|
#33
Whitelaw St
Cuyahoga Falls, OH 44221
|
1,404 sq. feet
|
1 baths 3 beds |
show details | |

|
#34
Kathron Ave
Cuyahoga Falls, OH 44221
|
1,596 sq. feet
|
1 baths 3 beds |
show details | |

|
#35
Meadow Ln
Cuyahoga Falls, OH 44221
|
1,014 sq. feet
|
1 baths 3 beds |
show details | |

|
#36
High Hampton Trl
Cuyahoga Falls, OH 44223
|
2,898 sq. feet
|
2 baths 4 beds |
show details | |

|
#37
Graham Rd
Cuyahoga Falls, OH 44223
|
1,275 sq. feet
|
1 baths 3 beds |
show details | |

|
#38
Valley Rd
Cuyahoga Falls, OH 44223
|
1,252 sq. feet
|
2 baths 3 beds |
show details | |

|
#39
E Prescott Cir
Cuyahoga Falls, OH 44223
|
1,449 sq. feet
|
2 baths 2 beds |
show details | |

|
#40
23rd St
Cuyahoga Falls, OH 44223
|
1,626 sq. feet
|
1 baths 3 beds |
show details |
| Photo | Address | Area | Beds / Baths | Price | Details |
|---|---|---|---|---|---|

|
#41
Marcia Blvd
Cuyahoga Falls, OH 44223
|
2,147 sq. feet
|
2 baths 3 beds |
show details | |

|
#42
Wichert Dr
Cuyahoga Falls, OH 44221
|
1,190 sq. feet
|
1 baths 4 beds |
show details | |

|
#43
Prior Dr
Cuyahoga Falls, OH 44223
|
1,837 sq. feet
|
1 baths 2 beds |
show details | |

|
#44
Munroe Falls Ave
Cuyahoga Falls, OH 44221
|
960 sq. feet
|
1 baths 2 beds |
show details | |

|
#45
7th St
Cuyahoga Falls, OH 44221
|
1,892 sq. feet
|
2 baths 3 beds |
show details | |

|
#46
Oakwood Dr
Cuyahoga Falls, OH 44221
|
1,128 sq. feet
|
1 baths 2 beds |
show details | |

|
#47
16th St
Cuyahoga Falls, OH 44223
|
1,488 sq. feet
|
1 baths 3 beds |
show details | |

|
#48
Bailey Rd
Cuyahoga Falls, OH 44221
|
1,120 sq. feet
|
1 baths 4 beds |
show details | |

|
#49
Bailey Rd
Cuyahoga Falls, OH 44221
|
1,120 sq. feet
|
1 baths 2 beds |
show details | |

|
Check over 1 million property listings on Foreclosure.com!
|
browse all offers | |||


- 41,19781.4%White alone
- 3,0966.1%Asian alone
- 2,2704.5%Black alone
- 2,2844.5%Two or more races
- 1,6653.3%Hispanic
- 1790.4%Other race alone
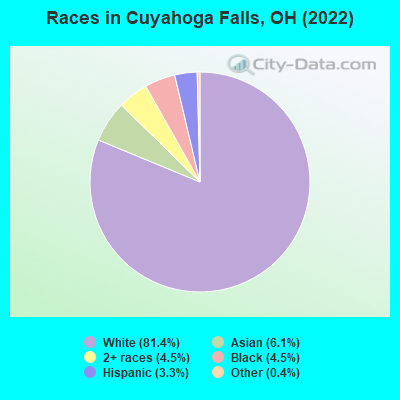
Races in Cuyahoga Falls detailed stats: ancestries, foreign born residents, place of birth
According to our research of Ohio and other state lists, there were 31 registered sex offenders living in Cuyahoga Falls, Ohio as of May 26, 2024.
The ratio of all residents to sex offenders in Cuyahoga Falls is 1,589 to 1.
The ratio of registered sex offenders to all residents in this city is much lower than the state average.
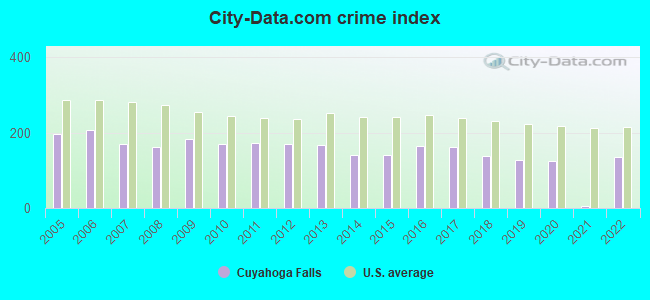
The City-Data.com crime index weighs serious crimes and violent crimes more heavily. Higher means more crime, U.S. average is 246.1. It adjusts for the number of visitors and daily workers commuting into cities.
- means the value is smaller than the state average.- means the value is about the same as the state average.
- means the value is bigger than the state average.
Crime rate in Cuyahoga Falls detailed stats: murders, rapes, robberies, assaults, burglaries, thefts, arson
Full-time law enforcement employees in 2017, including police officers: 86 (71 officers - 68 male; 3 female).
| Officers per 1,000 residents here: | 1.44 |
| Ohio average: | 2.01 |
 Recent articles from our blog. Our writers, many of them Ph.D. graduates or candidates, create easy-to-read articles on a wide variety of topics.

 | Considering moving to Cuyahoga Falls and not sure where to look (7 replies) |
| Most New England-like communities b/t Akron and Cleveland (9 replies) |
| Cuyahoga Falls Schools (4 replies) |
| Trying to remember an Italian restaurant in Cuyahoga Falls (4 replies) |
| Does the location we want even exist? (2 replies) |
| Tell me about Akron area (17 replies) |
Latest news from Cuyahoga Falls, OH collected exclusively by city-data.com from local newspapers, TV, and radio stations
Ancestries: German (17.2%), Italian (10.3%), American (9.0%), English (7.0%), Irish (6.1%), European (2.8%).
Current Local Time: EST time zone
Incorporated in 1959
Elevation: 1050 feet
Land area: 25.5 square miles.
Population density: 1,983 people per square mile (low).
3,996 residents are foreign born (4.9% Asia, 1.2% Europe, 0.9% Latin America).
| This city: | 7.9% |
| Ohio: | 4.9% |
Median real estate property taxes paid for housing units with mortgages in 2022: $2,692 (1.5%)
Median real estate property taxes paid for housing units with no mortgage in 2022: $2,641 (1.6%)
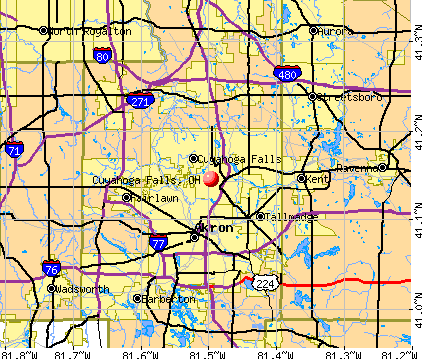
Nearest city with pop. 50,000+: Akron, OH  (5.1 miles , pop. 217,074).
Nearest city with pop. 1,000,000+: Chicago, IL (323.8 miles , pop. 2,896,016).
Nearest cities:
), Latitude: 41.15 N, Longitude: 81.50 W
Daytime population change due to commuting: -5,293 (-10.5%)
Workers who live and work in this city: 8,234 (29.8%)
Area code commonly used in this area: 330
Property values in Cuyahoga Falls, OH
Cuyahoga Falls tourist attractions:
Cuyahoga Falls, Ohio accommodation & food services, waste management - Economy and Business Data
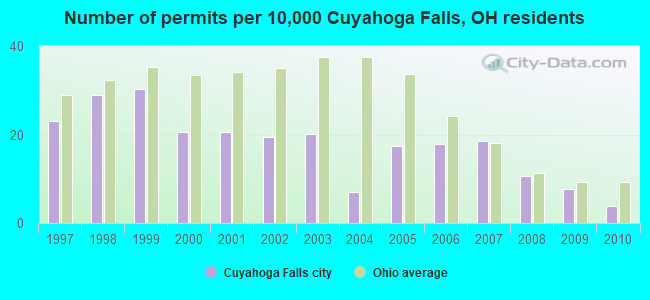
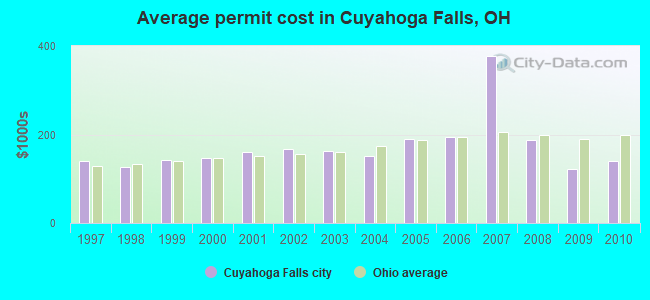
Single-family new house construction building permits:
- 2010: 19 buildings, average cost: $138,700
- 2009: 38 buildings, average cost: $122,000
- 2008: 52 buildings, average cost: $186,600
- 2007: 92 buildings, average cost: $377,400
- 2006: 88 buildings, average cost: $195,300
- 2005: 86 buildings, average cost: $189,700
- 2004: 35 buildings, average cost: $151,300
- 2003: 99 buildings, average cost: $161,800
- 2002: 96 buildings, average cost: $167,900
- 2001: 102 buildings, average cost: $160,500
- 2000: 101 buildings, average cost: $147,900
- 1999: 150 buildings, average cost: $142,600
- 1998: 143 buildings, average cost: $125,500
- 1997: 114 buildings, average cost: $139,400
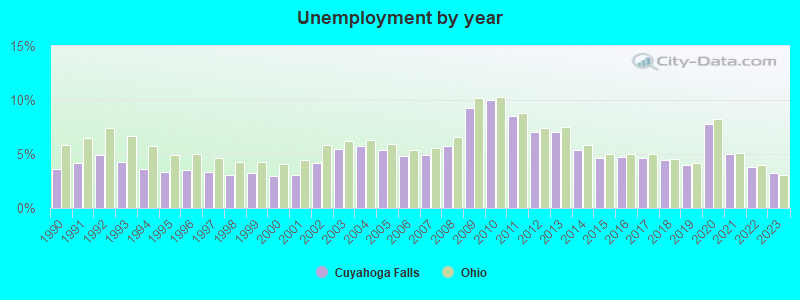
| Here: | 3.2% |
| Ohio: | 3.1% |
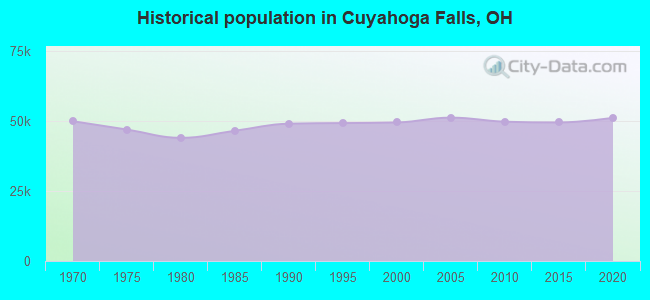
Population change in the 1990s: +429 (+0.9%).
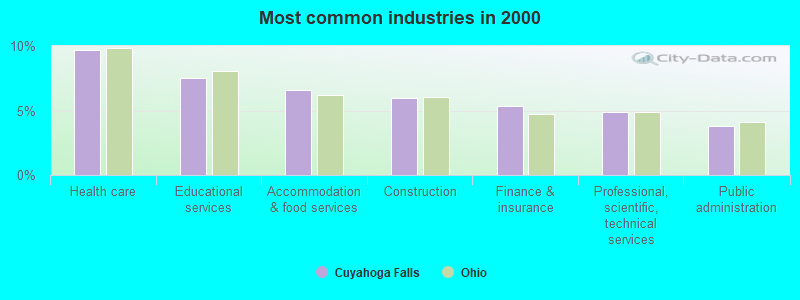
- Health care (9.7%)
- Educational services (7.5%)
- Accommodation & food services (6.6%)
- Construction (6.0%)
- Finance & insurance (5.3%)
- Professional, scientific, technical services (4.9%)
- Public administration (3.8%)
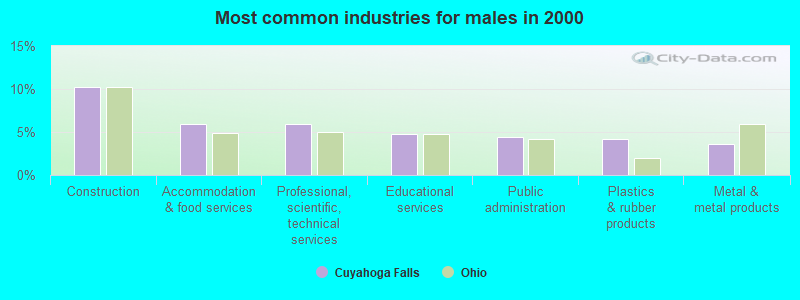
- Construction (10.2%)
- Accommodation & food services (5.9%)
- Professional, scientific, technical services (5.9%)
- Educational services (4.7%)
- Public administration (4.4%)
- Plastics & rubber products (4.2%)
- Metal & metal products (3.6%)
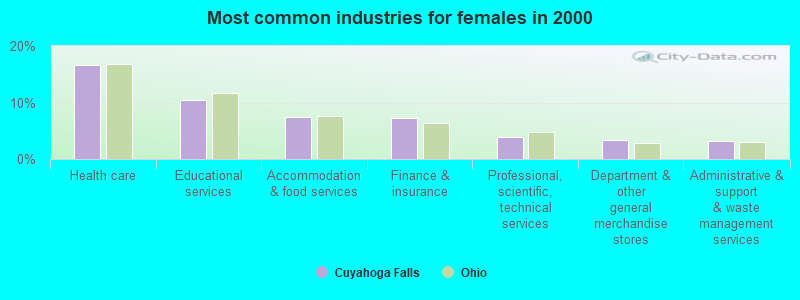
- Health care (16.7%)
- Educational services (10.5%)
- Accommodation & food services (7.4%)
- Finance & insurance (7.3%)
- Professional, scientific, technical services (3.8%)
- Department & other general merchandise stores (3.3%)
- Administrative & support & waste management services (3.1%)
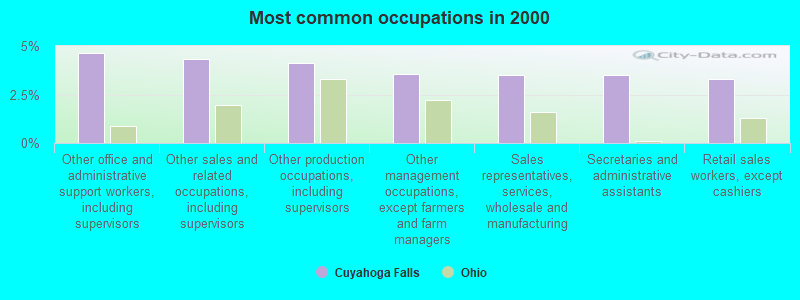
- Other office and administrative support workers, including supervisors (4.6%)
- Other sales and related occupations, including supervisors (4.3%)
- Other production occupations, including supervisors (4.1%)
- Other management occupations, except farmers and farm managers (3.5%)
- Sales representatives, services, wholesale and manufacturing (3.5%)
- Secretaries and administrative assistants (3.5%)
- Retail sales workers, except cashiers (3.3%)
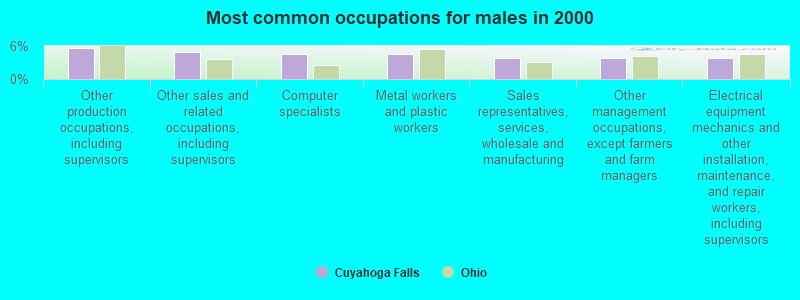
- Other production occupations, including supervisors (5.7%)
- Other sales and related occupations, including supervisors (5.0%)
- Computer specialists (4.5%)
- Metal workers and plastic workers (4.5%)
- Sales representatives, services, wholesale and manufacturing (3.9%)
- Other management occupations, except farmers and farm managers (3.9%)
- Electrical equipment mechanics and other installation, maintenance, and repair workers, including supervisors (3.8%)

- Other office and administrative support workers, including supervisors (7.4%)
- Secretaries and administrative assistants (7.2%)
- Registered nurses (4.6%)
- Retail sales workers, except cashiers (4.0%)
- Information and record clerks, except customer service representatives (3.8%)
- Preschool, kindergarten, elementary, and middle school teachers (3.7%)
- Other sales and related occupations, including supervisors (3.7%)
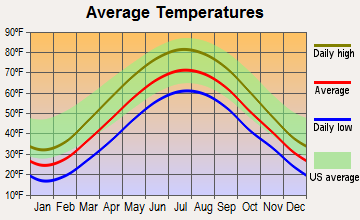
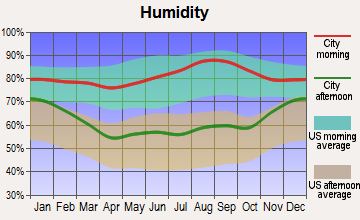
Average climate in Cuyahoga Falls, Ohio
Based on data reported by over 4,000 weather stations


|
|


(lower is better)
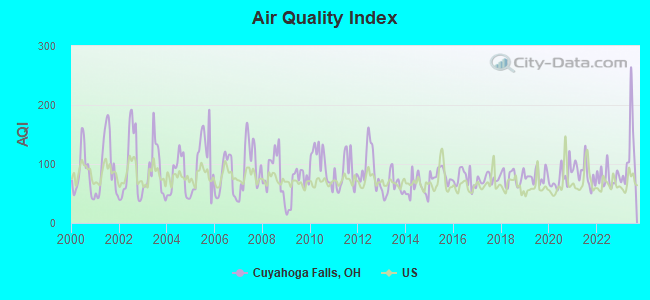
Air Quality Index (AQI) level in 2023 was 116. This is significantly worse than average.
| City: | 116 |
| U.S.: | 73 |
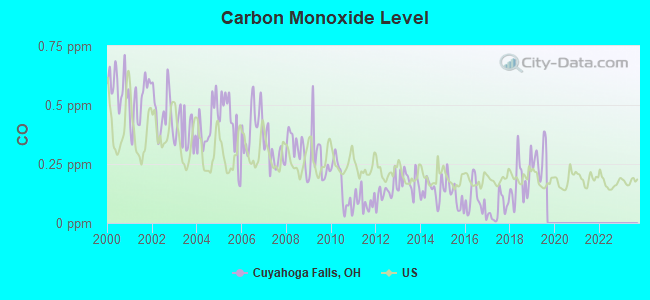
Carbon Monoxide (CO) [ppm] level in 2019 was 0.276. This is about average. Closest monitor was 2.7 miles away from the city center.
| City: | 0.276 |
| U.S.: | 0.251 |
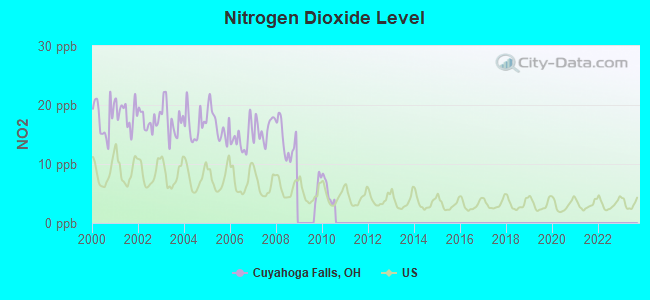
Nitrogen Dioxide (NO2) [ppb] level in 2010 was 5.40. This is about average. Closest monitor was 1.6 miles away from the city center.
| City: | 5.40 |
| U.S.: | 5.11 |
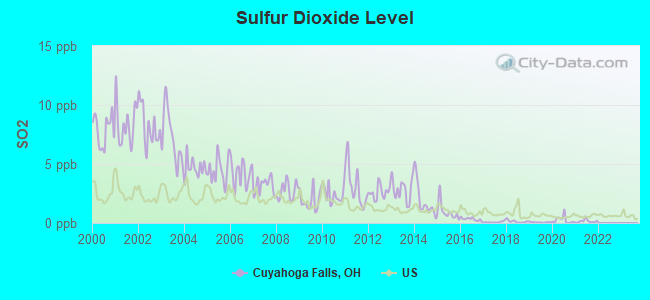
Sulfur Dioxide (SO2) [ppb] level in 2021 was 0.153. This is significantly better than average. Closest monitor was 1.6 miles away from the city center.
| City: | 0.153 |
| U.S.: | 1.515 |
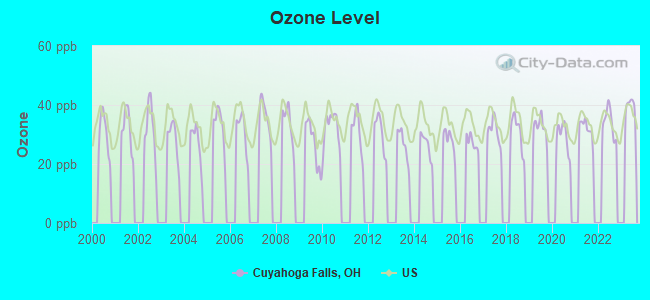
Ozone [ppb] level in 2022 was 34.1. This is about average. Closest monitor was 2.7 miles away from the city center.
| City: | 34.1 |
| U.S.: | 33.3 |
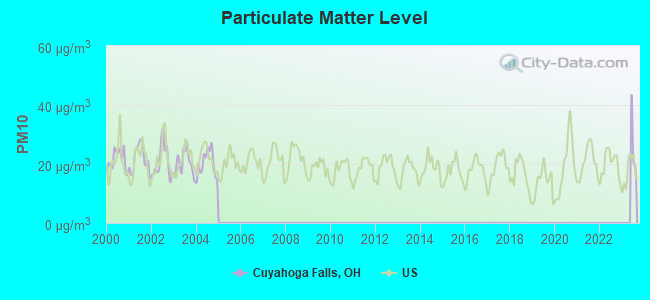
Particulate Matter (PM10) [µg/m3] level in 2004 was 20.2. This is about average. Closest monitor was 4.7 miles away from the city center.
| City: | 20.2 |
| U.S.: | 19.2 |
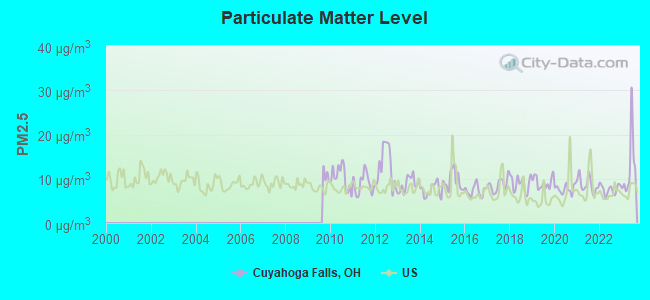
Particulate Matter (PM2.5) [µg/m3] level in 2023 was 12.6. This is significantly worse than average. Closest monitor was 4.6 miles away from the city center.
| City: | 12.6 |
| U.S.: | 8.1 |
Tornado activity:
Cuyahoga Falls-area historical tornado activity is near Ohio state average. It is 9% greater than the overall U.S. average.
On 5/31/1985, a category F5 (max. wind speeds 261-318 mph) tornado 18.4 miles away from the Cuyahoga Falls city center killed 18 people and injured 310 people and caused between $50,000,000 and $500,000,000 in damages.
On 4/11/1965, a category F4 (max. wind speeds 207-260 mph) tornado 21.5 miles away from the city center killed 18 people and injured 200 people and caused between $5,000,000 and $50,000,000 in damages.
Earthquake activity:
Cuyahoga Falls-area historical earthquake activity is significantly above Ohio state average. It is 48% smaller than the overall U.S. average.On 9/25/1998 at 19:52:52, a magnitude 5.2 (4.8 MB, 4.3 MS, 5.2 LG, 4.5 MW, Depth: 3.1 mi, Class: Moderate, Intensity: VI - VII) earthquake occurred 62.0 miles away from the city center
On 1/31/1986 at 16:46:43, a magnitude 5.0 (5.0 MB) earthquake occurred 36.1 miles away from the city center
On 8/23/2011 at 17:51:04, a magnitude 5.8 (5.8 MW, Depth: 3.7 mi) earthquake occurred 293.5 miles away from the city center
On 7/27/1980 at 18:52:21, a magnitude 5.2 (5.1 MB, 4.7 MS, 5.0 UK, 5.2 UK) earthquake occurred 241.5 miles away from Cuyahoga Falls center
On 6/10/2019 at 14:50:45, a magnitude 4.0 (4.0 MB, Depth: 1.2 mi, Class: Light, Intensity: IV - V) earthquake occurred 37.0 miles away from the city center
On 12/31/2011 at 20:05:01, a magnitude 4.0 (4.0 ML, Depth: 3.1 mi) earthquake occurred 42.4 miles away from the city center
Magnitude types: regional Lg-wave magnitude (LG), body-wave magnitude (MB), local magnitude (ML), surface-wave magnitude (MS), moment magnitude (MW)
Natural disasters:
The number of natural disasters in Summit County (11) is smaller than the US average (15).Major Disasters (Presidential) Declared: 7
Emergencies Declared: 3
Causes of natural disasters: Storms: 6, Tornadoes: 5, Floods: 4, Winds: 2, Blizzard: 1, Hurricane: 1, Power Outage: 1, Snowstorm: 1, Tropical Depression: 1, Other: 1 (Note: some incidents may be assigned to more than one category).

Main business address for: AMH Holdings, Inc. (PLASTICS PRODUCTS, NEC), ASSOCIATED MATERIALS INC (PLASTICS PRODUCTS, NEC).
Hospitals and medical centers in Cuyahoga Falls:
- EDWIN SHAW REHAB INSTITUTE (Government - Local, provides emergency services, 330 BROADWAY EAST)
- FALLSVIEW PSYCHIATRIC HOSPITAL (330 BROADWAY E)
- SUMMA WESTERN RESERVE HOSPITAL (Voluntary non-profit - Other, provides emergency services, 1900 23RD STREET)
- HOME CARE NETWORK INC (198 WEST PORTAGE TRAIL , SUITE 100)
- INCARE HOME HEALTH, NORTHERN OHIO (2321 SECOND STREET, SUITE 102)
- PROFESSIONAL NURSING SERVICE (2497 STATE ROAD)
- ALTERCARE OF CUYAHOGA FALLS CTR FOR REHAB AND NURSIN (2728 BAILEY RD)
- FALLS VILLAGE RETIREMENT COMMUNITY (330 BROADWAY EAST)
- TRADITIONS AT BATH ROAD (300 EAST BATH ROAD)
Heliports located in Cuyahoga Falls:
See details about Heliports located in Cuyahoga Falls, OHCollege/University in Cuyahoga Falls:
Colleges/universities with over 2000 students nearest to Cuyahoga Falls:
- University of Akron Main Campus (about 5 miles; Akron, OH; Full-time enrollment: 22,216)
- Kent State University at Kent (about 9 miles; Kent, OH; FT enrollment: 25,431)
- Stark State College (about 20 miles; North Canton, OH; FT enrollment: 7,707)
- Kent State University at Stark (about 20 miles; Canton, OH; FT enrollment: 3,259)
- Walsh University (about 20 miles; North Canton, OH; FT enrollment: 2,553)
- Malone University (about 23 miles; Canton, OH; FT enrollment: 2,201)
- John Carroll University (about 24 miles; University Heights, OH; FT enrollment: 3,546)
Public high schools in Cuyahoga Falls:
- CUYAHOGA FALLS HIGH SCHOOL (Students: 1,599, Location: 2300 4TH ST, Grades: 9-12)
- SCHNEE LEARNING CENTER (Students: 173, Location: 2222 ISSAQUAH ST, Grades: 9-12, Charter school)
Private high schools in Cuyahoga Falls:
Public elementary/middle schools in Cuyahoga Falls:
- BOLICH MIDDLE SCHOOL (Students: 667, Location: 2630 13TH ST, Grades: 6-8)
- ROBERTS MIDDLE SCHOOL (Students: 461, Location: 3333 CHARLES ST, Grades: 6-8)
- GORDON DEWITT ELEMENTARY SCHOOL (Students: 436, Location: 425 FALLS AVE, Grades: KG-5)
- WOODRIDGE PRIMARY ELEMENTARY SCHOOL (Students: 401, Location: 3313 NORTHAMPTON RD, Grades: PK-3)
- RICHARDSON ELEMENTARY SCHOOL (Students: 359, Location: 2226 23RD ST, Grades: KG-5)
- ELIZABETH PRICE ELEMENTARY SCHOOL (Students: 311, Location: 2610 DELMORE ST, Grades: KG-5)
- PRESTON ELEMENTARY SCHOOL (Students: 266, Location: 800 TALLMADGE RD, Grades: KG-5)
- LINCOLN ELEMENTARY SCHOOL (Location: 3131 BAILEY RD, Grades: KG-5)
Private elementary/middle schools in Cuyahoga Falls:
- IMMACULATE HEART OF MARY SCHOOL (Students: 378, Location: 2859 LILLIS DR, Grades: KG-8)
- CHAPEL HILL CHRISTIAN SCHOOL (Students: 328, Location: 1090 HOWE AVE, Grades: PK-6)
- REDEEMER CHRISTIAN SCHOOL (Students: 245, Location: 2141 5TH ST, Grades: PK-8)
- SUMMIT CHRISTIAN SCHOOL (Students: 144, Location: 2800 13TH ST, Grades: PK-8)
- FAITH ISLAMIC ACADEMY (Students: 77, Location: 152 E STEELS CORNERS RD, Grades: PK-8)
User-submitted facts and corrections:
- Taylor Library is now Cuyahoga Falls Public Library
Points of interest:
Notable locations in Cuyahoga Falls: Indigo Lake Station (A), Indigo Lake Trailhead (B), Breathnach Country Club (C), Brookledge Golf Course (D), Camp Mueller (E), Cuyahoga Falls Fire Department Station 4 (F), Cuyahoga Falls Fire Department Station 5 (G), Cuyahoga Falls Fire Department Station 1 (H), Cuyahoga Falls City Hall (I), Akron Fire Department Station 11 (J), Cuyahoga Falls Fire Department Station 2 (K), Cuyahoga Falls Fire Department Station 3 (L), Taylor Memorial Public Library (M), Blossom Music Center (N). Display/hide their locations on the map
Shopping Centers: Greater State Road Shopping Center (1), State Road Mall Shopping Center (2), Northampton Square Shopping Center (3), The Plaza at Chapel Hills Shopping Center (4), Chapel Hill Square Shopping Center (5). Display/hide their locations on the map
Main business address in Cuyahoga Falls include: AMH Holdings, Inc. (A), ASSOCIATED MATERIALS INC (B). Display/hide their locations on the map
Churches in Cuyahoga Falls include: Billow Memorial Chapel (A), Cuyahoga Falls Church of the Nazarene (B), First Christian Church (C), First Church of Christ Scientist (D), First United Methodist Church of Cuyahoga Falls (E), Saint Johns Episcopal Church (F), United Presbyterian Church of Cuyahoga Falls (G), Pilgrim United Church of Christ (H), Redeemer Lutheran Church (I). Display/hide their locations on the map
Cemeteries: Chestnut Memorial Cemetery (1), Wyoga Lake Park (2), Harrington Cemetery (3), Northampton Center Cemetery (4), Oakwood Cemetery (5). Display/hide their locations on the map
Lakes and reservoirs: Kool Lake (A), Indigo Lake (B), Cuyahoga Falls Low Head Reservoir (C), Old Mill Pond (D), Bell Lake (E). Display/hide their locations on the map
Streams, rivers, and creeks: Mud Brook (A), Babb Run (B), Kelsey Brook (C). Display/hide their locations on the map
Parks in Cuyahoga Falls include: Oak Park (1), Harrington Field (2), Lions Park (3), Linden Park (4), Ross Park (5), Indian Mount Park (6), Babb Run Park (7), Waterworks Park (8), Preston Park (9). Display/hide their locations on the map
Tourist attraction: Cuyahoga Valley Art Center Inc (Museums; 2131 Front Street) (1). Display/hide its approximate location on the map
Hotels: Economy Inn (1070 Graham Road) (1), Country Inn & Suites Cuyahoga Falls (1420 Main Street) (2). Display/hide their approximate locations on the map
Birthplace of: Jim Jarmusch - Film director, Gates McFadden - Actress, Jane Jacobs (baseball) - Girls Professional Baseball League player, George Thomas Washington - Judge.
Drinking water stations with addresses in Cuyahoga Falls and their reported violations in the past:
CUYAHOGA FALLS CITY PWS (Population served: 49,652, Groundwater):Past monitoring violations:SUMMIT COUNTY SHERIFFS TRAINING FACILITY (Address: 2525 STATE ROAD , Population served: 51, Groundwater):
- Water Quality Parameter M/R - Between JUL-2013 and DEC-2013, Contaminant: Lead and Copper Rule. Follow-up actions: St Public Notif requested (FEB-20-2014), St Violation/Reminder Notice (FEB-20-2014), St Public Notif received (APR-01-2014)
- Monitoring and Reporting (DBP) - Between JAN-2013 and MAR-2013, Contaminant: TTHM. Follow-up actions: St Violation/Reminder Notice (MAY-21-2013), St Public Notif requested (MAY-21-2013), St Compliance achieved (AUG-12-2013), St Public Notif received (APR-01-2014)
- Monitoring and Reporting (DBP) - Between JAN-2013 and MAR-2013, Contaminant: Total Haloacetic Acids (HAA5). Follow-up actions: St Violation/Reminder Notice (MAY-21-2013), St Public Notif requested (MAY-21-2013), St Compliance achieved (AUG-12-2013), St Public Notif received (APR-01-2014)
Past monitoring violations:JUBILEE DONUTS (Population served: 25, Groundwater):
- One routine major monitoring violation
Past health violations:Past monitoring violations:
- MCL, Monthly (TCR) - Between APR-2014 and JUN-2014, Contaminant: Coliform
- Monitoring, Source Water (GWR) - In JUN-24-2014, Contaminant: E. COLI
- Monitoring, Repeat Major (TCR) - Between APR-2014 and JUN-2014, Contaminant: Coliform (TCR)
| This city: | 2.2 people |
| Ohio: | 2.4 people |
| This city: | 57.0% |
| Whole state: | 65.0% |
| This city: | 6.9% |
| Whole state: | 6.8% |
Likely homosexual households (counted as self-reported same-sex unmarried-partner households)
- Lesbian couples: 0.4% of all households
- Gay men: 0.2% of all households
People in group quarters in Cuyahoga Falls in 2010:
- 345 people in nursing facilities/skilled-nursing facilities
- 129 people in other noninstitutional facilities
- 47 people in group homes intended for adults
- 9 people in residential treatment centers for adults
People in group quarters in Cuyahoga Falls in 2000:
- 304 people in nursing homes
- 27 people in other group homes
- 26 people in other noninstitutional group quarters
- 16 people in other nonhousehold living situations
- 12 people in schools, hospitals, or wards for the intellectually disabled
- 7 people in homes for the mentally retarded
- 7 people in religious group quarters
Banks with most branches in Cuyahoga Falls (2011 data):
- PNC Bank, National Association: State Road Branch, Graham-Bailey Branch, Portage Trail Branch. Info updated 2012/03/20: Bank assets: $263,309.6 mil, Deposits: $197,343.0 mil, headquarters in Wilmington, DE, positive income, Commercial Lending Specialization, 3085 total offices, Holding Company: Pnc Financial Services Group, Inc., The
- Firstmerit Bank, National Association: Bailey Road Branch, Falls Center Branch, State Road Branch. Info updated 2010/05/17: Bank assets: $14,420.6 mil, Deposits: $11,497.6 mil, headquarters in Akron, OH, positive income, Commercial Lending Specialization, 213 total offices, Holding Company: Firstmerit Corporation
- The Huntington National Bank: Cuyahoga Falls Branch at 2503 State Road, branch established on 2005/01/03; Howe Avenue Branch at 230 Howe Avenue, branch established on 2011/05/02. Info updated 2012/04/02: Bank assets: $54,183.4 mil, Deposits: $44,300.3 mil, headquarters in Columbus, OH, positive income, Commercial Lending Specialization, 878 total offices, Holding Company: Huntington Bancshares Incorporated
- RBS Citizens, National Association: Cuyahoga Falls Branch at 1760 State Road, branch established on 2005/04/14; Chapel Hill Branch at 248 Howe Avenue, branch established on 1974/12/04. Info updated 2007/09/19: Bank assets: $106,940.6 mil, Deposits: $75,690.2 mil, headquarters in Providence, RI, positive income, 1135 total offices, Holding Company: Uk Financial Investments Limited
- U.S. Bank National Association: Bailey Road Branch at 2630 Bailey Road, branch established on 1996/10/09; Graham Road Giant Eagle Branch at 75 Graham Road, branch established on 1891/01/01. Info updated 2012/01/30: Bank assets: $330,470.8 mil, Deposits: $236,091.5 mil, headquarters in Cincinnati, OH, positive income, 3121 total offices, Holding Company: U.S. Bancorp
- Valley Savings Bank: Graham Road Branch at 505 Graham Road, branch established on 1997/01/13; at Portage Trail And Second Street, branch established on 1923/01/01. Info updated 2006/11/03: Bank assets: $108.4 mil, Deposits: $90.7 mil, local headquarters, positive income, Commercial Lending Specialization, 2 total offices
- Fifth Third Bank: Graham Square Branch at 911 Graham Road, branch established on 1995/07/21; Cuyahoga Falls Branch at 2335 Second Street, branch established on 1888/01/01. Info updated 2009/10/05: Bank assets: $114,540.4 mil, Deposits: $89,689.1 mil, headquarters in Cincinnati, OH, positive income, Commercial Lending Specialization, 1378 total offices, Holding Company: Fifth Third Bancorp
- KeyBank National Association: Cuyahoga Falls Branch at 1908 State Road, branch established on 1969/05/12. Info updated 2008/03/03: Bank assets: $86,198.8 mil, Deposits: $64,214.8 mil, headquarters in Cleveland, OH, positive income, Commercial Lending Specialization, 1067 total offices, Holding Company: Keycorp
- North Akron Savings Bank: Cuyahoga Falls Branch at 1871 State Road, branch established on 2002/10/26. Info updated 2006/11/03: Bank assets: $157.6 mil, Deposits: $112.0 mil, headquarters in Akron, OH, negative income in the last year, Mortgage Lending Specialization, 5 total offices
- 3 other banks with 3 local branches
For population 15 years and over in Cuyahoga Falls:
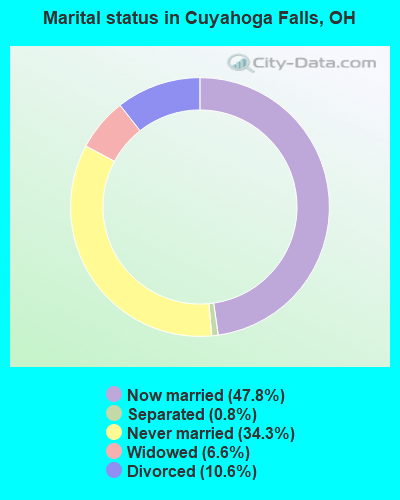
- Never married: 34.3%
- Now married: 47.8%
- Separated: 0.8%
- Widowed: 6.6%
- Divorced: 10.6%
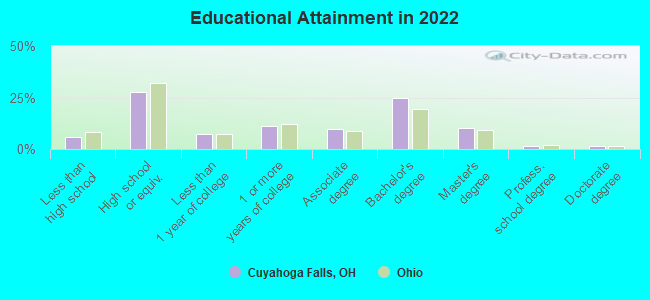
For population 25 years and over in Cuyahoga Falls:
- High school or higher: 94.2%
- Bachelor's degree or higher: 35.6%
- Graduate or professional degree: 11.6%
- Unemployed: 3.3%
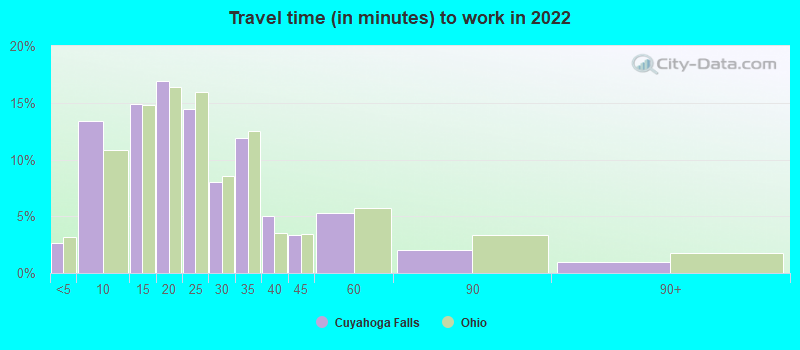
- Mean travel time to work (commute): 19.0 minutes
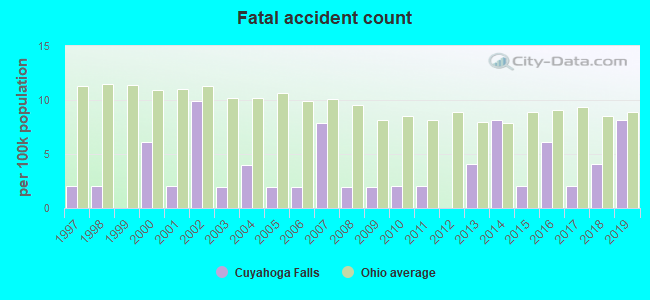
| Here: | 11.2 |
| Ohio average: | 11.0 |
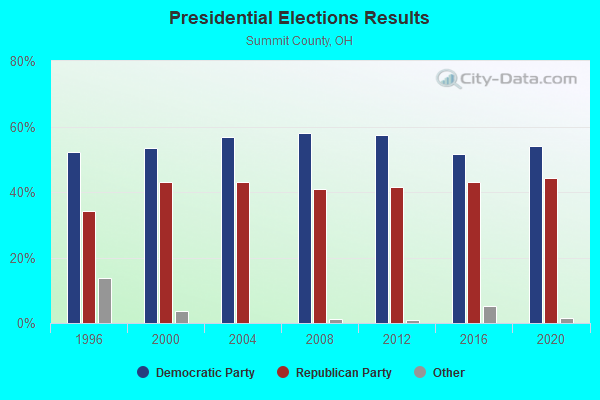
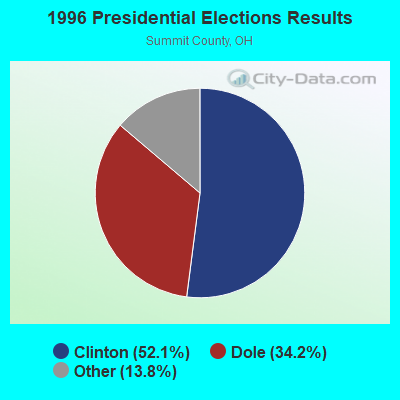
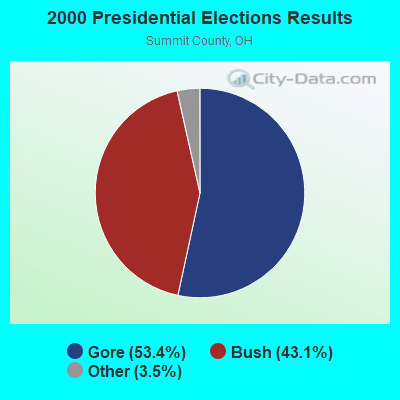
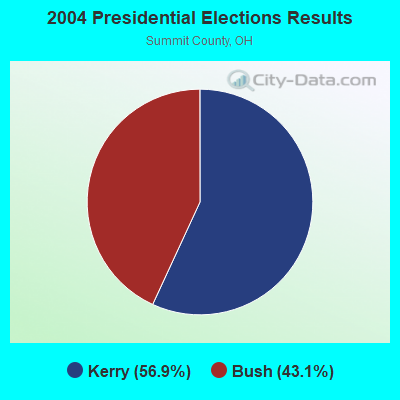
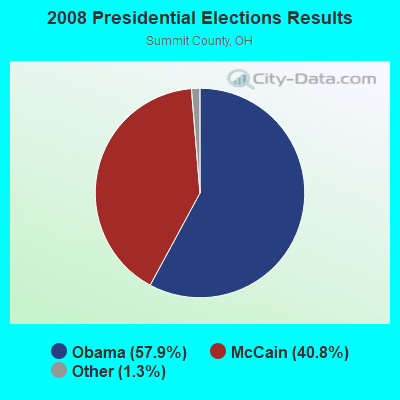
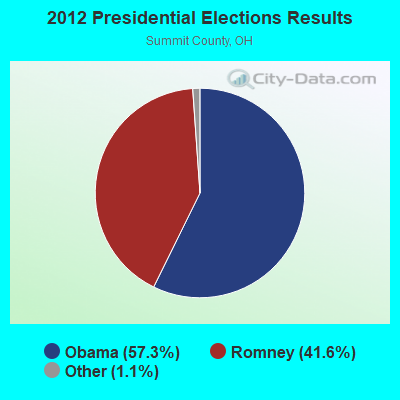
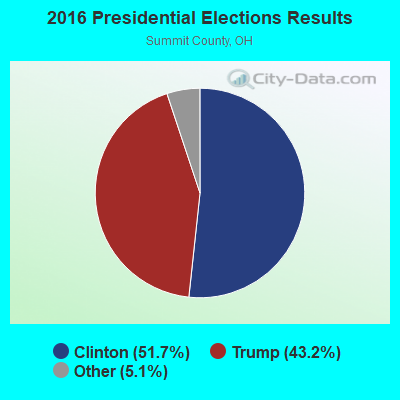
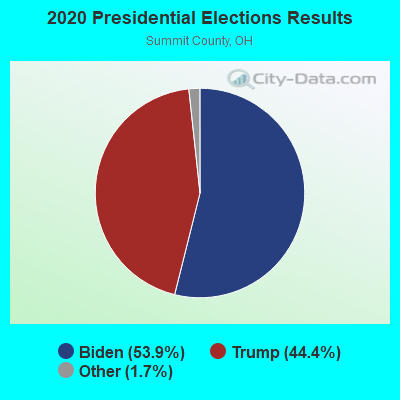
Graphs represent county-level data. Detailed 2008 Election Results
Political contributions by individuals in Cuyahoga Falls, OH
Religion statistics for Cuyahoga Falls, OH (based on Summit County data)
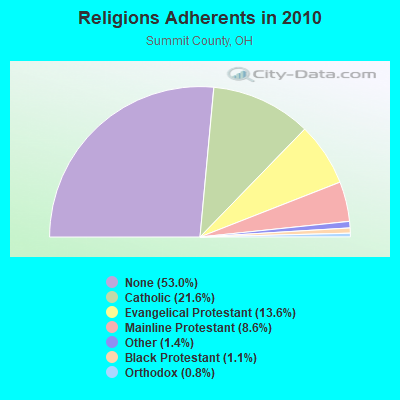
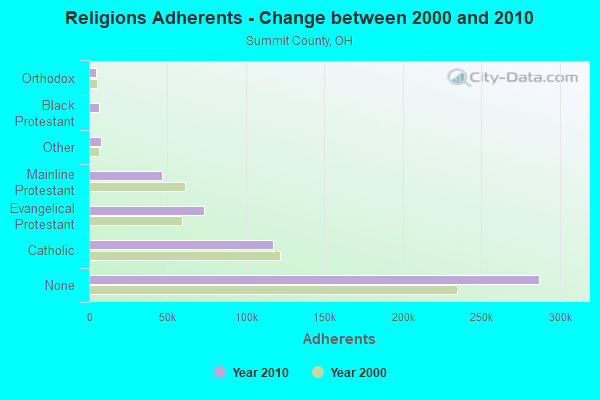
| Religion | Adherents | Congregations |
|---|---|---|
| Catholic | 116,941 | 33 |
| Evangelical Protestant | 73,586 | 254 |
| Mainline Protestant | 46,521 | 127 |
| Other | 7,347 | 34 |
| Black Protestant | 6,129 | 26 |
| Orthodox | 4,230 | 12 |
| None | 287,027 | - |
Food Environment Statistics:
| This county: | 1.54 / 10,000 pop. |
| State: | 1.89 / 10,000 pop. |
| Summit County: | 0.07 / 10,000 pop. |
| Ohio: | 0.13 / 10,000 pop. |
| Here: | 0.77 / 10,000 pop. |
| Ohio: | 1.25 / 10,000 pop. |
| Summit County: | 2.67 / 10,000 pop. |
| Ohio: | 2.93 / 10,000 pop. |
| Here: | 6.20 / 10,000 pop. |
| State: | 6.25 / 10,000 pop. |
| Here: | 10.7% |
| Ohio: | 10.3% |
| Summit County: | 27.6% |
| Ohio: | 29.1% |
| This county: | 12.0% |
| Ohio: | 11.9% |
Health and Nutrition:
| Cuyahoga Falls: | 52.9% |
| State: | 50.4% |
| This city: | 51.5% |
| Ohio: | 47.8% |
| Cuyahoga Falls: | 28.6 |
| Ohio: | 28.7 |
| Here: | 19.5% |
| State: | 20.6% |
| Cuyahoga Falls: | 9.8% |
| Ohio: | 10.4% |
| This city: | 6.9 |
| Ohio: | 6.8 |
| This city: | 34.4% |
| State: | 34.3% |
| Cuyahoga Falls: | 59.8% |
| Ohio: | 57.0% |
| This city: | 79.3% |
| State: | 79.1% |
More about Health and Nutrition of Cuyahoga Falls, OH Residents
| Local government employment and payroll (March 2022) | |||||
| Function | Full-time employees | Monthly full-time payroll | Average yearly full-time wage | Part-time employees | Monthly part-time payroll |
|---|---|---|---|---|---|
| Firefighters | 72 | $562,524 | $93,754 | 0 | $0 |
| Police Protection - Officers | 71 | $509,425 | $86,100 | 0 | $0 |
| Streets and Highways | 41 | $246,461 | $72,135 | 1 | $1,771 |
| Electric Power | 39 | $282,434 | $86,903 | 0 | $0 |
| Parks and Recreation | 33 | $188,358 | $68,494 | 205 | $127,069 |
| Financial Administration | 31 | $183,748 | $71,128 | 5 | $8,552 |
| Other and Unallocable | 28 | $146,834 | $62,929 | 6 | $11,045 |
| Water Supply | 26 | $194,605 | $89,818 | 2 | $3,357 |
| Solid Waste Management | 16 | $67,711 | $50,783 | 0 | $0 |
| Other Government Administration | 11 | $108,504 | $118,368 | 14 | $22,426 |
| Housing and Community Development (Local) | 8 | $56,892 | $85,338 | 1 | $1,991 |
| Judicial and Legal | 8 | $53,913 | $80,870 | 1 | $1,658 |
| Police - Other | 4 | $18,653 | $55,959 | 9 | $16,231 |
| Fire - Other | 2 | $9,869 | $59,214 | 1 | $2,316 |
| Totals for Government | 390 | $2,629,932 | $80,921 | 245 | $196,416 |
Cuyahoga Falls government finances - Expenditure in 2021 (per resident):
- Construction - General - Other: $10,644,000 ($210.13)
Regular Highways: $8,150,000 ($160.89)
Electric Utilities: $2,764,000 ($54.57)
Water Utilities: $1,075,000 ($21.22)
Sewerage: $749,000 ($14.79)
- Current Operations - Electric Utilities: $47,011,000 ($928.06)
Local Fire Protection: $10,254,000 ($202.43)
Parks and Recreation: $10,086,000 ($199.11)
Police Protection: $10,006,000 ($197.53)
Sewerage: $8,758,000 ($172.90)
General - Other: $5,327,000 ($105.16)
Regular Highways: $4,231,000 ($83.53)
Water Utilities: $3,963,000 ($78.24)
Solid Waste Management: $3,708,000 ($73.20)
Financial Administration: $2,156,000 ($42.56)
Central Staff Services: $1,791,000 ($35.36)
General Public Buildings: $1,557,000 ($30.74)
Judicial and Legal Services: $1,209,000 ($23.87)
Housing and Community Development: $1,207,000 ($23.83)
Miscellaneous Commercial Activities - Other: $5,000 ($0.10)
- General - Interest on Debt: $715,000 ($14.12)
- Other Capital Outlay - Water Utilities: $2,301,000 ($45.42)
Sewerage: $1,502,000 ($29.65)
Electric Utilities: $1,020,000 ($20.14)
Regular Highways: $263,000 ($5.19)
Parks and Recreation: $214,000 ($4.22)
Solid Waste Management: $35,000 ($0.69)
- Water Utilities - Interest on Debt: $28,000 ($0.55)
Cuyahoga Falls government finances - Revenue in 2021 (per resident):
- Charges - Sewerage: $9,501,000 ($187.56)
Parks and Recreation: $6,952,000 ($137.24)
Other: $4,195,000 ($82.82)
Solid Waste Management: $3,756,000 ($74.15)
Regular Highways: $805,000 ($15.89)
Miscellaneous Commercial Activities: $1,000 ($0.02)
- Federal Intergovernmental - Housing and Community Development: $648,000 ($12.79)
- Local Intergovernmental - Highways: $220,000 ($4.34)
- Miscellaneous - General Revenue - Other: $1,734,000 ($34.23)
Sale of Property: $1,512,000 ($29.85)
Interest Earnings: $929,000 ($18.34)
Fines and Forfeits: $208,000 ($4.11)
Special Assessments: $77,000 ($1.52)
- Revenue - Electric Utilities: $49,470,000 ($976.61)
Water Utilities: $5,293,000 ($104.49)
- State Intergovernmental - Highways: $3,320,000 ($65.54)
General Local Government Support: $3,251,000 ($64.18)
Other: $429,000 ($8.47)
Water Utilities: $403,000 ($7.96)
Housing and Community Development: $59,000 ($1.16)
Electric Utilities: $2,000 ($0.04)
- Tax - Individual Income: $24,118,000 ($476.12)
Property: $10,247,000 ($202.29)
Other Selective Sales: $2,638,000 ($52.08)
Motor Vehicle License: $654,000 ($12.91)
Other License: $173,000 ($3.42)
Cuyahoga Falls government finances - Debt in 2021 (per resident):
- Long Term Debt - Beginning Outstanding - Unspecified Public Purpose: $25,205,000 ($497.58)
Outstanding Unspecified Public Purpose: $23,415,000 ($462.24)
Retired Unspecified Public Purpose: $1,790,000 ($35.34)
Cuyahoga Falls government finances - Cash and Securities in 2021 (per resident):
- Bond Funds - Cash and Securities: $6,889,000 ($136.00)
- Other Funds - Cash and Securities: $59,682,000 ($1178.21)
- Sinking Funds - Cash and Securities: $6,000 ($0.12)
5.57% of this county's 2021 resident taxpayers lived in other counties in 2020 ($56,230 average adjusted gross income)
| Here: | 5.57% |
| Ohio average: | 5.68% |
0.01% of residents moved from foreign countries ($80 average AGI)
Summit County: 0.01% Ohio average: 0.01%
Top counties from which taxpayers relocated into this county between 2020 and 2021:
| from Cuyahoga County, OH | |
| from Stark County, OH | |
| from Portage County, OH |
| Businesses in Cuyahoga Falls, OH | ||||
| Name | Count | Name | Count | |
|---|---|---|---|---|
| AT&T | 2 | OfficeMax | 1 | |
| Advance Auto Parts | 1 | Olive Garden | 1 | |
| Applebee's | 1 | Outback | 1 | |
| Arby's | 2 | Outback Steakhouse | 1 | |
| Audi | 1 | Panera Bread | 1 | |
| AutoZone | 2 | Papa John's Pizza | 1 | |
| Avenue | 1 | Payless | 2 | |
| Baskin-Robbins | 1 | Penske | 1 | |
| Burger King | 3 | PetSmart | 1 | |
| Burlington Coat Factory | 1 | Pier 1 Imports | 1 | |
| CVS | 2 | Pizza Hut | 1 | |
| Chick-Fil-A | 1 | Plato's Closet | 1 | |
| Chipotle | 1 | RadioShack | 1 | |
| Circle K | 8 | Red Lobster | 1 | |
| Curves | 1 | Rite Aid | 1 | |
| DHL | 1 | Sam's Club | 1 | |
| Dairy Queen | 1 | Sheraton | 1 | |
| Dunkin Donuts | 2 | Shoe Carnival | 1 | |
| Famous Footwear | 1 | Staples | 1 | |
| FedEx | 5 | Starbucks | 3 | |
| Ford | 1 | Subaru | 1 | |
| GNC | 1 | Subway | 5 | |
| GameStop | 1 | T-Mobile | 2 | |
| H&R Block | 1 | T.J.Maxx | 1 | |
| Home Depot | 1 | Taco Bell | 3 | |
| Hyundai | 1 | Target | 1 | |
| KFC | 1 | Toys"R"Us | 1 | |
| Kincaid | 1 | U-Haul | 1 | |
| La-Z-Boy | 1 | UPS | 11 | |
| Little Caesars Pizza | 1 | Value City Furniture | 1 | |
| Long John Silver's | 1 | Verizon Wireless | 1 | |
| Mazda | 1 | Walgreens | 2 | |
| McDonald's | 3 | Wendy's | 1 | |
| Nissan | 1 | YMCA | 1 | |
Strongest AM radio stations in Cuyahoga Falls:
- WTOU (1350 AM; 5 kW; AKRON, OH)
- WTAM (1100 AM; 50 kW; CLEVELAND, OH; Owner: JACOR BROADCASTING CORPORATION)
- WCUE (1150 AM; 5 kW; CUYAHOGA FALLS, OH; Owner: FAMILY STATIONS, INC.)
- WKNR (850 AM; 50 kW; CLEVELAND, OH; Owner: CARON BROADCASTING, INC.)
- WHK (1220 AM; 50 kW; CLEVELAND, OH; Owner: CARON BROADCASTING, INC.)
- WHLO (640 AM; 5 kW; AKRON, OH; Owner: CLEAR CHANNEL BROADCASTING LICENSES, INC.)
- WWMK (1260 AM; 10 kW; CLEVELAND, OH; Owner: ABC, INC.)
- WAKR (1590 AM; 5 kW; AKRON, OH; Owner: RUBBER CITY RADIO GROUP, INC.)
- WHBC (1480 AM; 15 kW; CANTON, OH; Owner: NM LICENSING, LLC)
- WRMR (1420 AM; 5 kW; CLEVELAND, OH; Owner: CLEVELAND CLASSICAL RADIO, LLC)
- WERE (1300 AM; 5 kW; CLEVELAND, OH)
- WRCW (1060 AM; daytime; 5 kW; CANTON, OH)
- WWVA (1170 AM; 53 kW; WHEELING, WV; Owner: CAPSTAR TX LIMITED PARTNERSHIP)
Strongest FM radio stations in Cuyahoga Falls:
- WAKS (96.5 FM; AKRON, OH; Owner: CAPSTAR TX LIMITED PARTNERSHIP)
- WONE-FM (97.5 FM; AKRON, OH; Owner: RUBBER CITY RADIO GROUP, INC.)
- WKSU-FM (89.7 FM; KENT, OH; Owner: KENT STATE UNIVERSITY)
- WQMX (94.9 FM; MEDINA, OH; Owner: RUBBER CITY RADIO GROUP, INC)
- WZIP (88.1 FM; AKRON, OH; Owner: THE UNIVERSITY OF AKRON)
- WAPS (91.3 FM; AKRON, OH; Owner: BOARD OF EDUCATION, AKRON CITY SCHOOL DISTRICT)
- WNIR (100.1 FM; KENT, OH; Owner: MEDIA-COM, INC.)
- WZAK (93.1 FM; CLEVELAND, OH; Owner: RADIO ONE LICENSES, LLC)
- WMJI (105.7 FM; CLEVELAND, OH; Owner: CITICASTERS LICENSES, L.P.)
- WCRF-FM (103.3 FM; CLEVELAND, OH; Owner: THE MOODY BIBLE INSTITUTE OF CHICAGO)
- WQAL (104.1 FM; CLEVELAND, OH; Owner: INFINITY RADIO OPERATIONS INC.)
- WNCX (98.5 FM; CLEVELAND, OH; Owner: INFINITY RADIO OF CLEVELAND INC.)
- WMVX (106.5 FM; CLEVELAND, OH; Owner: JACOR BROADCASTING CORPORATION)
- WDOK (102.1 FM; CLEVELAND, OH; Owner: INFINITY RADIO OPERATIONS INC.)
- WSTB (88.9 FM; STREETSBORO, OH; Owner: STREETSBORO CITY SCHOOL DISTRICT)
- WKDD (98.1 FM; CANTON, OH; Owner: CITICASTERS LICENSES, L.P.)
- WMMS (100.7 FM; CLEVELAND, OH; Owner: CITICASTERS LICENSES, L.P.)
- WENZ (107.9 FM; CLEVELAND, OH; Owner: RADIO ONE LICENSES, LLC)
- WFHM-FM (95.5 FM; CLEVELAND, OH; Owner: SCA LICENSE CORPORATION)
- WCPN (90.3 FM; CLEVELAND, OH; Owner: IDEASTREAM)
TV broadcast stations around Cuyahoga Falls:
- WAKN-LP (Channel 11; AKRON, OH; Owner: AKRON TELEVISION, INC.)
- WVPX (Channel 23; AKRON, OH; Owner: PAXSON AKRON LICENSE, INC.)
- WAOH-LP (Channel 29; AKRON, OH; Owner: MEDIA-COM TELEVISION, INC.)
- WEAO (Channel 49; AKRON, OH; Owner: NORTHEASTERN EDUCATIONAL TELEVISION OF OHIO, INC.)
- WOAC (Channel 67; CANTON, OH; Owner: WRAY, INC.)
- WKYC-TV (Channel 3; CLEVELAND, OH; Owner: WKYC-TV, INC.)
- WBNX-TV (Channel 55; AKRON, OH; Owner: WINSTON BROADCASTING NETWORK, INC.)
- WOIO (Channel 19; SHAKER HEIGHTS, OH; Owner: RAYCOM NATIONAL, INC.)
- WEWS-TV (Channel 5; CLEVELAND, OH; Owner: SCRIPPS HOWARD BROADCASTING COMPANY)
- W35AX (Channel 35; CLEVELAND, OH; Owner: MEDIA-COM TELEVISION, INC.)
- WQHS-TV (Channel 61; CLEVELAND, OH; Owner: UNIVISION CLEVELAND LLC)
- WUAB (Channel 43; LORAIN, OH; Owner: RAYCOM NATIONAL, INC.)
- WVIZ (Channel 25; CLEVELAND, OH; Owner: IDEASTREAM)
- WJW (Channel 8; CLEVELAND, OH; Owner: WJW LICENSE, INC.)
- WDLI (Channel 17; CANTON, OH; Owner: TRINITY BROADCASTING NETWORK, INC.)
- WXOX-LP (Channel 65; CLEVELAND, OH; Owner: VENTURE TECHNOLOGIES GROUP, LLC)
- W53AX (Channel 53; CLEVELAND, OH; Owner: WORD OF GOD FELLOWSHIP, INC.)
- WRAP-CA (Channel 32; CLEVELAND, OH; Owner: COMMERCIAL BROADCASTING CORP.)
- WKBN-TV (Channel 27; YOUNGSTOWN, OH; Owner: PIEDMONT TELEVISION OF YOUNGSTOWN LICENSE LLC)
- W51BI (Channel 51; KIRTLAND, OH; Owner: TRINITY BROADCASTING NETWORK)
- WNEO (Channel 45; ALLIANCE, OH; Owner: NORTHEASTERN EDUCATIONAL TELEVISION OF OHIO, INC.)
- WIVM-LP (Channel 52; CANTON, OH; Owner: LUCINDA DeVAUL-TONGES)
- WFMJ-TV (Channel 21; YOUNGSTOWN, OH; Owner: WFMJ TELEVISION, INC.)
- National Bridge Inventory (NBI) Statistics
- 37Number of bridges
- 499ft / 152mTotal length
- 880,319Total average daily traffic
- 39,333Total average daily truck traffic
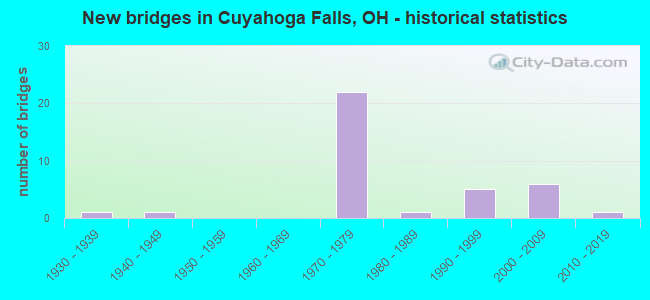
- New bridges - historical statistics
- 11930-1939
- 11940-1949
- 221970-1979
- 11980-1989
- 51990-1999
- 62000-2009
- 12010-2019
FCC Registered Antenna Towers: 84 (See the full list of FCC Registered Antenna Towers)
FCC Registered Commercial Land Mobile Towers: 1 (See the full list of FCC Registered Commercial Land Mobile Towers in Cuyahoga Falls, OH)
FCC Registered Private Land Mobile Towers: 1 (See the full list of FCC Registered Private Land Mobile Towers)
FCC Registered Broadcast Land Mobile Towers: 26 (See the full list of FCC Registered Broadcast Land Mobile Towers)
FCC Registered Microwave Towers: 15 (See the full list of FCC Registered Microwave Towers in this town)
FCC Registered Paging Towers: 3 (See the full list of FCC Registered Paging Towers)
FCC Registered Amateur Radio Licenses: 288 (See the full list of FCC Registered Amateur Radio Licenses in Cuyahoga Falls)
FAA Registered Aircraft: 23 (See the full list of FAA Registered Aircraft in Cuyahoga Falls)
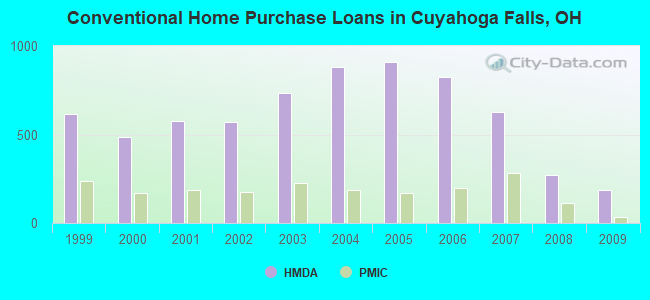
| Home Mortgage Disclosure Act Aggregated Statistics For Year 2009 (Based on 7 full and 4 partial tracts) | ||||||||||||||
| A) FHA, FSA/RHS & VA Home Purchase Loans | B) Conventional Home Purchase Loans | C) Refinancings | D) Home Improvement Loans | E) Loans on Dwellings For 5+ Families | F) Non-occupant Loans on < 5 Family Dwellings (A B C & D) | G) Loans On Manufactured Home Dwelling (A B C & D) | ||||||||
|---|---|---|---|---|---|---|---|---|---|---|---|---|---|---|
| Number | Average Value | Number | Average Value | Number | Average Value | Number | Average Value | Number | Average Value | Number | Average Value | Number | Average Value | |
| LOANS ORIGINATED | 341 | $110,016 | 189 | $117,756 | 750 | $130,798 | 46 | $25,136 | 2 | $1,913,000 | 41 | $128,675 | 2 | $26,340 |
| APPLICATIONS APPROVED, NOT ACCEPTED | 9 | $93,792 | 11 | $103,275 | 67 | $118,643 | 18 | $34,911 | 0 | $0 | 2 | $54,000 | 1 | $8,050 |
| APPLICATIONS DENIED | 24 | $98,763 | 25 | $79,136 | 316 | $130,300 | 71 | $24,223 | 1 | $160,030 | 14 | $54,416 | 4 | $43,162 |
| APPLICATIONS WITHDRAWN | 22 | $119,471 | 23 | $99,288 | 117 | $140,289 | 15 | $32,285 | 0 | $0 | 7 | $71,771 | 0 | $0 |
| FILES CLOSED FOR INCOMPLETENESS | 2 | $73,895 | 5 | $98,678 | 65 | $128,594 | 3 | $60,000 | 0 | $0 | 1 | $152,490 | 0 | $0 |
Detailed mortgage data for all 10 tracts in Cuyahoga Falls, OH
| Private Mortgage Insurance Companies Aggregated Statistics For Year 2009 (Based on 7 full and 4 partial tracts) | ||||||
| A) Conventional Home Purchase Loans | B) Refinancings | C) Non-occupant Loans on < 5 Family Dwellings (A & B) | ||||
|---|---|---|---|---|---|---|
| Number | Average Value | Number | Average Value | Number | Average Value | |
| LOANS ORIGINATED | 35 | $136,170 | 19 | $167,384 | 1 | $344,730 |
| APPLICATIONS APPROVED, NOT ACCEPTED | 12 | $171,381 | 14 | $168,041 | 0 | $0 |
| APPLICATIONS DENIED | 10 | $118,698 | 8 | $222,761 | 0 | $0 |
| APPLICATIONS WITHDRAWN | 1 | $80,000 | 5 | $179,068 | 0 | $0 |
| FILES CLOSED FOR INCOMPLETENESS | 3 | $105,013 | 1 | $98,000 | 0 | $0 |
2002 - 2018 National Fire Incident Reporting System (NFIRS) incidents
- Fire incident types reported to NFIRS in Cuyahoga Falls, OH
- 1,39654.5%Structure Fires
- 77230.1%Outside Fires
- 38114.9%Mobile Property/Vehicle Fires
- 130.5%Other
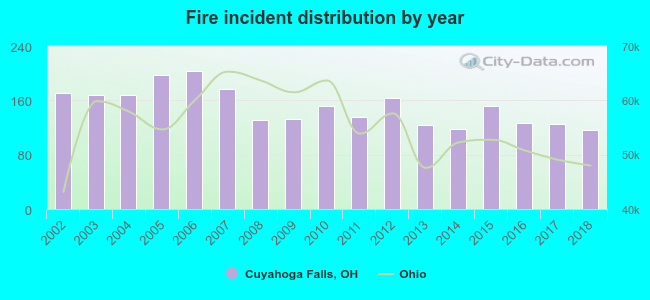 Based on the data from the years 2002 - 2018 the average number of fire incidents per year is 151. The highest number of reported fire incidents - 203 took place in 2006, and the least - 117 in 2018. The data has a decreasing trend.
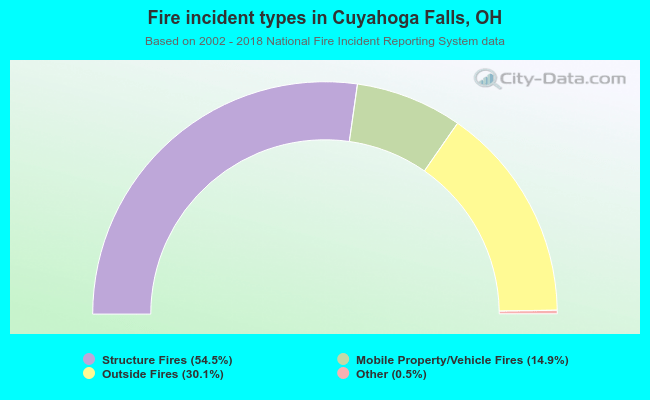 When looking into fire subcategories, the most reports belonged to: Structure Fires (54.5%), and Outside Fires (30.1%).
| Most common first names in Cuyahoga Falls, OH among deceased individuals | ||
| Name | Count | Lived (average) |
|---|---|---|
| Mary | 482 | 80.6 years |
| John | 427 | 75.6 years |
| William | 371 | 75.5 years |
| Robert | 347 | 72.1 years |
| James | 280 | 72.6 years |
| Charles | 235 | 76.2 years |
| Helen | 228 | 81.3 years |
| Margaret | 202 | 79.2 years |
| Joseph | 198 | 76.1 years |
| George | 175 | 75.7 years |
| Most common last names in Cuyahoga Falls, OH among deceased individuals | ||
| Last name | Count | Lived (average) |
|---|---|---|
| Smith | 155 | 75.0 years |
| Miller | 103 | 76.9 years |
| Williams | 88 | 75.0 years |
| Jones | 74 | 75.3 years |
| Johnson | 74 | 76.2 years |
| Davis | 61 | 75.1 years |
| Thomas | 54 | 77.8 years |
| Brown | 51 | 76.1 years |
| Moore | 49 | 75.8 years |
| Clark | 48 | 79.2 years |
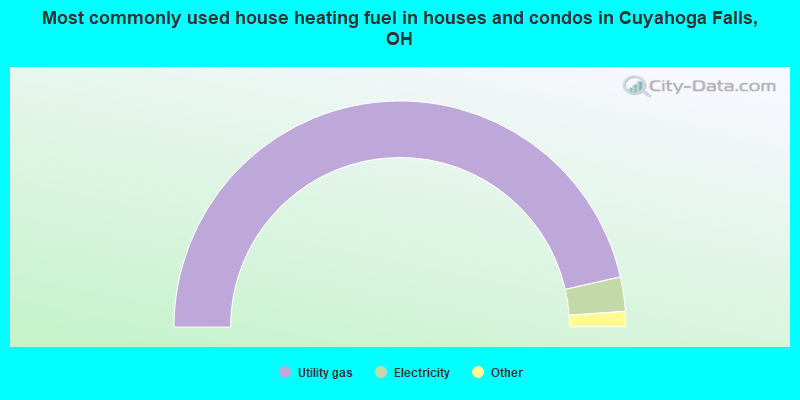
- 92.9%Utility gas
- 4.9%Electricity
- 1.3%Bottled, tank, or LP gas
- 0.4%Fuel oil, kerosene, etc.
- 0.3%Other fuel
- 0.1%Wood
- 0.1%No fuel used
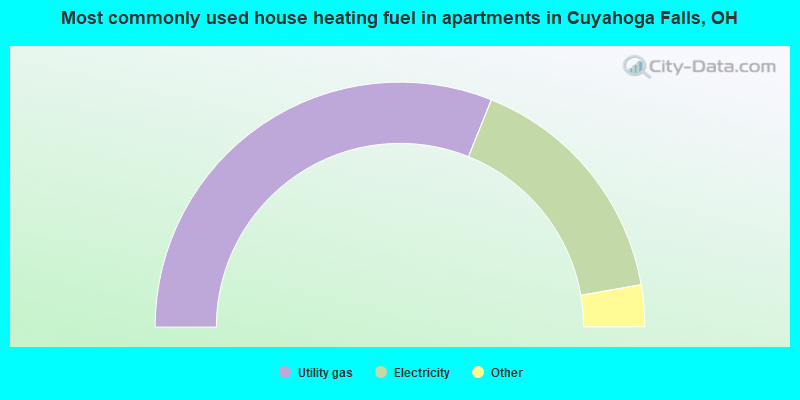
- 62.2%Utility gas
- 32.3%Electricity
- 3.9%Bottled, tank, or LP gas
- 0.9%No fuel used
- 0.4%Wood
- 0.1%Other fuel
- 0.1%Fuel oil, kerosene, etc.
Cuyahoga Falls compared to Ohio state average:
- Unemployed percentage significantly below state average.
- Black race population percentage below state average.
- Foreign-born population percentage above state average.
- Length of stay since moving in significantly above state average.
- Percentage of population with a bachelor's degree or higher above state average.

|
|
Total of 451 patent applications in 2008-2024.