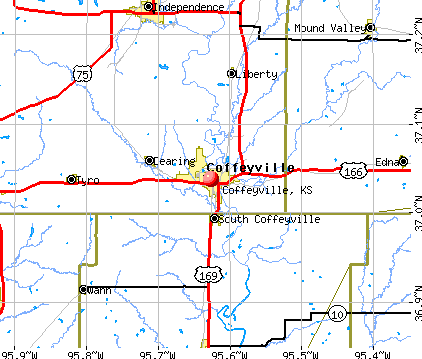
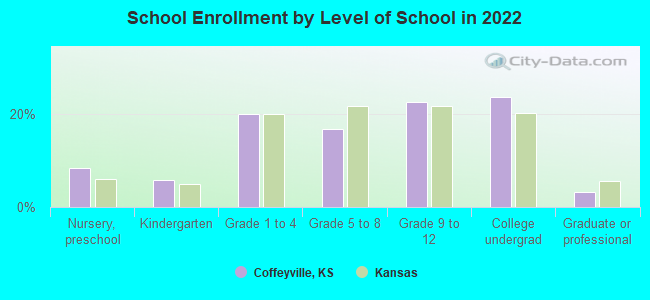
Coffeyville, Kansas
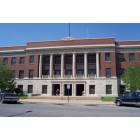
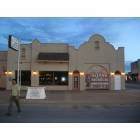
Coffeyville: Municipal Building - Taken April 2006
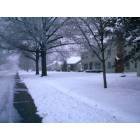
Coffeyville: first storm of 2006
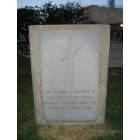
Coffeyville: Coffeyville Memorial
Coffeyville: Coffeyville Memorial
Coffeyville: Dalton Museum

Coffeyville
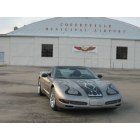
Coffeyville: Coffeyville Municipal Airport
- add
your


Submit your own pictures of this city and show them to the world
- OSM Map
- General Map
- Google Map
- MSN Map
Population change since 2000: -21.2%
 |
| Males: 4,311 | |
| Females: 4,379 |
| Median resident age: | 41.6 years |
| Kansas median age: | 37.6 years |
Zip codes: 67337.
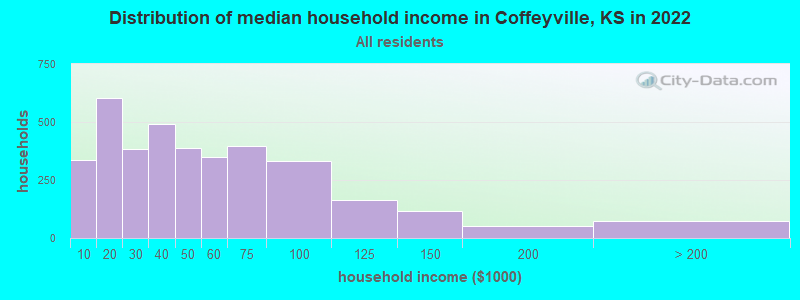
| Coffeyville: | $40,734 |
| KS: | $68,925 |
Estimated per capita income in 2022: $23,941 (it was $15,182 in 2000)
Coffeyville city income, earnings, and wages data
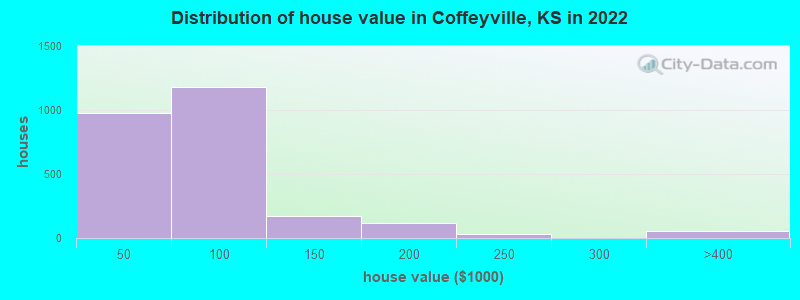
Estimated median house or condo value in 2022: $63,410 (it was $36,000 in 2000)
| Coffeyville: | $63,410 |
| KS: | $206,600 |
Median gross rent in 2022: $723.
(21.1% for White Non-Hispanic residents, 27.5% for Black residents, 17.5% for Hispanic or Latino residents, 47.6% for American Indian residents, 39.2% for other race residents, 18.7% for two or more races residents)
Detailed information about poverty and poor residents in Coffeyville, KS
Compare current foreclosures near Coffeyville, KS:
| Photo | Address | Area | Beds / Baths | Price | Details |
|---|---|---|---|---|---|

|
#1
W 3rd St
Coffeyville, KS 67337
|
1,092 sq. feet
|
1 baths 2 beds |
$83,000
|
show details |

|
#2
Cr 3000
Coffeyville, KS 67337
|
1,952 sq. feet
|
2 baths 3 beds |
show details | |

|
#3
Morning Ln
Coffeyville, KS 67337
|
2,208 sq. feet
|
2 baths 4 beds |
show details | |

|
#4
Spruce St
Coffeyville, KS 67337
|
2,072 sq. feet
|
1 baths 3 beds |
show details | |

|
#5
W 3rd St
Coffeyville, KS 67337
|
1,221 sq. feet
|
1 baths 3 beds |
show details | |

|
#6
W 1st St
Coffeyville, KS 67337
|
792 sq. feet
|
1 baths 2 beds |
show details | |

|
#7
Cr 1250
Coffeyville, KS 67337
|
1,440 sq. feet
|
2 baths 3 beds |
show details | |

|
#8
County Road 3000
Coffeyville, KS 67337
|
1,952 sq. feet
|
2 baths 3 beds |
show details | |

|
#9
Morning Ln # 2
Coffeyville, KS 67337
|
2,208 sq. feet
|
2 baths 4 beds |
show details | |

|
#10
Cr 3000 Cm
Coffeyville, KS 67337
|
1,952 sq. feet
|
2 baths 3 beds |
show details |
| Photo | Address | Area | Beds / Baths | Price | Details |
|---|---|---|---|---|---|

|
#11
Lewark St Apt 1-C5
Coffeyville, KS 67337
|
- sq. feet
|
- baths - beds |
show details | |

|
#12
W 2nd St
Coffeyville, KS 67337
|
- sq. feet
|
- baths - beds |
show details | |

|
#13
N Cline Rd
Coffeyville, KS 67337
|
- sq. feet
|
- baths - beds |
show details | |

|
#14
N Edgewood Dr # 300012
Coffeyville, KS 67337
|
- sq. feet
|
- baths - beds |
show details | |

|
#15
Cr 1675
Coffeyville, KS 67337
|
- sq. feet
|
- baths - beds |
show details | |

|
#16
N Edgewood Dr
Coffeyville, KS 67337
|
- sq. feet
|
- baths - beds |
show details | |

|
#17
E 5th St
Cherryvale, KS 67335
|
768 sq. feet
|
1 baths 2 beds |
show details | |

|
#18
E 3rd St
Cherryvale, KS 67335
|
- sq. feet
|
- baths - beds |
$29,900
|
show details |

|
#19
W 300 Rd
Wann, OK 74083
|
1,523 sq. feet
|
1 baths 3 beds |
show details | |

|
#20
N 11th St
Independence, KS 67301
|
1,186 sq. feet
|
1 baths 2 beds |
show details |
| Photo | Address | Area | Beds / Baths | Price | Details |
|---|---|---|---|---|---|

|
#21
N 17th Pl
Independence, KS 67301
|
1,440 sq. feet
|
2 baths 3 beds |
show details | |

|
#22
S 24th St Lot 1
Independence, KS 67301
|
- sq. feet
|
- baths - beds |
show details | |

|
#23
N 13th St
Independence, KS 67301
|
- sq. feet
|
- baths - beds |
show details | |

|
#24
W Laurel St Lot 14
Independence, KS 67301
|
- sq. feet
|
- baths - beds |
show details | |

|
#25
Cr 5700
Cherryvale, KS 67335
|
- sq. feet
|
- baths - beds |
show details | |

|
#26
Cr 5000
Cherryvale, KS 67335
|
- sq. feet
|
- baths - beds |
show details | |

|
Check over 1 million property listings on Foreclosure.com!
|
browse all offers | |||


- 5,36060.6%White alone
- 1,53517.4%Hispanic
- 8599.7%Black alone
- 7208.1%Two or more races
- 3013.4%American Indian alone
- 410.5%Asian alone
- 410.5%Other race alone
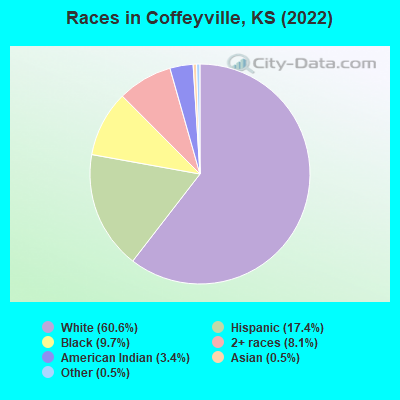
Races in Coffeyville detailed stats: ancestries, foreign born residents, place of birth
According to our research of Kansas and other state lists, there were 64 registered sex offenders living in Coffeyville, Kansas as of May 13, 2024.
The ratio of all residents to sex offenders in Coffeyville is 154 to 1.
Type |
2009 |
2010 |
2011 |
2012 |
2013 |
2014 |
2015 |
2016 |
2017 |
2018 |
2019 |
2020 |
2021 |
2022 |
|---|---|---|---|---|---|---|---|---|---|---|---|---|---|---|
| Murders (per 100,000) | 2 (19.5) | 0 (0.0) | 0 (0.0) | 0 (0.0) | 0 (0.0) | 0 (0.0) | 0 (0.0) | 0 (0.0) | 3 (31.8) | 0 (0.0) | 1 (10.8) | 1 (10.9) | 2 (22.1) | 2 (22.8) |
| Rapes (per 100,000) | 8 (78.2) | 7 (68.0) | 4 (38.6) | 8 (78.5) | 10 (101.0) | 9 (91.2) | 7 (71.6) | 6 (62.8) | 4 (42.4) | 9 (96.0) | 10 (108.0) | 10 (109.0) | 6 (66.2) | 2 (22.8) |
| Robberies (per 100,000) | 6 (58.6) | 12 (116.6) | 8 (77.2) | 12 (117.8) | 6 (60.6) | 11 (111.4) | 6 (61.3) | 5 (52.3) | 4 (42.4) | 5 (53.3) | 5 (54.0) | 8 (87.2) | 5 (55.2) | 3 (34.1) |
| Assaults (per 100,000) | 43 (420.1) | 64 (621.7) | 74 (714.3) | 90 (883.3) | 85 (858.4) | 90 (911.6) | 48 (490.7) | 72 (753.5) | 37 (392.7) | 44 (469.3) | 44 (475.2) | 38 (414.3) | 49 (540.5) | 45 (512.1) |
| Burglaries (per 100,000) | 142 (1,387) | 136 (1,321) | 142 (1,371) | 130 (1,276) | 175 (1,767) | 202 (2,046) | 200 (2,045) | 149 (1,559) | 108 (1,146) | 108 (1,152) | 69 (745.1) | 169 (1,843) | 44 (485.3) | 22 (250.3) |
| Thefts (per 100,000) | 291 (2,843) | 360 (3,497) | 408 (3,938) | 388 (3,808) | 437 (4,413) | 519 (5,257) | 409 (4,181) | 411 (4,301) | 332 (3,523) | 342 (3,648) | 234 (2,527) | 292 (3,184) | 224 (2,471) | 267 (3,038) |
| Auto thefts (per 100,000) | 9 (87.9) | 13 (126.3) | 15 (144.8) | 15 (147.2) | 25 (252.5) | 30 (303.9) | 18 (184.0) | 34 (355.8) | 21 (222.9) | 22 (234.7) | 22 (237.6) | 23 (250.8) | 24 (264.7) | 16 (182.1) |
| Arson (per 100,000) | 4 (39.1) | 4 (38.9) | 2 (19.3) | 6 (58.9) | 4 (40.4) | 3 (30.4) | 1 (10.2) | 5 (52.3) | 3 (31.8) | 0 (0.0) | 5 (54.0) | 5 (54.5) | 1 (11.0) | 1 (11.4) |
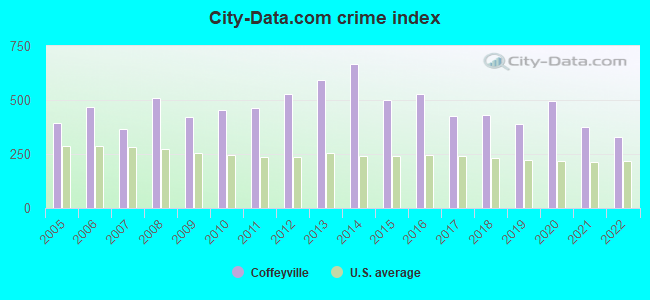
| City-Data.com crime index | 421.1 | 456.1 | 462.0 | 528.2 | 591.1 | 666.5 | 498.9 | 526.3 | 427.9 | 432.0 | 391.5 | 494.5 | 375.7 | 330.0 |
The City-Data.com crime index weighs serious crimes and violent crimes more heavily. Higher means more crime, U.S. average is 246.1. It adjusts for the number of visitors and daily workers commuting into cities.
Crime rate in Coffeyville detailed stats: murders, rapes, robberies, assaults, burglaries, thefts, arson
Full-time law enforcement employees in 2021, including police officers: 32 (23 officers - 20 male; 3 female).
| Officers per 1,000 residents here: | 2.54 |
| Kansas average: | 2.70 |
 Recent articles from our blog. Our writers, many of them Ph.D. graduates or candidates, create easy-to-read articles on a wide variety of topics.


 | Governor Announces Tesla Battery Factory Coming (2 replies) |
| Is Fredonia, Kansas a good place to live? (6 replies) |
| A song I listen to while driving through Kansas (129 replies) |
| Anyone familiar with Independence KS? (35 replies) |
| Kansas Job Losses (390 replies) |
| If You Live In KS and Pay Property Tax (25 replies) |
Latest news from Coffeyville, KS collected exclusively by city-data.com from local newspapers, TV, and radio stations
Ancestries: American (15.3%), Irish (9.3%), German (9.2%), English (6.1%), Scottish (3.4%), European (2.6%).
Current Local Time: CST time zone
Incorporated on 03/1873
Elevation: 736 feet
Land area: 7.06 square miles.
Population density: 1,232 people per square mile (low).
377 residents are foreign born (3.3% Latin America, 0.5% Asia).
| This city: | 4.3% |
| Kansas: | 7.1% |
Median real estate property taxes paid for housing units with mortgages in 2022: $1,638 (1.9%)
Median real estate property taxes paid for housing units with no mortgage in 2022: $851 (1.7%)
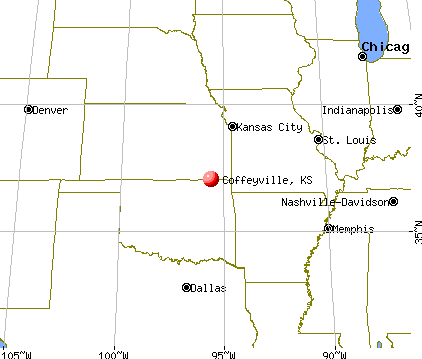
Nearest city with pop. 50,000+: Tulsa, OK  (65.0 miles , pop. 393,049).
Nearest city with pop. 1,000,000+: Dallas, TX (300.4 miles , pop. 1,188,580).
Nearest cities:
), ), Latitude: 37.04 N, Longitude: 95.63 W
Daytime population change due to commuting: +1,963 (+22.2%)
Workers who live and work in this city: 2,201 (64.6%)
Area code: 620

Coffeyville, Kansas accommodation & food services, waste management - Economy and Business Data
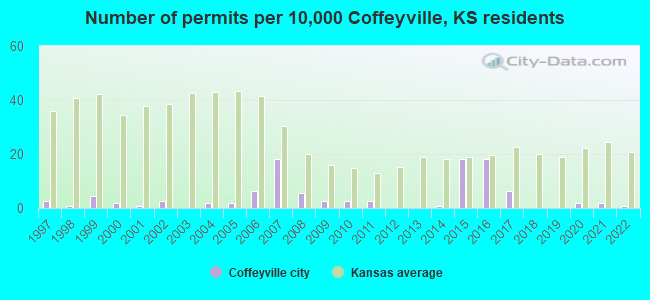
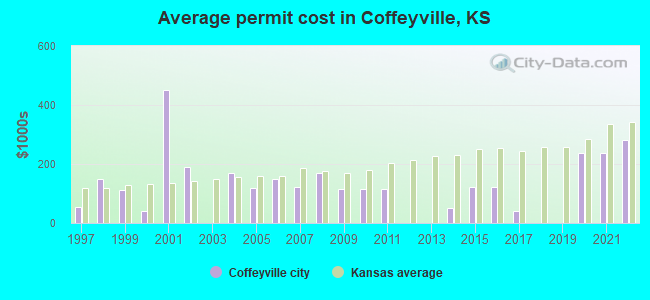
Single-family new house construction building permits:
- 2022: 1 building, cost: $280,000
- 2021: 2 buildings, average cost: $237,700
- 2020: 2 buildings, average cost: $237,700
- 2017: 7 buildings, average cost: $38,600
- 2016: 20 buildings, average cost: $122,700
- 2015: 20 buildings, average cost: $122,700
- 2014: 1 building, cost: $50,000
- 2011: 3 buildings, average cost: $114,700
- 2010: 3 buildings, average cost: $114,700
- 2009: 3 buildings, average cost: $114,700
- 2008: 6 buildings, average cost: $168,700
- 2007: 20 buildings, average cost: $122,100
- 2006: 7 buildings, average cost: $148,100
- 2005: 2 buildings, average cost: $117,500
- 2004: 2 buildings, average cost: $167,500
- 2002: 3 buildings, average cost: $190,000
- 2001: 1 building, cost: $450,000
- 2000: 2 buildings, average cost: $39,000
- 1999: 5 buildings, average cost: $111,000
- 1998: 1 building, cost: $150,000
- 1997: 3 buildings, average cost: $55,000
| Here: | 2.1% |
| Kansas: | 2.0% |
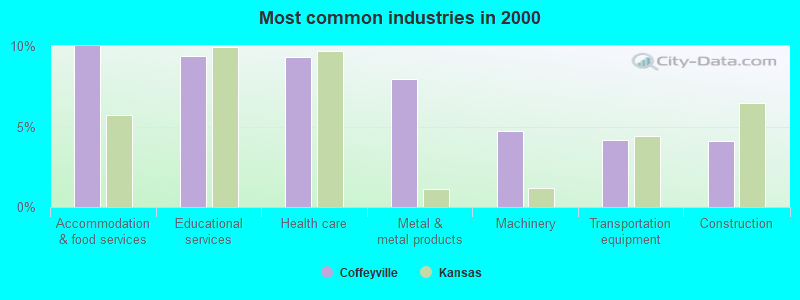
- Accommodation & food services (10.0%)
- Educational services (9.4%)
- Health care (9.3%)
- Metal & metal products (8.0%)
- Machinery (4.7%)
- Transportation equipment (4.2%)
- Construction (4.1%)
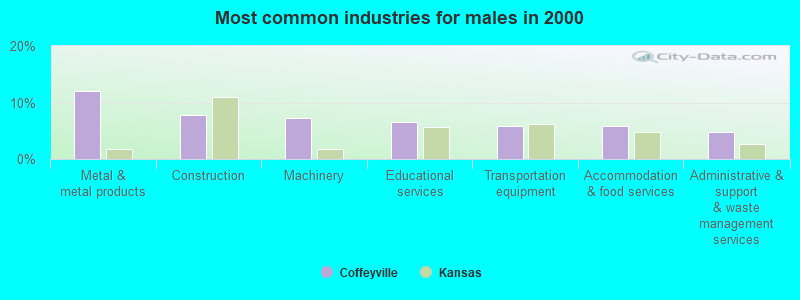
- Metal & metal products (12.0%)
- Construction (7.7%)
- Machinery (7.2%)
- Educational services (6.5%)
- Transportation equipment (5.9%)
- Accommodation & food services (5.8%)
- Administrative & support & waste management services (4.7%)
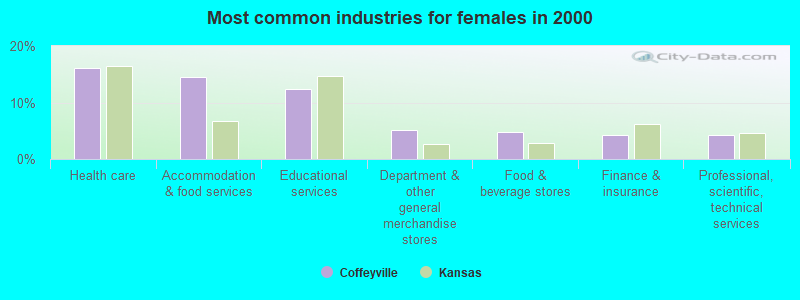
- Health care (16.1%)
- Accommodation & food services (14.5%)
- Educational services (12.4%)
- Department & other general merchandise stores (5.1%)
- Food & beverage stores (4.8%)
- Finance & insurance (4.3%)
- Professional, scientific, technical services (4.3%)
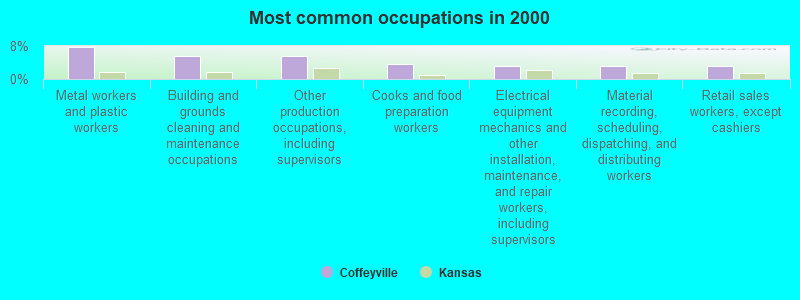
- Metal workers and plastic workers (7.8%)
- Building and grounds cleaning and maintenance occupations (5.6%)
- Other production occupations, including supervisors (5.6%)
- Cooks and food preparation workers (3.6%)
- Electrical equipment mechanics and other installation, maintenance, and repair workers, including supervisors (3.2%)
- Material recording, scheduling, dispatching, and distributing workers (3.1%)
- Retail sales workers, except cashiers (3.0%)
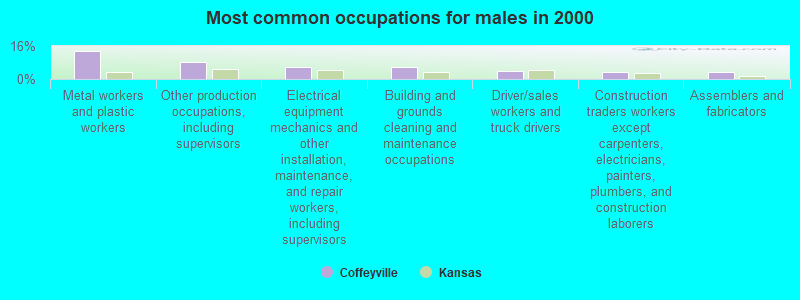
- Metal workers and plastic workers (13.6%)
- Other production occupations, including supervisors (8.1%)
- Electrical equipment mechanics and other installation, maintenance, and repair workers, including supervisors (6.0%)
- Building and grounds cleaning and maintenance occupations (5.6%)
- Driver/sales workers and truck drivers (3.9%)
- Construction traders workers except carpenters, electricians, painters, plumbers, and construction laborers (3.5%)
- Assemblers and fabricators (3.3%)
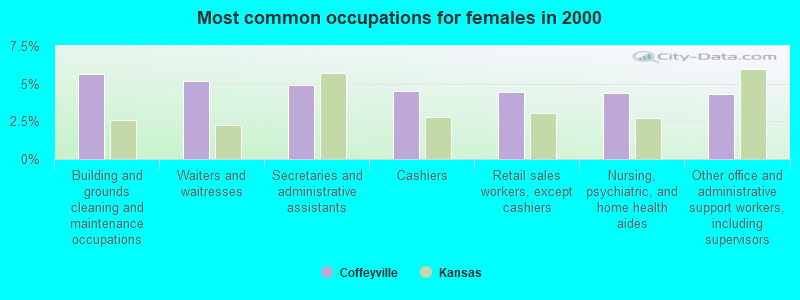
- Building and grounds cleaning and maintenance occupations (5.6%)
- Waiters and waitresses (5.2%)
- Secretaries and administrative assistants (4.9%)
- Cashiers (4.5%)
- Retail sales workers, except cashiers (4.4%)
- Nursing, psychiatric, and home health aides (4.4%)
- Other office and administrative support workers, including supervisors (4.3%)
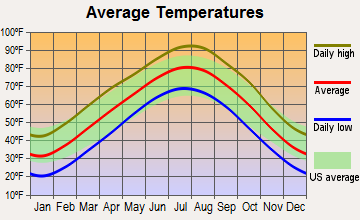
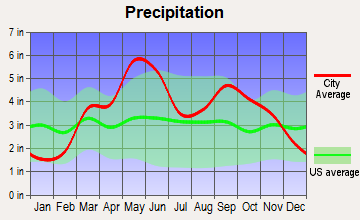
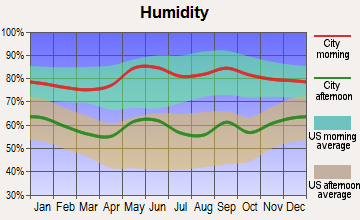
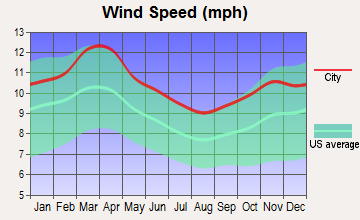
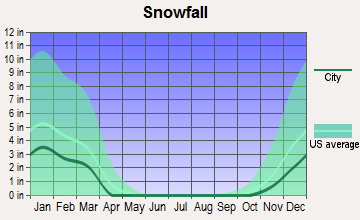
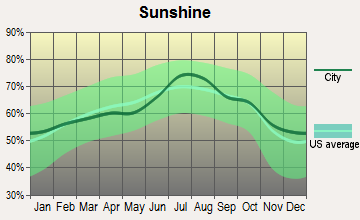
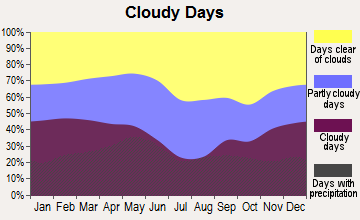
Average climate in Coffeyville, Kansas
Based on data reported by over 4,000 weather stations
|
|

(lower is better)
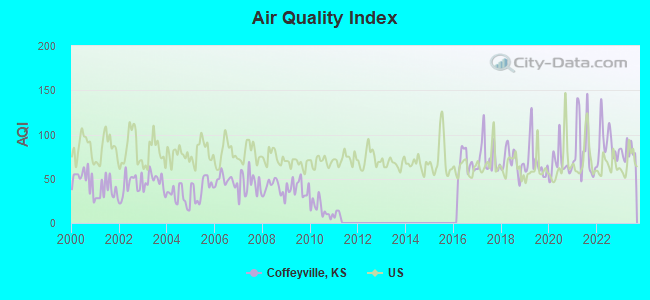
Air Quality Index (AQI) level in 2023 was 81.1. This is about average.
| City: | 81.1 |
| U.S.: | 72.6 |
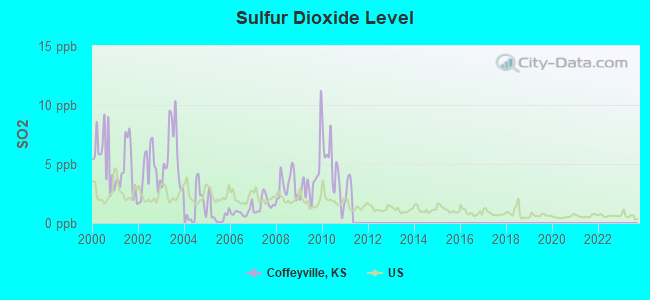
Sulfur Dioxide (SO2) [ppb] level in 2010 was 4.44. This is significantly worse than average. Closest monitor was 0.5 miles away from the city center.
| City: | 4.44 |
| U.S.: | 1.51 |
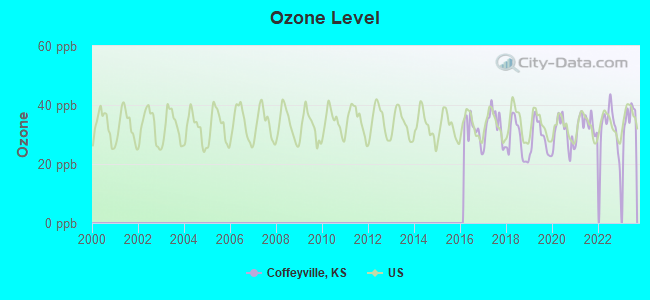
Ozone [ppb] level in 2023 was 36.3. This is about average. Closest monitor was 1.3 miles away from the city center.
| City: | 36.3 |
| U.S.: | 33.3 |
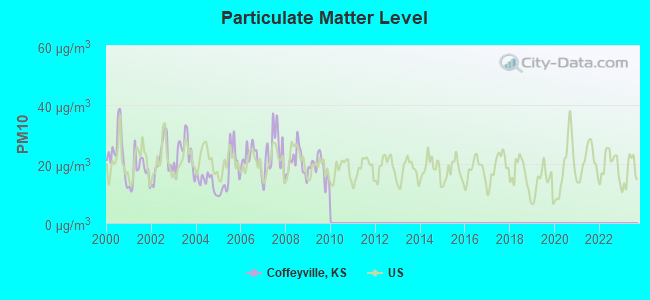
Particulate Matter (PM10) [µg/m3] level in 2009 was 18.8. This is about average. Closest monitor was 1.0 miles away from the city center.
| City: | 18.8 |
| U.S.: | 19.2 |
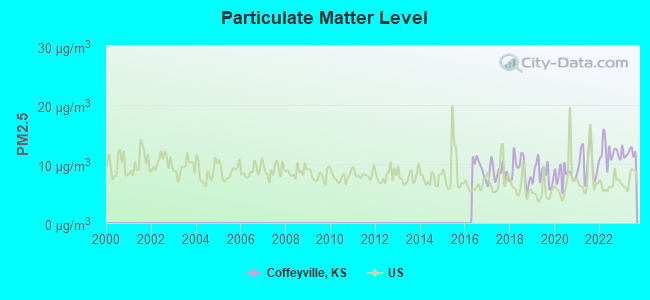
Particulate Matter (PM2.5) [µg/m3] level in 2023 was 12.0. This is significantly worse than average. Closest monitor was 8.3 miles away from the city center.
| City: | 12.0 |
| U.S.: | 8.1 |
Tornado activity:
Coffeyville-area historical tornado activity is slightly above Kansas state average. It is 113% greater than the overall U.S. average.
On 9/27/1959, a category F4 (max. wind speeds 207-260 mph) tornado 24.5 miles away from the Coffeyville city center killed one person and injured one person and caused between $5000 and $50,000 in damages.
On 5/10/2008, a category F4 tornado 27.0 miles away from the city center killed 21 people and injured 350 people and caused $61 million in damages.
Earthquake activity:
Coffeyville-area historical earthquake activity is significantly above Kansas state average. It is 752% greater than the overall U.S. average.On 9/3/2016 at 12:02:44, a magnitude 5.8 (5.8 MW, Depth: 3.5 mi, Class: Moderate, Intensity: VI - VII) earthquake occurred 83.7 miles away from Coffeyville center
On 11/6/2011 at 03:53:10, a magnitude 5.7 (5.7 MW, Depth: 3.2 mi) earthquake occurred 122.0 miles away from Coffeyville center
On 11/7/2016 at 01:44:24, a magnitude 5.0 (5.0 MW, Depth: 2.8 mi) earthquake occurred 97.6 miles away from Coffeyville center
On 11/12/2014 at 21:40:00, a magnitude 4.9 (4.9 MW, Depth: 2.5 mi, Class: Light, Intensity: IV - V) earthquake occurred 111.1 miles away from Coffeyville center
On 2/13/2016 at 17:07:06, a magnitude 5.1 (5.1 MW, Depth: 5.2 mi) earthquake occurred 175.0 miles away from Coffeyville center
On 11/5/2011 at 07:12:45, a magnitude 4.8 (4.8 MW, Depth: 1.9 mi) earthquake occurred 120.9 miles away from Coffeyville center
Magnitude types: moment magnitude (MW)
Natural disasters:
The number of natural disasters in Montgomery County (13) is near the US average (15).Major Disasters (Presidential) Declared: 9
Emergencies Declared: 2
Causes of natural disasters: Floods: 8, Storms: 8, Tornadoes: 4, Winds: 4, Winter Storms: 2, Hurricane: 1, Ice Storm: 1, Landslide: 1, Mudslide: 1, Snowstorm: 1, Other: 1 (Note: some incidents may be assigned to more than one category).
Hospitals and medical centers in Coffeyville:
Airports and heliports located in Coffeyville:
- Coffeyville Municipal Airport (CFV) (Runways: 2, Itinerant Ops: 650, Local Ops: 550, Military Ops: 10)
- Coffeyville Regional Medical Center Heliport (9KS0)
College/University in Coffeyville:
Colleges/universities with over 2000 students nearest to Coffeyville:
- Northeastern Oklahoma A&M College (about 44 miles; Miami, OK; Full-time enrollment: 2,075)
- Rogers State University (about 50 miles; Claremore, OK; FT enrollment: 3,482)
- Pittsburg State University (about 57 miles; Pittsburg, KS; FT enrollment: 6,838)
- Allen County Community College (about 64 miles; Iola, KS; FT enrollment: 2,089)
- University of Tulsa (about 64 miles; Tulsa, OK; FT enrollment: 3,702)
- Missouri Southern State University (about 65 miles; Joplin, MO; FT enrollment: 4,456)
- Tulsa Community College (about 67 miles; Tulsa, OK; FT enrollment: 12,480)
Public high school in Coffeyville:
- FIELD KINDLEY HIGH (Students: 618, Location: 1110 W 8TH, Grades: 9-12)
Public elementary/middle schools in Coffeyville:
- COMMUNITY ELEMENTARY (Students: 1,010, Location: 102 S. CLINE, Grades: PK-6)
- ROOSEVELT MIDDLE (Students: 281, Location: 1000 W 8TH, Grades: 7-8)
Private elementary/middle school in Coffeyville:
Points of interest:
Notable locations in Coffeyville: Veterans Memorial Stadium (A), Coffeyville Aquatic Center (B), Hillcrest Country Club (C), Bartlett Milling Company Grain Elevator Number 1 (D), Walter Johnson Park Rodeo Arena (E), Coffeyville Police Department (F), Montgomery County District Court Coffeyville (G), Coffeyville Aviation Heritage Museum (H), Dalton Museum (I), Brown Mansion (J), Coffeyville Public Library (K), Coffeyville City Hall (L), Coffeyville City Public Works (M), Coffeyville Fire Department (N), Montgomery County Health Department (O), Sycamore Landing (P), Pioneer Kansas American Red Cross (Q). Display/hide their locations on the map
Shopping Centers: Eight Street Shopping Center (1), Fourth Street Shopping Center (2). Display/hide their locations on the map
Churches in Coffeyville include: Amazing Grace Chapel (A), Bethel African Methodist Episcopal Church (B), Bible Baptist Church (C), Calvary Baptist Church (D), Central Church of the Nazarene (E), Church of Christ (F), Church of God in Christ (G), First Assembly of God Church (H), First Baptist Church (I). Display/hide their locations on the map
Cemeteries: Elmwood Cemetery (1), Fairview Cemetery (2), Calvary Cemetery (3), Restlawn Memorial Park Cemetery (4). Display/hide their locations on the map
Park in Coffeyville: Pfister Park (1). Display/hide its location on the map
Tourist attraction: CEO.nline (511 Penn Street).
Hotels: Townsman Inn (600 Northeast Street), Best Western Bricktown Lodge (605 Northeast Street), Schwinn Motel (1005 East 8th Street), Regal Inn (1215 E 3rd St), Budget Inn (1204 East 5th Street), Apple Tree Inn (820 East 11th Street), Super 8 Motel (104 West 11th Street).
Courts: District Court Jury Call in System (City Hall), Kansas-State - City Hall-Coffeyville- Clerk Of District Court- City (City Hall), Montgomery-County - District Court Judge- Administrative District J (City Hall).
Birthplace of: William Mueller - Professional wrestler, Gary S. Paxton - Country musician, Paul Des Jardien - Football and baseball player, Bobby Barth - Singer-songwriter, Micky Axton - Female aviator, Mildred Burke - Professional wrestler, Ron Kenoly - Worship leader, W. Ann Reynolds - Zoologist, Dave Baker - Football player, James Grauerholz - Book editor.
Drinking water stations with addresses in Coffeyville and their reported violations in the past:
COFFEYVILLE, CITY OF (Population served: 9,993, Surface water):Past monitoring violations:LABETTE CO RWD 6 (Population served: 1,550, Purch surface water):
- Treatment Technique Precursor Removal - Between JAN-2006 and MAR-2006, Contaminant: CARBON, TOTAL. Follow-up actions: St Public Notif requested (MAY-12-2006), St Violation/Reminder Notice (MAY-12-2006), St Public Notif received (JUN-28-2006), St Compliance achieved (JUL-31-2006)
- Treatment Technique Precursor Removal - Between OCT-2005 and DEC-2005, Contaminant: CARBON, TOTAL. Follow-up actions: St Public Notif requested (JAN-31-2006), St Violation/Reminder Notice (JAN-31-2006), St Public Notif received (MAR-06-2006), St Compliance achieved (JUL-31-2006)
Past health violations:Past monitoring violations:
- MCL, Monthly (TCR) - In SEP-2013, Contaminant: Coliform. Follow-up actions: St Public Notif requested (SEP-20-2013), St Violation/Reminder Notice (SEP-20-2013), St Public Notif received (OCT-04-2013)
- MCL, Monthly (TCR) - In SEP-2008, Contaminant: Coliform. Follow-up actions: St Public Notif requested (SEP-12-2008), St Violation/Reminder Notice (SEP-12-2008), St Public Notif received (OCT-06-2008), St Compliance achieved (OCT-31-2008)
- Failure Submit IDSE/Subpart V Plan Rpt - In JAN-02-2010, Contaminant: DBP STAGE 2. Follow-up actions: Fed FAO issued (APR-26-2010), Fed Public Notif requested (APR-26-2010), Fed Compliance achieved (APR-26-2012)
- Monitoring, Routine (IDSE) - Between OCT-2008 and SEP-2009, Contaminant: Total Haloacetic Acids (HAA5). Follow-up actions: Fed FAO issued (APR-26-2010), Fed Public Notif requested (APR-26-2010), Fed Compliance achieved (APR-26-2012)
- Monitoring, Routine (IDSE) - Between OCT-2008 and SEP-2009, Contaminant: TTHM. Follow-up actions: Fed FAO issued (APR-26-2010), Fed Public Notif requested (APR-26-2010), Fed Compliance achieved (APR-26-2012)
| This city: | 2.3 people |
| Kansas: | 2.5 people |
| This city: | 58.1% |
| Whole state: | 66.0% |
| This city: | 6.4% |
| Whole state: | 5.8% |
Likely homosexual households (counted as self-reported same-sex unmarried-partner households)
- Lesbian couples: 0.2% of all households
- Gay men: 0.1% of all households
People in group quarters in Coffeyville in 2010:
- 422 people in college/university student housing
- 182 people in nursing facilities/skilled-nursing facilities
- 5 people in group homes intended for adults
185 people in college dormitories (includes college quarters off campus) in 2000
Banks with branches in Coffeyville (2011 data):
- Condon Bank & Trust: Condon Bank & Trust at 814 Walnut Street, branch established on 1886/09/25; Motor Branch at 601-7 West 8th Street, branch established on 1967/12/01. Info updated 2011/01/07: Bank assets: $97.2 mil, Deposits: $85.6 mil, local headquarters, positive income, 2 total offices, Holding Company: Coffeyville Financial Corporation
- Bank of America, National Association: Coffeyville Plaza Branch at 105 East 9th, branch established on 2001/12/14. Info updated 2009/11/18: Bank assets: $1,451,969.3 mil, Deposits: $1,077,176.8 mil, headquarters in Charlotte, NC, positive income, 5782 total offices, Holding Company: Bank Of America Corporation
- Community State Bank: at 1414 West 11th Street, branch established on 1967/10/02. Info updated 2010/09/29: Bank assets: $60.7 mil, Deposits: $53.5 mil, local headquarters, positive income, Commercial Lending Specialization, 1 total offices, Holding Company: Coffeyville Bancorp, Inc.
- Community National Bank & Trust: Coffeyville Branch at 901 W 11th, branch established on 2002/12/15. Info updated 2011/01/06: Bank assets: $766.3 mil, Deposits: $636.2 mil, headquarters in Chanute, KS, positive income, Commercial Lending Specialization, 25 total offices, Holding Company: Community Bancorp, Inc.
- First Federal Savings and Loan Association of Independence: Coffeyville Branch at 2903 W 9th Street, branch established on 1997/01/10. Info updated 2011/07/21: Bank assets: $168.4 mil, Deposits: $117.8 mil, headquarters in Independence, KS, negative income in the last year, Mortgage Lending Specialization, 5 total offices
For population 15 years and over in Coffeyville:
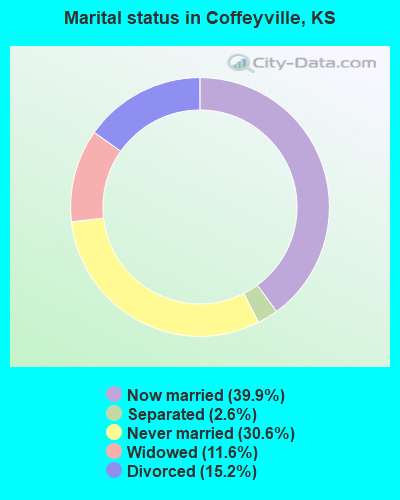
- Never married: 30.6%
- Now married: 39.9%
- Separated: 2.6%
- Widowed: 11.6%
- Divorced: 15.2%
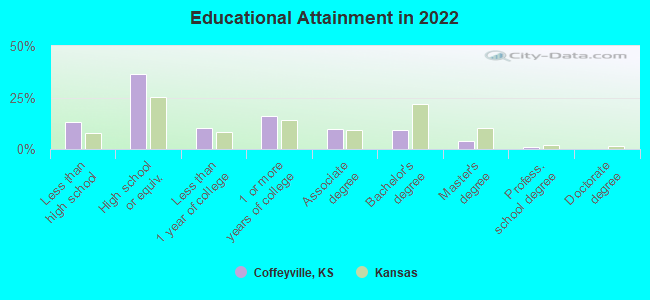
For population 25 years and over in Coffeyville:
- High school or higher: 86.4%
- Bachelor's degree or higher: 14.1%
- Graduate or professional degree: 4.9%
- Unemployed: 5.3%
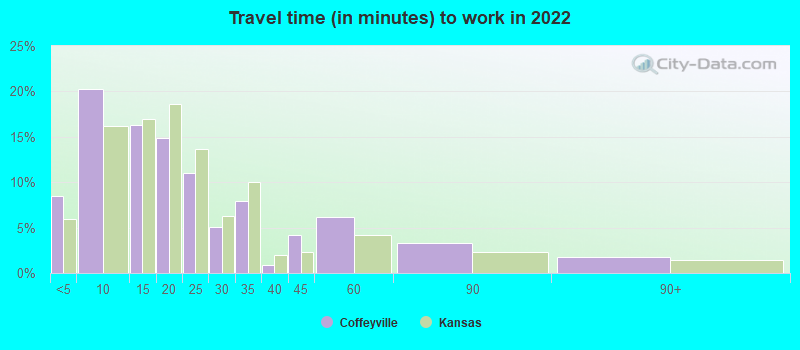
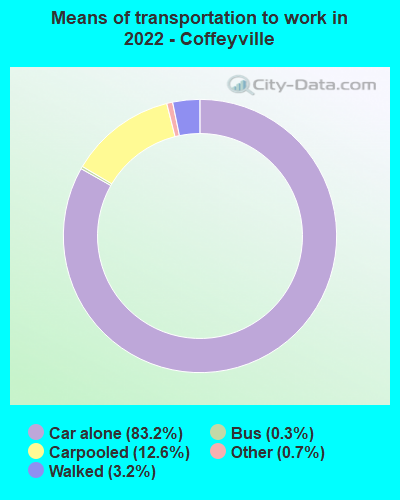
- Mean travel time to work (commute): 15.2 minutes
| Here: | 9.3 |
| Kansas average: | 11.5 |
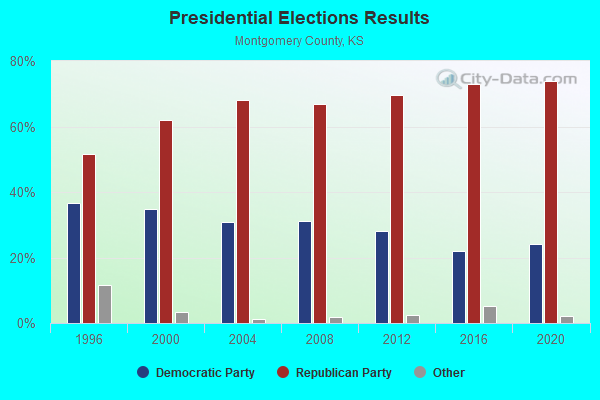
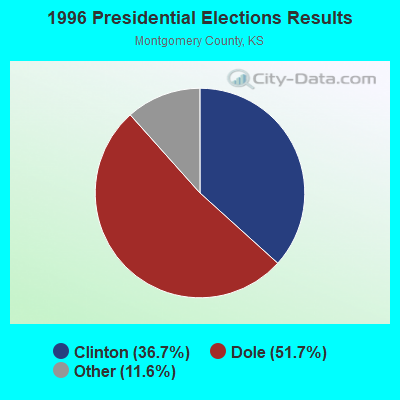
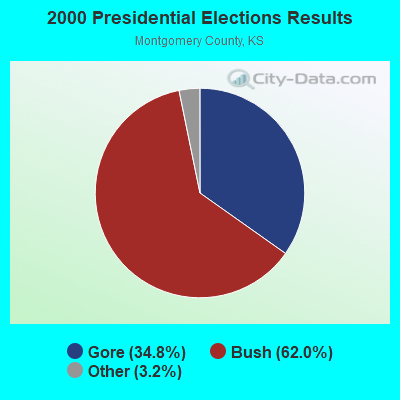

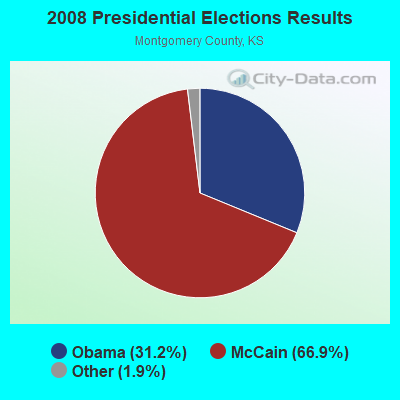

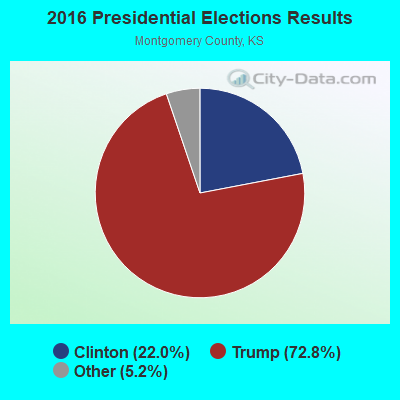
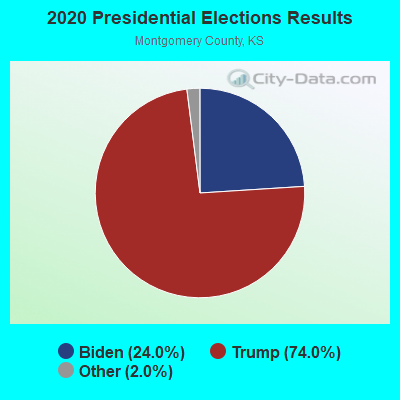
Graphs represent county-level data. Detailed 2008 Election Results
Religion statistics for Coffeyville, KS (based on Montgomery County data)
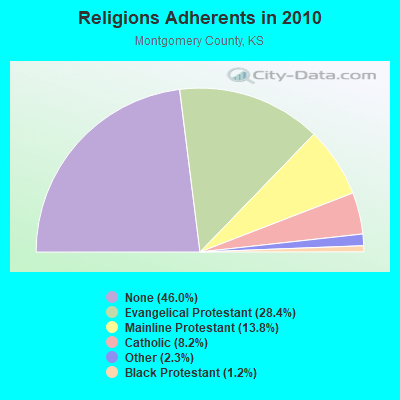
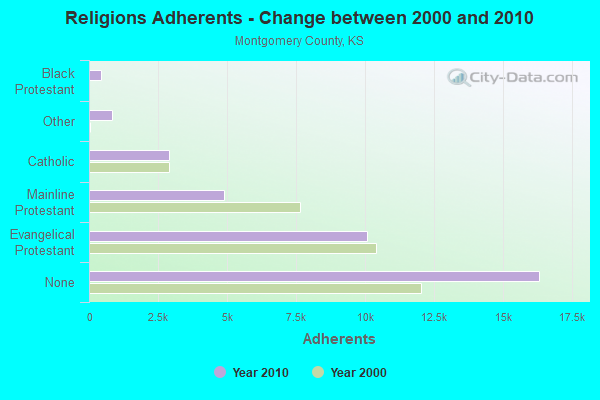
| Religion | Adherents | Congregations |
|---|---|---|
| Evangelical Protestant | 10,083 | 63 |
| Mainline Protestant | 4,904 | 23 |
| Catholic | 2,900 | 4 |
| Other | 826 | 3 |
| Black Protestant | 431 | 6 |
| None | 16,327 | - |
Food Environment Statistics:
| This county: | 1.74 / 10,000 pop. |
| State: | 1.96 / 10,000 pop. |
| This county: | 0.29 / 10,000 pop. |
| Kansas: | 0.20 / 10,000 pop. |
| Montgomery County: | 0.29 / 10,000 pop. |
| Kansas: | 0.51 / 10,000 pop. |
| This county: | 6.38 / 10,000 pop. |
| Kansas: | 3.84 / 10,000 pop. |
| Montgomery County: | 7.84 / 10,000 pop. |
| State: | 7.33 / 10,000 pop. |
| Montgomery County: | 10.1% |
| State: | 8.1% |
| Montgomery County: | 29.6% |
| Kansas: | 27.9% |
| Montgomery County: | 13.8% |
| Kansas: | 13.4% |
Health and Nutrition:
| Coffeyville: | 48.3% |
| State: | 49.2% |
| Coffeyville: | 43.7% |
| Kansas: | 46.3% |
| Coffeyville: | 28.7 |
| Kansas: | 28.6 |
| Coffeyville: | 21.2% |
| Kansas: | 21.2% |
| This city: | 11.6% |
| Kansas: | 10.5% |
| Here: | 6.8 |
| Kansas: | 6.8 |
| Here: | 34.3% |
| Kansas: | 33.5% |
| This city: | 53.0% |
| Kansas: | 56.0% |
| This city: | 76.5% |
| Kansas: | 78.6% |
More about Health and Nutrition of Coffeyville, KS Residents
| Local government employment and payroll (March 2022) | |||||
| Function | Full-time employees | Monthly full-time payroll | Average yearly full-time wage | Part-time employees | Monthly part-time payroll |
|---|---|---|---|---|---|
| Electric Power | 34 | $179,293 | $63,280 | 0 | $0 |
| Police Protection - Officers | 19 | $92,978 | $58,723 | 0 | $0 |
| Firefighters | 18 | $111,979 | $74,653 | 0 | $0 |
| Water Supply | 14 | $53,862 | $46,167 | 0 | $0 |
| Streets and Highways | 13 | $49,677 | $45,856 | 0 | $0 |
| Sewerage | 11 | $42,466 | $46,327 | 0 | $0 |
| Police - Other | 11 | $41,815 | $45,616 | 0 | $0 |
| Financial Administration | 10 | $45,592 | $54,710 | 2 | $941 |
| Other and Unallocable | 7 | $21,365 | $36,626 | 1 | $1,107 |
| Local Libraries | 6 | $14,120 | $28,240 | 4 | $2,809 |
| Parks and Recreation | 4 | $13,055 | $39,165 | 4 | $523 |
| Other Government Administration | 3 | $22,509 | $90,036 | 0 | $0 |
| Housing and Community Development (Local) | 2 | $7,560 | $45,360 | 0 | $0 |
| Judicial and Legal | 1 | $6,706 | $80,472 | 2 | $3,069 |
| Solid Waste Management | 1 | $3,498 | $41,976 | 1 | $639 |
| Airports | 1 | $4,947 | $59,364 | 3 | $3,022 |
| Fire - Other | 1 | $3,077 | $36,924 | 0 | $0 |
| Totals for Government | 156 | $714,497 | $54,961 | 17 | $12,110 |
Coffeyville government finances - Expenditure in 2021 (per resident):
- Construction - Regular Highways: $1,137,000 ($130.84)
- Current Operations - Electric Utilities: $52,706,000 ($6065.13)
General - Other: $4,105,000 ($472.38)
Police Protection: $2,295,000 ($264.10)
Parks and Recreation: $2,249,000 ($258.80)
Local Fire Protection: $2,062,000 ($237.28)
Water Utilities: $1,819,000 ($209.32)
Central Staff Services: $1,175,000 ($135.21)
Sewerage: $957,000 ($110.13)
Solid Waste Management: $568,000 ($65.36)
Libraries: $389,000 ($44.76)
Miscellaneous Commercial Activities - Other: $246,000 ($28.31)
Financial Administration: $49,000 ($5.64)
General Public Buildings: $47,000 ($5.41)
Air Transportation: $30,000 ($3.45)
- Electric Utilities - Interest on Debt: $2,975,000 ($342.35)
- General - Interest on Debt: $362,000 ($41.66)
- Other Capital Outlay - General - Other: $773,000 ($88.95)
Libraries: $529,000 ($60.87)
Electric Utilities: $427,000 ($49.14)
Water Utilities: $184,000 ($21.17)
Miscellaneous Commercial Activities - Other: $90,000 ($10.36)
Local Fire Protection: $67,000 ($7.71)
Parks and Recreation: $28,000 ($3.22)
Sewerage: $23,000 ($2.65)
Police Protection: $15,000 ($1.73)
Central Staff Services: $4,000 ($0.46)
General Public Building: $3,000 ($0.35)
- Total Salaries and Wages: $10,759,000 ($1238.09)
Coffeyville government finances - Revenue in 2021 (per resident):
- Charges - Sewerage: $3,286,000 ($378.14)
Solid Waste Management: $602,000 ($69.28)
Miscellaneous Commercial Activities: $311,000 ($35.79)
Parks and Recreation: $306,000 ($35.21)
Other: $239,000 ($27.50)
- Federal Intergovernmental - Other: $95,000 ($10.93)
Air Transportation: $63,000 ($7.25)
- Local Intergovernmental - Other: $373,000 ($42.92)
Highways: $47,000 ($5.41)
- Miscellaneous - General Revenue - Other: $1,221,000 ($140.51)
Interest Earnings: $243,000 ($27.96)
Fines and Forfeits: $192,000 ($22.09)
Rents: $92,000 ($10.59)
Sale of Property: $64,000 ($7.36)
Special Assessments: $44,000 ($5.06)
Royalties: $21,000 ($2.42)
Donations From Private Sources: $10,000 ($1.15)
- Revenue - Electric Utilities: $58,349,000 ($6714.50)
Water Utilities: $4,172,000 ($480.09)
- State Intergovernmental - Highways: $1,422,000 ($163.64)
General Local Government Support: $78,000 ($8.98)
Other: $3,000 ($0.35)
- Tax - General Sales and Gross Receipts: $5,275,000 ($607.02)
Property: $2,706,000 ($311.39)
Public Utilities Sales: $485,000 ($55.81)
Other License: $106,000 ($12.20)
Coffeyville government finances - Debt in 2021 (per resident):
- Long Term Debt - Beginning Outstanding - Unspecified Public Purpose: $57,363,000 ($6601.04)
Outstanding Unspecified Public Purpose: $41,768,000 ($4806.44)
Retired Unspecified Public Purpose: $15,595,000 ($1794.59)
Outstanding Nonguaranteed - Industrial Revenue: $5,997,000 ($690.10)
Beginning Outstanding - Public Debt for Private Purpose: $5,997,000 ($690.10)
Coffeyville government finances - Cash and Securities in 2021 (per resident):
- Bond Funds - Cash and Securities: $324,000 ($37.28)
- Other Funds - Cash and Securities: $27,884,000 ($3208.75)
- Sinking Funds - Cash and Securities: $7,259,000 ($835.33)
| Businesses in Coffeyville, KS | ||||
| Name | Count | Name | Count | |
|---|---|---|---|---|
| AT&T | 1 | Long John Silver's | 1 | |
| Ace Hardware | 1 | McDonald's | 1 | |
| Arby's | 1 | New Balance | 1 | |
| AutoZone | 1 | Nike | 1 | |
| Best Western | 1 | Pizza Hut | 1 | |
| Blockbuster | 1 | SONIC Drive-In | 1 | |
| Curves | 1 | Sleep Inn | 1 | |
| Days Inn | 1 | Taco Bell | 1 | |
| FedEx | 1 | True Value | 1 | |
| H&R Block | 1 | U-Haul | 1 | |
| KFC | 1 | UPS | 2 | |
| La-Z-Boy | 2 | Walmart | 1 | |
| Lane Furniture | 2 | |||
Strongest AM radio stations in Coffeyville:
- KGGF (690 AM; 10 kW; COFFEYVILLE, KS; Owner: KGGF-KUSN, INC.)
- KRMG (740 AM; 50 kW; TULSA, OK; Owner: CXR HOLDINGS, INC.)
- KFAQ (1170 AM; 50 kW; TULSA, OK; Owner: JOURNAL BROADCAST CORPORATION)
- KTBZ (1430 AM; 25 kW; TULSA, OK; Owner: CLEAR CHANNEL BROADCASTING LICENSES, INC.)
- KMUS (1380 AM; 20 kW; MUSKOGEE, OK; Owner: ABC, INC.)
- KKOW (860 AM; 10 kW; PITTSBURG, KS; Owner: AMERICAN MEDIA INVESTMENTS)
- WHB (810 AM; 50 kW; KANSAS CITY, MO; Owner: UNION BROADCASTING, INC.)
- WMBH (1560 AM; 10 kW; JOPLIN, MO)
- KOMA (1520 AM; 50 kW; OKLAHOMA CITY, OK; Owner: RENDA BROADCASTING CORP. OF NEVADA)
- KBTN (1420 AM; 10 kW; NEOSHO, MO; Owner: PETRACOM OF JOPLIN, L.L.C.)
- KIND (1010 AM; 0 kW; INDEPENDENCE, KS; Owner: CENTRAL BROADCASTING, INC.)
- KOCR (1310 AM; 5 kW; JOPLIN, MO; Owner: OZARK CHRISTIAN COLLEGE)
- KWON (1400 AM; 1 kW; BARTLESVILLE, OK; Owner: KCD ENTERPRISES, INC.)
Strongest FM radio stations in Coffeyville:
- KUSN (98.1 FM; DEARING, KS; Owner: KGGF-KUSN, INC.)
- KKRK (98.9 FM; COFFEYVILLE, KS; Owner: KGGF-KUSN, INC.)
- KQLL-FM (106.1 FM; OWASSO, OK; Owner: CLEAR CHANNEL BROADCASTING LICENSES, INC.)
- KGND (107.5 FM; KETCHUM, OK; Owner: NORTHEAST OKLAHOMA BROADCAST NETWORK)
- KEOJ (101.1 FM; CANEY, KS; Owner: KXOJ, INC.)
- KARF (91.9 FM; INDEPENDENCE, KS; Owner: AMERICAN FAMILY ASSOCIATION)
- KYFM (100.1 FM; BARTLESVILLE, OK; Owner: KCD ENTERPRISES, INC.)
- KGGF-FM (104.1 FM; FREDONIA, KS; Owner: KGGF-KUSN, INC.)
- KBQC (88.5 FM; INDEPENDENCE, KS; Owner: AMERICAN FAMILY ASSOCIATION)
- KRIG-FM (104.9 FM; NOWATA, OK; Owner: KCD ENTERPRISES, INC.)
- KIND-FM (102.9 FM; INDEPENDENCE, KS; Owner: CENTRAL BROADCASTING, INC.)
TV broadcast stations around Coffeyville:
- K54GC (Channel 54; INDEPENDENCE, KS; Owner: TRINITY BROADCASTING NETWORK)
- K04EJ (Channel 4; COFFEYVILLE, KS; Owner: COFFEYVILLE COMMUNITY COLLEGE)
- KDOR (Channel 17; BARTLESVILLE, OK; Owner: TRINITY BROADCASTING NETWORK)
- National Bridge Inventory (NBI) Statistics
- 65Number of bridges
- 1,007ft / 307mTotal length
- $4,210,000Total costs
- 105,173Total average daily traffic
- 18,943Total average daily truck traffic
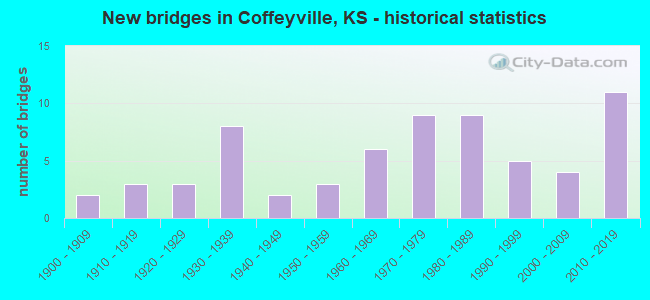
- New bridges - historical statistics
- 21900-1909
- 31910-1919
- 31920-1929
- 81930-1939
- 21940-1949
- 31950-1959
- 61960-1969
- 91970-1979
- 91980-1989
- 51990-1999
- 42000-2009
- 112010-2019
FCC Registered Antenna Towers: 127 (See the full list of FCC Registered Antenna Towers)
FCC Registered Commercial Land Mobile Towers: 4 (See the full list of FCC Registered Commercial Land Mobile Towers in Coffeyville, KS)
FCC Registered Private Land Mobile Towers: 2 (See the full list of FCC Registered Private Land Mobile Towers)
FCC Registered Broadcast Land Mobile Towers: 20 (See the full list of FCC Registered Broadcast Land Mobile Towers)
FCC Registered Microwave Towers: 16 (See the full list of FCC Registered Microwave Towers in this town)
FCC Registered Paging Towers: 3 (See the full list of FCC Registered Paging Towers)
FCC Registered Maritime Coast & Aviation Ground Towers: 2 (See the full list of FCC Registered Maritime Coast & Aviation Ground Towers)
FCC Registered Amateur Radio Licenses: 93 (See the full list of FCC Registered Amateur Radio Licenses in Coffeyville)
FAA Registered Aircraft Manufacturers and Dealers: 1 (See the full list of FAA Registered Manufacturers and Dealers in Coffeyville)
FAA Registered Aircraft: 20 (See the full list of FAA Registered Aircraft)
2003 - 2018 National Fire Incident Reporting System (NFIRS) incidents
- Fire incident types reported to NFIRS in Coffeyville, KS
- 1,05853.2%Outside Fires
- 63231.8%Structure Fires
- 24812.5%Mobile Property/Vehicle Fires
- 502.5%Other
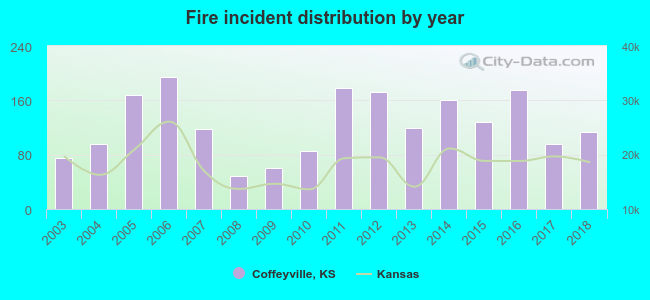 According to the data from the years 2003 - 2018 the average number of fires per year is 124. The highest number of reported fires - 195 took place in 2006, and the least - 48 in 2008. The data has a rising trend.
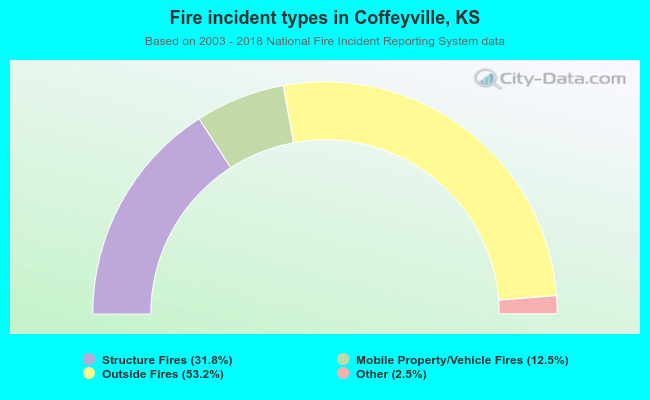 When looking into fire subcategories, the most incidents belonged to: Outside Fires (53.2%), and Structure Fires (31.8%).
Fire-safe hotels and motels in Coffeyville, Kansas:
- Super 8, 104 W 11TH, Coffeyville, Kansas 67337 , Phone: (620) 251-2250
- SureStay Plus by Best Western Hotels Coffeyville, 605 NE St Hwy 166 & 169, Coffeyville, Kansas 67337 , Phone: (620) 251-3700, Fax: (620) 251-3709
- Sleep Inn & Suites Coffeyville, 202 W 11th St, Coffeyville, Kansas 67337 , Phone: (620) 688-6400, Fax: (620) 688-6401
| Most common first names in Coffeyville, KS among deceased individuals | ||
| Name | Count | Lived (average) |
|---|---|---|
| John | 164 | 75.4 years |
| William | 161 | 76.2 years |
| Mary | 147 | 80.1 years |
| James | 116 | 74.6 years |
| Charles | 104 | 74.5 years |
| George | 89 | 76.5 years |
| Robert | 83 | 73.7 years |
| Helen | 63 | 79.4 years |
| Dorothy | 61 | 79.7 years |
| Frank | 56 | 78.4 years |
| Most common last names in Coffeyville, KS among deceased individuals | ||
| Last name | Count | Lived (average) |
|---|---|---|
| Smith | 107 | 78.6 years |
| Miller | 65 | 79.0 years |
| Jones | 62 | 76.5 years |
| Brown | 59 | 77.2 years |
| Johnson | 55 | 74.1 years |
| Wilson | 49 | 78.5 years |
| Davis | 43 | 76.4 years |
| Allen | 36 | 76.4 years |
| Thompson | 31 | 76.7 years |
| Wright | 30 | 76.8 years |
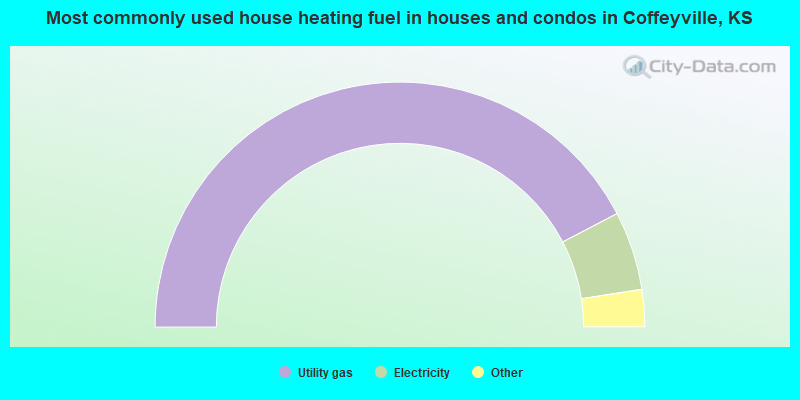
- 84.7%Utility gas
- 10.4%Electricity
- 2.2%Wood
- 1.9%Bottled, tank, or LP gas
- 0.7%Fuel oil, kerosene, etc.
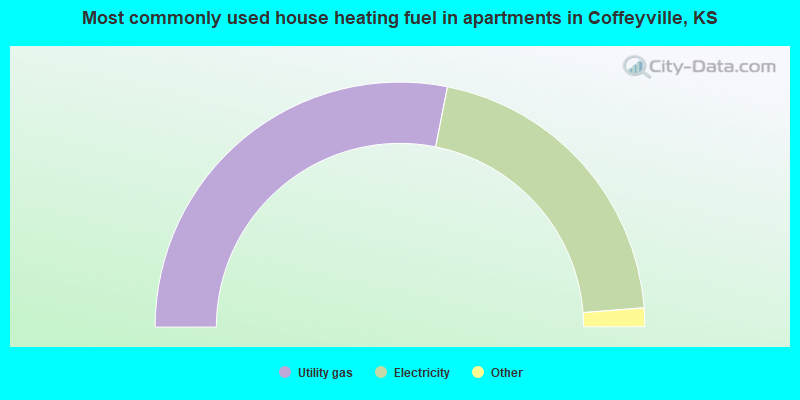
- 56.3%Utility gas
- 41.3%Electricity
- 1.2%Bottled, tank, or LP gas
- 0.9%No fuel used
- 0.4%Wood
Coffeyville compared to Kansas state average:
- Median household income below state average.
- Median house value significantly below state average.
- Unemployed percentage below state average.
- Median age above state average.
- Foreign-born population percentage below state average.
- Length of stay since moving in significantly above state average.
- House age above state average.
- Percentage of population with a bachelor's degree or higher below state average.
Coffeyville on our top lists:
- #24 on the list of "Top 101 cities with largest percentage of females in industries: health care and social assistance (population 5,000+)"
- #66 on the list of "Top 101 cities with largest percentage of males in occupations: production occupations (population 5,000+)"
- #84 on the list of "Top 100 cities with shortest commuting times (pop. 5,000+)"

|
|
Total of 45 patent applications in 2008-2024.