Charles City, Iowa Submit your own pictures of this city and show them to the world
OSM Map
General Map
Google Map
MSN Map
OSM Map
General Map
Google Map
MSN Map
OSM Map
General Map
Google Map
MSN Map
OSM Map
General Map
Google Map
MSN Map
Please wait while loading the map...
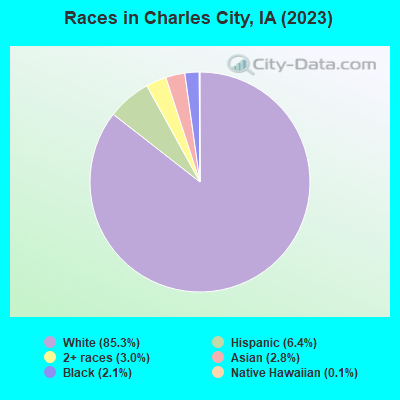
Population in 2022: 7,239 (98% urban, 2% rural). Population change since 2000: -7.3%Males: 3,443 Females: 3,796
March 2022 cost of living index in Charles City: 74.4 (low, U.S. average is 100) Percentage of residents living in poverty in 2022: 13.4%for White Non-Hispanic residents , 14.3% for Black residents , 23.2% for Hispanic or Latino residents , 100.0% for other race residents , 43.7% for two or more races residents )Business Search - 14 Million verified businesses
Data:
Median household income ($)
Median household income (% change since 2000)
Household income diversity
Ratio of average income to average house value (%)
Ratio of average income to average rent
Median household income ($) - White
Median household income ($) - Black or African American
Median household income ($) - Asian
Median household income ($) - Hispanic or Latino
Median household income ($) - American Indian and Alaska Native
Median household income ($) - Multirace
Median household income ($) - Other Race
Median household income for houses/condos with a mortgage ($)
Median household income for apartments without a mortgage ($)
Races - White alone (%)
Races - White alone (% change since 2000)
Races - Black alone (%)
Races - Black alone (% change since 2000)
Races - American Indian alone (%)
Races - American Indian alone (% change since 2000)
Races - Asian alone (%)
Races - Asian alone (% change since 2000)
Races - Hispanic (%)
Races - Hispanic (% change since 2000)
Races - Native Hawaiian and Other Pacific Islander alone (%)
Races - Native Hawaiian and Other Pacific Islander alone (% change since 2000)
Races - Two or more races (%)
Races - Two or more races (% change since 2000)
Races - Other race alone (%)
Races - Other race alone (% change since 2000)
Racial diversity
Unemployment (%)
Unemployment (% change since 2000)
Unemployment (%) - White
Unemployment (%) - Black or African American
Unemployment (%) - Asian
Unemployment (%) - Hispanic or Latino
Unemployment (%) - American Indian and Alaska Native
Unemployment (%) - Multirace
Unemployment (%) - Other Race
Population density (people per square mile)
Population - Males (%)
Population - Females (%)
Population - Males (%) - White
Population - Males (%) - Black or African American
Population - Males (%) - Asian
Population - Males (%) - Hispanic or Latino
Population - Males (%) - American Indian and Alaska Native
Population - Males (%) - Multirace
Population - Males (%) - Other Race
Population - Females (%) - White
Population - Females (%) - Black or African American
Population - Females (%) - Asian
Population - Females (%) - Hispanic or Latino
Population - Females (%) - American Indian and Alaska Native
Population - Females (%) - Multirace
Population - Females (%) - Other Race
Coronavirus confirmed cases (May 11, 2024)
Deaths caused by coronavirus (May 11, 2024)
Coronavirus confirmed cases (per 100k population) (May 11, 2024)
Deaths caused by coronavirus (per 100k population) (May 11, 2024)
Daily increase in number of cases (May 11, 2024)
Weekly increase in number of cases (May 11, 2024)
Cases doubled (in days) (May 11, 2024)
Hospitalized patients (Apr 18, 2022)
Negative test results (Apr 18, 2022)
Total test results (Apr 18, 2022)
COVID Vaccine doses distributed (per 100k population) (Sep 19, 2023)
COVID Vaccine doses administered (per 100k population) (Sep 19, 2023)
COVID Vaccine doses distributed (Sep 19, 2023)
COVID Vaccine doses administered (Sep 19, 2023)
Likely homosexual households (%)
Likely homosexual households (% change since 2000)
Likely homosexual households - Lesbian couples (%)
Likely homosexual households - Lesbian couples (% change since 2000)
Likely homosexual households - Gay men (%)
Likely homosexual households - Gay men (% change since 2000)
Cost of living index
Median gross rent ($)
Median contract rent ($)
Median monthly housing costs ($)
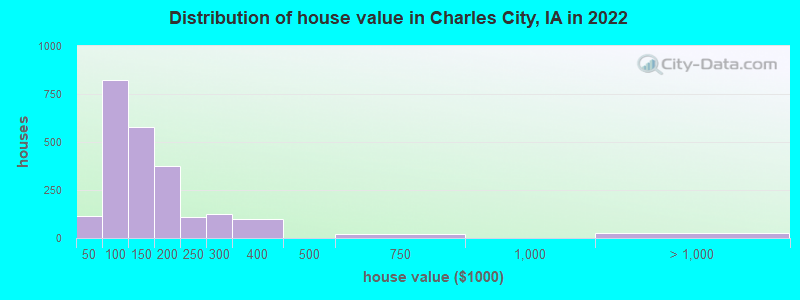
Median house or condo value ($)
Median house or condo value ($ change since 2000)
Mean house or condo value by units in structure - 1, detached ($)
Mean house or condo value by units in structure - 1, attached ($)
Mean house or condo value by units in structure - 2 ($)
Mean house or condo value by units in structure by units in structure - 3 or 4 ($)
Mean house or condo value by units in structure - 5 or more ($)
Mean house or condo value by units in structure - Boat, RV, van, etc. ($)
Mean house or condo value by units in structure - Mobile home ($)
Median house or condo value ($) - White
Median house or condo value ($) - Black or African American
Median house or condo value ($) - Asian
Median house or condo value ($) - Hispanic or Latino
Median house or condo value ($) - American Indian and Alaska Native
Median house or condo value ($) - Multirace
Median house or condo value ($) - Other Race
Median resident age
Resident age diversity
Median resident age - Males
Median resident age - Females
Median resident age - White
Median resident age - Black or African American
Median resident age - Asian
Median resident age - Hispanic or Latino
Median resident age - American Indian and Alaska Native
Median resident age - Multirace
Median resident age - Other Race
Median resident age - Males - White
Median resident age - Males - Black or African American
Median resident age - Males - Asian
Median resident age - Males - Hispanic or Latino
Median resident age - Males - American Indian and Alaska Native
Median resident age - Males - Multirace
Median resident age - Males - Other Race
Median resident age - Females - White
Median resident age - Females - Black or African American
Median resident age - Females - Asian
Median resident age - Females - Hispanic or Latino
Median resident age - Females - American Indian and Alaska Native
Median resident age - Females - Multirace
Median resident age - Females - Other Race
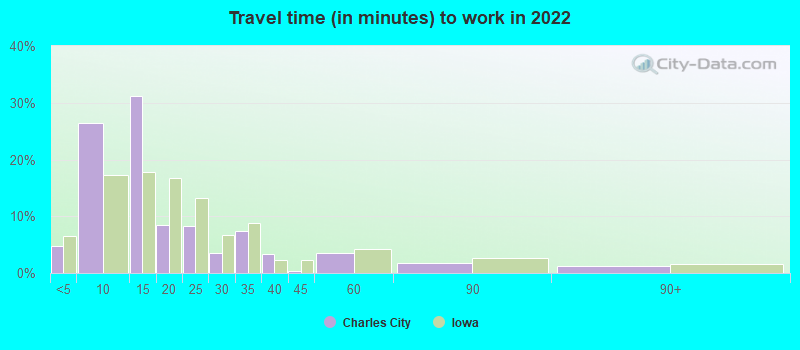
Commute - mean travel time to work (minutes)
Travel time to work - Less than 5 minutes (%)
Travel time to work - Less than 5 minutes (% change since 2000)
Travel time to work - 5 to 9 minutes (%)
Travel time to work - 5 to 9 minutes (% change since 2000)
Travel time to work - 10 to 19 minutes (%)
Travel time to work - 10 to 19 minutes (% change since 2000)
Travel time to work - 20 to 29 minutes (%)
Travel time to work - 20 to 29 minutes (% change since 2000)
Travel time to work - 30 to 39 minutes (%)
Travel time to work - 30 to 39 minutes (% change since 2000)
Travel time to work - 40 to 59 minutes (%)
Travel time to work - 40 to 59 minutes (% change since 2000)
Travel time to work - 60 to 89 minutes (%)
Travel time to work - 60 to 89 minutes (% change since 2000)
Travel time to work - 90 or more minutes (%)
Travel time to work - 90 or more minutes (% change since 2000)
Marital status - Never married (%)
Marital status - Now married (%)
Marital status - Separated (%)
Marital status - Widowed (%)
Marital status - Divorced (%)
Median family income ($)
Median family income (% change since 2000)
Median non-family income ($)
Median non-family income (% change since 2000)
Median per capita income ($)
Median per capita income (% change since 2000)
Median family income ($) - White
Median family income ($) - Black or African American
Median family income ($) - Asian
Median family income ($) - Hispanic or Latino
Median family income ($) - American Indian and Alaska Native
Median family income ($) - Multirace
Median family income ($) - Other Race
Median year house/condo built
Median year apartment built
Year house built - Built 2005 or later (%)
Year house built - Built 2000 to 2004 (%)
Year house built - Built 1990 to 1999 (%)
Year house built - Built 1980 to 1989 (%)
Year house built - Built 1970 to 1979 (%)
Year house built - Built 1960 to 1969 (%)
Year house built - Built 1950 to 1959 (%)
Year house built - Built 1940 to 1949 (%)
Year house built - Built 1939 or earlier (%)
Average household size
Household density (households per square mile)
Average household size - White
Average household size - Black or African American
Average household size - Asian
Average household size - Hispanic or Latino
Average household size - American Indian and Alaska Native
Average household size - Multirace
Average household size - Other Race
Occupied housing units (%)
Vacant housing units (%)
Owner occupied housing units (%)
Renter occupied housing units (%)
Vacancy status - For rent (%)
Vacancy status - For sale only (%)
Vacancy status - Rented or sold, not occupied (%)
Vacancy status - For seasonal, recreational, or occasional use (%)
Vacancy status - For migrant workers (%)
Vacancy status - Other vacant (%)
Residents with income below the poverty level (%)
Residents with income below 50% of the poverty level (%)
Children below poverty level (%)
Poor families by family type - Married-couple family (%)
Poor families by family type - Male, no wife present (%)
Poor families by family type - Female, no husband present (%)
Poverty status for native-born residents (%)
Poverty status for foreign-born residents (%)
Poverty among high school graduates not in families (%)
Poverty among people who did not graduate high school not in families (%)
Residents with income below the poverty level (%) - White
Residents with income below the poverty level (%) - Black or African American
Residents with income below the poverty level (%) - Asian
Residents with income below the poverty level (%) - Hispanic or Latino
Residents with income below the poverty level (%) - American Indian and Alaska Native
Residents with income below the poverty level (%) - Multirace
Residents with income below the poverty level (%) - Other Race
Air pollution - Air Quality Index (AQI)
Air pollution - CO
Air pollution - NO2
Air pollution - SO2
Air pollution - Ozone
Air pollution - PM10
Air pollution - PM25
Air pollution - Pb
Crime - Murders per 100,000 population
Crime - Rapes per 100,000 population
Crime - Robberies per 100,000 population
Crime - Assaults per 100,000 population
Crime - Burglaries per 100,000 population
Crime - Thefts per 100,000 population
Crime - Auto thefts per 100,000 population
Crime - Arson per 100,000 population
Crime - City-data.com crime index
Crime - Violent crime index
Crime - Property crime index
Crime - Murders per 100,000 population (5 year average)
Crime - Rapes per 100,000 population (5 year average)
Crime - Robberies per 100,000 population (5 year average)
Crime - Assaults per 100,000 population (5 year average)
Crime - Burglaries per 100,000 population (5 year average)
Crime - Thefts per 100,000 population (5 year average)
Crime - Auto thefts per 100,000 population (5 year average)
Crime - Arson per 100,000 population (5 year average)
Crime - City-data.com crime index (5 year average)
Crime - Violent crime index (5 year average)
Crime - Property crime index (5 year average)
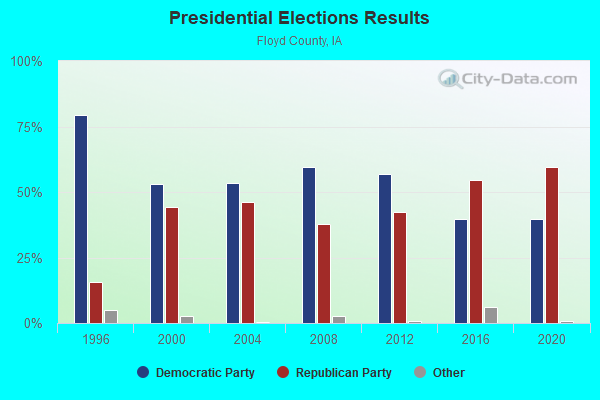
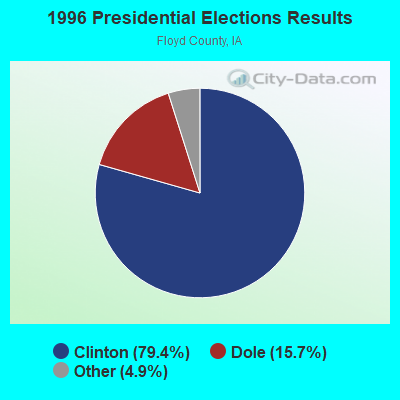
1996 Presidential Elections Results (%) - Democratic Party (Clinton)
1996 Presidential Elections Results (%) - Republican Party (Dole)
1996 Presidential Elections Results (%) - Other
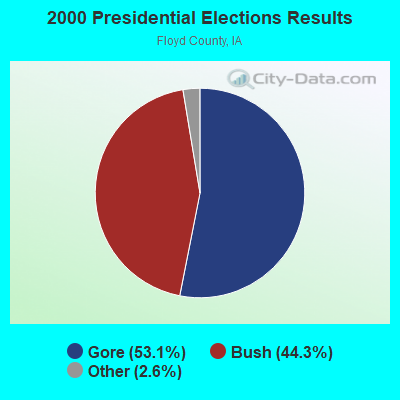
2000 Presidential Elections Results (%) - Democratic Party (Gore)
2000 Presidential Elections Results (%) - Republican Party (Bush)
2000 Presidential Elections Results (%) - Other
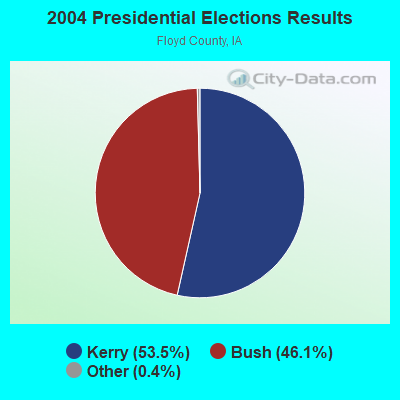
2004 Presidential Elections Results (%) - Democratic Party (Kerry)
2004 Presidential Elections Results (%) - Republican Party (Bush)
2004 Presidential Elections Results (%) - Other
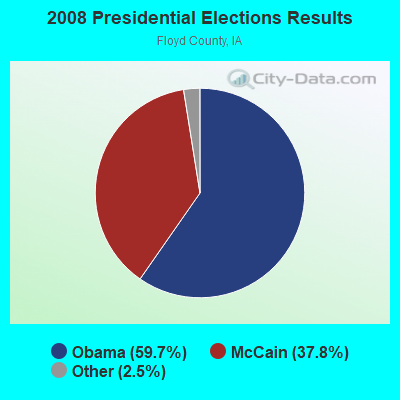
2008 Presidential Elections Results (%) - Democratic Party (Obama)
2008 Presidential Elections Results (%) - Republican Party (McCain)
2008 Presidential Elections Results (%) - Other
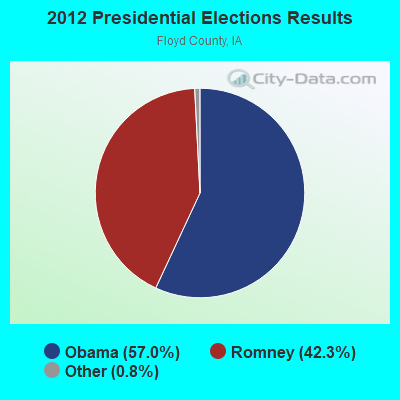
2012 Presidential Elections Results (%) - Democratic Party (Obama)
2012 Presidential Elections Results (%) - Republican Party (Romney)
2012 Presidential Elections Results (%) - Other
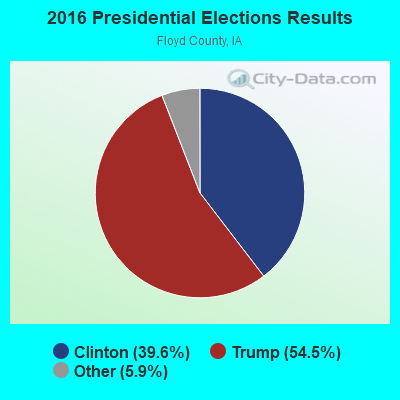
2016 Presidential Elections Results (%) - Democratic Party (Clinton)
2016 Presidential Elections Results (%) - Republican Party (Trump)
2016 Presidential Elections Results (%) - Other
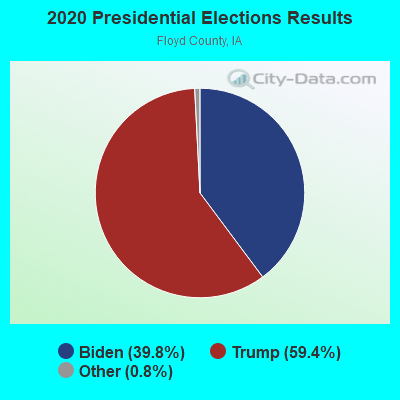
2020 Presidential Elections Results (%) - Democratic Party (Biden)
2020 Presidential Elections Results (%) - Republican Party (Trump)
2020 Presidential Elections Results (%) - Other
Ancestries Reported - Arab (%)
Ancestries Reported - Czech (%)
Ancestries Reported - Danish (%)
Ancestries Reported - Dutch (%)
Ancestries Reported - English (%)
Ancestries Reported - French (%)
Ancestries Reported - French Canadian (%)
Ancestries Reported - German (%)
Ancestries Reported - Greek (%)
Ancestries Reported - Hungarian (%)
Ancestries Reported - Irish (%)
Ancestries Reported - Italian (%)
Ancestries Reported - Lithuanian (%)
Ancestries Reported - Norwegian (%)
Ancestries Reported - Polish (%)
Ancestries Reported - Portuguese (%)
Ancestries Reported - Russian (%)
Ancestries Reported - Scotch-Irish (%)
Ancestries Reported - Scottish (%)
Ancestries Reported - Slovak (%)
Ancestries Reported - Subsaharan African (%)
Ancestries Reported - Swedish (%)
Ancestries Reported - Swiss (%)
Ancestries Reported - Ukrainian (%)
Ancestries Reported - United States (%)
Ancestries Reported - Welsh (%)
Ancestries Reported - West Indian (%)
Ancestries Reported - Other (%)
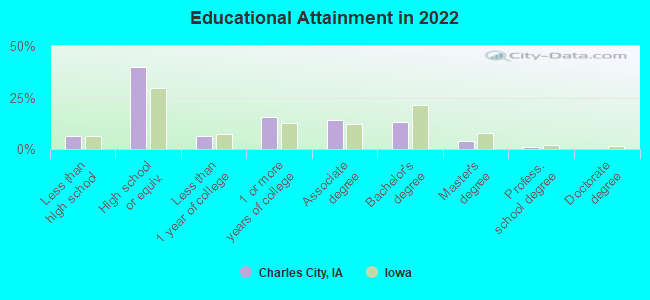
Educational Attainment - No schooling completed (%)
Educational Attainment - Less than high school (%)
Educational Attainment - High school or equivalent (%)
Educational Attainment - Less than 1 year of college (%)
Educational Attainment - 1 or more years of college (%)
Educational Attainment - Associate degree (%)
Educational Attainment - Bachelor's degree (%)
Educational Attainment - Master's degree (%)
Educational Attainment - Professional school degree (%)
Educational Attainment - Doctorate degree (%)
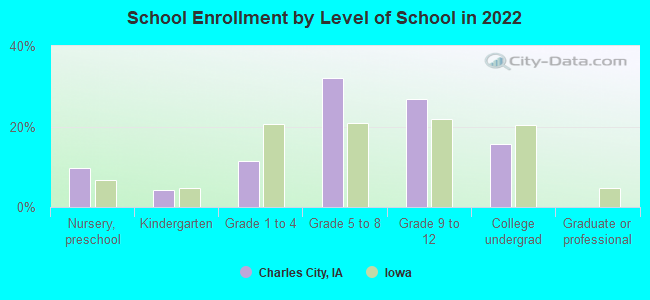
School Enrollment - Nursery, preschool (%)
School Enrollment - Kindergarten (%)
School Enrollment - Grade 1 to 4 (%)
School Enrollment - Grade 5 to 8 (%)
School Enrollment - Grade 9 to 12 (%)
School Enrollment - College undergrad (%)
School Enrollment - Graduate or professional (%)
School Enrollment - Not enrolled in school (%)
School enrollment - Public schools (%)
School enrollment - Private schools (%)
School enrollment - Not enrolled (%)
Median number of rooms in houses and condos
Median number of rooms in apartments
Housing units lacking complete plumbing facilities (%)
Housing units lacking complete kitchen facilities (%)
Density of houses
Urban houses (%)
Rural houses (%)
Households with people 60 years and over (%)
Households with people 65 years and over (%)
Households with people 75 years and over (%)
Households with one or more nonrelatives (%)
Households with no nonrelatives (%)
Population in households (%)
Family households (%)
Nonfamily households (%)
Population in families (%)
Family households with own children (%)
Median number of bedrooms in owner occupied houses
Mean number of bedrooms in owner occupied houses
Median number of bedrooms in renter occupied houses
Mean number of bedrooms in renter occupied houses
Median number of vehichles in owner occupied houses
Mean number of vehichles in owner occupied houses
Median number of vehichles in renter occupied houses
Mean number of vehichles in renter occupied houses
Mortgage status - with mortgage (%)
Mortgage status - with second mortgage (%)
Mortgage status - with home equity loan (%)
Mortgage status - with both second mortgage and home equity loan (%)
Mortgage status - without a mortgage (%)
Average family size
Average family size - White
Average family size - Black or African American
Average family size - Asian
Average family size - Hispanic or Latino
Average family size - American Indian and Alaska Native
Average family size - Multirace
Average family size - Other Race
Geographical mobility - Same house 1 year ago (%)
Geographical mobility - Moved within same county (%)
Geographical mobility - Moved from different county within same state (%)
Geographical mobility - Moved from different state (%)
Geographical mobility - Moved from abroad (%)
Place of birth - Born in state of residence (%)
Place of birth - Born in other state (%)
Place of birth - Native, outside of US (%)
Place of birth - Foreign born (%)
Housing units in structures - 1, detached (%)
Housing units in structures - 1, attached (%)
Housing units in structures - 2 (%)
Housing units in structures - 3 or 4 (%)
Housing units in structures - 5 to 9 (%)
Housing units in structures - 10 to 19 (%)
Housing units in structures - 20 to 49 (%)
Housing units in structures - 50 or more (%)
Housing units in structures - Mobile home (%)
Housing units in structures - Boat, RV, van, etc. (%)
House/condo owner moved in on average (years ago)
Renter moved in on average (years ago)
Year householder moved into unit - Moved in 1999 to March 2000 (%)
Year householder moved into unit - Moved in 1995 to 1998 (%)
Year householder moved into unit - Moved in 1990 to 1994 (%)
Year householder moved into unit - Moved in 1980 to 1989 (%)
Year householder moved into unit - Moved in 1970 to 1979 (%)
Year householder moved into unit - Moved in 1969 or earlier (%)
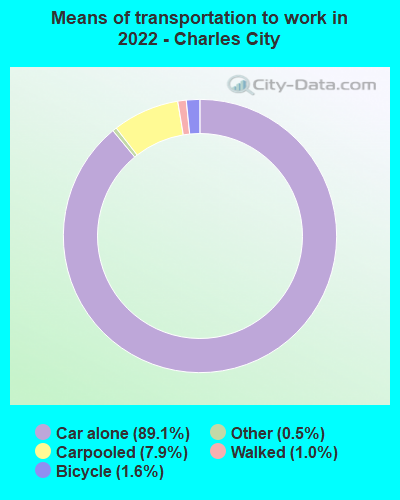
Means of transportation to work - Drove car alone (%)
Means of transportation to work - Carpooled (%)
Means of transportation to work - Public transportation (%)
Means of transportation to work - Bus or trolley bus (%)
Means of transportation to work - Streetcar or trolley car (%)
Means of transportation to work - Subway or elevated (%)
Means of transportation to work - Railroad (%)
Means of transportation to work - Ferryboat (%)
Means of transportation to work - Taxicab (%)
Means of transportation to work - Motorcycle (%)
Means of transportation to work - Bicycle (%)
Means of transportation to work - Walked (%)
Means of transportation to work - Other means (%)
Working at home (%)
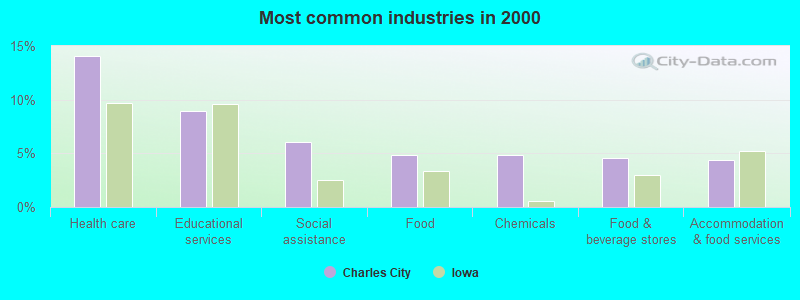
Industry diversity
Most Common Industries - Agriculture, forestry, fishing and hunting, and mining (%)
Most Common Industries - Agriculture, forestry, fishing and hunting (%)
Most Common Industries - Mining, quarrying, and oil and gas extraction (%)
Most Common Industries - Construction (%)
Most Common Industries - Manufacturing (%)
Most Common Industries - Wholesale trade (%)
Most Common Industries - Retail trade (%)
Most Common Industries - Transportation and warehousing, and utilities (%)
Most Common Industries - Transportation and warehousing (%)
Most Common Industries - Utilities (%)
Most Common Industries - Information (%)
Most Common Industries - Finance and insurance, and real estate and rental and leasing (%)
Most Common Industries - Finance and insurance (%)
Most Common Industries - Real estate and rental and leasing (%)
Most Common Industries - Professional, scientific, and management, and administrative and waste management services (%)
Most Common Industries - Professional, scientific, and technical services (%)
Most Common Industries - Management of companies and enterprises (%)
Most Common Industries - Administrative and support and waste management services (%)
Most Common Industries - Educational services, and health care and social assistance (%)
Most Common Industries - Educational services (%)
Most Common Industries - Health care and social assistance (%)
Most Common Industries - Arts, entertainment, and recreation, and accommodation and food services (%)
Most Common Industries - Arts, entertainment, and recreation (%)
Most Common Industries - Accommodation and food services (%)
Most Common Industries - Other services, except public administration (%)
Most Common Industries - Public administration (%)
Occupation diversity
Most Common Occupations - Management, business, science, and arts occupations (%)
Most Common Occupations - Management, business, and financial occupations (%)
Most Common Occupations - Management occupations (%)
Most Common Occupations - Business and financial operations occupations (%)
Most Common Occupations - Computer, engineering, and science occupations (%)
Most Common Occupations - Computer and mathematical occupations (%)
Most Common Occupations - Architecture and engineering occupations (%)
Most Common Occupations - Life, physical, and social science occupations (%)
Most Common Occupations - Education, legal, community service, arts, and media occupations (%)
Most Common Occupations - Community and social service occupations (%)
Most Common Occupations - Legal occupations (%)
Most Common Occupations - Education, training, and library occupations (%)
Most Common Occupations - Arts, design, entertainment, sports, and media occupations (%)
Most Common Occupations - Healthcare practitioners and technical occupations (%)
Most Common Occupations - Health diagnosing and treating practitioners and other technical occupations (%)
Most Common Occupations - Health technologists and technicians (%)
Most Common Occupations - Service occupations (%)
Most Common Occupations - Healthcare support occupations (%)
Most Common Occupations - Protective service occupations (%)
Most Common Occupations - Fire fighting and prevention, and other protective service workers including supervisors (%)
Most Common Occupations - Law enforcement workers including supervisors (%)
Most Common Occupations - Food preparation and serving related occupations (%)
Most Common Occupations - Building and grounds cleaning and maintenance occupations (%)
Most Common Occupations - Personal care and service occupations (%)
Most Common Occupations - Sales and office occupations (%)
Most Common Occupations - Sales and related occupations (%)
Most Common Occupations - Office and administrative support occupations (%)
Most Common Occupations - Natural resources, construction, and maintenance occupations (%)
Most Common Occupations - Farming, fishing, and forestry occupations (%)
Most Common Occupations - Construction and extraction occupations (%)
Most Common Occupations - Installation, maintenance, and repair occupations (%)
Most Common Occupations - Production, transportation, and material moving occupations (%)
Most Common Occupations - Production occupations (%)
Most Common Occupations - Transportation occupations (%)
Most Common Occupations - Material moving occupations (%)
People in Group quarters - Institutionalized population (%)
People in Group quarters - Correctional institutions (%)
People in Group quarters - Federal prisons and detention centers (%)
People in Group quarters - Halfway houses (%)
People in Group quarters - Local jails and other confinement facilities (including police lockups) (%)
People in Group quarters - Military disciplinary barracks (%)
People in Group quarters - State prisons (%)
People in Group quarters - Other types of correctional institutions (%)
People in Group quarters - Nursing homes (%)
People in Group quarters - Hospitals/wards, hospices, and schools for the handicapped (%)
People in Group quarters - Hospitals/wards and hospices for chronically ill (%)
People in Group quarters - Hospices or homes for chronically ill (%)
People in Group quarters - Military hospitals or wards for chronically ill (%)
People in Group quarters - Other hospitals or wards for chronically ill (%)
People in Group quarters - Hospitals or wards for drug/alcohol abuse (%)
People in Group quarters - Mental (Psychiatric) hospitals or wards (%)
People in Group quarters - Schools, hospitals, or wards for the mentally retarded (%)
People in Group quarters - Schools, hospitals, or wards for the physically handicapped (%)
People in Group quarters - Institutions for the deaf (%)
People in Group quarters - Institutions for the blind (%)
People in Group quarters - Orthopedic wards and institutions for the physically handicapped (%)
People in Group quarters - Wards in general hospitals for patients who have no usual home elsewhere (%)
People in Group quarters - Wards in military hospitals for patients who have no usual home elsewhere (%)
People in Group quarters - Juvenile institutions (%)
People in Group quarters - Long-term care (%)
People in Group quarters - Homes for abused, dependent, and neglected children (%)
People in Group quarters - Residential treatment centers for emotionally disturbed children (%)
People in Group quarters - Training schools for juvenile delinquents (%)
People in Group quarters - Short-term care, detention or diagnostic centers for delinquent children (%)
People in Group quarters - Type of juvenile institution unknown (%)
People in Group quarters - Noninstitutionalized population (%)
People in Group quarters - College dormitories (includes college quarters off campus) (%)
People in Group quarters - Military quarters (%)
People in Group quarters - On base (%)
People in Group quarters - Barracks, unaccompanied personnel housing (UPH), (Enlisted/Officer), ;and similar group living quarters for military personnel (%)
People in Group quarters - Transient quarters for temporary residents (%)
People in Group quarters - Military ships (%)
People in Group quarters - Group homes (%)
People in Group quarters - Homes or halfway houses for drug/alcohol abuse (%)
People in Group quarters - Homes for the mentally ill (%)
People in Group quarters - Homes for the mentally retarded (%)
People in Group quarters - Homes for the physically handicapped (%)
People in Group quarters - Other group homes (%)
People in Group quarters - Religious group quarters (%)
People in Group quarters - Dormitories (%)
People in Group quarters - Agriculture workers' dormitories on farms (%)
People in Group quarters - Job Corps and vocational training facilities (%)
People in Group quarters - Other workers' dormitories (%)
People in Group quarters - Crews of maritime vessels (%)
People in Group quarters - Other nonhousehold living situations (%)
People in Group quarters - Other noninstitutional group quarters (%)
Residents speaking English at home (%)
Residents speaking English at home - Born in the United States (%)
Residents speaking English at home - Native, born elsewhere (%)
Residents speaking English at home - Foreign born (%)
Residents speaking Spanish at home (%)
Residents speaking Spanish at home - Born in the United States (%)
Residents speaking Spanish at home - Native, born elsewhere (%)
Residents speaking Spanish at home - Foreign born (%)
Residents speaking other language at home (%)
Residents speaking other language at home - Born in the United States (%)
Residents speaking other language at home - Native, born elsewhere (%)
Residents speaking other language at home - Foreign born (%)
Class of Workers - Employee of private company (%)
Class of Workers - Self-employed in own incorporated business (%)
Class of Workers - Private not-for-profit wage and salary workers (%)
Class of Workers - Local government workers (%)
Class of Workers - State government workers (%)
Class of Workers - Federal government workers (%)
Class of Workers - Self-employed workers in own not incorporated business and Unpaid family workers (%)
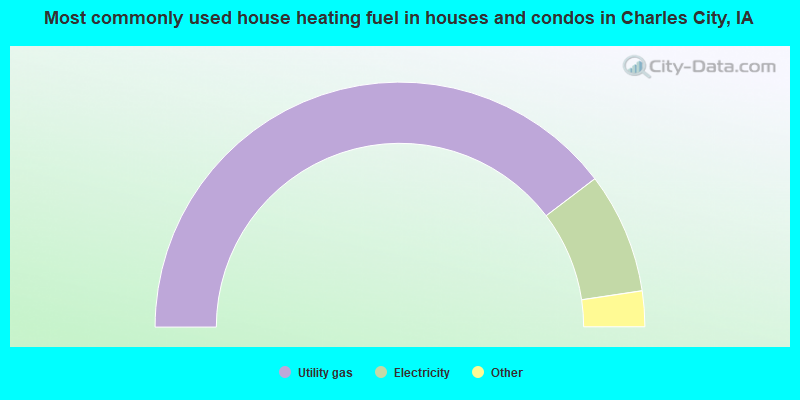
House heating fuel used in houses and condos - Utility gas (%)
House heating fuel used in houses and condos - Bottled, tank, or LP gas (%)
House heating fuel used in houses and condos - Electricity (%)
House heating fuel used in houses and condos - Fuel oil, kerosene, etc. (%)
House heating fuel used in houses and condos - Coal or coke (%)
House heating fuel used in houses and condos - Wood (%)
House heating fuel used in houses and condos - Solar energy (%)
House heating fuel used in houses and condos - Other fuel (%)
House heating fuel used in houses and condos - No fuel used (%)
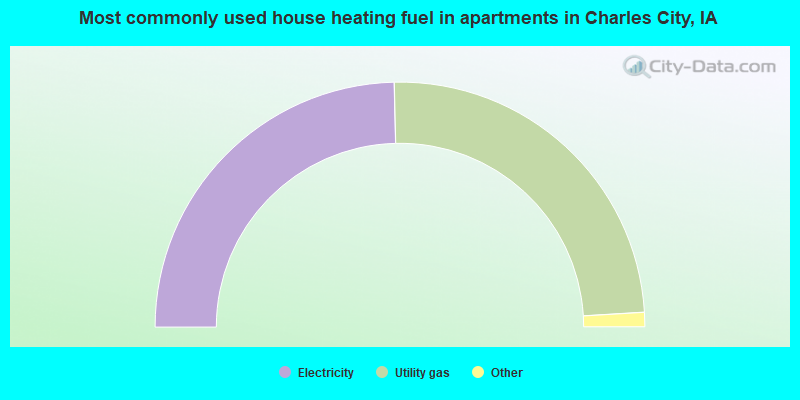
House heating fuel used in apartments - Utility gas (%)
House heating fuel used in apartments - Bottled, tank, or LP gas (%)
House heating fuel used in apartments - Electricity (%)
House heating fuel used in apartments - Fuel oil, kerosene, etc. (%)
House heating fuel used in apartments - Coal or coke (%)
House heating fuel used in apartments - Wood (%)
House heating fuel used in apartments - Solar energy (%)
House heating fuel used in apartments - Other fuel (%)
House heating fuel used in apartments - No fuel used (%)
Armed forces status - In Armed Forces (%)
Armed forces status - Civilian (%)
Armed forces status - Civilian - Veteran (%)
Armed forces status - Civilian - Nonveteran (%)
Fatal accidents locations in years 2005-2021
Fatal accidents locations in 2005
Fatal accidents locations in 2006
Fatal accidents locations in 2007
Fatal accidents locations in 2008
Fatal accidents locations in 2009
Fatal accidents locations in 2010
Fatal accidents locations in 2011
Fatal accidents locations in 2012
Fatal accidents locations in 2013
Fatal accidents locations in 2014
Fatal accidents locations in 2015
Fatal accidents locations in 2016
Fatal accidents locations in 2017
Fatal accidents locations in 2018
Fatal accidents locations in 2019
Fatal accidents locations in 2020
Fatal accidents locations in 2021
Alcohol use - People drinking some alcohol every month (%)
Alcohol use - People not drinking at all (%)
Alcohol use - Average days/month drinking alcohol
Alcohol use - Average drinks/week
Alcohol use - Average days/year people drink much
Audiometry - Average condition of hearing (%)
Audiometry - People that can hear a whisper from across a quiet room (%)
Audiometry - People that can hear normal voice from across a quiet room (%)
Audiometry - Ears ringing, roaring, buzzing (%)
Audiometry - Had a job exposure to loud noise (%)
Audiometry - Had off-work exposure to loud noise (%)
Blood Pressure & Cholesterol - Has high blood pressure (%)
Blood Pressure & Cholesterol - Checking blood pressure at home (%)
Blood Pressure & Cholesterol - Frequently checking blood cholesterol (%)
Blood Pressure & Cholesterol - Has high cholesterol level (%)
Consumer Behavior - Money monthly spent on food at supermarket/grocery store
Consumer Behavior - Money monthly spent on food at other stores
Consumer Behavior - Money monthly spent on eating out
Consumer Behavior - Money monthly spent on carryout/delivered foods
Consumer Behavior - Income spent on food at supermarket/grocery store (%)
Consumer Behavior - Income spent on food at other stores (%)
Consumer Behavior - Income spent on eating out (%)
Consumer Behavior - Income spent on carryout/delivered foods (%)
Current Health Status - General health condition (%)
Current Health Status - Blood donors (%)
Current Health Status - Has blood ever tested for HIV virus (%)
Current Health Status - Left-handed people (%)
Dermatology - People using sunscreen (%)
Diabetes - Diabetics (%)
Diabetes - Had a blood test for high blood sugar (%)
Diabetes - People taking insulin (%)
Diet Behavior & Nutrition - Diet health (%)
Diet Behavior & Nutrition - Milk product consumption (# of products/month)
Diet Behavior & Nutrition - Meals not home prepared (#/week)
Diet Behavior & Nutrition - Meals from fast food or pizza place (#/week)
Diet Behavior & Nutrition - Ready-to-eat foods (#/month)
Diet Behavior & Nutrition - Frozen meals/pizza (#/month)
Drug Use - People that ever used marijuana or hashish (%)
Drug Use - Ever used hard drugs (%)
Drug Use - Ever used any form of cocaine (%)
Drug Use - Ever used heroin (%)
Drug Use - Ever used methamphetamine (%)
Health Insurance - People covered by health insurance (%)
Kidney Conditions-Urology - Avg. # of times urinating at night
Medical Conditions - People with asthma (%)
Medical Conditions - People with anemia (%)
Medical Conditions - People with psoriasis (%)
Medical Conditions - People with overweight (%)
Medical Conditions - Elderly people having difficulties in thinking or remembering (%)
Medical Conditions - People who ever received blood transfusion (%)
Medical Conditions - People having trouble seeing even with glass/contacts (%)
Medical Conditions - People with arthritis (%)
Medical Conditions - People with gout (%)
Medical Conditions - People with congestive heart failure (%)
Medical Conditions - People with coronary heart disease (%)
Medical Conditions - People with angina pectoris (%)
Medical Conditions - People who ever had heart attack (%)
Medical Conditions - People who ever had stroke (%)
Medical Conditions - People with emphysema (%)
Medical Conditions - People with thyroid problem (%)
Medical Conditions - People with chronic bronchitis (%)
Medical Conditions - People with any liver condition (%)
Medical Conditions - People who ever had cancer or malignancy (%)
Mental Health - People who have little interest in doing things (%)
Mental Health - People feeling down, depressed, or hopeless (%)
Mental Health - People who have trouble sleeping or sleeping too much (%)
Mental Health - People feeling tired or having little energy (%)
Mental Health - People with poor appetite or overeating (%)
Mental Health - People feeling bad about themself (%)
Mental Health - People who have trouble concentrating on things (%)
Mental Health - People moving or speaking slowly or too fast (%)
Mental Health - People having thoughts they would be better off dead (%)
Oral Health - Average years since last visit a dentist
Oral Health - People embarrassed because of mouth (%)
Oral Health - People with gum disease (%)
Oral Health - General health of teeth and gums (%)
Oral Health - Average days a week using dental floss/device
Oral Health - Average days a week using mouthwash for dental problem
Oral Health - Average number of teeth
Pesticide Use - Households using pesticides to control insects (%)
Pesticide Use - Households using pesticides to kill weeds (%)
Physical Activity - People doing vigorous-intensity work activities (%)
Physical Activity - People doing moderate-intensity work activities (%)
Physical Activity - People walking or bicycling (%)
Physical Activity - People doing vigorous-intensity recreational activities (%)
Physical Activity - People doing moderate-intensity recreational activities (%)
Physical Activity - Average hours a day doing sedentary activities
Physical Activity - Average hours a day watching TV or videos
Physical Activity - Average hours a day using computer
Physical Functioning - People having limitations keeping them from working (%)
Physical Functioning - People limited in amount of work they can do (%)
Physical Functioning - People that need special equipment to walk (%)
Physical Functioning - People experiencing confusion/memory problems (%)
Physical Functioning - People requiring special healthcare equipment (%)
Prescription Medications - Average number of prescription medicines taking
Preventive Aspirin Use - Adults 40+ taking low-dose aspirin (%)
Reproductive Health - Vaginal deliveries (%)
Reproductive Health - Cesarean deliveries (%)
Reproductive Health - Deliveries resulted in a live birth (%)
Reproductive Health - Pregnancies resulted in a delivery (%)
Reproductive Health - Women breastfeeding newborns (%)
Reproductive Health - Women that had a hysterectomy (%)
Reproductive Health - Women that had both ovaries removed (%)
Reproductive Health - Women that have ever taken birth control pills (%)
Reproductive Health - Women taking birth control pills (%)
Reproductive Health - Women that have ever used Depo-Provera or injectables (%)
Reproductive Health - Women that have ever used female hormones (%)
Sexual Behavior - People 18+ that ever had sex (vaginal, anal, or oral) (%)
Sexual Behavior - Males 18+ that ever had vaginal sex with a woman (%)
Sexual Behavior - Males 18+ that ever performed oral sex on a woman (%)
Sexual Behavior - Males 18+ that ever had anal sex with a woman (%)
Sexual Behavior - Males 18+ that ever had any sex with a man (%)
Sexual Behavior - Females 18+ that ever had vaginal sex with a man (%)
Sexual Behavior - Females 18+ that ever performed oral sex on a man (%)
Sexual Behavior - Females 18+ that ever had anal sex with a man (%)
Sexual Behavior - Females 18+ that ever had any kind of sex with a woman (%)
Sexual Behavior - Average age people first had sex
Sexual Behavior - Average number of female sex partners in lifetime (males 18+)
Sexual Behavior - Average number of female vaginal sex partners in lifetime (males 18+)
Sexual Behavior - Average age people first performed oral sex on a woman (18+)
Sexual Behavior - Average number of woman performed oral sex on in lifetime (18+)
Sexual Behavior - Average number of male sex partners in lifetime (males 18+)
Sexual Behavior - Average number of male anal sex partners in lifetime (males 18+)
Sexual Behavior - Average age people first performed oral sex on a man (18+)
Sexual Behavior - Average number of male oral sex partners in lifetime (18+)
Sexual Behavior - People using protection when performing oral sex (%)
Sexual Behavior - Average number of times people have vaginal or anal sex a year
Sexual Behavior - People having sex without condom (%)
Sexual Behavior - Average number of male sex partners in lifetime (females 18+)
Sexual Behavior - Average number of male vaginal sex partners in lifetime (females 18+)
Sexual Behavior - Average number of female sex partners in lifetime (females 18+)
Sexual Behavior - Circumcised males 18+ (%)
Sleep Disorders - Average hours sleeping at night
Sleep Disorders - People that has trouble sleeping (%)
Smoking-Cigarette Use - People smoking cigarettes (%)
Taste & Smell - People 40+ having problems with smell (%)
Taste & Smell - People 40+ having problems with taste (%)
Taste & Smell - People 40+ that ever had wisdom teeth removed (%)
Taste & Smell - People 40+ that ever had tonsils teeth removed (%)
Taste & Smell - People 40+ that ever had a loss of consciousness because of a head injury (%)
Taste & Smell - People 40+ that ever had a broken nose or other serious injury to face or skull (%)
Taste & Smell - People 40+ that ever had two or more sinus infections (%)
Weight - Average height (inches)
Weight - Average weight (pounds)
Weight - Average BMI
Weight - People that are obese (%)
Weight - People that ever were obese (%)
Weight - People trying to lose weight (%)
Officers per 1,000 residents here:
1.95Iowa average:
1.76
Latest news from Charles City, IA collected exclusively by city-data.com from local newspapers, TV, and radio stations
Ancestries: German (46.2%), Irish (6.7%), American (6.1%), Norwegian (4.1%), English (3.3%), Sudanese (2.9%).
Current Local Time:
Incorporated on 05/1/1869
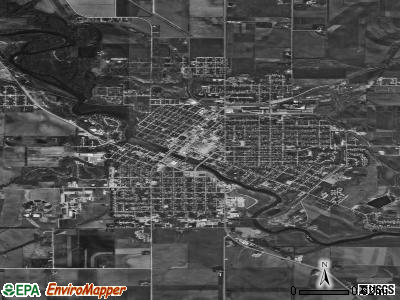
Land area: 6.15 square miles.
Population density: 1,177 people per square mile (low).
473 residents are foreign born (2.3% Latin America , 2.0% Asia , 1.5% Africa ).
Median real estate property taxes paid for housing units with mortgages in 2022: $1,994 (1.4%)Median real estate property taxes paid for housing units with no mortgage in 2022: $1,656 (1.5%)
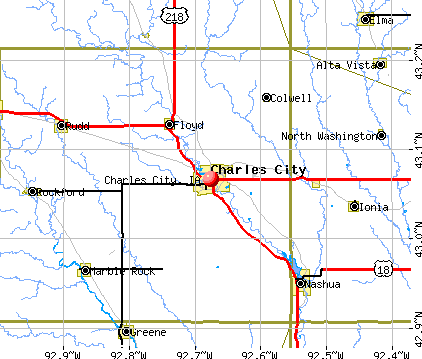
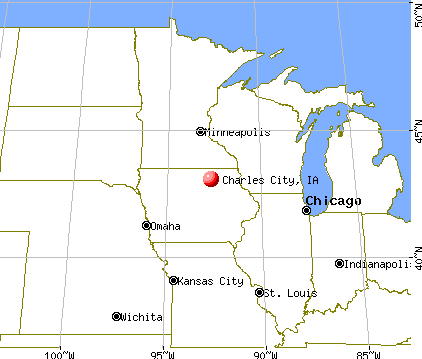
Nearest city with pop. 50,000+: Waterloo, IA
Nearest city with pop. 200,000+: St. Paul, MN
Nearest city with pop. 1,000,000+: Chicago, IL
Nearest cities:
Colwell, IA (2.7 miles),
Roseville, IA (2.8 miles),
Bassett, IA (2.8 miles),
Orchard, IA (3.5 miles)
Latitude: 43.07 N, Longitude: 92.68 W
Daytime population change due to commuting: +827 (+11.2%)Workers who live and work in this city: 2,623 (73.1%)
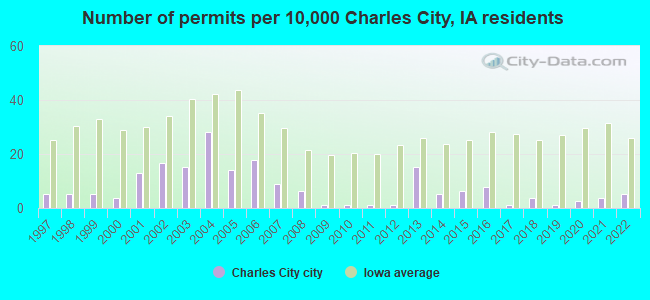
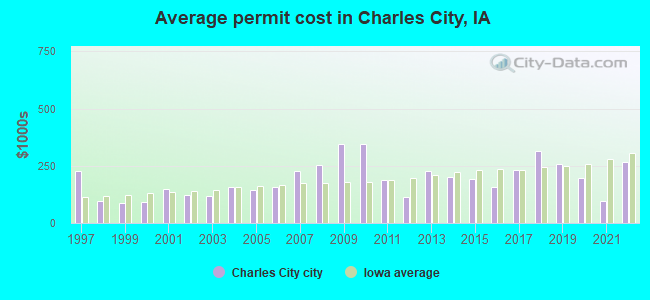
Single-family new house construction building permits:
2022: 4 buildings , average cost: $265,0002021: 3 buildings , average cost: $95,0002020: 2 buildings , average cost: $197,5002019: 1 building , cost: $260,0002018: 3 buildings , average cost: $315,2002017: 1 building , cost: $230,0002016: 6 buildings , average cost: $158,3002015: 5 buildings , average cost: $191,7002014: 4 buildings , average cost: $201,3002013: 12 buildings , average cost: $228,8002012: 1 building , cost: $112,1002011: 1 building , cost: $186,1002010: 1 building , cost: $344,1002009: 1 building , cost: $344,1002008: 5 buildings , average cost: $255,1002007: 7 buildings , average cost: $225,9002006: 14 buildings , average cost: $155,8002005: 11 buildings , average cost: $144,0002004: 22 buildings , average cost: $156,1002003: 12 buildings , average cost: $118,6002002: 13 buildings , average cost: $123,8002001: 10 buildings , average cost: $149,8002000: 3 buildings , average cost: $91,3001999: 4 buildings , average cost: $86,0001998: 4 buildings , average cost: $96,4001997: 4 buildings , average cost: $229,200Unemployment in December 2023:
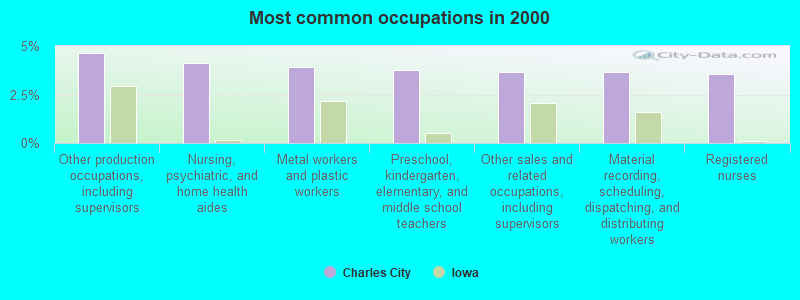
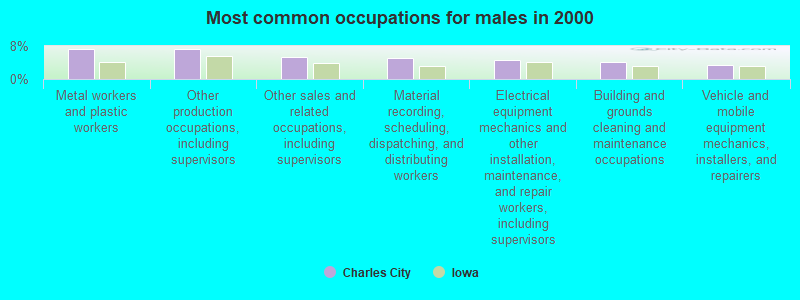
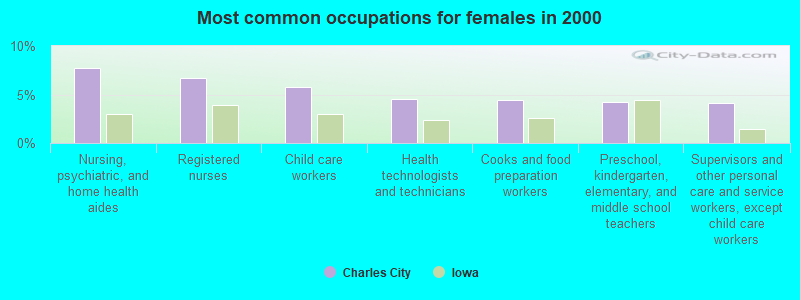
Most common occupations in Charles City, IA (%)
Both Males Females
Other production occupations, including supervisors (4.7%)
Nursing, psychiatric, and home health aides (4.1%)
Metal workers and plastic workers (3.9%)
Preschool, kindergarten, elementary, and middle school teachers (3.8%)
Other sales and related occupations, including supervisors (3.7%)
Material recording, scheduling, dispatching, and distributing workers (3.6%)
Registered nurses (3.5%)
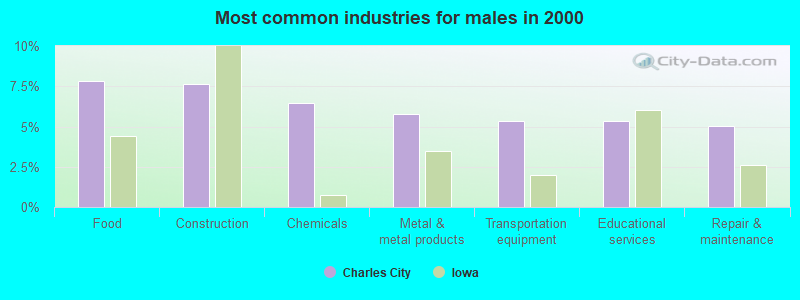
Metal workers and plastic workers (7.3%)
Other production occupations, including supervisors (7.2%)
Other sales and related occupations, including supervisors (5.2%)
Material recording, scheduling, dispatching, and distributing workers (5.0%)
Electrical equipment mechanics and other installation, maintenance, and repair workers, including supervisors (4.7%)
Building and grounds cleaning and maintenance occupations (4.0%)
Vehicle and mobile equipment mechanics, installers, and repairers (3.4%)
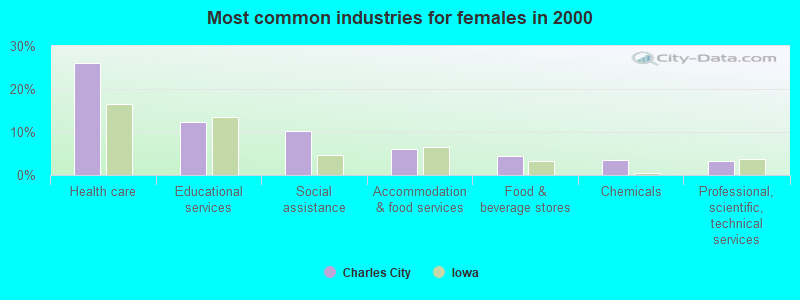
Nursing, psychiatric, and home health aides (7.8%)
Registered nurses (6.7%)
Child care workers (5.8%)
Health technologists and technicians (4.6%)
Cooks and food preparation workers (4.4%)
Preschool, kindergarten, elementary, and middle school teachers (4.2%)
Supervisors and other personal care and service workers, except child care workers (4.2%)
Tornado activity:
Charles City-area historical tornado activity is near Iowa state average. It is 89% greater than the overall U.S. average.
On 5/15/1968, a category F5 (max. wind speeds 261-318 mph) tornado 30.4 miles away from the Charles City city center killed 13 people and injured 462 people and caused between $5,000,000 and $50,000,000 in damages.
On 7/12/1971, a category F4 (max. wind speeds 207-260 mph) tornado 16.1 miles away from the city center injured 8 people and caused between $500,000 and $5,000,000 in damages.
Earthquake activity:
Charles City-area historical earthquake activity is significantly above Iowa state average. It is 111% greater than the overall U.S. average. On 7/9/1975 at 14:54:15, a magnitude 4.6 (4.6 MB, Class: Light, Intensity: IV - V) earthquake occurred 245.1 miles away from Charles City center On 4/18/2008 at 09:36:59, a magnitude 5.4 (5.1 MB, 4.8 MS, 5.4 MW, 5.2 MW, Class: Moderate, Intensity: VI - VII) earthquake occurred 405.9 miles away from the city center On 6/28/2004 at 06:10:52, a magnitude 4.2 (4.2 MW, Depth: 6.2 mi) earthquake occurred 222.9 miles away from the city center On 6/10/1987 at 23:48:54, a magnitude 5.1 (4.9 MB, 4.4 MS, 4.6 MS, 5.1 LG) earthquake occurred 385.7 miles away from the city center On 4/18/2008 at 09:36:59, a magnitude 5.2 (5.2 MW, Depth: 8.9 mi) earthquake occurred 405.9 miles away from the city center On 9/3/2016 at 12:02:44, a magnitude 5.8 (5.8 MW, Depth: 3.5 mi) earthquake occurred 511.9 miles away from the city center Magnitude types: regional Lg-wave magnitude (LG), body-wave magnitude (MB), surface-wave magnitude (MS), moment magnitude (MW) Natural disasters: The number of natural disasters in Floyd County (16) is near the US average (15).Major Disasters (Presidential) Declared: 14Emergencies Declared: 1Floods: 12, Storms: 10, Tornadoes: 6, Winds: 2, Heavy Rain: 1, Hurricane: 1, Winter Storm: 1, Other: 1 (Note: some incidents may be assigned to more than one category). Hospitals and medical centers in Charles City: BURLING HOUSE (910 FIRST AVENUE) CREST VIEW GROUP HOME (1700 CLARK STREET) FLOYD COUNTY MEMORIAL HOSPITAL (Government - Local, provides emergency services, 800 11TH ST) FOURTH AVENUE GROUP HOME (710 FOURTH AVENUE) CEDAR HEALTH (807 FIFTH STREET)
CHAUTAUQUA GUEST HOME #1 (120 CHAUTAUQUA AVENUE)
CHAUTAUQUA GUEST HOME #2 (602 ELEVENTH STREET)
CHAUTAUQUA GUEST HOME #3 (302 NINTH STREET)
NORTH IOWA MERCY DIALYSIS CENTER - CHARLES CITY (707 GILBERT ST.)
FLOYD COUNTY PUBLIC HEALTH/HOME HEALTH CARE (1003 GILBERT STREET)
Colleges/universities with over 2000 students nearest to Charles City:
North Iowa Area Community College (about 24 miles; Mason City, IA ; Full-time enrollment: 2,235)
University of Northern Iowa (about 40 miles; Cedar Falls, IA ; FT enrollment: 10,816)
Northeast Iowa Community College-Calmar (about 42 miles; Calmar, IA ; FT enrollment: 3,365)
Riverland Community College (about 46 miles; Austin, MN ; FT enrollment: 2,321)
Upper Iowa University (about 48 miles; Fayette, IA ; FT enrollment: 5,275)
Luther College (about 48 miles; Decorah, IA ; FT enrollment: 2,700)
Hawkeye Community College (about 48 miles; Waterloo, IA ; FT enrollment: 7,160)
Public high schools in Charles City:
Public elementary/middle schools in Charles City:
Private elementary/middle school in Charles City:
See full list of schools located in Charles City Library in Charles City: CHARLES CITY PUBLIC LIBRARY Operating income: $369,886; Location: 106 MILWAUKEE MALL; 56,043 books ; 2,021 audio materials ; 1,163 video materials ; 1 local licensed databases ; 13 state licensed databases ; 1 other licensed databases ; 160 print serial subscriptions ; 1,988 electronic serial subscriptions )
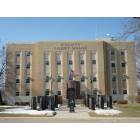
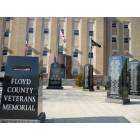
Notable locations in Charles City: (A) , R Campground (B) , Farmers Feed and Grain Elevator (C) , Wildwood Golf Course (D) , American Medical Response (E) , Floyd County Search and Rescue (F) , Floyd County Sheriffs Department (G) , Floyd County Courthouse (H) , Floyd County Historical Society Museum (I) , Charles City Public Library (J) , Charles City Police Station (K) , Charles City Fire Department (L) , Carrie Lane Chapman Catt Home (M) , Charles City City Hall (N) . Display/hide their locations on the map
Shopping Centers: (1) , Kelly Mall (2) . Display/hide their locations on the map
Churches in Charles City include: (A) , Evangelical Free Church (B) , Messiah Lutheran Church (C) , Grace Episcopal Church (D) , Temple Baptist Church (E) , First Baptist Church (F) , Immaculate Conception Church (G) , Bethany Alliance Church (H) , Seventh Day Adventist Church (I) . Display/hide their locations on the map
Cemeteries: (1) , Calvary Cemetery (2) . Display/hide their locations on the map
Parks in Charles City include: (1) , Riverside Park (2) , Mill Race Park (3) , Andres Memorial Park (4) , City Improvement Association Park (5) , Memorial Park (6) , Merten J Klaus Park (7) , Dana park (8) , Sunset Park (9) . Display/hide their locations on the map
Tourist attraction:
Hotels:
Courts:
Birthplace of: George Nelson (astronaut), Jeff Betts - Soccer player-coach, Paul F. Riordan - Army Medal of Honor recipient, Greg Brunner - College basketball player (Iowa Hawkeyes), Mark Kuhn - Politician, Marlys Millhiser - Horror writer.
Floyd County has a predicted average indoor radon screening level greater than 4 pCi/L (pico curies per liter) - Highest Potential Drinking water stations with addresses in Charles City and their reported violations in the past:
CHARLES CITY WATER SUPPLY (Address: 105 MILWAUKEE MALL Population served: 7,702, Groundwater):
Past monitoring violations:
Monitoring and Reporting (DBP) - Between JUL-2005 and AUG-2007, Contaminant: Total Haloacetic Acids (HAA5). Follow-up actions: St Public Notif requested (OCT-29-2007), St Formal NOV issued (OCT-29-2007), St BCA signed (2 times from FEB-04-2008 to FEB-04-2008), St Public Notif received (MAR-12-2008), St Compliance achieved (2 times from AUG-12-2008 to AUG-12-2008)
One regular monitoring violation
Address: 2192 OLD HWY ROAD S Population served: 37, Groundwater):
Past health violations:
MCL, Monthly (TCR) - Between APR-2011 and JUN-2011, Contaminant: Coliform. Follow-up actions: St Violation/Reminder Notice (JUN-27-2011), St Formal NOV issued (JUL-01-2011), St Public Notif requested (JUL-01-2011), St Compliance achieved (JUL-13-2011), St Public Notif received (JUL-15-2011)
Past monitoring violations:
One regular monitoring violation
Average household size: This city:
2.1 peopleIowa:
2.4 people
Percentage of family households: This city:
57.1%Whole state:
64.7%
Percentage of households with unmarried partners: This city:
5.9%Whole state:
6.7%
Likely homosexual households (counted as self-reported same-sex unmarried-partner households)
Lesbian couples: 0.2% of all households Gay men: 0.1% of all households
People in group quarters in Charles City in 2010:
174 people in nursing facilities/skilled-nursing facilities
41 people in group homes for juveniles (non-correctional)
24 people in group homes intended for adults
People in group quarters in Charles City in 2000:
272 people in nursing homes
39 people in other group homes
29 people in homes for the mentally retarded
24 people in other workers' dormitories
12 people in other noninstitutional group quarters
8 people in local jails and other confinement facilities (including police lockups)
4 people in religious group quarters
Banks with branches in Charles City (2011 data):
First Security Bank and Trust Company: First Security Bank And Trust Compan at 809 Clark Street, branch established on 1903/07/14. Info updated 2009/11/23: Bank assets: $430.7 mil, Deposits: $342.8 mil, local headquarters , positive income , Agricultural Specialization, 14 total offices , Holding Company: Cedar Valley Bankshares, Ltd.
State Bank & Trust Company: Security State Bank Branch at 610 Gilbert St, branch established on 2007/06/30. Info updated 2011/10/04: Bank assets: $337.3 mil, Deposits: $279.9 mil, headquarters in New Hampton, IA, positive income , Agricultural Specialization, 10 total offices , Holding Company: Rigler Investment Company
C US Bank: Charles City Branch at 1407 South Grand Avenue, branch established on 2000/06/01. Info updated 2008/07/31: Bank assets: $344.2 mil, Deposits: $281.3 mil, headquarters in Cresco, IA, positive income , Agricultural Specialization, 5 total offices , Holding Company: How-Win Development Co.
First Citizens National Bank: 300 Main Branch at 300 North Main Street, branch established on 1994/12/05. Info updated 2006/11/03: Bank assets: $1,022.1 mil, Deposits: $744.4 mil, headquarters in Mason City, IA, positive income , Agricultural Specialization, 10 total offices , Holding Company: First Citizens Financial Corp.
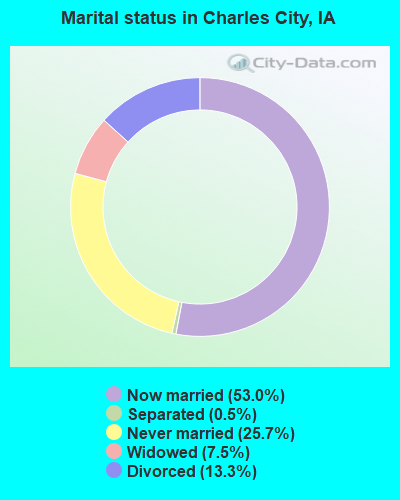
For population 15 years and over in Charles City:
Never married: 25.7%Now married: 53.0%Separated: 0.5%Widowed: 7.5%Divorced: 13.3% For population 25 years and over in Charles City:
High school or higher: 92.4%Bachelor's degree or higher: 16.5%Graduate or professional degree: 4.6%Unemployed: 4.8%Mean travel time to work (commute): 12.8 minutes
Education Gini index (Inequality in education) Here:
9.1Iowa average:
10.5
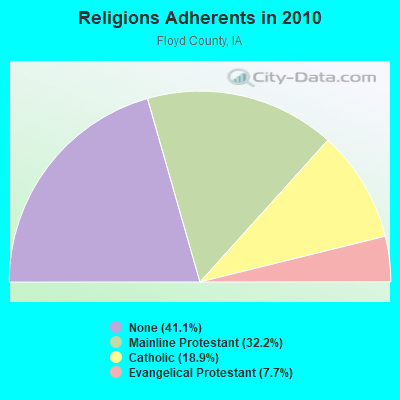
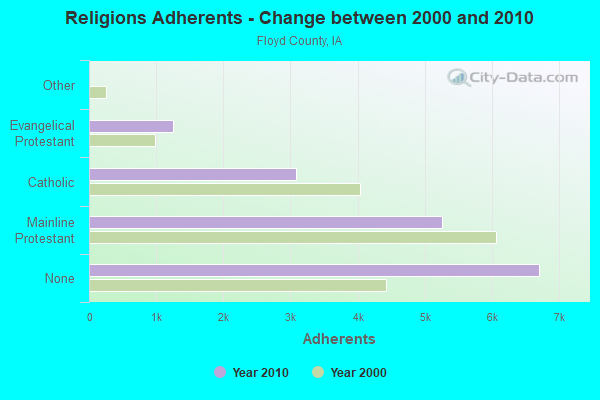
Religion statistics for Charles City, IA (based on Floyd County data)
Religion Adherents Congregations Mainline Protestant 5,256 18 Catholic 3,080 3 Evangelical Protestant 1,255 13 Other 4 2 None 6,708 -
Source: Clifford Grammich, Kirk Hadaway, Richard Houseal, Dale E.Jones, Alexei Krindatch, Richie Stanley and Richard H.Taylor. 2012. 2010 U.S.Religion Census: Religious Congregations & Membership Study. Association of Statisticians of American Religious Bodies. Jones, Dale E., et al. 2002. Congregations and Membership in the United States 2000. Nashville, TN: Glenmary Research Center. Graphs represent county-level data
Food Environment Statistics: Number of grocery stores : 3This county :
1.84 / 10,000 pop.State :
2.14 / 10,000 pop.
Number of convenience stores (no gas) : 3This county :
1.84 / 10,000 pop.Iowa :
0.43 / 10,000 pop.
Number of convenience stores (with gas) : 8Floyd County :
4.92 / 10,000 pop.Iowa :
5.55 / 10,000 pop.
Number of full-service restaurants : 19Floyd County :
11.68 / 10,000 pop.State :
8.01 / 10,000 pop.
Adult obesity rate : Floyd County :
28.4%Iowa :
27.3%
Low-income preschool obesity rate : Health and Nutrition: Healthy diet rate : Charles City:
52.4%State:
49.5%
Average overall health of teeth and gums : Charles City:
49.1%Iowa:
46.1%
People feeling badly about themselves : People not drinking alcohol at all : This city:
9.7%State:
10.4%
Average hours sleeping at night : Charles City:
7.0State:
6.8
General health condition : Average condition of hearing : More about Health and Nutrition of Charles City, IA Residents
Local government employment and payroll (March 2022)
Function
Full-time employees
Monthly full-time payroll
Average yearly full-time wage
Part-time employees
Monthly part-time payroll
Police Protection - Officers
12 $78,379 $78,379 0 $0 Streets and Highways
7 $32,794 $56,218 0 $0 Other Government Administration
6 $34,857 $69,714 1 $185 Water Supply
5 $34,552 $82,925 0 $0 Housing and Community Development (Local)
5 $21,361 $51,266 0 $0 Firefighters
4 $21,680 $65,040 1 $66 Sewerage
4 $19,377 $58,131 0 $0 Local Libraries
4 $13,264 $39,792 7 $4,382 Parks and Recreation
3 $12,960 $51,840 0 $0 Transit
2 $11,762 $70,572 7 $18,485 Other and Unallocable
2 $10,128 $60,768 0 $0 Welfare
1 $4,006 $48,072 2 $1,359 Police - Other
1 $1,780 $21,360 0 $0
Totals for Government
56 $296,900 $63,621 18 $24,477
Charles City government finances - Expenditure in 2021 (per resident):
Construction - Sewerage: $11,064,000 ($1528.39)
General - Other: $4,098,000 ($566.10)Current Operations - Housing and Community Development: $1,739,000 ($240.23)
Water Utilities: $1,675,000 ($231.39)Police Protection: $1,613,000 ($222.82)Sewerage: $1,412,000 ($195.05)General - Other: $1,285,000 ($177.51)Regular Highways: $1,171,000 ($161.76)Solid Waste Management: $695,000 ($96.01)Parks and Recreation: $691,000 ($95.46)Local Fire Protection: $612,000 ($84.54)Protective Inspection and Regulation - Other: $457,000 ($63.13)Libraries: $417,000 ($57.60)Transit Utilities: $382,000 ($52.77)Public Welfare - Other: $265,000 ($36.61)Central Staff Services: $131,000 ($18.10)Health - Other: $115,000 ($15.89)Financial Administration: $112,000 ($15.47)Air Transportation: $77,000 ($10.64)General Public Buildings: $54,000 ($7.46)Judicial and Legal Services: $36,000 ($4.97)General - Interest on Debt: $255,000 ($35.23)
Total Salaries and Wages: $3,476,000 ($480.18)
Water Utilities - Interest on Debt: $134,000 ($18.51)
Charles City government finances - Revenue in 2021 (per resident):
Charges - Sewerage: $2,007,000 ($277.25)
Solid Waste Management: $693,000 ($95.73)Other: $504,000 ($69.62)Parks and Recreation: $185,000 ($25.56)Federal Intergovernmental - Other: $1,519,000 ($209.84)
Housing and Community Development: $427,000 ($58.99)Health and Hospitals: $338,000 ($46.69)Local Intergovernmental - Other: $478,000 ($66.03)
Miscellaneous - Rents: $589,000 ($81.36)
Interest Earnings: $44,000 ($6.08)Fines and Forfeits: $36,000 ($4.97)General Revenue - Other: $32,000 ($4.42)Sale of Property: $15,000 ($2.07)Revenue - Water Utilities: $2,407,000 ($332.50)
Transit Utilities: $30,000 ($4.14)State Intergovernmental - Highways: $1,180,000 ($163.01)
Other: $980,000 ($135.38)General Local Government Support: $152,000 ($21.00)Tax - Property: $4,814,000 ($665.01)
General Sales and Gross Receipts: $833,000 ($115.07)Public Utilities Sales: $190,000 ($26.25)Other License: $106,000 ($14.64)Other Selective Sales: $93,000 ($12.85)
Charles City government finances - Debt in 2021 (per resident):
Long Term Debt - Beginning Outstanding - Unspecified Public Purpose: $17,304,000 ($2390.39)
Outstanding Unspecified Public Purpose: $15,913,000 ($2198.23)Retired Unspecified Public Purpose: $1,611,000 ($222.54)Issue, Unspecified Public Purpose: $220,000 ($30.39)
Charles City government finances - Cash and Securities in 2021 (per resident):
Other Funds - Cash and Securities: $12,858,000 ($1776.21)
Businesses in Charles City, IA
Name Count Name Count
Ace Hardware 1 Nike 1 AutoZone 1 Pizza Hut 1 Chevrolet 1 RadioShack 1 Curves 1 Sleep Inn 1 Dairy Queen 1 Subway 1 FedEx 1 Super 8 1 Ford 1 U-Haul 1 H&R Block 1 U.S. Cellular 2 Kmart 1 UPS 2 La-Z-Boy 1 YMCA 1 McDonald's 1
Strongest AM radio stations in Charles City:
KCHA (1580 AM; 0 kW; CHARLES CITY, IA; Owner: CLEAR CHANNEL BROADCASTING LICENSES, INC.)
KXEL (1540 AM; 50 kW; WATERLOO, IA; Owner: KXEL BROADCASTING COMPANY, INC.)
KCNZ (1250 AM; 10 kW; CEDAR FALLS, IA; Owner: FIFE COMMUNICATION COMPANY, L.C.)
KGLO (1300 AM; 5 kW; MASON CITY, IA; Owner: CLEAR CHANNEL BROADCASTING LICENSES, INC.)
WHO (1040 AM; 50 kW; DES MOINES, IA; Owner: CITICASTERS LICENSES, L.P.)
KFAN (1130 AM; 50 kW; MINNEAPOLIS, MN; Owner: AMFM RADIO LICENSES, L.L.C.)
WCTS (1030 AM; 50 kW; MAPLEWOOD, MN; Owner: CNTL. BAPT. THEO/AL SEMI MINNEAPOLIS)
KDNZ (1650 AM; 10 kW; CEDAR FALLS, IA; Owner: FIFE COMMUNICATIONS CO., LLC)
WCCO (830 AM; 50 kW; MINNEAPOLIS, MN; Owner: INFINITY MEDIA CORPORATION)
KNFX (970 AM; 5 kW; AUSTIN, MN; Owner: CLEAR CHANNEL BROADCASTING LICENSES, INC.)
KKHQ (950 AM; 5 kW; OELWEIN, IA; Owner: CUMULUS LICENSING CORP.)
KSTP (1500 AM; 50 kW; ST. PAUL, MN; Owner: KSTP-AM, LLC (DELAWARE))
KWLO (1330 AM; 5 kW; WATERLOO, IA; Owner: KXEL BROADCASTING COMPANY, INC.)
Strongest FM radio stations in Charles City:
KCHA-FM (95.9 FM; CHARLES CITY, IA; Owner: CLEAR CHANNEL BROADCASTING LICENSES, INC.)
KLSS-FM (106.1 FM; MASON CITY, IA; Owner: THREE EAGLES OF MASON CITY, INC.)
KOEL-FM (92.3 FM; OELWEIN, IA; Owner: CUMULUS LICENSING CORP.)
KROC-FM (106.9 FM; ROCHESTER, MN; Owner: SOUTHERN MINNESOTA BROADCASTING CO.)
KIAI (93.9 FM; MASON CITY, IA; Owner: CLEAR CHANNEL BROADCASTING LICENSES, INC.)
KCZE (95.1 FM; NEW HAMPTON, IA; Owner: CLEAR CHANNEL BROADCASTING LICENSES, INC.)
KUNY (91.5 FM; MASON CITY, IA; Owner: UNIVERSITY OF NORTHERN IOWA)
KJCY (95.5 FM; ST. ANSGAR, IA; Owner: MINN-IOWA CHRISTIAN BROADCASTING, INC.)
TV broadcast stations around Charles City:
KYIN (Channel 24; MASON CITY, IA; Owner: IOWA PUBLIC BROADCASTING BOARD)
KIMT (Channel 3; MASON CITY, IA; Owner: MEDIA GENERAL BROADCASTING OF SO. CAROLINA HOLDINGS, INC.)
KTTC (Channel 10; ROCHESTER, MN; Owner: KTTC TELEVISION, INC.)
KSMQ-TV (Channel 15; AUSTIN, MN; Owner: INDEPENDENT SCHOOL DISTRICT #492)
Medal of Honor Recipients
Medal of Honor Recipient born in Charles City: Paul F. Riordan.
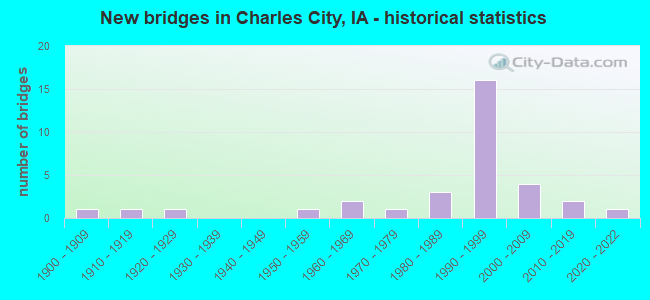
National Bridge Inventory (NBI) Statistics 33 Number of bridges390ft / 119m Total length $3,270,000 Total costs82,845 Total average daily traffic19,457 Total average daily truck traffic
New bridges - historical statistics
1 1900-1909 1 1910-1919 1 1920-1929 1 1950-1959 2 1960-1969 1 1970-1979 3 1980-1989 16 1990-1999 4 2000-2009 2 2010-2019 1 2020-2022
See full National Bridge Inventory statistics for Charles City, IA
Fire-safe hotels and motels in Charles City, Iowa:
Super 8, 1411 S Grand Ave, Charles City, Iowa 50616 Phone: (641) 228-2888, Fax: (641) 228-1572
Hartwood Inn, 1312 Gilbert St, Charles City, Iowa 50616 Phone: (641) 228-4352, Fax: (641) 257-2488
All 2 fire-safe hotels and motels in Charles City, Iowa
Most common first names in Charles City, IA among deceased individuals Name Count Lived (average)
John 96 78.9 years William 94 77.7 years Robert 80 72.9 years Mary 62 81.1 years Ruth 58 82.0 years Charles 58 77.6 years Dorothy 55 80.4 years James 55 71.4 years George 51 79.5 years Harold 51 74.2 years
Most common last names in Charles City, IA among deceased individuals Last name Count Lived (average)
Smith 47 79.0 years Meyer 35 81.8 years Johnson 28 78.7 years Miller 28 81.4 years Anderson 24 83.5 years Martin 21 82.5 years Peterson 20 83.5 years Brown 20 80.6 years Hoeft 19 78.4 years Fisher 17 77.5 years
Charles City compared to Iowa state average:
Median house value below state average. Unemployed percentage below state average. Black race population percentage below state average. Length of stay since moving in significantly above state average. Number of college students below state average. Charles City on our top lists :
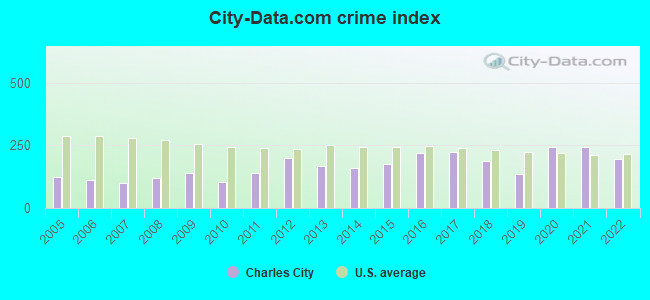
#12 on the list of "Top 101 cities with the largest city-data.com crime index increase from 2011 to 2012 (population 5,000+)"
#86 on the list of "Top 101 cities with the largest percentage of people in other workers' dormitories (population 1,000+)"
Top Patent Applicants
Alexander C. Everett (2)
Matthew Wendell Schiesher (2)
Judi Christine Humphrey (1)
Greg Buenger (1)
Steve Smith (1)
Kenneth J. Potempa (1)
Vince Rottinghaus (1)
Randy D. Sonne (1)
Kezia Peixoto Schutz (1)
Erik Michalson (1)
Total of 17 patent applications in 2008-2024.


 Recent articles from our blog. Our writers, many of them Ph.D. graduates or candidates, create easy-to-read articles on a wide variety of topics.


 (43.1 miles
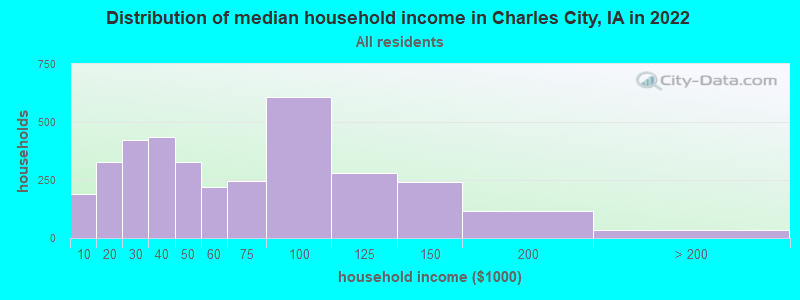


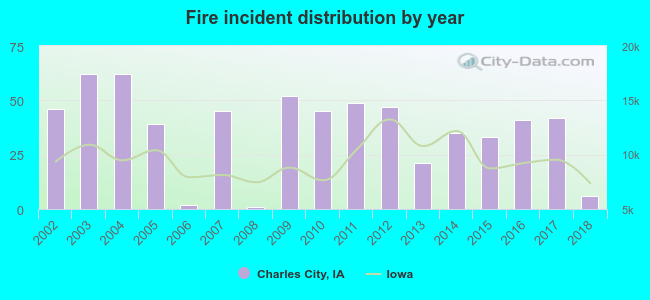 According to the data from the years 2002 - 2018 the average number of fires per year is 37. The highest number of reported fire incidents - 62 took place in 2003, and the least - 1 in 2008. The data has a declining trend.
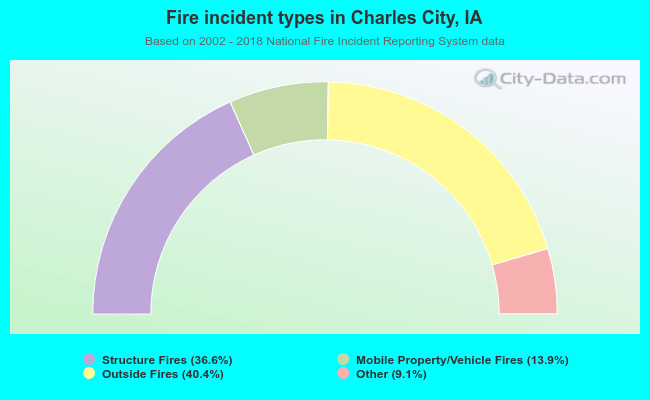 When looking into fire subcategories, the most reports belonged to: Outside Fires (40.4%), and Structure Fires (36.6%).