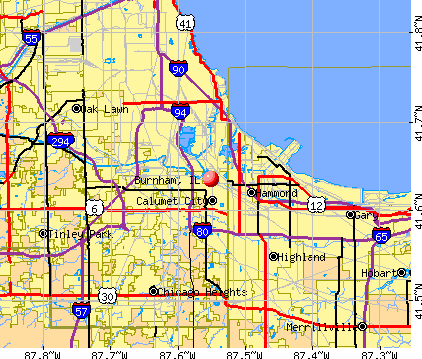
Burnham, Illinois
Submit your own pictures of this village and show them to the world
- OSM Map
- General Map
- Google Map
- MSN Map
Population change since 2000: -6.4%
 |
| Males: 1,696 | |
| Females: 2,209 |
| Median resident age: | 37.3 years |
| Illinois median age: | 39.1 years |
Zip codes: 60633.
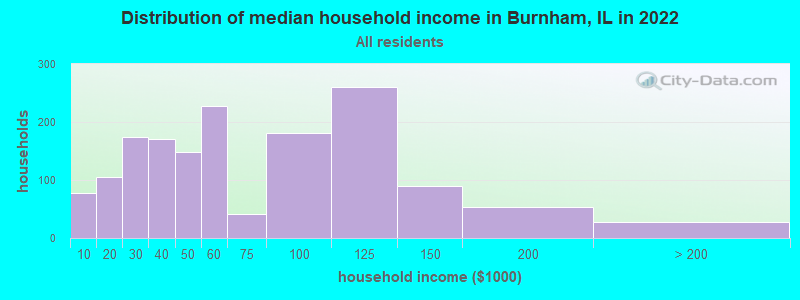
| Burnham: | $52,257 |
| IL: | $76,708 |
Estimated per capita income in 2022: $26,841 (it was $16,747 in 2000)
Burnham village income, earnings, and wages data
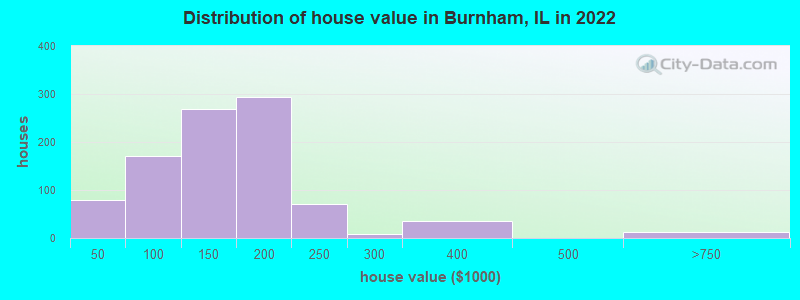
Estimated median house or condo value in 2022: $145,620 (it was $89,400 in 2000)
| Burnham: | $145,620 |
| IL: | $251,600 |
Mean prices in 2022: all housing units: $134,932; detached houses: $140,691; townhouses or other attached units: $147,500; in 2-unit structures: $127,471; in 5-or-more-unit structures: $58,470; mobile homes: $76,601
Median gross rent in 2022: $1,108.
(17.4% for White Non-Hispanic residents, 11.7% for Black residents, 6.4% for Hispanic or Latino residents, 3.5% for other race residents, 22.2% for two or more races residents)
Detailed information about poverty and poor residents in Burnham, IL
Compare current foreclosures near Burnham, IL:
| Photo | Address | Area | Beds / Baths | Price | Details |
|---|---|---|---|---|---|

|
#1
Wabash Ave
Hammond, IN 46327
|
1,824 sq. feet
|
2 baths 4 beds |
$299,900
|
show details |

|
#2
S Emerald Ave
Chicago, IL 60620
|
1,080 sq. feet
|
1 baths 2 beds |
$34,900
|
show details |

|
#3
Whitman Ave
Hazel Crest, IL 60429
|
1,360 sq. feet
|
2 baths 2 beds |
$137,900
|
show details |

|
#4
S Main St
Hometown, IL 60456
|
744 sq. feet
|
1 baths 2 beds |
$175,000
|
show details |

|
#5
W 50th St
Chicago, IL 60609
|
- sq. feet
|
2 baths 6 beds |
$109,200
|
show details |

|
#6
S King Dr
Chicago, IL 60619
|
880 sq. feet
|
1 baths 2 beds |
$79,400
|
show details |

|
#7
S Ada St
Chicago, IL 60636
|
2,619 sq. feet
|
2 baths 6 beds |
$244,400
|
show details |

|
#8
Richton Rd
Steger, IL 60475
|
1,400 sq. feet
|
1 baths 3 beds |
$209,900
|
show details |

|
#9
Marquette Ave
Calumet City, IL 60409
|
1,316 sq. feet
|
1 baths 3 beds |
$144,000
|
show details |

|
#10
176th Pl
Lansing, IL 60438
|
1,511 sq. feet
|
1 baths 2 beds |
$168,480
|
show details |
| Photo | Address | Area | Beds / Baths | Price | Details |
|---|---|---|---|---|---|

|
#11
W 108th St Apt D
Chicago, IL 60643
|
1,300 sq. feet
|
2 baths 3 beds |
$144,900
|
show details |

|
#12
S 87th Ave
Justice, IL 60458
|
2,725 sq. feet
|
3 baths 4 beds |
$585,000
|
show details |

|
#13
Ellsworth Pl
Gary, IN 46408
|
1,248 sq. feet
|
1 baths 2 beds |
$69,900
|
show details |

|
#14
W 53rd Ln
Merrillville, IN 46410
|
1,194 sq. feet
|
1 baths 3 beds |
$230,000
|
show details |

|
#15
S Normal Ave
Chicago, IL 60628
|
989 sq. feet
|
1 baths 3 beds |
$154,375
|
show details |

|
#16
Greenwood Rd Apt B210
Dolton, IL 60419
|
900 sq. feet
|
1 baths 2 beds |
$85,000
|
show details |

|
#17
S Tripp Ave
Oak Lawn, IL 60453
|
1,591 sq. feet
|
1 baths 3 beds |
$212,000
|
show details |

|
#18
- 24 S Kimbark Unit 105
Chicago, IL 60637
|
600 sq. feet
|
1 baths 1 beds |
$137,000
|
show details |

|
#19
N Bruce Ln Apt 311
Glenwood, IL 60425
|
1,000 sq. feet
|
2 baths 2 beds |
$185,000
|
show details |

|
#20
S Union Ave
Chicago, IL 60620
|
1,920 sq. feet
|
2 baths 4 beds |
$75,000
|
show details |
| Photo | Address | Area | Beds / Baths | Price | Details |
|---|---|---|---|---|---|

|
#21
Finch Ave
Harvey, IL 60426
|
1,108 sq. feet
|
2 baths 3 beds |
$225,000
|
show details |

|
#22
Dorchester Ave
Dolton, IL 60419
|
925 sq. feet
|
1 baths 3 beds |
$76,100
|
show details |

|
#23
Peoria St
Steger, IL 60475
|
616 sq. feet
|
1 baths 2 beds |
$78,500
|
show details |

|
#24
S Vanderpoel Ave
Chicago, IL 60643
|
2,352 sq. feet
|
2 baths 7 beds |
$115,000
|
show details |

|
#25
S Bennett Ave
Chicago, IL 60617
|
1,052 sq. feet
|
1 baths 3 beds |
$265,000
|
show details |

|
#26
W 100th Pl
Chicago, IL 60628
|
971 sq. feet
|
1 baths 2 beds |
$233,000
|
show details |

|
#27
W 21st St # 1
Chicago, IL 60608
|
1,250 sq. feet
|
1 baths 3 beds |
$219,900
|
show details |

|
#28
W 63rd St
Chicago, IL 60638
|
1,250 sq. feet
|
2 baths 4 beds |
$385,000
|
show details |

|
#29
S Calumet Ave
Chicago, IL 60628
|
3,690 sq. feet
|
3 baths 6 beds |
$260,000
|
show details |

|
#30
Idlewild Dr
Country Club Hills, IL 60478
|
1,300 sq. feet
|
1 baths 3 beds |
$279,900
|
show details |
| Photo | Address | Area | Beds / Baths | Price | Details |
|---|---|---|---|---|---|

|
#31
Hellenic Dr
Olympia Fields, IL 60461
|
4,000 sq. feet
|
3 baths 4 beds |
$495,000
|
show details |

|
#32
S Crandon Ave # 319
Chicago, IL 60649
|
1,271 sq. feet
|
2 baths 2 beds |
$146,900
|
show details |

|
#33
S Yale Ave
Chicago, IL 60628
|
1,608 sq. feet
|
2 baths 3 beds |
$270,000
|
show details |

|
#34
Lincoln Ave
Dolton, IL 60419
|
1,966 sq. feet
|
2 baths 3 beds |
$69,900
|
show details |

|
#35
S South Shore Dr Apt 1201
Chicago, IL 60649
|
1,100 sq. feet
|
2 baths 2 beds |
$179,000
|
show details |

|
#36
S East End Ave # 2
Chicago, IL 60649
|
1,200 sq. feet
|
2 baths 2 beds |
$137,000
|
show details |

|
#37
Tarpon Ct
Homewood, IL 60430
|
1,800 sq. feet
|
3 baths 4 beds |
$355,000
|
show details |

|
#38
145th St
Midlothian, IL 60445
|
2,000 sq. feet
|
1 baths 3 beds |
$179,900
|
show details |

|
#39
W Garfield Blvd
Chicago, IL 60636
|
2,820 sq. feet
|
2 baths 5 beds |
$132,500
|
show details |

|
#40
E 46th St
Chicago, IL 60653
|
2,126 sq. feet
|
2 baths 2 beds |
$289,000
|
show details |
| Photo | Address | Area | Beds / Baths | Price | Details |
|---|---|---|---|---|---|

|
#41
W Arquilla Dr
Palos Heights, IL 60463
|
1,780 sq. feet
|
2 baths 2 beds |
$299,900
|
show details |

|
#42
S Charles St
Chicago, IL 60643
|
- sq. feet
|
4 baths 6 beds |
$349,900
|
show details |

|
#43
Michigan City Rd Apt 3c
Calumet City, IL 60409
|
- sq. feet
|
1 baths 1 beds |
$17,900
|
show details |

|
#44
W 95th Pl
Chicago, IL 60628
|
- sq. feet
|
1 baths 3 beds |
$114,400
|
show details |

|
#45
Laramie Ave Apt 214
Midlothian, IL 60445
|
1,200 sq. feet
|
2 baths 2 beds |
show details | |

|
#46
S Rockwell St
Chicago, IL 60632
|
3,554 sq. feet
|
3 baths 6 beds |
show details | |

|
#47
Spring Creek Dr
Highland, IN 46322
|
1,200 sq. feet
|
2 baths 2 beds |
show details | |

|
#48
Peterson Ave
Chicago Heights, IL 60411
|
1,840 sq. feet
|
2 baths 3 beds |
show details | |

|
#49
S La Salle St
Chicago, IL 60628
|
1,919 sq. feet
|
2 baths 6 beds |
show details | |

|
Check over 1 million property listings on Foreclosure.com!
|
browse all offers | |||


- 2,50263.5%Black alone
- 95324.2%Hispanic
- 39510.0%White alone
- 290.7%Two or more races
- 80.2%Asian alone
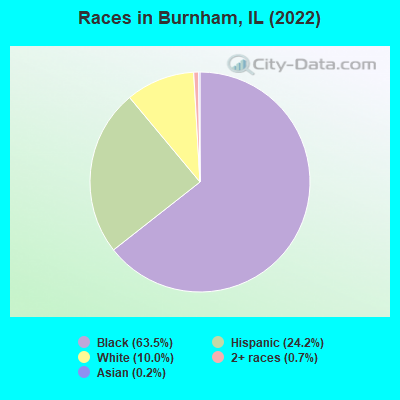
Races in Burnham detailed stats: ancestries, foreign born residents, place of birth
According to our research of Illinois and other state lists, there were 9 registered sex offenders living in Burnham, Illinois as of May 23, 2024.
The ratio of all residents to sex offenders in Burnham is 466 to 1.
Type |
2010 |
2011 |
2012 |
2013 |
2014 |
2015 |
2016 |
2017 |
|---|---|---|---|---|---|---|---|---|
| Murders (per 100,000) | 1 (23.8) | 2 (47.4) | 1 (23.7) | 0 (0.0) | 0 (0.0) | 0 (0.0) | 2 (47.5) | 1 (24.0) |
| Rapes (per 100,000) | 2 (47.6) | 2 (47.4) | 3 (71.0) | 4 (94.4) | 1 (23.6) | 0 (0.0) | 0 (0.0) | 3 (72.1) |
| Robberies (per 100,000) | 12 (285.3) | 14 (331.8) | 5 (118.3) | 6 (141.5) | 1 (23.6) | 0 (0.0) | 7 (166.3) | 2 (48.0) |
| Assaults (per 100,000) | 12 (285.3) | 7 (165.9) | 2 (47.3) | 7 (165.1) | 2 (47.2) | 11 (259.9) | 3 (71.3) | 1 (24.0) |
| Burglaries (per 100,000) | 41 (974.8) | 43 (1,019) | 46 (1,088) | 50 (1,180) | 25 (590.2) | 20 (472.5) | 27 (641.5) | 5 (120.1) |
| Thefts (per 100,000) | 80 (1,902) | 86 (2,038) | 75 (1,775) | 103 (2,430) | 79 (1,865) | 81 (1,914) | 52 (1,235) | 25 (600.5) |
| Auto thefts (per 100,000) | 10 (237.8) | 26 (616.3) | 39 (922.9) | 19 (448.2) | 17 (401.3) | 11 (259.9) | 18 (427.7) | 9 (216.2) |
| Arson (per 100,000) | 0 (0.0) | 0 (0.0) | 1 (23.7) | 0 (0.0) | 0 (0.0) | 0 (0.0) | 0 (0.0) | 1 (24.0) |
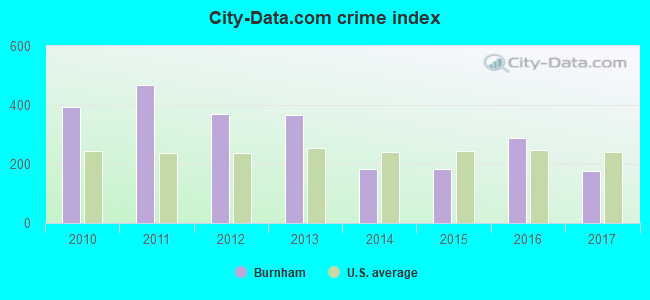
| City-Data.com crime index | 391.6 | 467.6 | 370.1 | 366.6 | 183.4 | 182.4 | 287.7 | 174.6 |
The City-Data.com crime index weighs serious crimes and violent crimes more heavily. Higher means more crime, U.S. average is 246.1. It adjusts for the number of visitors and daily workers commuting into cities.
Crime rate in Burnham detailed stats: murders, rapes, robberies, assaults, burglaries, thefts, arson
Full-time law enforcement employees in 2016, including police officers: 12 (10 officers - 10 male; 0 female).
| Officers per 1,000 residents here: | 2.38 |
| Illinois average: | 3.16 |
 Recent articles from our blog. Our writers, many of them Ph.D. graduates or candidates, create easy-to-read articles on a wide variety of topics.

 | Moving to IL - is there any future? (202 replies) |
| Suburbs that are obscure or little-known (240 replies) |
| Thoughts on Park Forest, Thornton, or Burnham? (24 replies) |
| Chicago Suburbs With The Most Beautiful Houses (26 replies) |
| What is great about the Chicago area? Positive Posters!!! (55 replies) |
| Relative Safety in South Suburbs (7 replies) |
Latest news from Burnham, IL collected exclusively by city-data.com from local newspapers, TV, and radio stations
Ancestries: Polish (2.2%), Irish (1.3%), English (1.2%).
Current Local Time: CST time zone
Incorporated on 03/29/1907
Elevation: 585 feet
Land area: 1.86 square miles.
Population density: 2,102 people per square mile (low).
334 residents are foreign born (6.9% Latin America).
| This village: | 8.5% |
| Illinois: | 14.1% |
Median real estate property taxes paid for housing units with mortgages in 2022: $4,433 (2.8%)
Median real estate property taxes paid for housing units with no mortgage in 2022: $3,073 (2.2%)
Nearest city with pop. 50,000+: Hammond, IN  (3.4 miles , pop. 83,048).
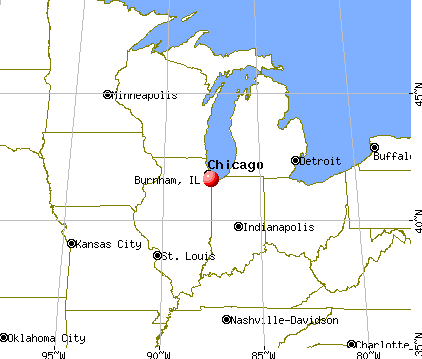
Nearest city with pop. 200,000+: Chicago, IL (15.7 miles , pop. 2,896,016).
Nearest cities:
Latitude: 41.64 N, Longitude: 87.55 W
Burnham, Illinois accommodation & food services, waste management - Economy and Business Data
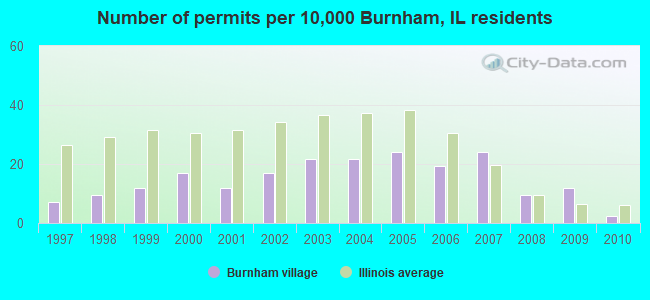
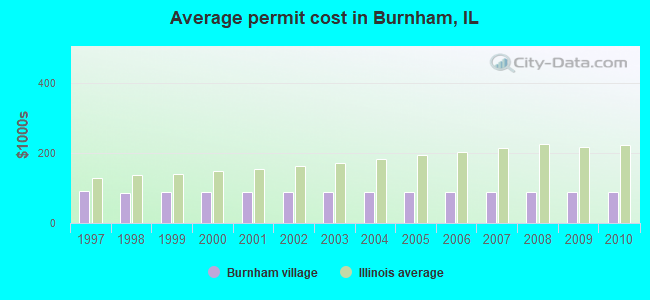
Single-family new house construction building permits:
- 2010: 1 building, cost: $88,600
- 2009: 5 buildings, average cost: $88,600
- 2008: 4 buildings, average cost: $88,600
- 2007: 10 buildings, average cost: $88,600
- 2006: 8 buildings, average cost: $88,600
- 2005: 10 buildings, average cost: $88,600
- 2004: 9 buildings, average cost: $88,600
- 2003: 9 buildings, average cost: $88,600
- 2002: 7 buildings, average cost: $88,600
- 2001: 5 buildings, average cost: $88,600
- 2000: 7 buildings, average cost: $88,600
- 1999: 5 buildings, average cost: $89,100
- 1998: 4 buildings, average cost: $87,400
- 1997: 3 buildings, average cost: $91,700
| Here: | 4.0% |
| Illinois: | 4.2% |
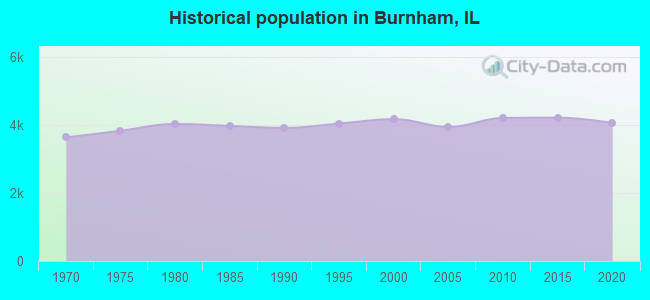
Population change in the 1990s: +270 (+6.9%).
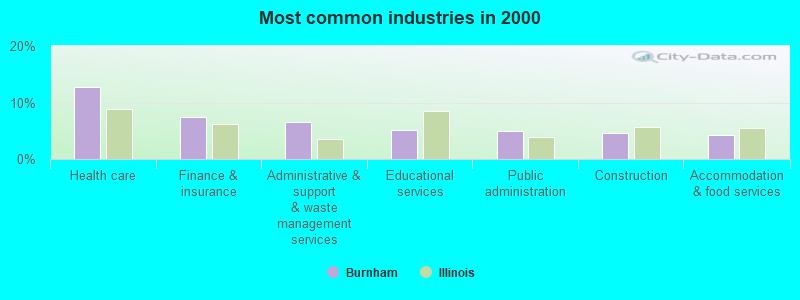
- Health care (12.7%)
- Finance & insurance (7.4%)
- Administrative & support & waste management services (6.5%)
- Educational services (5.1%)
- Public administration (5.0%)
- Construction (4.6%)
- Accommodation & food services (4.3%)
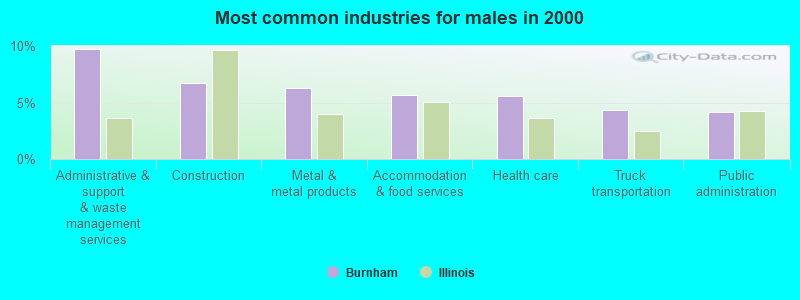
- Administrative & support & waste management services (9.7%)
- Construction (6.8%)
- Metal & metal products (6.3%)
- Accommodation & food services (5.7%)
- Health care (5.5%)
- Truck transportation (4.3%)
- Public administration (4.2%)
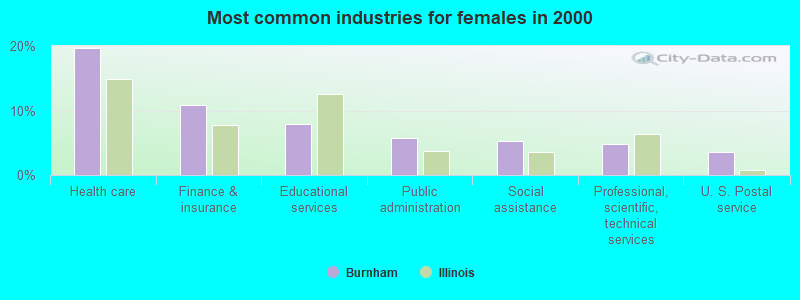
- Health care (19.7%)
- Finance & insurance (10.9%)
- Educational services (7.9%)
- Public administration (5.7%)
- Social assistance (5.2%)
- Professional, scientific, technical services (4.7%)
- U. S. Postal service (3.6%)
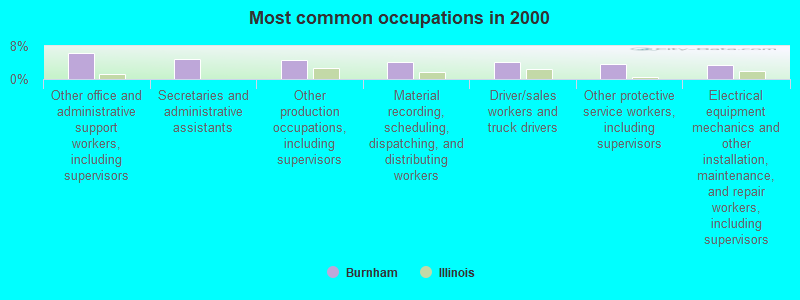
- Other office and administrative support workers, including supervisors (6.3%)
- Secretaries and administrative assistants (4.8%)
- Other production occupations, including supervisors (4.5%)
- Material recording, scheduling, dispatching, and distributing workers (4.2%)
- Driver/sales workers and truck drivers (4.2%)
- Other protective service workers, including supervisors (3.6%)
- Electrical equipment mechanics and other installation, maintenance, and repair workers, including supervisors (3.3%)
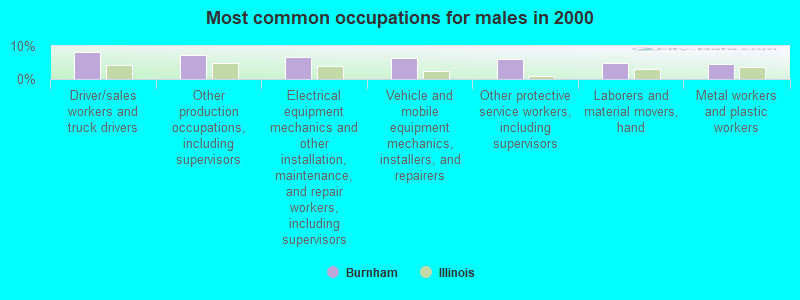
- Driver/sales workers and truck drivers (8.2%)
- Other production occupations, including supervisors (7.3%)
- Electrical equipment mechanics and other installation, maintenance, and repair workers, including supervisors (6.5%)
- Vehicle and mobile equipment mechanics, installers, and repairers (6.4%)
- Other protective service workers, including supervisors (6.2%)
- Laborers and material movers, hand (4.9%)
- Metal workers and plastic workers (4.6%)
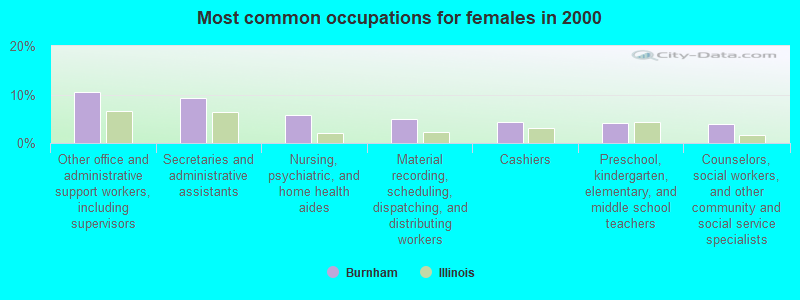
- Other office and administrative support workers, including supervisors (10.6%)
- Secretaries and administrative assistants (9.4%)
- Nursing, psychiatric, and home health aides (5.7%)
- Material recording, scheduling, dispatching, and distributing workers (4.9%)
- Cashiers (4.3%)
- Preschool, kindergarten, elementary, and middle school teachers (4.0%)
- Counselors, social workers, and other community and social service specialists (3.9%)
Average climate in Burnham, Illinois
Based on data reported by over 4,000 weather stations


|
|

(lower is better)
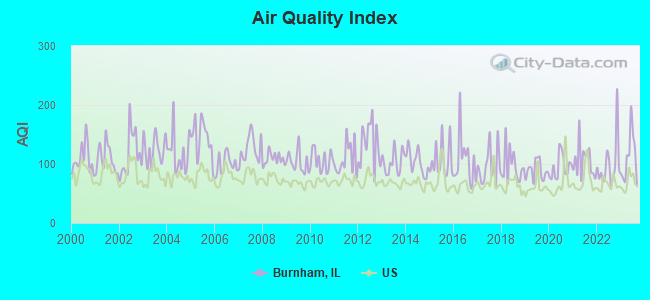
Air Quality Index (AQI) level in 2023 was 111. This is significantly worse than average.
| City: | 111 |
| U.S.: | 73 |
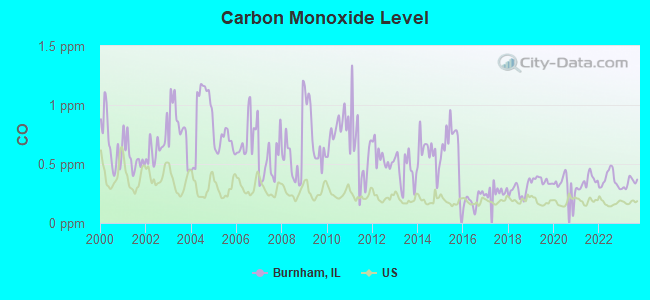
Carbon Monoxide (CO) [ppm] level in 2023 was 0.339. This is worse than average. Closest monitor was 0.9 miles away from the city center.
| City: | 0.339 |
| U.S.: | 0.251 |
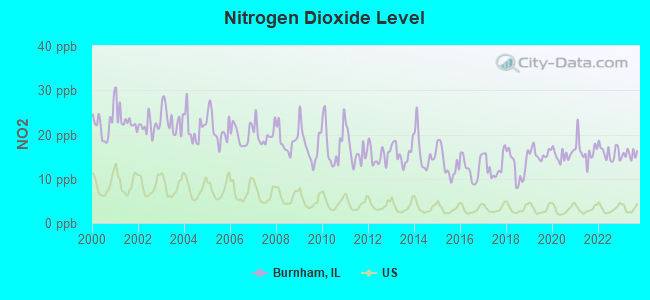
Nitrogen Dioxide (NO2) [ppb] level in 2023 was 15.5. This is significantly worse than average. Closest monitor was 0.9 miles away from the city center.
| City: | 15.5 |
| U.S.: | 5.1 |
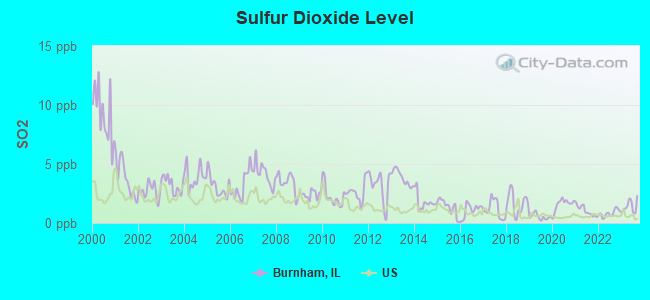
Sulfur Dioxide (SO2) [ppb] level in 2023 was 1.42. This is about average. Closest monitor was 0.9 miles away from the city center.
| City: | 1.42 |
| U.S.: | 1.51 |
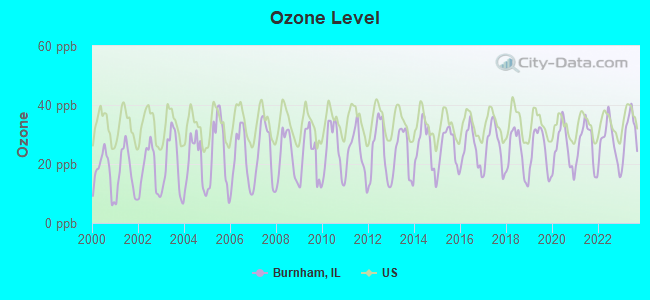
Ozone [ppb] level in 2023 was 30.6. This is about average. Closest monitor was 0.9 miles away from the city center.
| City: | 30.6 |
| U.S.: | 33.3 |
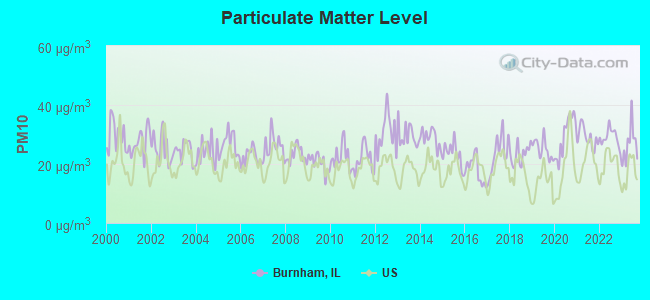
Particulate Matter (PM10) [µg/m3] level in 2023 was 26.6. This is worse than average. Closest monitor was 1.6 miles away from the city center.
| City: | 26.6 |
| U.S.: | 19.2 |
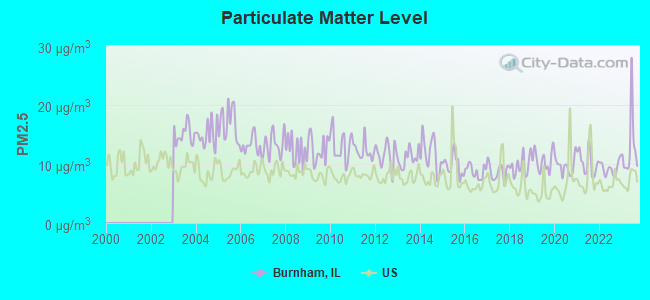
Particulate Matter (PM2.5) [µg/m3] level in 2023 was 12.8. This is significantly worse than average. Closest monitor was 3.3 miles away from the city center.
| City: | 12.8 |
| U.S.: | 8.1 |
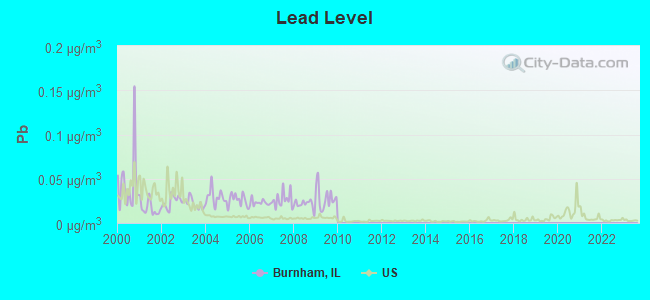
Lead (Pb) [µg/m3] level in 2009 was 0.0286. This is significantly worse than average. Closest monitor was 1.6 miles away from the city center.
| City: | 0.0286 |
| U.S.: | 0.0093 |
Tornado activity:
Burnham-area historical tornado activity is near Illinois state average. It is 56% greater than the overall U.S. average.
On 4/21/1967, a category F4 (max. wind speeds 207-260 mph) tornado 6.5 miles away from the Burnham village center killed 33 people and injured 500 people and caused between $5,000,000 and $50,000,000 in damages.
On 8/28/1990, a category F5 (max. wind speeds 261-318 mph) tornado 29.5 miles away from the village center killed 29 people and injured 350 people and caused between $50,000 and $500,000 in damages.
Earthquake activity:
Burnham-area historical earthquake activity is significantly above Illinois state average. It is 40% greater than the overall U.S. average.On 4/18/2008 at 09:36:59, a magnitude 5.4 (5.1 MB, 4.8 MS, 5.4 MW, 5.2 MW, Class: Moderate, Intensity: VI - VII) earthquake occurred 220.9 miles away from Burnham center
On 6/10/1987 at 23:48:54, a magnitude 5.1 (4.9 MB, 4.4 MS, 4.6 MS, 5.1 LG) earthquake occurred 195.5 miles away from the city center
On 4/18/2008 at 09:36:59, a magnitude 5.2 (5.2 MW, Depth: 8.9 mi) earthquake occurred 220.9 miles away from the city center
On 6/28/2004 at 06:10:52, a magnitude 4.2 (4.2 MW, Depth: 6.2 mi, Class: Light, Intensity: IV - V) earthquake occurred 70.9 miles away from Burnham center
On 6/18/2002 at 17:37:15, a magnitude 5.0 (4.3 MB, 4.6 MW, 5.0 LG) earthquake occurred 252.7 miles away from the city center
On 4/18/2008 at 15:14:16, a magnitude 4.8 (4.5 MB, 4.8 MW, 4.6 MW) earthquake occurred 219.1 miles away from the city center
Magnitude types: regional Lg-wave magnitude (LG), body-wave magnitude (MB), surface-wave magnitude (MS), moment magnitude (MW)
Natural disasters:
The number of natural disasters in Cook County (20) is greater than the US average (15).Major Disasters (Presidential) Declared: 15
Emergencies Declared: 4
Causes of natural disasters: Floods: 13, Storms: 12, Tornadoes: 3, Snowstorms: 2, Winter Storms: 2, Blizzard: 1, Hurricane: 1, Snow: 1, Wind: 1, Other: 1 (Note: some incidents may be assigned to more than one category).
Hospitals and medical centers in Burnham:
Amtrak stations near Burnham:
- 5 miles: HAMMOND-WHITING (HAMMOND, 1135 CALUMET AVE.) . Services: ticket office, partially wheelchair accessible, enclosed waiting area, public restrooms, public payphones, free short-term parking, free long-term parking, call for taxi service.
- 8 miles: HOMEWOOD (181 1ST ST. & PARK AVE.) . Services: ticket office, enclosed waiting area, public restrooms, public payphones, paid short-term parking, paid long-term parking, public transit connection.
- 10 miles: DYER (SHEFFIELD RD.) . Services: enclosed waiting area, public payphones, free short-term parking, free long-term parking.
Colleges/universities with over 2000 students nearest to Burnham:
- South Suburban College (about 5 miles; South Holland, IL; Full-time enrollment: 3,972)
- Purdue University-Calumet Campus (about 6 miles; Hammond, IN; FT enrollment: 7,343)
- City Colleges of Chicago-Olive-Harvey College (about 6 miles; Chicago, IL; FT enrollment: 4,110)
- Chicago State University (about 7 miles; Chicago, IL; FT enrollment: 4,352)
- Prairie State College (about 9 miles; Chicago Heights, IL; FT enrollment: 4,050)
- Saint Xavier University (about 10 miles; Chicago, IL; FT enrollment: 3,576)
- University of Chicago (about 11 miles; Chicago, IL; FT enrollment: 11,506)
Public elementary/middle school in Burnham:
- BURNHAM ELEM SCHOOL (Students: 226, Location: 13945 S GREEN BAY AVE, Grades: PK-8)
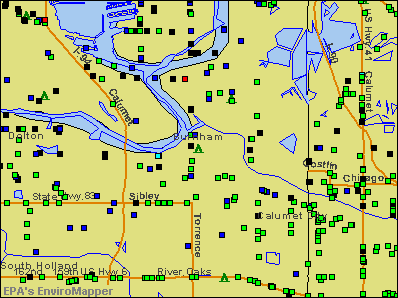
Points of interest:
Notable locations in Burnham: Burnham Woods Golf Course (A), Burnham Fire Department (B). Display/hide their locations on the map
Lake: Powder Horn Lake (A). Display/hide its location on the map
Rivers: Little Calumet River (A), Grand Calumet River (B). Display/hide their locations on the map
Parks in Burnham include: Burnham Park (1), Cottage Park (2). Display/hide their locations on the map
Birthplace of: Joe Skalski - Baseball player.
Drinking water stations with addresses in Burnham and their reported violations in the past:
BURNHAM (Population served: 4,170, Purch surface water):Past health violations:Past monitoring violations:
- MCL, Monthly (TCR) - In FEB-2012, Contaminant: Coliform. Follow-up actions: St Public Notif requested (MAR-14-2012), St Violation/Reminder Notice (MAR-14-2012), St Compliance achieved (MAR-19-2012), St Formal NOV issued (MAR-28-2012), St Public Notif received (APR-18-2012)
- MCL, Monthly (TCR) - In SEP-2011, Contaminant: Coliform. Follow-up actions: St Compliance achieved (OCT-17-2011), St Public Notif requested (OCT-19-2011), St Violation/Reminder Notice (OCT-19-2011), St Public Notif received (DEC-13-2011), St Formal NOV issued (MAR-28-2012)
- Monitoring and Reporting (DBP) - Between JUL-2013 and SEP-2013, Contaminant: Total Haloacetic Acids (HAA5). Follow-up actions: St Public Notif requested (OCT-11-2013), St Violation/Reminder Notice (OCT-11-2013), St Compliance achieved (DEC-03-2013)
- Monitoring and Reporting (DBP) - Between JUL-2013 and SEP-2013, Contaminant: TTHM. Follow-up actions: St Public Notif requested (OCT-11-2013), St Violation/Reminder Notice (OCT-11-2013), St Compliance achieved (DEC-03-2013)
| This village: | 2.7 people |
| Illinois: | 2.6 people |
| This village: | 69.7% |
| Whole state: | 65.8% |
| This village: | 6.9% |
| Whole state: | 6.3% |
Likely homosexual households (counted as self-reported same-sex unmarried-partner households)
- Lesbian couples: 0.2% of all households
- Gay men: 0.5% of all households
301 people in nursing homes in 2000
For population 15 years and over in Burnham:
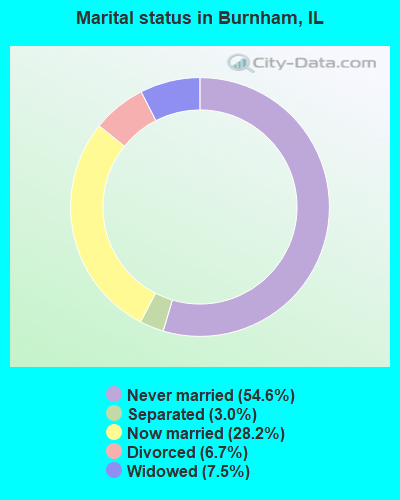
- Never married: 54.6%
- Now married: 28.2%
- Separated: 3.0%
- Widowed: 7.5%
- Divorced: 6.7%
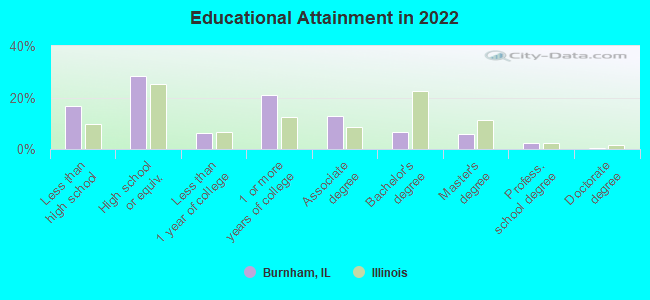
For population 25 years and over in Burnham:
- High school or higher: 82.8%
- Bachelor's degree or higher: 14.7%
- Graduate or professional degree: 8.2%
- Unemployed: 10.2%
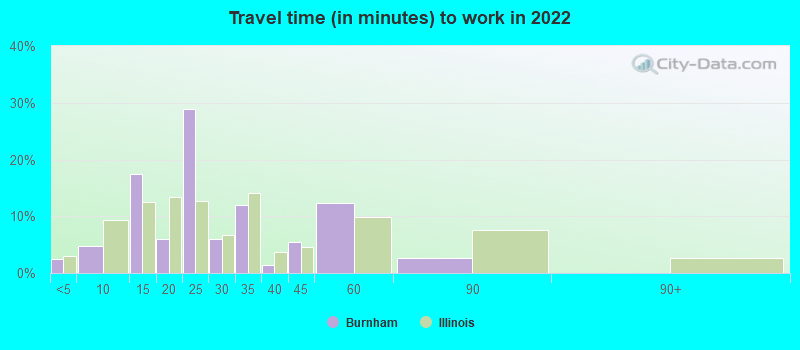
- Mean travel time to work (commute): 30.9 minutes
| Here: | 11.6 |
| Illinois average: | 12.5 |


Graphs represent county-level data. Detailed 2008 Election Results
Religion statistics for Burnham, IL (based on Cook County data)


| Religion | Adherents | Congregations |
|---|---|---|
| Catholic | 1,947,223 | 376 |
| Evangelical Protestant | 432,975 | 1,484 |
| Other | 312,636 | 403 |
| Mainline Protestant | 202,114 | 630 |
| Black Protestant | 148,895 | 395 |
| Orthodox | 53,276 | 66 |
| None | 2,097,556 | - |
Food Environment Statistics:
| This county: | 2.77 / 10,000 pop. |
| Illinois: | 2.24 / 10,000 pop. |
| Cook County: | 0.04 / 10,000 pop. |
| State: | 0.08 / 10,000 pop. |
| Cook County: | 0.93 / 10,000 pop. |
| Illinois: | 0.75 / 10,000 pop. |
| Cook County: | 1.53 / 10,000 pop. |
| State: | 2.61 / 10,000 pop. |
| Cook County: | 6.67 / 10,000 pop. |
| Illinois: | 6.86 / 10,000 pop. |
| This county: | 8.4% |
| Illinois: | 8.3% |
| Cook County: | 23.5% |
| Illinois: | 25.2% |
| This county: | 16.3% |
| State: | 14.5% |
Health and Nutrition:
| This city: | 47.7% |
| Illinois: | 49.5% |
| Here: | 45.6% |
| State: | 47.2% |
| Burnham: | 29.8 |
| Illinois: | 28.6 |
| Burnham: | 19.6% |
| Illinois: | 20.5% |
| Burnham: | 12.5% |
| Illinois: | 10.8% |
| Burnham: | 6.7 |
| Illinois: | 6.8 |
| This city: | 36.8% |
| Illinois: | 33.4% |
| Burnham: | 54.3% |
| Illinois: | 56.4% |
| This city: | 81.4% |
| Illinois: | 79.9% |
More about Health and Nutrition of Burnham, IL Residents
| Local government employment and payroll (March 2022) | |||||
| Function | Full-time employees | Monthly full-time payroll | Average yearly full-time wage | Part-time employees | Monthly part-time payroll |
|---|---|---|---|---|---|
| Police Protection - Officers | 12 | $71,878 | $71,878 | 34 | $52,091 |
| Water Supply | 7 | $40,105 | $68,751 | 0 | $0 |
| Financial Administration | 5 | $14,699 | $35,278 | 0 | $0 |
| Totals for Government | 24 | $126,682 | $63,341 | 34 | $52,091 |
Burnham government finances - Expenditure in 2017 (per resident):
- Current Operations - Police Protection: $1,608,000 ($411.78)
Central Staff Services: $1,138,000 ($291.42)
Water Utilities: $846,000 ($216.65)
Regular Highways: $521,000 ($133.42)
Solid Waste Management: $191,000 ($48.91)
Local Fire Protection: $126,000 ($32.27)
Sewerage: $35,000 ($8.96)
Parks and Recreation: $34,000 ($8.71)
General - Other: $25,000 ($6.40)
- General - Interest on Debt: $56,000 ($14.34)
- Other Capital Outlay - Central Staff Services: $108,000 ($27.66)
- Total Salaries and Wages: $1,568,000 ($401.54)
Burnham government finances - Revenue in 2017 (per resident):
- Charges - Solid Waste Management: $186,000 ($47.63)
Sewerage: $77,000 ($19.72)
Other: $44,000 ($11.27)
- Federal Intergovernmental - Other: $67,000 ($17.16)
- Miscellaneous - General Revenue - Other: $377,000 ($96.54)
Fines and Forfeits: $160,000 ($40.97)
- Revenue - Water Utilities: $498,000 ($127.53)
- State Intergovernmental - General Local Government Support: $757,000 ($193.85)
Highways: $107,000 ($27.40)
Other: $12,000 ($3.07)
- Tax - Property: $2,067,000 ($529.32)
Other Selective Sales: $172,000 ($44.05)
Public Utilities Sales: $119,000 ($30.47)
Other License: $79,000 ($20.23)
Burnham government finances - Debt in 2017 (per resident):
- Long Term Debt - Outstanding Unspecified Public Purpose: $7,683,000 ($1967.48)
Issue, Unspecified Public Purpose: $6,532,000 ($1672.73)
Beginning Outstanding - Unspecified Public Purpose: $1,392,000 ($356.47)
Retired Unspecified Public Purpose: $241,000 ($61.72)
Burnham government finances - Cash and Securities in 2017 (per resident):
- Bond Funds - Cash and Securities: $6,184,000 ($1583.61)
- Other Funds - Cash and Securities: $644,000 ($164.92)
3.53% of this county's 2021 resident taxpayers lived in other counties in 2020 ($82,405 average adjusted gross income)
| Here: | 3.53% |
| Illinois average: | 5.09% |
0.01% of residents moved from foreign countries ($114 average AGI)
Cook County: 0.01% Illinois average: 0.01%
Top counties from which taxpayers relocated into this county between 2020 and 2021:
| from DuPage County, IL | |
| from Lake County, IL | |
| from Will County, IL |
5.44% of this county's 2020 resident taxpayers moved to other counties in 2021 ($120,340 average adjusted gross income)
| Here: | 5.44% |
| Illinois average: | 6.10% |
0.01% of residents moved to foreign countries ($140 average AGI)
Cook County: 0.01% Illinois average: 0.01%
Top counties to which taxpayers relocated from this county between 2020 and 2021:
| to DuPage County, IL | |
| to Will County, IL | |
| to Lake County, IL |
Businesses in Burnham, IL
- Cricket Wireless: 1
Strongest AM radio stations in Burnham:
- WNTD (950 AM; 5 kW; CHICAGO, IL; Owner: RADIO UNICA OF CHICAGO LICENSE CORP.)
- WVIV (1200 AM; 20 kW; CHICAGO, IL; Owner: WLXX-AM LICENSE CORP.)
- WLS (890 AM; 50 kW; CHICAGO, IL; Owner: WLS, INC.)
- WIND (560 AM; 5 kW; CHICAGO, IL; Owner: TICHENOR LICENSE CORPORATION ("TLC"))
- WNWI (1080 AM; 3 kW; OAK LAWN, IL; Owner: BIRACH BROADCASTING CORPORATION)
- WYLL (1160 AM; 50 kW; CHICAGO, IL; Owner: SCA LICENSE CORPORATION)
- WMVP (1000 AM; 50 kW; CHICAGO, IL; Owner: ABC, INC.)
- WSCR (670 AM; 50 kW; CHICAGO, IL; Owner: INFINITY BROADCASTING OPERATIONS, INC.)
- WBBM (780 AM; 50 kW; CHICAGO, IL; Owner: INFINITY BROADCASTING OPERATIONS, INC.)
- WGN (720 AM; 50 kW; CHICAGO, IL; Owner: WGN CONTINENTAL BROADCASTING CO.)
- WJOB (1230 AM; 1 kW; HAMMOND, IN; Owner: ST. GEORGE BROADCASTING, LLC, ROBERT J. MACCINI, RECEIVER)
- WGCI (1390 AM; 5 kW; CHICAGO, IL; Owner: AMFM RADIO LICENSES, L.L.C.)
- WRDZ (1300 AM; 4 kW; LA GRANGE, IL; Owner: ABC, INC.)
Strongest FM radio stations in Burnham:
- WPWX (92.3 FM; HAMMOND, IN; Owner: DONTRON, INC.)
- WYCA (106.3 FM; LANSING, IL; Owner: DONTRON, INC.)
- WCKG (105.9 FM; ELMWOOD PARK, IL; Owner: INFINITY HOLDINGS CORPORATION OF ORLANDO)
- WLIT-FM (93.9 FM; CHICAGO, IL; Owner: AMFM RADIO LICENSES, L.L.C.)
- WJMK (104.3 FM; CHICAGO, IL; Owner: INFINITY BROADCASTING CORP. OF ILLINOIS)
- WNUA (95.5 FM; CHICAGO, IL; Owner: AMFM RADIO LICENSES, L.L.C.)
- WTMX (101.9 FM; SKOKIE, IL; Owner: BONNEVILLE HOLDING COMPANY)
- WBBM-FM (96.3 FM; CHICAGO, IL; Owner: INFINITY BROADCASTING OPERATIONS, INC.)
- WKSC-FM (103.5 FM; CHICAGO, IL; Owner: AMFM RADIO LICENSES, L.L.C.)
- WFMT (98.7 FM; CHICAGO, IL; Owner: WINDOW TO THE WORLD COMMUNICATIONS)
- WZZN (94.7 FM; CHICAGO, IL; Owner: ABC CHICAGO FM RADIO,INC.)
- WGCI-FM (107.5 FM; CHICAGO, IL; Owner: AMFM RADIO LICENSES, L.L.C.)
- WDRV (97.1 FM; CHICAGO, IL; Owner: BONNEVILLE HOLDING COMPANY)
- WBEZ (91.5 FM; CHICAGO, IL; Owner: THE WBEZ ALLIANCE, INC.)
- WKQX (101.1 FM; CHICAGO, IL; Owner: EMMIS RADIO LICENSE CORPORATION)
- WLUP-FM (97.9 FM; CHICAGO, IL; Owner: BONNEVILLE HOLDING COMPANY)
- WNND (100.3 FM; CHICAGO, IL; Owner: BONNEVILLE HOLDING COMPANY)
- WOJO (105.1 FM; EVANSTON, IL; Owner: TICHENOR LICENSE CORPORATION ("TLC"))
- WUSN (99.5 FM; CHICAGO, IL; Owner: INFINITY BROADCASTING CORPORATION OF CHICAGO)
- WVAZ (102.7 FM; OAK PARK, IL; Owner: AMFM RADIO LICENSES, L.L.C.)
TV broadcast stations around Burnham:
- WLS-TV (Channel 7; CHICAGO, IL; Owner: WLS TELEVISION, INC.)
- WMAQ-TV (Channel 5; CHICAGO, IL; Owner: NBC SUBSIDIARY (WMAQ-TV), INC.)
- WTTW (Channel 11; CHICAGO, IL; Owner: WINDOW TO THE WORLD COMMUNICATIONS, INC.)
- WGN-TV (Channel 9; CHICAGO, IL; Owner: WGN CONTINENTAL BROADCASTING COMPANY)
- WGBO-TV (Channel 66; JOLIET, IL; Owner: WGBO LICENSE PARTNERSHIP, G.P.)
- WBBM-TV (Channel 2; CHICAGO, IL; Owner: CBS BROADCASTING INC.)
- WPWR-TV (Channel 50; GARY, IN; Owner: FOX TELEVISION STATIONS, INC.)
- WXFT (Channel 60; AURORA, IL; Owner: TELEFUTURA CHICAGO LLC)
- WCPX (Channel 38; CHICAGO, IL; Owner: PAXSON CHICAGO LICENSE, INC.)
- WCIU-TV (Channel 26; CHICAGO, IL; Owner: WCIU-TV LIMITED PARTNERSHIP)
- WFLD (Channel 32; CHICAGO, IL; Owner: FOX TELEVISION STATIONS, INC.)
- W68DO (Channel 68; PALATINE, IL; Owner: TRINITY BROADCASTING NETWORK)
- WFBT-CA (Channel 23; CHICAGO, IL; Owner: CHANNEL 23 LIMITED PARTNERSHIP)
- WJYS (Channel 62; HAMMOND, IN; Owner: JOVON BROADCASTING CORPORATION)
- WSNS-TV (Channel 44; CHICAGO, IL; Owner: TELEMUNDO OF CHICAGO, INC.)
- WYIN (Channel 56; GARY, IN; Owner: NORTHWEST INDIANA PUBLIC BROADCASTING, INC.)
- WOCH-LP (Channel 28; CHICAGO, IL; Owner: KM LPTV OF CHICAGO-28, L.L.C.)
- WYCC (Channel 20; CHICAGO, IL; Owner: COLLEGE DIST. #508, COUNTY OF COOK)
- WOCK-CA (Channel 13; CHICAGO, IL; Owner: KM LPTV OF CHICAGO-13, L.L.C.)
- W34CK (Channel 34; ARLINGTON HEIGHTS, IL; Owner: FIRST UNITED, INC.)
- W54AP (Channel 54; BLUE ISLAND, IL; Owner: CATHOLIC VIEWS BROADCASTS, INC.)
- W64CQ (Channel 64; ARLINGTON HEIGHTS, IL; Owner: TRINITY BROADCASTING NETWORK)
- W18AT (Channel 18; GARY, IN; Owner: LESEA BROADCASTING CORPORATION)
- National Bridge Inventory (NBI) Statistics
- 1Number of bridges
- 59ft / 18.1mTotal length
- $6,297,000Total costs
- 15,700Total average daily traffic
- 785Total average daily truck traffic
- 13,081Total future (year 2032) average daily traffic
FCC Registered Antenna Towers:
81 (See the full list of FCC Registered Antenna Towers in Burnham)FCC Registered Commercial Land Mobile Towers:
1- 150 Marble Street (Lat: 41.630583 Lon: -87.527833), Structure height: 160 m, Call Sign: KPH356,
Assigned Frequencies: 450.020 MHz, Grant Date: 06/01/1987, Expiration Date: 08/01/2028, Registrant: Crawford Broadcasting. Company, 2821 S. Parker Road, Suite 1205, Aurora, CO 80014, Phone: (303) 481-1800, Fax: (303) 433-0905, Email:
FCC Registered Private Land Mobile Towers:
1- 4.4 Mi Ne Us-6 & 1-94 (Lat: 41.648083 Lon: -87.539500), Type: Tower, Structure height: 122 m, Call Sign: WPLA464,
Assigned Frequencies: 862.187 MHz, 862.237 MHz, 862.262 MHz, 862.387 MHz, 862.412 MHz, 862.437 MHz, 862.487 MHz, 862.587 MHz, 862.637 MHz, 862.662 MHz... (+53 more), Grant Date: 02/28/2012, Expiration Date: 02/06/2022, Cancellation Date: 09/17/2019, Certifier: Robin J Cohen, Registrant: Sprint Corporation, 12502 Sunrise Valley Drive, 2nd Fl, Varesa0209, Reston, VA 20196, Phone: (703) 433-4000, Fax: (703) 433-4483
FCC Registered Broadcast Land Mobile Towers:
3- 14101 Hoxie Ave (Lat: 41.638639 Lon: -87.560056), Type: Building, Structure height: 12 m, Call Sign: KEM606,
Assigned Frequencies: 153.890 MHz, 154.355 MHz, Grant Date: 08/22/2022, Expiration Date: 08/25/2032, Registrant: Chicago Communications LLC Dba Miner Electronics, 500 45th Avenue, Munster, IN 46321, Phone: (708) 473-5091, Email:
- 13830 Brainard Ave. (Lat: 41.640556 Lon: -87.535000), Call Sign: WQGP305, Licensee ID: L01246032,
Assigned Frequencies: 159.667 MHz, Grant Date: 03/14/2007, Expiration Date: 03/14/2017, Cancellation Date: 05/20/2017, Certifier: Tracy Coleman, Registrant: Scrap Metal Services LLC, 13830 Brainard Ave., Burnham, IL 60633, Phone: (708) 730-1400, Fax: (703) 830-8710, Email:
- Lat: 41.640889 Lon: -87.542667, Call Sign: WRPJ449,
Assigned Frequencies: 466.125 MHz, 466.100 MHz, 466.075 MHz, 466.025 MHz, 466.050 MHz, Grant Date: 02/11/2022, Expiration Date: 02/11/2032, Certifier: Gerald Boyum, Registrant: United Radio Communications, Inc, 9200 S Oketo Ave, Bridgeview, IL 60455, Phone: (630) 240-0911, Fax: (630) 477-0367, Email:
FCC Registered Microwave Towers:
10 (See the full list of FCC Registered Microwave Towers in this town)FCC Registered Paging Towers:
5 (See the full list of FCC Registered Paging Towers)FCC Registered Amateur Radio Licenses:
2- Call Sign: KA9OOL, Licensee ID: L01324450, Grant Date: 09/18/2007, Expiration Date: 12/17/2017, Cancellation Date: 12/18/2019, Certifier: Ryder G Olsen, Registrant: Ryder G Olsen, 14015 Mackinaw, Burnham, IL 60633
- Call Sign: KA9TUD, Licensee ID: L01000709, Grant Date: 04/05/2005, Expiration Date: 06/29/2015, Cancellation Date: 06/30/2017, Certifier: Richard A Provancal, Registrant: Richard A Provancal, 2826 E 138th Pl 17, Burnham, IL 60633
FAA Registered Aircraft:
7- Aircraft: KOLB AIRCRAFT MARK III (Category: Land, Seats: 2, Weight: Up to 12,499 Pounds), Engine: ROTAX 582DCDI (65 HP) (2 Cycle)
N-Number: 102JY, N102JY, N-102JY, Serial Number: 1135, Year manufactured: 1996, Airworthiness Date: 01/27/2008, Certificate Issue Date: 07/26/2007
Registrant (Individual): Joseph C Yobbka, 3009 E 138th Pl, Burnham, IL 60633 - Aircraft: KOLB AIRCRAFT MARK III (Category: Land, Seats: 2, Weight: Up to 12,499 Pounds), Engine: ROTAX 912ULS SERIES (100 HP) (2 Cycle)
N-Number: 103JY, N103JY, N-103JY, Serial Number: M301-00031, Year manufactured: 1999, Airworthiness Date: 11/18/2009, Certificate Issue Date: 07/26/2007
Registrant (Individual): Joseph C Yobbka, 3009 E 138th Pl, Burnham, IL 60633 - Aircraft: KOLB AIRCRAFT MARK III (Category: Land, Seats: 2, Weight: Up to 12,499 Pounds), Engine: ROTAX 912ULS SERIES (100 HP) (2 Cycle)
N-Number: 104JY, N104JY, N-104JY, Serial Number: M301-00017, Year manufactured: 1993, Airworthiness Date: 01/19/2010, Certificate Issue Date: 07/26/2007
Registrant (Individual): Joseph C Yobbka, 3009 E 138th Place, Burnham, IL 60633 - Aircraft: TEXTRON AVIATION INC 525B (Category: Land, Engines: 2, Seats: 8, Weight: 12,500 - 19,999 Pounds), Engine: WILLIAMS FJ44-3A (2820 Pounds of Thrust) (Turbo-fan)
N-Number: 911JB, N911JB, N-911JB, Serial Number: 525B0596, Year manufactured: 2019, Airworthiness Date: 09/23/2019, Certificate Issue Date: 10/28/2019
Registrant (LLC): M2 Jb LLC, 2627 E 139th St, Burnham, IL 60633 - Aircraft: TILLMAN TS/COLLETTI LM DRAGONFLY (Category: Land, Seats: 2, Weight: Up to 12,499 Pounds), Engine: ROTAX 914 SERIES (100 HP) (4 Cycle)
N-Number: 914TT, N914TT, N-914TT, Serial Number: 039, Year manufactured: 2007, Airworthiness Date: 12/15/2007, Certificate Issue Date: 05/22/2017
Registrant (Individual): Joseph C Yobbka, 3009 E 138th Pl, Burnham, IL 60633 - Aircraft: PIPER PA-32R-301 (Category: Land, Seats: 7, Weight: Up to 12,499 Pounds), Engine: LYCOMING IO-540 SER (300 HP) (Reciprocating)
N-Number: 9236V, N9236V, N-9236V, Serial Number: 3213069, Year manufactured: 1993, Airworthiness Date: 11/24/1993, Certificate Issue Date: 11/30/2020
Registrant (Corporation): Mr Bults Inc, 2627 E 139th St, Burnham, IL 60633 - Aircraft: PILATUS AIRCRAFT LTD PC-24 (Category: Land, Engines: 2, Seats: 9, Weight: Up to 12,499 Pounds), Engine: WILLIAMS FJ44-4A (3443 Pounds of Thrust) (Turbo-fan)
N-Number: 979JB, N979JB, N-979JB, Serial Number: 110, Year manufactured: 2018, Airworthiness Date: 09/05/2018, Certificate Issue Date: 11/09/2018
Registrant (Corporation): Mr Bults Inc, 2627 E 139th St, Burnham, IL 60633
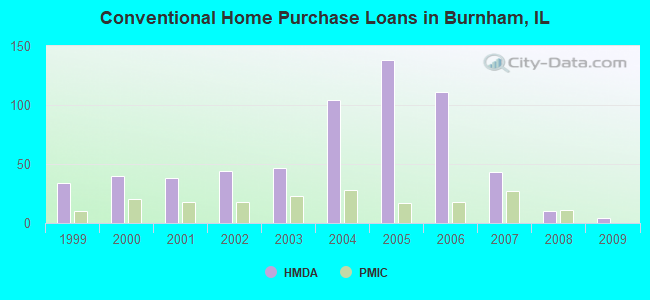
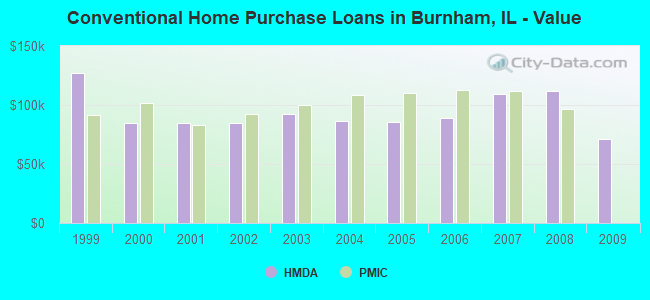
| Home Mortgage Disclosure Act Aggregated Statistics For Year 2009 (Based on 1 full tract) | ||||||||||
| A) FHA, FSA/RHS & VA Home Purchase Loans | B) Conventional Home Purchase Loans | C) Refinancings | D) Home Improvement Loans | F) Non-occupant Loans on < 5 Family Dwellings (A B C & D) | ||||||
|---|---|---|---|---|---|---|---|---|---|---|
| Number | Average Value | Number | Average Value | Number | Average Value | Number | Average Value | Number | Average Value | |
| LOANS ORIGINATED | 9 | $104,667 | 4 | $71,250 | 36 | $108,639 | 2 | $77,500 | 5 | $70,400 |
| APPLICATIONS APPROVED, NOT ACCEPTED | 0 | $0 | 0 | $0 | 9 | $121,889 | 0 | $0 | 0 | $0 |
| APPLICATIONS DENIED | 3 | $99,333 | 4 | $46,500 | 39 | $102,487 | 6 | $10,333 | 4 | $35,250 |
| APPLICATIONS WITHDRAWN | 2 | $80,500 | 0 | $0 | 20 | $110,650 | 1 | $69,000 | 1 | $57,000 |
| FILES CLOSED FOR INCOMPLETENESS | 3 | $124,000 | 0 | $0 | 7 | $102,857 | 1 | $14,000 | 0 | $0 |
Detailed HMDA statistics for the following Tracts: 8257.00
| Private Mortgage Insurance Companies Aggregated Statistics For Year 2009 (Based on 1 full tract) | ||||
| A) Conventional Home Purchase Loans | B) Refinancings | |||
|---|---|---|---|---|
| Number | Average Value | Number | Average Value | |
| LOANS ORIGINATED | 0 | $0 | 1 | $85,000 |
| APPLICATIONS APPROVED, NOT ACCEPTED | 1 | $77,000 | 0 | $0 |
| APPLICATIONS DENIED | 0 | $0 | 0 | $0 |
| APPLICATIONS WITHDRAWN | 0 | $0 | 1 | $92,000 |
| FILES CLOSED FOR INCOMPLETENESS | 0 | $0 | 0 | $0 |
Detailed PMIC statistics for the following Tracts: 8257.00
2002 - 2018 National Fire Incident Reporting System (NFIRS) incidents
- Fire incident types reported to NFIRS in Burnham, IL
- 30158.9%Structure Fires
- 13726.8%Outside Fires
- 6312.3%Mobile Property/Vehicle Fires
- 102.0%Other
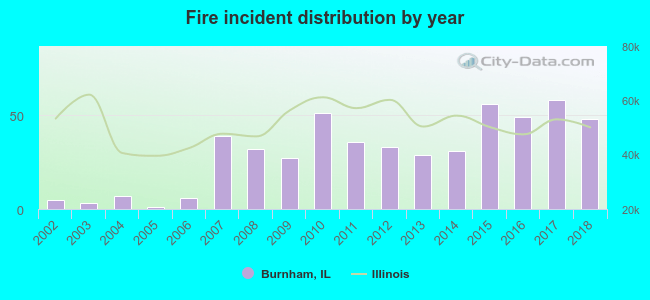 Based on the data from the years 2002 - 2018 the average number of fires per year is 30. The highest number of fires - 58 took place in 2017, and the least - 1 in 2005. The data has a rising trend.
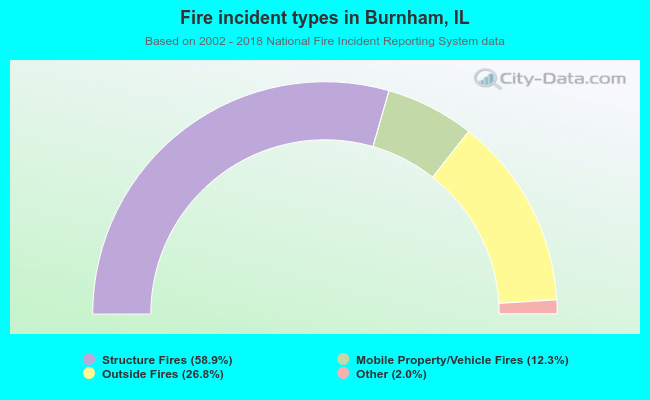 When looking into fire subcategories, the most incidents belonged to: Structure Fires (58.9%), and Outside Fires (26.8%).
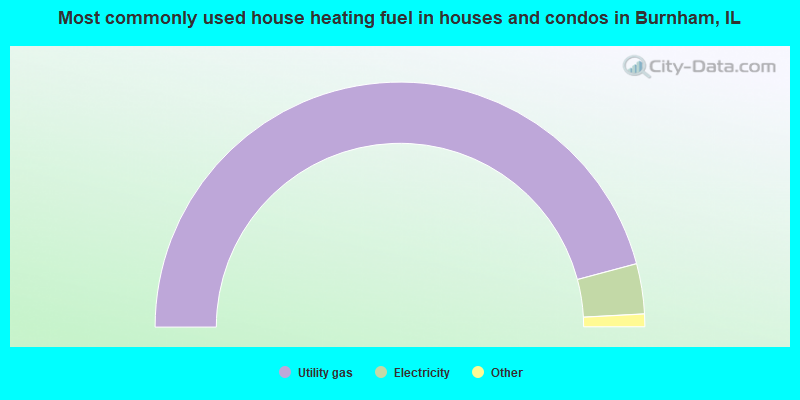
- 91.7%Utility gas
- 6.6%Electricity
- 0.8%Bottled, tank, or LP gas
- 0.8%Fuel oil, kerosene, etc.
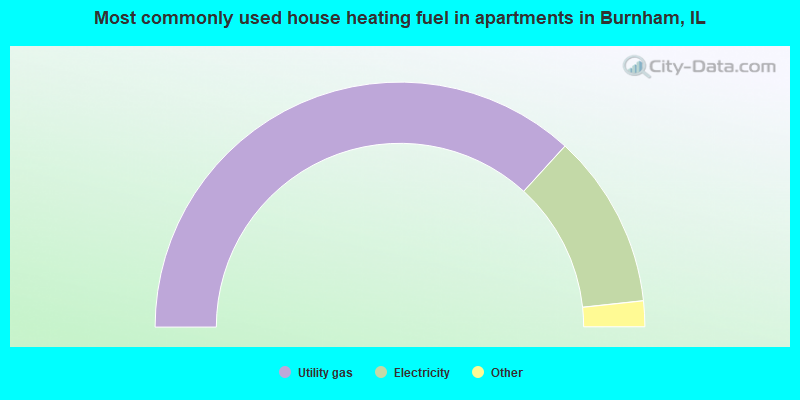
- 73.7%Utility gas
- 23.1%Electricity
- 1.9%Other fuel
- 1.3%Bottled, tank, or LP gas
Burnham compared to Illinois state average:
- Median house value below state average.
- Black race population percentage significantly above state average.
- Foreign-born population percentage below state average.
- Length of stay since moving in significantly above state average.
- Institutionalized population percentage significantly above state average.
- Percentage of population with a bachelor's degree or higher below state average.
State forum archive:
- Illinois Pages: 2 3 4 5 6 7 8 9 10 11 12 13 14 15 16 17 18 19
- Chicago Pages: 2 3 4 5 6 7 8 9 10 11 12 13 14 15 16 17 18 19 20 21 22 23 24 25 26 27 28 29 30 31 32 33 34 35 36 37 38 39 40 41 42 43 44 45 46 47 48 49 50 51 52 53 54 55 56 57 58 59 60 61 62 63 64 65 66 67 68 69 70 71 72 73 74 75 76 77 78 79 80 81 82 83 84
- Chicago Suburbs Pages: 2 3 4 5 6 7 8 9 10 11 12 13 14 15 16 17 18 19 20 21 22 23 24 25 26 27 28 29 30 31 32 33 34 35 36 37 38 39 40 41 42 43 44 45 46 47 48 49 50 51 52