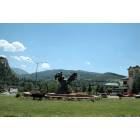
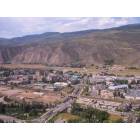
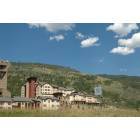
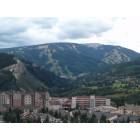
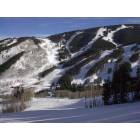
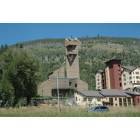
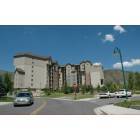
Avon, Colorado Submit your own pictures of this town and show them to the world
OSM Map
General Map
Google Map
MSN Map
OSM Map
General Map
Google Map
MSN Map
OSM Map
General Map
Google Map
MSN Map
OSM Map
General Map
Google Map
MSN Map
Please wait while loading the map...
Population in 2022: 5,921 (85% urban, 15% rural). Population change since 2000: +6.5%Males: 3,076 Females: 2,845
March 2022 cost of living index in Avon: 100.0 (near average, U.S. average is 100) Percentage of residents living in poverty in 2022: 13.2%for White Non-Hispanic residents , 11.6% for Hispanic or Latino residents , 54.2% for American Indian residents , 11.1% for two or more races residents )
Profiles of local businesses
Business Search - 14 Million verified businesses
Data:
Median household income ($)
Median household income (% change since 2000)
Household income diversity
Ratio of average income to average house value (%)
Ratio of average income to average rent
Median household income ($) - White
Median household income ($) - Black or African American
Median household income ($) - Asian
Median household income ($) - Hispanic or Latino
Median household income ($) - American Indian and Alaska Native
Median household income ($) - Multirace
Median household income ($) - Other Race
Median household income for houses/condos with a mortgage ($)
Median household income for apartments without a mortgage ($)
Races - White alone (%)
Races - White alone (% change since 2000)
Races - Black alone (%)
Races - Black alone (% change since 2000)
Races - American Indian alone (%)
Races - American Indian alone (% change since 2000)
Races - Asian alone (%)
Races - Asian alone (% change since 2000)
Races - Hispanic (%)
Races - Hispanic (% change since 2000)
Races - Native Hawaiian and Other Pacific Islander alone (%)
Races - Native Hawaiian and Other Pacific Islander alone (% change since 2000)
Races - Two or more races (%)
Races - Two or more races (% change since 2000)
Races - Other race alone (%)
Races - Other race alone (% change since 2000)
Racial diversity
Unemployment (%)
Unemployment (% change since 2000)
Unemployment (%) - White
Unemployment (%) - Black or African American
Unemployment (%) - Asian
Unemployment (%) - Hispanic or Latino
Unemployment (%) - American Indian and Alaska Native
Unemployment (%) - Multirace
Unemployment (%) - Other Race
Population density (people per square mile)
Population - Males (%)
Population - Females (%)
Population - Males (%) - White
Population - Males (%) - Black or African American
Population - Males (%) - Asian
Population - Males (%) - Hispanic or Latino
Population - Males (%) - American Indian and Alaska Native
Population - Males (%) - Multirace
Population - Males (%) - Other Race
Population - Females (%) - White
Population - Females (%) - Black or African American
Population - Females (%) - Asian
Population - Females (%) - Hispanic or Latino
Population - Females (%) - American Indian and Alaska Native
Population - Females (%) - Multirace
Population - Females (%) - Other Race
Coronavirus confirmed cases (May 13, 2024)
Deaths caused by coronavirus (May 13, 2024)
Coronavirus confirmed cases (per 100k population) (May 13, 2024)
Deaths caused by coronavirus (per 100k population) (May 13, 2024)
Daily increase in number of cases (May 13, 2024)
Weekly increase in number of cases (May 13, 2024)
Cases doubled (in days) (May 13, 2024)
Hospitalized patients (Apr 18, 2022)
Negative test results (Apr 18, 2022)
Total test results (Apr 18, 2022)
COVID Vaccine doses distributed (per 100k population) (Sep 19, 2023)
COVID Vaccine doses administered (per 100k population) (Sep 19, 2023)
COVID Vaccine doses distributed (Sep 19, 2023)
COVID Vaccine doses administered (Sep 19, 2023)
Likely homosexual households (%)
Likely homosexual households (% change since 2000)
Likely homosexual households - Lesbian couples (%)
Likely homosexual households - Lesbian couples (% change since 2000)
Likely homosexual households - Gay men (%)
Likely homosexual households - Gay men (% change since 2000)
Cost of living index
Median gross rent ($)
Median contract rent ($)
Median monthly housing costs ($)
Median house or condo value ($)
Median house or condo value ($ change since 2000)
Mean house or condo value by units in structure - 1, detached ($)
Mean house or condo value by units in structure - 1, attached ($)
Mean house or condo value by units in structure - 2 ($)
Mean house or condo value by units in structure by units in structure - 3 or 4 ($)
Mean house or condo value by units in structure - 5 or more ($)
Mean house or condo value by units in structure - Boat, RV, van, etc. ($)
Mean house or condo value by units in structure - Mobile home ($)
Median house or condo value ($) - White
Median house or condo value ($) - Black or African American
Median house or condo value ($) - Asian
Median house or condo value ($) - Hispanic or Latino
Median house or condo value ($) - American Indian and Alaska Native
Median house or condo value ($) - Multirace
Median house or condo value ($) - Other Race
Median resident age
Resident age diversity
Median resident age - Males
Median resident age - Females
Median resident age - White
Median resident age - Black or African American
Median resident age - Asian
Median resident age - Hispanic or Latino
Median resident age - American Indian and Alaska Native
Median resident age - Multirace
Median resident age - Other Race
Median resident age - Males - White
Median resident age - Males - Black or African American
Median resident age - Males - Asian
Median resident age - Males - Hispanic or Latino
Median resident age - Males - American Indian and Alaska Native
Median resident age - Males - Multirace
Median resident age - Males - Other Race
Median resident age - Females - White
Median resident age - Females - Black or African American
Median resident age - Females - Asian
Median resident age - Females - Hispanic or Latino
Median resident age - Females - American Indian and Alaska Native
Median resident age - Females - Multirace
Median resident age - Females - Other Race
Commute - mean travel time to work (minutes)
Travel time to work - Less than 5 minutes (%)
Travel time to work - Less than 5 minutes (% change since 2000)
Travel time to work - 5 to 9 minutes (%)
Travel time to work - 5 to 9 minutes (% change since 2000)
Travel time to work - 10 to 19 minutes (%)
Travel time to work - 10 to 19 minutes (% change since 2000)
Travel time to work - 20 to 29 minutes (%)
Travel time to work - 20 to 29 minutes (% change since 2000)
Travel time to work - 30 to 39 minutes (%)
Travel time to work - 30 to 39 minutes (% change since 2000)
Travel time to work - 40 to 59 minutes (%)
Travel time to work - 40 to 59 minutes (% change since 2000)
Travel time to work - 60 to 89 minutes (%)
Travel time to work - 60 to 89 minutes (% change since 2000)
Travel time to work - 90 or more minutes (%)
Travel time to work - 90 or more minutes (% change since 2000)
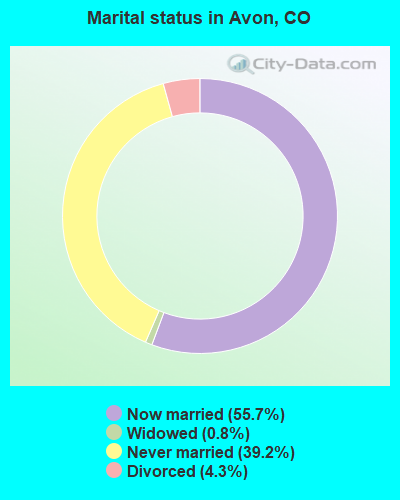
Marital status - Never married (%)
Marital status - Now married (%)
Marital status - Separated (%)
Marital status - Widowed (%)
Marital status - Divorced (%)
Median family income ($)
Median family income (% change since 2000)
Median non-family income ($)
Median non-family income (% change since 2000)
Median per capita income ($)
Median per capita income (% change since 2000)
Median family income ($) - White
Median family income ($) - Black or African American
Median family income ($) - Asian
Median family income ($) - Hispanic or Latino
Median family income ($) - American Indian and Alaska Native
Median family income ($) - Multirace
Median family income ($) - Other Race
Median year house/condo built
Median year apartment built
Year house built - Built 2005 or later (%)
Year house built - Built 2000 to 2004 (%)
Year house built - Built 1990 to 1999 (%)
Year house built - Built 1980 to 1989 (%)
Year house built - Built 1970 to 1979 (%)
Year house built - Built 1960 to 1969 (%)
Year house built - Built 1950 to 1959 (%)
Year house built - Built 1940 to 1949 (%)
Year house built - Built 1939 or earlier (%)
Average household size
Household density (households per square mile)
Average household size - White
Average household size - Black or African American
Average household size - Asian
Average household size - Hispanic or Latino
Average household size - American Indian and Alaska Native
Average household size - Multirace
Average household size - Other Race
Occupied housing units (%)
Vacant housing units (%)
Owner occupied housing units (%)
Renter occupied housing units (%)
Vacancy status - For rent (%)
Vacancy status - For sale only (%)
Vacancy status - Rented or sold, not occupied (%)
Vacancy status - For seasonal, recreational, or occasional use (%)
Vacancy status - For migrant workers (%)
Vacancy status - Other vacant (%)
Residents with income below the poverty level (%)
Residents with income below 50% of the poverty level (%)
Children below poverty level (%)
Poor families by family type - Married-couple family (%)
Poor families by family type - Male, no wife present (%)
Poor families by family type - Female, no husband present (%)
Poverty status for native-born residents (%)
Poverty status for foreign-born residents (%)
Poverty among high school graduates not in families (%)
Poverty among people who did not graduate high school not in families (%)
Residents with income below the poverty level (%) - White
Residents with income below the poverty level (%) - Black or African American
Residents with income below the poverty level (%) - Asian
Residents with income below the poverty level (%) - Hispanic or Latino
Residents with income below the poverty level (%) - American Indian and Alaska Native
Residents with income below the poverty level (%) - Multirace
Residents with income below the poverty level (%) - Other Race
Air pollution - Air Quality Index (AQI)
Air pollution - CO
Air pollution - NO2
Air pollution - SO2
Air pollution - Ozone
Air pollution - PM10
Air pollution - PM25
Air pollution - Pb
Crime - Murders per 100,000 population
Crime - Rapes per 100,000 population
Crime - Robberies per 100,000 population
Crime - Assaults per 100,000 population
Crime - Burglaries per 100,000 population
Crime - Thefts per 100,000 population
Crime - Auto thefts per 100,000 population
Crime - Arson per 100,000 population
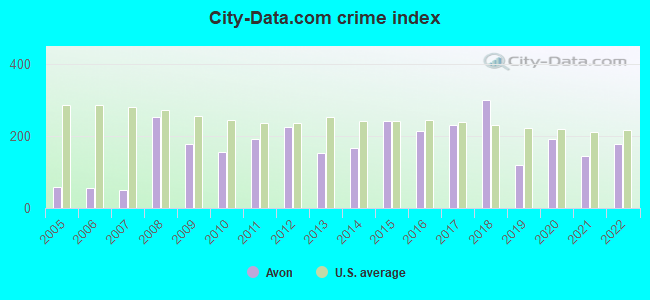
Crime - City-data.com crime index
Crime - Violent crime index
Crime - Property crime index
Crime - Murders per 100,000 population (5 year average)
Crime - Rapes per 100,000 population (5 year average)
Crime - Robberies per 100,000 population (5 year average)
Crime - Assaults per 100,000 population (5 year average)
Crime - Burglaries per 100,000 population (5 year average)
Crime - Thefts per 100,000 population (5 year average)
Crime - Auto thefts per 100,000 population (5 year average)
Crime - Arson per 100,000 population (5 year average)
Crime - City-data.com crime index (5 year average)
Crime - Violent crime index (5 year average)
Crime - Property crime index (5 year average)
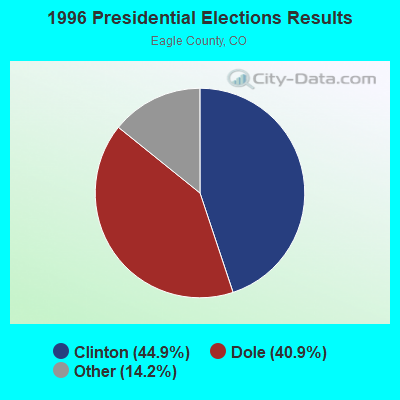
1996 Presidential Elections Results (%) - Democratic Party (Clinton)
1996 Presidential Elections Results (%) - Republican Party (Dole)
1996 Presidential Elections Results (%) - Other
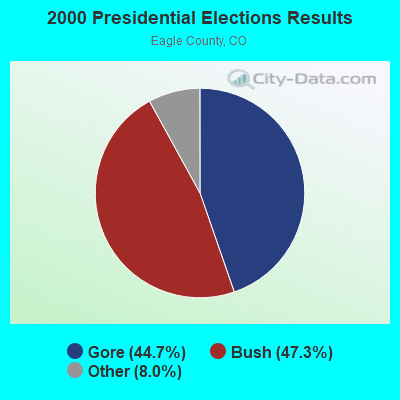
2000 Presidential Elections Results (%) - Democratic Party (Gore)
2000 Presidential Elections Results (%) - Republican Party (Bush)
2000 Presidential Elections Results (%) - Other
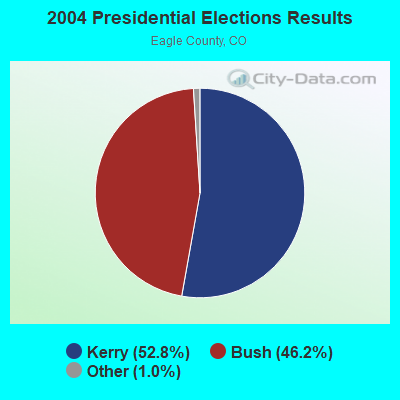
2004 Presidential Elections Results (%) - Democratic Party (Kerry)
2004 Presidential Elections Results (%) - Republican Party (Bush)
2004 Presidential Elections Results (%) - Other
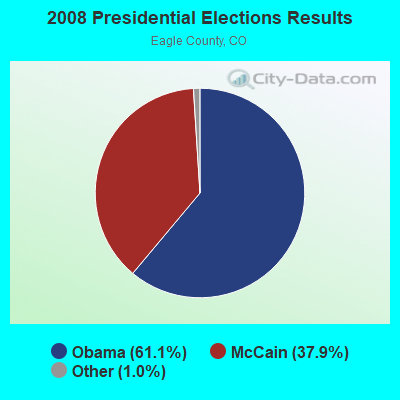
2008 Presidential Elections Results (%) - Democratic Party (Obama)
2008 Presidential Elections Results (%) - Republican Party (McCain)
2008 Presidential Elections Results (%) - Other
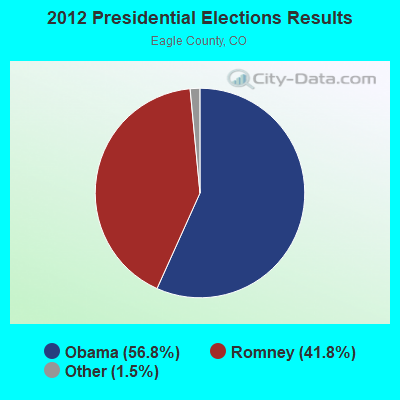
2012 Presidential Elections Results (%) - Democratic Party (Obama)
2012 Presidential Elections Results (%) - Republican Party (Romney)
2012 Presidential Elections Results (%) - Other
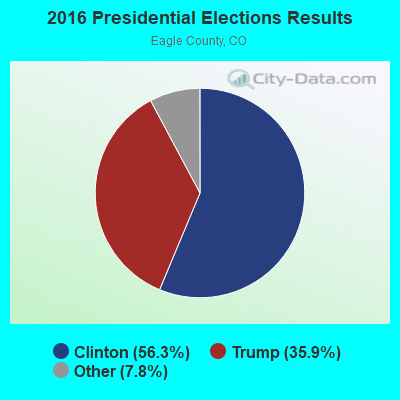
2016 Presidential Elections Results (%) - Democratic Party (Clinton)
2016 Presidential Elections Results (%) - Republican Party (Trump)
2016 Presidential Elections Results (%) - Other
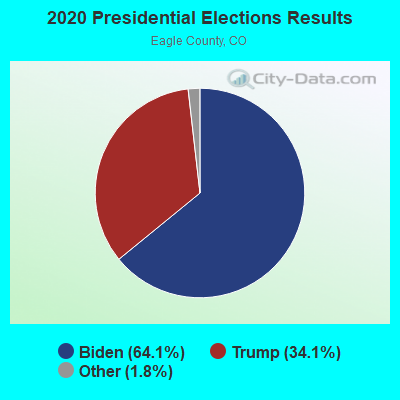
2020 Presidential Elections Results (%) - Democratic Party (Biden)
2020 Presidential Elections Results (%) - Republican Party (Trump)
2020 Presidential Elections Results (%) - Other
Ancestries Reported - Arab (%)
Ancestries Reported - Czech (%)
Ancestries Reported - Danish (%)
Ancestries Reported - Dutch (%)
Ancestries Reported - English (%)
Ancestries Reported - French (%)
Ancestries Reported - French Canadian (%)
Ancestries Reported - German (%)
Ancestries Reported - Greek (%)
Ancestries Reported - Hungarian (%)
Ancestries Reported - Irish (%)
Ancestries Reported - Italian (%)
Ancestries Reported - Lithuanian (%)
Ancestries Reported - Norwegian (%)
Ancestries Reported - Polish (%)
Ancestries Reported - Portuguese (%)
Ancestries Reported - Russian (%)
Ancestries Reported - Scotch-Irish (%)
Ancestries Reported - Scottish (%)
Ancestries Reported - Slovak (%)
Ancestries Reported - Subsaharan African (%)
Ancestries Reported - Swedish (%)
Ancestries Reported - Swiss (%)
Ancestries Reported - Ukrainian (%)
Ancestries Reported - United States (%)
Ancestries Reported - Welsh (%)
Ancestries Reported - West Indian (%)
Ancestries Reported - Other (%)
Educational Attainment - No schooling completed (%)
Educational Attainment - Less than high school (%)
Educational Attainment - High school or equivalent (%)
Educational Attainment - Less than 1 year of college (%)
Educational Attainment - 1 or more years of college (%)
Educational Attainment - Associate degree (%)
Educational Attainment - Bachelor's degree (%)
Educational Attainment - Master's degree (%)
Educational Attainment - Professional school degree (%)
Educational Attainment - Doctorate degree (%)
School Enrollment - Nursery, preschool (%)
School Enrollment - Kindergarten (%)
School Enrollment - Grade 1 to 4 (%)
School Enrollment - Grade 5 to 8 (%)
School Enrollment - Grade 9 to 12 (%)
School Enrollment - College undergrad (%)
School Enrollment - Graduate or professional (%)
School Enrollment - Not enrolled in school (%)
School enrollment - Public schools (%)
School enrollment - Private schools (%)
School enrollment - Not enrolled (%)
Median number of rooms in houses and condos
Median number of rooms in apartments
Housing units lacking complete plumbing facilities (%)
Housing units lacking complete kitchen facilities (%)
Density of houses
Urban houses (%)
Rural houses (%)
Households with people 60 years and over (%)
Households with people 65 years and over (%)
Households with people 75 years and over (%)
Households with one or more nonrelatives (%)
Households with no nonrelatives (%)
Population in households (%)
Family households (%)
Nonfamily households (%)
Population in families (%)
Family households with own children (%)
Median number of bedrooms in owner occupied houses
Mean number of bedrooms in owner occupied houses
Median number of bedrooms in renter occupied houses
Mean number of bedrooms in renter occupied houses
Median number of vehichles in owner occupied houses
Mean number of vehichles in owner occupied houses
Median number of vehichles in renter occupied houses
Mean number of vehichles in renter occupied houses
Mortgage status - with mortgage (%)
Mortgage status - with second mortgage (%)
Mortgage status - with home equity loan (%)
Mortgage status - with both second mortgage and home equity loan (%)
Mortgage status - without a mortgage (%)
Average family size
Average family size - White
Average family size - Black or African American
Average family size - Asian
Average family size - Hispanic or Latino
Average family size - American Indian and Alaska Native
Average family size - Multirace
Average family size - Other Race
Geographical mobility - Same house 1 year ago (%)
Geographical mobility - Moved within same county (%)
Geographical mobility - Moved from different county within same state (%)
Geographical mobility - Moved from different state (%)
Geographical mobility - Moved from abroad (%)
Place of birth - Born in state of residence (%)
Place of birth - Born in other state (%)
Place of birth - Native, outside of US (%)
Place of birth - Foreign born (%)
Housing units in structures - 1, detached (%)
Housing units in structures - 1, attached (%)
Housing units in structures - 2 (%)
Housing units in structures - 3 or 4 (%)
Housing units in structures - 5 to 9 (%)
Housing units in structures - 10 to 19 (%)
Housing units in structures - 20 to 49 (%)
Housing units in structures - 50 or more (%)
Housing units in structures - Mobile home (%)
Housing units in structures - Boat, RV, van, etc. (%)
House/condo owner moved in on average (years ago)
Renter moved in on average (years ago)
Year householder moved into unit - Moved in 1999 to March 2000 (%)
Year householder moved into unit - Moved in 1995 to 1998 (%)
Year householder moved into unit - Moved in 1990 to 1994 (%)
Year householder moved into unit - Moved in 1980 to 1989 (%)
Year householder moved into unit - Moved in 1970 to 1979 (%)
Year householder moved into unit - Moved in 1969 or earlier (%)
Means of transportation to work - Drove car alone (%)
Means of transportation to work - Carpooled (%)
Means of transportation to work - Public transportation (%)
Means of transportation to work - Bus or trolley bus (%)
Means of transportation to work - Streetcar or trolley car (%)
Means of transportation to work - Subway or elevated (%)
Means of transportation to work - Railroad (%)
Means of transportation to work - Ferryboat (%)
Means of transportation to work - Taxicab (%)
Means of transportation to work - Motorcycle (%)
Means of transportation to work - Bicycle (%)
Means of transportation to work - Walked (%)
Means of transportation to work - Other means (%)
Working at home (%)
Industry diversity
Most Common Industries - Agriculture, forestry, fishing and hunting, and mining (%)
Most Common Industries - Agriculture, forestry, fishing and hunting (%)
Most Common Industries - Mining, quarrying, and oil and gas extraction (%)
Most Common Industries - Construction (%)
Most Common Industries - Manufacturing (%)
Most Common Industries - Wholesale trade (%)
Most Common Industries - Retail trade (%)
Most Common Industries - Transportation and warehousing, and utilities (%)
Most Common Industries - Transportation and warehousing (%)
Most Common Industries - Utilities (%)
Most Common Industries - Information (%)
Most Common Industries - Finance and insurance, and real estate and rental and leasing (%)
Most Common Industries - Finance and insurance (%)
Most Common Industries - Real estate and rental and leasing (%)
Most Common Industries - Professional, scientific, and management, and administrative and waste management services (%)
Most Common Industries - Professional, scientific, and technical services (%)
Most Common Industries - Management of companies and enterprises (%)
Most Common Industries - Administrative and support and waste management services (%)
Most Common Industries - Educational services, and health care and social assistance (%)
Most Common Industries - Educational services (%)
Most Common Industries - Health care and social assistance (%)
Most Common Industries - Arts, entertainment, and recreation, and accommodation and food services (%)
Most Common Industries - Arts, entertainment, and recreation (%)
Most Common Industries - Accommodation and food services (%)
Most Common Industries - Other services, except public administration (%)
Most Common Industries - Public administration (%)
Occupation diversity
Most Common Occupations - Management, business, science, and arts occupations (%)
Most Common Occupations - Management, business, and financial occupations (%)
Most Common Occupations - Management occupations (%)
Most Common Occupations - Business and financial operations occupations (%)
Most Common Occupations - Computer, engineering, and science occupations (%)
Most Common Occupations - Computer and mathematical occupations (%)
Most Common Occupations - Architecture and engineering occupations (%)
Most Common Occupations - Life, physical, and social science occupations (%)
Most Common Occupations - Education, legal, community service, arts, and media occupations (%)
Most Common Occupations - Community and social service occupations (%)
Most Common Occupations - Legal occupations (%)
Most Common Occupations - Education, training, and library occupations (%)
Most Common Occupations - Arts, design, entertainment, sports, and media occupations (%)
Most Common Occupations - Healthcare practitioners and technical occupations (%)
Most Common Occupations - Health diagnosing and treating practitioners and other technical occupations (%)
Most Common Occupations - Health technologists and technicians (%)
Most Common Occupations - Service occupations (%)
Most Common Occupations - Healthcare support occupations (%)
Most Common Occupations - Protective service occupations (%)
Most Common Occupations - Fire fighting and prevention, and other protective service workers including supervisors (%)
Most Common Occupations - Law enforcement workers including supervisors (%)
Most Common Occupations - Food preparation and serving related occupations (%)
Most Common Occupations - Building and grounds cleaning and maintenance occupations (%)
Most Common Occupations - Personal care and service occupations (%)
Most Common Occupations - Sales and office occupations (%)
Most Common Occupations - Sales and related occupations (%)
Most Common Occupations - Office and administrative support occupations (%)
Most Common Occupations - Natural resources, construction, and maintenance occupations (%)
Most Common Occupations - Farming, fishing, and forestry occupations (%)
Most Common Occupations - Construction and extraction occupations (%)
Most Common Occupations - Installation, maintenance, and repair occupations (%)
Most Common Occupations - Production, transportation, and material moving occupations (%)
Most Common Occupations - Production occupations (%)
Most Common Occupations - Transportation occupations (%)
Most Common Occupations - Material moving occupations (%)
People in Group quarters - Institutionalized population (%)
People in Group quarters - Correctional institutions (%)
People in Group quarters - Federal prisons and detention centers (%)
People in Group quarters - Halfway houses (%)
People in Group quarters - Local jails and other confinement facilities (including police lockups) (%)
People in Group quarters - Military disciplinary barracks (%)
People in Group quarters - State prisons (%)
People in Group quarters - Other types of correctional institutions (%)
People in Group quarters - Nursing homes (%)
People in Group quarters - Hospitals/wards, hospices, and schools for the handicapped (%)
People in Group quarters - Hospitals/wards and hospices for chronically ill (%)
People in Group quarters - Hospices or homes for chronically ill (%)
People in Group quarters - Military hospitals or wards for chronically ill (%)
People in Group quarters - Other hospitals or wards for chronically ill (%)
People in Group quarters - Hospitals or wards for drug/alcohol abuse (%)
People in Group quarters - Mental (Psychiatric) hospitals or wards (%)
People in Group quarters - Schools, hospitals, or wards for the mentally retarded (%)
People in Group quarters - Schools, hospitals, or wards for the physically handicapped (%)
People in Group quarters - Institutions for the deaf (%)
People in Group quarters - Institutions for the blind (%)
People in Group quarters - Orthopedic wards and institutions for the physically handicapped (%)
People in Group quarters - Wards in general hospitals for patients who have no usual home elsewhere (%)
People in Group quarters - Wards in military hospitals for patients who have no usual home elsewhere (%)
People in Group quarters - Juvenile institutions (%)
People in Group quarters - Long-term care (%)
People in Group quarters - Homes for abused, dependent, and neglected children (%)
People in Group quarters - Residential treatment centers for emotionally disturbed children (%)
People in Group quarters - Training schools for juvenile delinquents (%)
People in Group quarters - Short-term care, detention or diagnostic centers for delinquent children (%)
People in Group quarters - Type of juvenile institution unknown (%)
People in Group quarters - Noninstitutionalized population (%)
People in Group quarters - College dormitories (includes college quarters off campus) (%)
People in Group quarters - Military quarters (%)
People in Group quarters - On base (%)
People in Group quarters - Barracks, unaccompanied personnel housing (UPH), (Enlisted/Officer), ;and similar group living quarters for military personnel (%)
People in Group quarters - Transient quarters for temporary residents (%)
People in Group quarters - Military ships (%)
People in Group quarters - Group homes (%)
People in Group quarters - Homes or halfway houses for drug/alcohol abuse (%)
People in Group quarters - Homes for the mentally ill (%)
People in Group quarters - Homes for the mentally retarded (%)
People in Group quarters - Homes for the physically handicapped (%)
People in Group quarters - Other group homes (%)
People in Group quarters - Religious group quarters (%)
People in Group quarters - Dormitories (%)
People in Group quarters - Agriculture workers' dormitories on farms (%)
People in Group quarters - Job Corps and vocational training facilities (%)
People in Group quarters - Other workers' dormitories (%)
People in Group quarters - Crews of maritime vessels (%)
People in Group quarters - Other nonhousehold living situations (%)
People in Group quarters - Other noninstitutional group quarters (%)
Residents speaking English at home (%)
Residents speaking English at home - Born in the United States (%)
Residents speaking English at home - Native, born elsewhere (%)
Residents speaking English at home - Foreign born (%)
Residents speaking Spanish at home (%)
Residents speaking Spanish at home - Born in the United States (%)
Residents speaking Spanish at home - Native, born elsewhere (%)
Residents speaking Spanish at home - Foreign born (%)
Residents speaking other language at home (%)
Residents speaking other language at home - Born in the United States (%)
Residents speaking other language at home - Native, born elsewhere (%)
Residents speaking other language at home - Foreign born (%)
Class of Workers - Employee of private company (%)
Class of Workers - Self-employed in own incorporated business (%)
Class of Workers - Private not-for-profit wage and salary workers (%)
Class of Workers - Local government workers (%)
Class of Workers - State government workers (%)
Class of Workers - Federal government workers (%)
Class of Workers - Self-employed workers in own not incorporated business and Unpaid family workers (%)
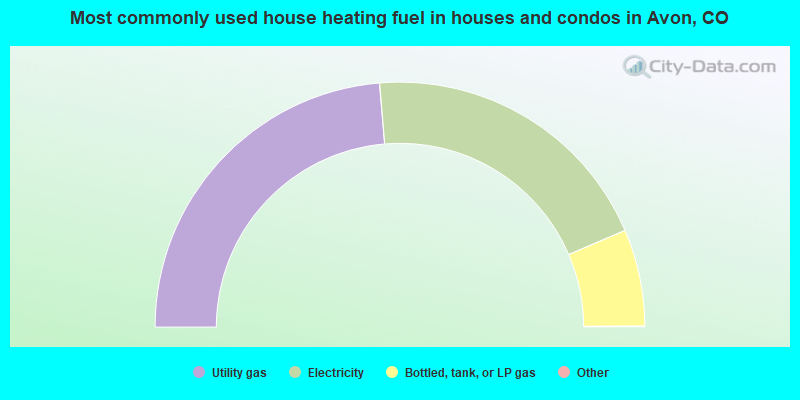
House heating fuel used in houses and condos - Utility gas (%)
House heating fuel used in houses and condos - Bottled, tank, or LP gas (%)
House heating fuel used in houses and condos - Electricity (%)
House heating fuel used in houses and condos - Fuel oil, kerosene, etc. (%)
House heating fuel used in houses and condos - Coal or coke (%)
House heating fuel used in houses and condos - Wood (%)
House heating fuel used in houses and condos - Solar energy (%)
House heating fuel used in houses and condos - Other fuel (%)
House heating fuel used in houses and condos - No fuel used (%)
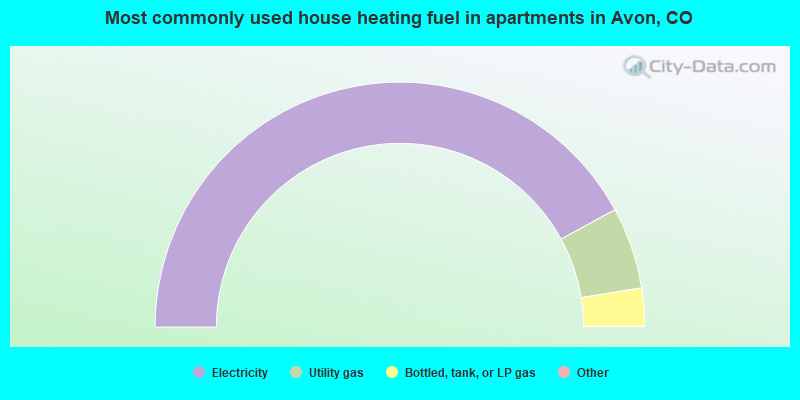
House heating fuel used in apartments - Utility gas (%)
House heating fuel used in apartments - Bottled, tank, or LP gas (%)
House heating fuel used in apartments - Electricity (%)
House heating fuel used in apartments - Fuel oil, kerosene, etc. (%)
House heating fuel used in apartments - Coal or coke (%)
House heating fuel used in apartments - Wood (%)
House heating fuel used in apartments - Solar energy (%)
House heating fuel used in apartments - Other fuel (%)
House heating fuel used in apartments - No fuel used (%)
Armed forces status - In Armed Forces (%)
Armed forces status - Civilian (%)
Armed forces status - Civilian - Veteran (%)
Armed forces status - Civilian - Nonveteran (%)
Fatal accidents locations in years 2005-2021
Fatal accidents locations in 2005
Fatal accidents locations in 2006
Fatal accidents locations in 2007
Fatal accidents locations in 2008
Fatal accidents locations in 2009
Fatal accidents locations in 2010
Fatal accidents locations in 2011
Fatal accidents locations in 2012
Fatal accidents locations in 2013
Fatal accidents locations in 2014
Fatal accidents locations in 2015
Fatal accidents locations in 2016
Fatal accidents locations in 2017
Fatal accidents locations in 2018
Fatal accidents locations in 2019
Fatal accidents locations in 2020
Fatal accidents locations in 2021
Alcohol use - People drinking some alcohol every month (%)
Alcohol use - People not drinking at all (%)
Alcohol use - Average days/month drinking alcohol
Alcohol use - Average drinks/week
Alcohol use - Average days/year people drink much
Audiometry - Average condition of hearing (%)
Audiometry - People that can hear a whisper from across a quiet room (%)
Audiometry - People that can hear normal voice from across a quiet room (%)
Audiometry - Ears ringing, roaring, buzzing (%)
Audiometry - Had a job exposure to loud noise (%)
Audiometry - Had off-work exposure to loud noise (%)
Blood Pressure & Cholesterol - Has high blood pressure (%)
Blood Pressure & Cholesterol - Checking blood pressure at home (%)
Blood Pressure & Cholesterol - Frequently checking blood cholesterol (%)
Blood Pressure & Cholesterol - Has high cholesterol level (%)
Consumer Behavior - Money monthly spent on food at supermarket/grocery store
Consumer Behavior - Money monthly spent on food at other stores
Consumer Behavior - Money monthly spent on eating out
Consumer Behavior - Money monthly spent on carryout/delivered foods
Consumer Behavior - Income spent on food at supermarket/grocery store (%)
Consumer Behavior - Income spent on food at other stores (%)
Consumer Behavior - Income spent on eating out (%)
Consumer Behavior - Income spent on carryout/delivered foods (%)
Current Health Status - General health condition (%)
Current Health Status - Blood donors (%)
Current Health Status - Has blood ever tested for HIV virus (%)
Current Health Status - Left-handed people (%)
Dermatology - People using sunscreen (%)
Diabetes - Diabetics (%)
Diabetes - Had a blood test for high blood sugar (%)
Diabetes - People taking insulin (%)
Diet Behavior & Nutrition - Diet health (%)
Diet Behavior & Nutrition - Milk product consumption (# of products/month)
Diet Behavior & Nutrition - Meals not home prepared (#/week)
Diet Behavior & Nutrition - Meals from fast food or pizza place (#/week)
Diet Behavior & Nutrition - Ready-to-eat foods (#/month)
Diet Behavior & Nutrition - Frozen meals/pizza (#/month)
Drug Use - People that ever used marijuana or hashish (%)
Drug Use - Ever used hard drugs (%)
Drug Use - Ever used any form of cocaine (%)
Drug Use - Ever used heroin (%)
Drug Use - Ever used methamphetamine (%)
Health Insurance - People covered by health insurance (%)
Kidney Conditions-Urology - Avg. # of times urinating at night
Medical Conditions - People with asthma (%)
Medical Conditions - People with anemia (%)
Medical Conditions - People with psoriasis (%)
Medical Conditions - People with overweight (%)
Medical Conditions - Elderly people having difficulties in thinking or remembering (%)
Medical Conditions - People who ever received blood transfusion (%)
Medical Conditions - People having trouble seeing even with glass/contacts (%)
Medical Conditions - People with arthritis (%)
Medical Conditions - People with gout (%)
Medical Conditions - People with congestive heart failure (%)
Medical Conditions - People with coronary heart disease (%)
Medical Conditions - People with angina pectoris (%)
Medical Conditions - People who ever had heart attack (%)
Medical Conditions - People who ever had stroke (%)
Medical Conditions - People with emphysema (%)
Medical Conditions - People with thyroid problem (%)
Medical Conditions - People with chronic bronchitis (%)
Medical Conditions - People with any liver condition (%)
Medical Conditions - People who ever had cancer or malignancy (%)
Mental Health - People who have little interest in doing things (%)
Mental Health - People feeling down, depressed, or hopeless (%)
Mental Health - People who have trouble sleeping or sleeping too much (%)
Mental Health - People feeling tired or having little energy (%)
Mental Health - People with poor appetite or overeating (%)
Mental Health - People feeling bad about themself (%)
Mental Health - People who have trouble concentrating on things (%)
Mental Health - People moving or speaking slowly or too fast (%)
Mental Health - People having thoughts they would be better off dead (%)
Oral Health - Average years since last visit a dentist
Oral Health - People embarrassed because of mouth (%)
Oral Health - People with gum disease (%)
Oral Health - General health of teeth and gums (%)
Oral Health - Average days a week using dental floss/device
Oral Health - Average days a week using mouthwash for dental problem
Oral Health - Average number of teeth
Pesticide Use - Households using pesticides to control insects (%)
Pesticide Use - Households using pesticides to kill weeds (%)
Physical Activity - People doing vigorous-intensity work activities (%)
Physical Activity - People doing moderate-intensity work activities (%)
Physical Activity - People walking or bicycling (%)
Physical Activity - People doing vigorous-intensity recreational activities (%)
Physical Activity - People doing moderate-intensity recreational activities (%)
Physical Activity - Average hours a day doing sedentary activities
Physical Activity - Average hours a day watching TV or videos
Physical Activity - Average hours a day using computer
Physical Functioning - People having limitations keeping them from working (%)
Physical Functioning - People limited in amount of work they can do (%)
Physical Functioning - People that need special equipment to walk (%)
Physical Functioning - People experiencing confusion/memory problems (%)
Physical Functioning - People requiring special healthcare equipment (%)
Prescription Medications - Average number of prescription medicines taking
Preventive Aspirin Use - Adults 40+ taking low-dose aspirin (%)
Reproductive Health - Vaginal deliveries (%)
Reproductive Health - Cesarean deliveries (%)
Reproductive Health - Deliveries resulted in a live birth (%)
Reproductive Health - Pregnancies resulted in a delivery (%)
Reproductive Health - Women breastfeeding newborns (%)
Reproductive Health - Women that had a hysterectomy (%)
Reproductive Health - Women that had both ovaries removed (%)
Reproductive Health - Women that have ever taken birth control pills (%)
Reproductive Health - Women taking birth control pills (%)
Reproductive Health - Women that have ever used Depo-Provera or injectables (%)
Reproductive Health - Women that have ever used female hormones (%)
Sexual Behavior - People 18+ that ever had sex (vaginal, anal, or oral) (%)
Sexual Behavior - Males 18+ that ever had vaginal sex with a woman (%)
Sexual Behavior - Males 18+ that ever performed oral sex on a woman (%)
Sexual Behavior - Males 18+ that ever had anal sex with a woman (%)
Sexual Behavior - Males 18+ that ever had any sex with a man (%)
Sexual Behavior - Females 18+ that ever had vaginal sex with a man (%)
Sexual Behavior - Females 18+ that ever performed oral sex on a man (%)
Sexual Behavior - Females 18+ that ever had anal sex with a man (%)
Sexual Behavior - Females 18+ that ever had any kind of sex with a woman (%)
Sexual Behavior - Average age people first had sex
Sexual Behavior - Average number of female sex partners in lifetime (males 18+)
Sexual Behavior - Average number of female vaginal sex partners in lifetime (males 18+)
Sexual Behavior - Average age people first performed oral sex on a woman (18+)
Sexual Behavior - Average number of woman performed oral sex on in lifetime (18+)
Sexual Behavior - Average number of male sex partners in lifetime (males 18+)
Sexual Behavior - Average number of male anal sex partners in lifetime (males 18+)
Sexual Behavior - Average age people first performed oral sex on a man (18+)
Sexual Behavior - Average number of male oral sex partners in lifetime (18+)
Sexual Behavior - People using protection when performing oral sex (%)
Sexual Behavior - Average number of times people have vaginal or anal sex a year
Sexual Behavior - People having sex without condom (%)
Sexual Behavior - Average number of male sex partners in lifetime (females 18+)
Sexual Behavior - Average number of male vaginal sex partners in lifetime (females 18+)
Sexual Behavior - Average number of female sex partners in lifetime (females 18+)
Sexual Behavior - Circumcised males 18+ (%)
Sleep Disorders - Average hours sleeping at night
Sleep Disorders - People that has trouble sleeping (%)
Smoking-Cigarette Use - People smoking cigarettes (%)
Taste & Smell - People 40+ having problems with smell (%)
Taste & Smell - People 40+ having problems with taste (%)
Taste & Smell - People 40+ that ever had wisdom teeth removed (%)
Taste & Smell - People 40+ that ever had tonsils teeth removed (%)
Taste & Smell - People 40+ that ever had a loss of consciousness because of a head injury (%)
Taste & Smell - People 40+ that ever had a broken nose or other serious injury to face or skull (%)
Taste & Smell - People 40+ that ever had two or more sinus infections (%)
Weight - Average height (inches)
Weight - Average weight (pounds)
Weight - Average BMI
Weight - People that are obese (%)
Weight - People that ever were obese (%)
Weight - People trying to lose weight (%)
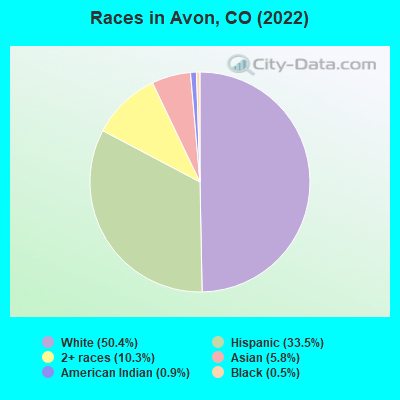
3,120 50.4% White alone 2,070 33.5% Hispanic 639 10.3% Two or more races 356 5.8% Asian alone 55 0.9% American Indian alone 30 0.5% Black alone
According to our research of Colorado and other state lists, there was 1 registered sex offender living in Avon, Colorado as of May 13, 2024 . The ratio of all residents to sex offenders in Avon is 6,661 to 1.The ratio of registered sex offenders to all residents in this city is much lower than the state average.
Officers per 1,000 residents here:
2.14Colorado average:
2.14
Latest news from Avon, CO collected exclusively by city-data.com from local newspapers, TV, and radio stations
Ancestries: Italian (10.8%), English (7.7%), European (7.2%), Irish (6.1%), Norwegian (2.5%), Scottish (1.8%).
Current Local Time:
Land area: 7.99 square miles.
Population density: 741 people per square mile (low).
1,430 residents are foreign born (15.5% Latin America , 6.0% Asia ).
This town:
23.1%Colorado:
9.5%
Median real estate property taxes paid for housing units in 2000: Avon town:
0.8% ($1,897)Colorado:
0.7% ($1,132)
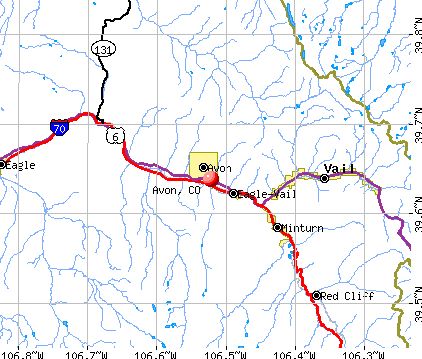
Nearest city with pop. 50,000+: Boulder, CO
Nearest city with pop. 200,000+: Northeast Jefferson, CO (75.6 miles
Nearest city with pop. 1,000,000+: Phoenix, AZ
Nearest cities:
Wolcott, CO (3.1 miles),
Fulford, CO (3.3 miles),
Latitude: 39.64 N, Longitude: 106.52 W
Daytime population change due to commuting: +722 (+11.7%)Workers who live and work in this town: 1,709 (45.7%)
Area code commonly used in this area: 970
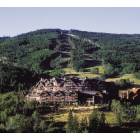
Avon tourist attractions:
Single-family new house construction building permits:
2022: 13 buildings , average cost: $1,264,2002021: 16 buildings , average cost: $916,0002020: 7 buildings , average cost: $915,0002018: 24 buildings , average cost: $340,0002017: 6 buildings , average cost: $3,155,0002016: 7 buildings , average cost: $1,221,6002015: 8 buildings , average cost: $2,030,9002014: 7 buildings , average cost: $2,030,9002013: 10 buildings , average cost: $974,5002012: 4 buildings , average cost: $612,1002011: 8 buildings , average cost: $634,4002010: 7 buildings , average cost: $1,400,9002009: 2 buildings , average cost: $800,0002008: 7 buildings , average cost: $1,595,0002007: 10 buildings , average cost: $1,227,8002006: 11 buildings , average cost: $1,227,8002005: 25 buildings , average cost: $652,1002004: 20 buildings , average cost: $645,9002003: 20 buildings , average cost: $389,8002002: 52 buildings , average cost: $251,9002001: 18 buildings , average cost: $777,9002000: 36 buildings , average cost: $726,0001999: 38 buildings , average cost: $403,4001998: 31 buildings , average cost: $332,3001997: 19 buildings , average cost: $300,600Unemployment in December 2023: Population change in the 1990s: +3,755 (+207.9%).
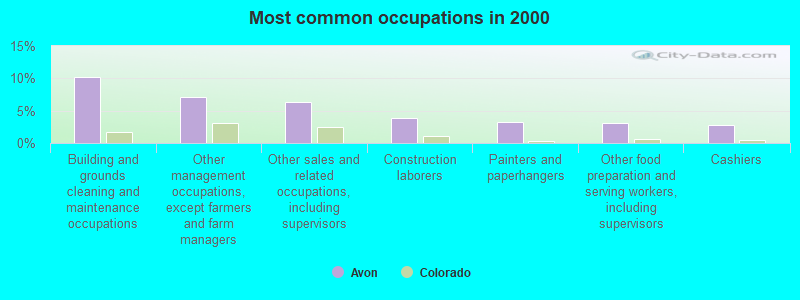
Most common occupations in Avon, CO (%)
Both Males Females
Building and grounds cleaning and maintenance occupations (10.1%)
Other management occupations, except farmers and farm managers (7.1%)
Other sales and related occupations, including supervisors (6.4%)
Construction laborers (3.8%)
Painters and paperhangers (3.3%)
Other food preparation and serving workers, including supervisors (3.1%)
Cashiers (2.8%)
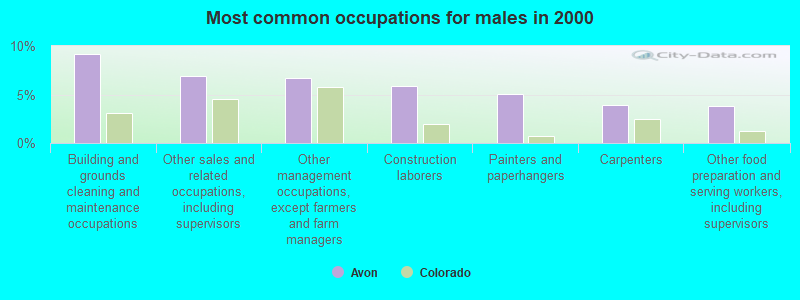
Building and grounds cleaning and maintenance occupations (9.1%)
Other sales and related occupations, including supervisors (6.9%)
Other management occupations, except farmers and farm managers (6.7%)
Construction laborers (5.9%)
Painters and paperhangers (5.0%)
Carpenters (3.9%)
Other food preparation and serving workers, including supervisors (3.9%)
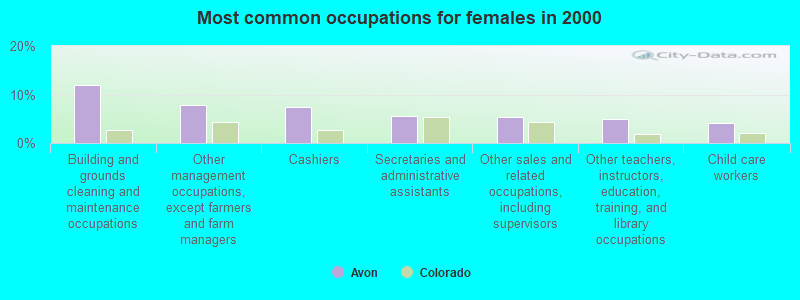
Building and grounds cleaning and maintenance occupations (12.0%)
Other management occupations, except farmers and farm managers (7.8%)
Cashiers (7.4%)
Secretaries and administrative assistants (5.5%)
Other sales and related occupations, including supervisors (5.5%)
Other teachers, instructors, education, training, and library occupations (5.0%)
Child care workers (4.0%)
Earthquake activity:
Avon-area historical earthquake activity is significantly above Colorado state average. It is 937% greater than the overall U.S. average. On 8/18/1959 at 06:37:13, a magnitude 7.7 (7.7 UK, Class: Major, Intensity: VIII - XII) earthquake occurred 401.3 miles away from the city center, causing $26,000,000 total damage On 10/28/1983 at 14:06:06, a magnitude 7.3 (6.2 MB, 7.3 MS, 7.0 MW) earthquake occurred 484.4 miles away from Avon center, causing 2 deaths ( 2 shaking deaths) and 3 injuries, causing $15,000,000 total damage On 10/18/1984 at 15:30:23, a magnitude 5.5 (5.4 MB, 5.1 MS, 5.5 ML, Class: Moderate, Intensity: VI - VII) earthquake occurred 197.1 miles away from the city center On 3/28/1975 at 02:31:05, a magnitude 6.2 (6.1 MB, 6.0 MS, 6.2 ML, Class: Strong, Intensity: VII - IX) earthquake occurred 352.1 miles away from the city center On 10/3/1915 at 06:52:48, a magnitude 7.6 (7.6 UK) earthquake occurred 583.8 miles away from Avon center On 8/23/2011 at 05:46:18, a magnitude 5.3 (5.3 MW, Depth: 2.5 mi) earthquake occurred 203.7 miles away from the city center Magnitude types: body-wave magnitude (MB), local magnitude (ML), surface-wave magnitude (MS), moment magnitude (MW) Natural disasters: The number of natural disasters in Eagle County (6) is a lot smaller than the US average (15).Major Disasters (Presidential) Declared: 2Emergencies Declared: 2Fires: 2, Drought: 1, Flood: 1, Hurricane: 1, Landslide: 1, Mudslide: 1, Storm: 1, Other: 1 (Note: some incidents may be assigned to more than one category). Main business address for: VAIL RESORTS INC SERVICES-MISCELLANEOUS AMUSEMENT & RECREATION ).
Hospitals and medical centers near Avon: VAIL VALLEY MEDICAL CENTER (about 8 miles away; VAIL, CO)
Amtrak stations near Avon: 10 miles: VAIL (241 S. FRONTAGE RD.) - Bus Station 17 miles: EAGLE (432 GRAND ST.) - Bus Station Colleges/universities with over 2000 students nearest to Avon:
Colorado Mountain College (about 44 miles; Glenwood Springs, CO ; Full-time enrollment: 3,463)
Colorado School of Mines (about 70 miles; Golden, CO ; FT enrollment: 5,507)
University of Colorado Boulder (about 72 miles; Boulder, CO ; FT enrollment: 28,328)
Red Rocks Community College (about 74 miles; Lakewood, CO ; FT enrollment: 6,185)
Colorado Christian University (about 77 miles; Lakewood, CO ; FT enrollment: 2,959)
Western State Colorado University (about 79 miles; Gunnison, CO ; FT enrollment: 2,023)
Regis University (about 80 miles; Denver, CO ; FT enrollment: 6,975)
Public elementary/middle schools in Avon: AVON ELEMENTARY SCHOOL Students: 384, Location: 805 WEST BEAVER CREEK, Grades: PK-5)STONE CREEK SCHOOL Students: 212, Location: 0375 YODER AVE, Grades: KG-8, Charter school )HOMESTAKE PEAK SCHOOL Location: 750 EAGLE ROAD, Grades: PK-8)
Private elementary/middle school in Avon: THE VAIL ACADEMY Students: 119, Location: 39209 HIGHWAY 6, Grades: KG-8)
See full list of schools located in Avon User-submitted facts and corrections:
not the home of avon products
Notable locations in Avon: (A) , Eagle River Fire Protection District Station 8 Wildridge (B) , Eagle River Fire Protection District Station 7 Avon (C) . Display/hide their locations on the map
Reservoirs: (A) , Nottingham Reservoir (B) . Display/hide their locations on the map
Creeks: (A) , Beaver Creek (B) , Buck Creek (C) . Display/hide their locations on the map
Tourist attractions: (1) , Literacy Project (Cultural Attractions- Events- & Facilities; 200 Benchmark Road) (2) . Display/hide their approximate locations on the map
Hotels: (1) , Beaver Creek Lodge (26 Avondale Lane) (2) , Camberley Club Hotel (141 Scotthill Road) (3) , Comfort Inn Beaver Creek (0161 West Beaver Creek Boulevard) (4) , Buckcreek Condominiums (520 West Beaver Creek Boulevard) (5) , Highlands Westview (32 Highlands Lane) (6) , Buckcreek Condo (Unit C-103) (7) , Inn at Beaver Creek (10 Elk Track Lane) (8) , Elkhorn (51 Offerson Road) (9) . Display/hide their approximate locations on the map
Eagle County has a predicted average indoor radon screening level between 2 and 4 pCi/L (pico curies per liter) - Moderate Potential Drinking water stations with addresses in Avon and their reported violations in the past:
ROUNDUP RIVER RANCH (Population served: 110, Groundwater under infl of surface water):
Past monitoring violations:
Monitoring of Treatment (SWTR-Filter) - In OCT-2012. Follow-up actions: St Public Notif requested (DEC-12-2012), St Violation/Reminder Notice (DEC-12-2012)
Monitoring of Treatment (SWTR-Filter) - In AUG-2012. Follow-up actions: St Violation/Reminder Notice (OCT-17-2012), St Public Notif requested (OCT-17-2012), St Public Notif received (DEC-19-2012)
Monitoring of Treatment (SWTR-Filter) - In JUL-2012. Follow-up actions: St Violation/Reminder Notice (SEP-17-2012), St Public Notif requested (SEP-17-2012), St Public Notif received (DEC-19-2012)
2 routine major monitoring violations
Average household size: This town:
2.8 peopleColorado:
2.5 people
Percentage of family households: This town:
54.6%Whole state:
63.9%
Percentage of households with unmarried partners: This town:
10.1%Whole state:
6.5%
Likely homosexual households (counted as self-reported same-sex unmarried-partner households)
Lesbian couples: 0.2% of all households Gay men: 0.5% of all households
249 people in agriculture workers' dormitories on farms in 2000people in other workers' dormitories in 2000
Banks with branches in Avon (2011 data):
FirstBank: Avon Branch at 0011 West Beaver Creek Boulevard, branch established on 1981/10/20. Info updated 2011/12/05: Bank assets: $11,597.1 mil, Deposits: $10,530.4 mil, headquarters in Lakewood, CO, positive income , Mortgage Lending Specialization, 130 total offices , Holding Company: Firstbank Holding Company
Academy Bank, National Association: Yoder Avenue Branch at 171 Yoder Avenue, branch established on 2005/03/31. Info updated 2008/06/10: Bank assets: $282.1 mil, Deposits: $218.0 mil, headquarters in Colorado Springs, CO, positive income , Commercial Lending Specialization, 54 total offices , Holding Company: Dickinson Financial Corporation Ii
Wells Fargo Bank, National Association: Avon Chapel Branch at 245 Chapel Pl, branch established on 1996/04/08. Info updated 2011/04/05: Bank assets: $1,161,490.0 mil, Deposits: $905,653.0 mil, headquarters in Sioux Falls, SD, positive income , 6395 total offices , Holding Company: Wells Fargo & Company
ANB Bank: Avon Branch at 71 Beaver Creek Place, branch established on 2005/02/22. Info updated 2012/01/03: Bank assets: $1,746.7 mil, Deposits: $1,394.3 mil, headquarters in Denver, CO, positive income , Mortgage Lending Specialization, 35 total offices , Holding Company: Sturm Financial Group, Inc.
U.S. Bank National Association: Avon Branch at 15 W Benchmark Road, branch established on 1994/01/24. Info updated 2012/01/30: Bank assets: $330,470.8 mil, Deposits: $236,091.5 mil, headquarters in Cincinnati, OH, positive income , 3121 total offices , Holding Company: U.S. Bancorp
Bank Midwest, National Association: Avon Branch at 70 W Benchmark Road Suite 101, branch established on 2005/07/18. Info updated 2012/03/19: Bank assets: $6,237.6 mil, Deposits: $5,064.6 mil, headquarters in Kansas City, MO, positive income , 138 total offices , Holding Company: Nbh Holdings Corp.
Alpine Bank: Avon Branch at 10 West Beaver Creek Boulevard, branch established on 1997/04/04. Info updated 2006/11/03: Bank assets: $2,256.5 mil, Deposits: $1,918.7 mil, headquarters in Glenwood Springs, CO, positive income , Commercial Lending Specialization, 43 total offices , Holding Company: Alpine Banks Of Colorado
For population 15 years and over in Avon:
Never married: 39.2%Now married: 55.7%Separated: 0.0%Widowed: 0.8%Divorced: 4.3% For population 25 years and over in Avon:
High school or higher: 94.1%Bachelor's degree or higher: 42.4%Graduate or professional degree: 14.8%Unemployed: 6.0%Mean travel time to work (commute): 16.6 minutes
Education Gini index (Inequality in education) Here:
10.7Colorado average:
11.1
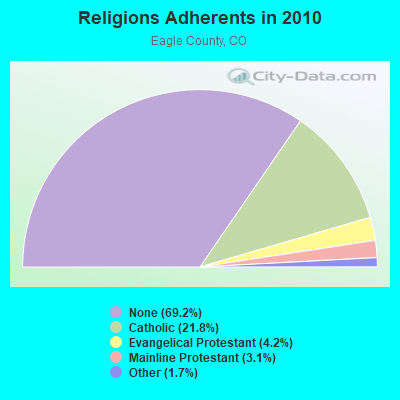
Religion statistics for Avon, CO (based on Eagle County data)
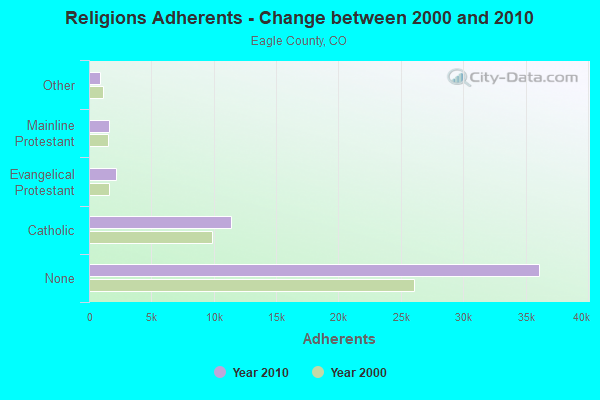
Religion Adherents Congregations Catholic 11,373 6 Evangelical Protestant 2,199 18 Mainline Protestant 1,627 6 Other 882 6 None 36,116 -
Source: Clifford Grammich, Kirk Hadaway, Richard Houseal, Dale E.Jones, Alexei Krindatch, Richie Stanley and Richard H.Taylor. 2012. 2010 U.S.Religion Census: Religious Congregations & Membership Study. Association of Statisticians of American Religious Bodies. Jones, Dale E., et al. 2002. Congregations and Membership in the United States 2000. Nashville, TN: Glenmary Research Center. Graphs represent county-level data
Food Environment Statistics: Number of grocery stores : 15Eagle County :
2.95 / 10,000 pop.Colorado :
1.50 / 10,000 pop.
Number of supercenters and club stores : 1This county :
0.20 / 10,000 pop.State :
0.15 / 10,000 pop.
Number of convenience stores (no gas) : 1Eagle County :
0.20 / 10,000 pop.Colorado :
0.45 / 10,000 pop.
Number of convenience stores (with gas) : 14Eagle County :
2.75 / 10,000 pop.State :
3.13 / 10,000 pop.
Number of full-service restaurants : 121Here :
23.78 / 10,000 pop.State :
8.99 / 10,000 pop.
Adult diabetes rate : This county :
3.2%Colorado :
5.3%
Adult obesity rate : Eagle County :
13.0%Colorado :
18.4%
Low-income preschool obesity rate : This county :
13.3%State :
9.6%
Health and Nutrition:
Average overall health of teeth and gums : People feeling badly about themselves : People not drinking alcohol at all : Average hours sleeping at night : General health condition : Average condition of hearing : This city:
83.0%Colorado:
80.2%
More about Health and Nutrition of Avon, CO Residents
Local government employment and payroll (March 2022)
Function
Full-time employees
Monthly full-time payroll
Average yearly full-time wage
Part-time employees
Monthly part-time payroll
Transit
18 $105,298 $70,199 14 $31,620 Police Protection - Officers
15 $131,859 $105,487 2 $4,511 Parks and Recreation
14 $90,573 $77,634 42 $34,674 Streets and Highways
12 $74,307 $74,307 0 $0 Other and Unallocable
9 $64,254 $85,672 0 $0 Other Government Administration
7 $26,626 $45,645 14 $5,266 Financial Administration
7 $57,047 $97,795 1 $2,790 Police - Other
5 $43,630 $104,712 0 $0 Housing and Community Development (Local)
3 $19,579 $78,316 0 $0 Judicial and Legal
2 $8,093 $48,558 1 $1,895 Electric Power
1 $7,205 $86,460 0 $0
Totals for Government
93 $628,471 $81,093 74 $80,756
Avon government finances - Expenditure in 2017 (per resident):
Construction - Housing and Community Development: $252,000 ($42.56)
Current Operations - Police Protection: $3,123,000 ($527.44)
General Public Buildings: $2,753,000 ($464.96)Parks and Recreation: $2,364,000 ($399.26)Central Staff Services: $1,476,000 ($249.28)Financial Administration: $803,000 ($135.62)General - Other: $801,000 ($135.28)Housing and Community Development: $636,000 ($107.41)Judicial and Legal Services: $240,000 ($40.53)Public Welfare - Other: $208,000 ($35.13)Protective Inspection and Regulation - Other: $142,000 ($23.98)Transit Utilities: $30,000 ($5.07)General - Interest on Debt: $218,000 ($36.82)
Intergovernmental to Local - Other - Housing and Community Development: $39,000 ($6.59)
Other Capital Outlay - Transit Utilities: $57,000 ($9.63)
Housing and Community Development: $33,000 ($5.57)Total Salaries and Wages: $5,607,000 ($946.97)
Avon government finances - Revenue in 2017 (per resident):
Charges - Other: $1,951,000 ($329.51)
Federal Intergovernmental - Highways: $8,000 ($1.35)
Other: $2,000 ($0.34)Local Intergovernmental - Other: $445,000 ($75.16)
Highways: $128,000 ($21.62)Transit Utilities: $42,000 ($7.09)Public Welfare: $7,000 ($1.18)Miscellaneous - General Revenue - Other: $220,000 ($37.16)
Fines and Forfeits: $91,000 ($15.37)Interest Earnings: $77,000 ($13.00)Revenue - Transit Utilities: $2,000 ($0.34)
State Intergovernmental - Other: $230,000 ($38.84)
Highways: $193,000 ($32.60)Transit Utilities: $13,000 ($2.20)Tax - General Sales and Gross Receipts: $8,097,000 ($1367.51)
Property: $2,804,000 ($473.57)Documentary and Stock Transfer: $2,611,000 ($440.97)Occupation and Business License - Other: $252,000 ($42.56)Other Selective Sales: $123,000 ($20.77)Public Utilities Sales: $103,000 ($17.40)Alcoholic Beverage License: $8,000 ($1.35)Other: $2,000 ($0.34)
Avon government finances - Debt in 2017 (per resident):
Long Term Debt - Beginning Outstanding - Unspecified Public Purpose: $6,200,000 ($1047.12)
Outstanding Unspecified Public Purpose: $5,790,000 ($977.88)Retired Unspecified Public Purpose: $410,000 ($69.25)
Avon government finances - Cash and Securities in 2017 (per resident):
Other Funds - Cash and Securities: $3,928,000 ($663.40)
Sinking Funds - Cash and Securities: $633,000 ($106.91)
Businesses in Avon, CO
Name Count Name Count
7-Eleven 1 McDonald's 1 AT&T 3 Nike 3 Big O Tires 1 Office Depot 1 Burger King 1 Pier 1 Imports 1 Comfort Inn 1 RadioShack 1 Dennys 1 Sheraton 1 Domino's Pizza 1 Starbucks 3 FedEx 7 Subway 1 GNC 1 U-Haul 1 GameStop 1 UPS 7 Home Depot 1 Vans 1 Hyatt 2 Walmart 1 Kroger 1 Westin 2 Marriott 1
Strongest AM radio stations in Avon:
KSKE (610 AM; 5 kW; VAIL, CO; Owner: PILGRIM COMMUNICATIONS, INC.)
KKZN (760 AM; 50 kW; THORNTON, CO; Owner: JACOR BROADCASTING OF COLORADO, INC.)
KLTT (670 AM; 50 kW; COMMERCE CITY, CO; Owner: KLZ RADIO, INC.)
KOA (850 AM; 50 kW; DENVER, CO; Owner: JACOR BROADCASTING OF COLORADO, INC.)
KMXA (1090 AM; 50 kW; AURORA, CO; Owner: ENTRAVISION HOLDINGS, LLC)
KLMO (1060 AM; 30 kW; LONGMONT, CO; Owner: PILGRIM COMMUNICATIONS, INC.)
KNZZ (1100 AM; 50 kW; GRAND JUNCTION, CO; Owner: M B C GRAND BROADCASTING, INC.)
KRKY (930 AM; 4 kW; GRANBY, CO; Owner: GRAND COUNTY WIRELESS, INC.)
KCUV (1510 AM; 25 kW; LITTLETON, CO; Owner: PEOPLE WIRELESS, INC.)
KRKS (990 AM; 10 kW; DENVER, CO; Owner: SALEM MEDIA OF COLORADO, INC.)
KRAI (550 AM; 5 kW; CRAIG, CO; Owner: WILD WEST RADIO, INC.)
KCBR (1040 AM; daytime; 15 kW; MONUMENT, CO; Owner: KLZ RADIO, INC.)
KLZ (560 AM; 5 kW; DENVER, CO; Owner: KLZ RADIO, INC.)
Strongest FM radio stations in Avon:
KZYR (97.7 FM; AVON, CO; Owner: COOL RADIO, LLC)
KSKE-FM (104.7 FM; VAIL, CO; Owner: AGM-ROCKY MOUNTAIN BROADCASTING I, L.L.C.)
K259AC (99.7 FM; GYPSUM, ETC., CO; Owner: COMMUNITY RADIO FOR NORTHERN COLORADO)
KPRE (89.9 FM; VAIL, CO; Owner: PUBLIC B/CASTING OF COLORADO, INC.)
KTUN (101.5 FM; EAGLE, CO; Owner: SALISBURY BROADCASTING COLORADO, LLC)
K226AH (93.1 FM; FRISCO, CO; Owner: KRYSTAL BROADCASTING, INC.)
K300AE (107.9 FM; BRECKENRIDGE, CO; Owner: EDUCATIONAL MEDIA FOUNDATION)
KDNK (90.5 FM; CARBONDALE, CO; Owner: CARBONDALE COMM. ACCESS RADIO, INC.)
K207CK (89.3 FM; BRECKENRIDGE, CO; Owner: SUMMIT PUBLIC RADIOSUMMIT FOUNDATION)
K202CV (88.3 FM; BRECKENRIDGE, CO; Owner: COMMUNITY RADIO FOR NORTHERN COLORADO)
KRVG (95.5 FM; GLENWOOD SPRINGS, CO; Owner: WESTERN SLOPE COMMUNICATIONS LLC)
K247AD (97.3 FM; CARBONDALE, CO; Owner: PITKIN COUNTY TRANSLATOR)
KLXV (91.9 FM; GLENWOOD SPRINGS, CO; Owner: EDUCATIONAL MEDIA FOUNDATION)
KYSL (93.9 FM; FRISCO, CO; Owner: KRYSTAL BROADCASTING, INCORPORATED)
KZKS-FM2 (105.3 FM; CARBONDALE, CO; Owner: WESTERN SLOPE COMMUNICATIONS, L.L.C)
KRKM (106.3 FM; KREMMLING, CO; Owner: GRAND COUNTY WIRELESS, INC.)
KKCH (92.7 FM; GLENWOOD SPRINGS, CO; Owner: AGM-ROCKY MOUNTAIN BROADCASTING I, L.L.C.)
KYGO-FM (98.5 FM; DENVER, CO; Owner: JEFFERSON-PILOT COMMUNICATIONS COMPANY OF COLORADO)
KXPK (96.5 FM; EVERGREEN, CO; Owner: ENTRAVISION HOLDINGS, LLC)
KPVW (107.1 FM; ASPEN, CO; Owner: ENTRAVISION HOLDINGS, LLC)
TV broadcast stations around Avon:
K36DB (Channel 36; SWEETWATER CRK.,ETC., CO; Owner: RESORT TELEVISION USA, LLC)
K26GY (Channel 26; BRECKENRIDGE, CO; Owner: RESORT TELEVISION USA, LLC)
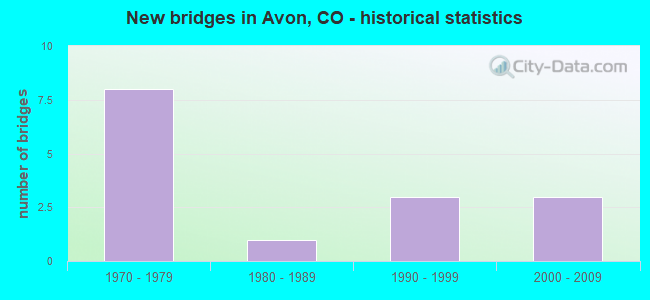
National Bridge Inventory (NBI) Statistics 15 Number of bridges295ft / 89.9m Total length $20,243,000 Total costs159,373 Total average daily traffic13,205 Total average daily truck traffic
New bridges - historical statistics
8 1970-1979 1 1980-1989 3 1990-1999 3 2000-2009
See full National Bridge Inventory statistics for Avon, CO
FCC Registered Cell Phone Towers: 1
137 Benchmark Road (Lat: 39.634139 Lon: -106.523639), Call Sign: KNKN398Assigned Frequencies: 880.020 MHz, 880.020 MHz, 880.020 MHz, 891.510 MHz, 891.510 MHz, 891.510 MHz, 835.020 MHz, 835.020 MHz, 835.020 MHz, 846.510 MHz, 846.510 MHz, 846.510 MHzGrant Date: 09/01/2020, Expiration Date: 10/01/2030, Certifier: Gregory M RomanoRegistrant: Verizon Wireless, 5055 North Point Pkwy, Np2ne Network Engineering, Alpharetta, GA 30022, Phone: (770) 797-1070, Fax: (770) 797-1036, Email:
FCC Registered Antenna Towers: 4
Keith B Victor, 375 Deercliff Road (Lat: 41.775083 Lon: -72.805083), Type: 134.0, Overall height: 134 m, Registrant: Town Of West Hartford, Ct, West -Hartford, Phone: (860) 523-2085 Kevin Milner, Atop Beaver Creek Mountain 8.0 Km Sse Of (Lat: 39.564111 Lon: -106.508861), Type: 31.4, Overall height: 27.4 m, Registrant: Holy Cross Energy, Kmilner@holycross.Com, , 2150 Glenw-ood Springs, Phone: (970) 947-5427 Kevin Milner, Atop Beaver Creek Mountain 8.0 Km Sse Of (Lat: 39.564417 Lon: -106.508917), Type: 31.4, Overall height: 27.4 m, Registrant: Holy Cross Energy, Kmilner@holycross.Com, , 2150 Glenw-ood Springs, Phone: (970) 947-5427 KEVIN MILNER, Atop Beaver Creek Mountain 8.0 Km Sse Of (Lat: 39.564417 Lon: -106.508917), Type: 31.4, Overall height: 27.4 m, Registrant: Holy Cross Energy, Kmilner@holycross.Com, , 2150 Glenw-ood Springs, Phone: (970) 947-5427 FCC Registered Commercial Land Mobile Towers: 1 (
See the full list of FCC Registered Commercial Land Mobile Towers in Avon, CO )
FCC Registered Private Land Mobile Towers: 2 (
See the full list of FCC Registered Private Land Mobile Towers )
FCC Registered Broadcast Land Mobile Towers: 15 (
See the full list of FCC Registered Broadcast Land Mobile Towers )
FCC Registered Microwave Towers: 29 (
See the full list of FCC Registered Microwave Towers in this town )
FCC Registered Paging Towers: 2 (
See the full list of FCC Registered Paging Towers )
FCC Registered Amateur Radio Licenses: 20 (
See the full list of FCC Registered Amateur Radio Licenses in Avon )
FAA Registered Aircraft Manufacturers and Dealers: 2 (
See the full list of FAA Registered Manufacturers and Dealers in Avon )
FAA Registered Aircraft: 16 (
See the full list of FAA Registered Aircraft )
Fire-safe hotels and motels in Avon, Colorado:
The Pines Lodge At Beaver Creek, 141 Scott Hl Rd, Avon, Colorado 81620 Phone: (970) 845-7900
Saint James Place, 210 Offerson Rd, Avon, Colorado 81620 Phone: (970) 845-9300, Fax: (970) 845-0099
Kiva At Beaver Creek, PO Box 5320, Avon, Colorado 81620 Phone: (970) 949-5474, Fax: (970) 949-5735
Park Hyatt Braver Creek Resort & Spa, 136 E Thomas Pl, Avon, Colorado 81620 Phone: (970) 949-1234, Fax: (970) 949-4164
All 4 fire-safe hotels and motels in Avon, Colorado Avon compared to Colorado state average:
Unemployed percentage below state average. Black race population percentage significantly below state average. Median age below state average. Foreign-born population percentage significantly above state average. Renting percentage above state average. Length of stay since moving in significantly above state average. Number of rooms per house significantly below state average. House age below state average.
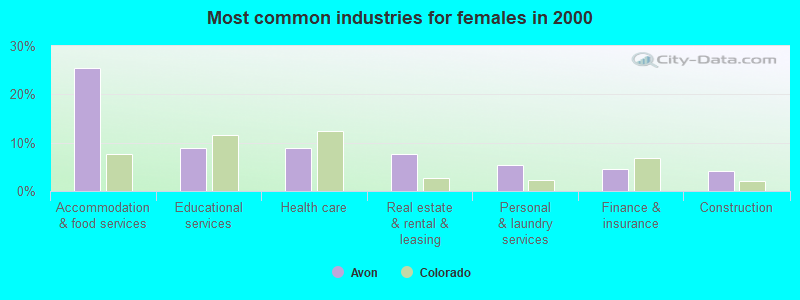
#3 on the list of "Top 101 cities with largest percentage of females in industries: accommodation and food services (population 5,000+)"
#10 on the list of "Top 100 highest located cities (pop. 5,000+)"
#17 on the list of "Top 101 cities with the largest percentage of people in agriculture workers' dormitories on farms (population 1,000+)"
#21 on the list of "Top 101 cities with largest percentage of males in industries: management of companies and enterprises (population 5,000+)"
#26 on the list of "Top 101 cities with largest percentage of males in industries: construction (population 5,000+)"
#31 on the list of "Top 101 cities with largest percentage of males in occupations: construction and extraction occupations (population 5,000+)"
#56 on the list of "Top 101 cities with the smallest percentage of one, detached housing units in structures (2,000+ housing units)"
#58 on the list of "Top 100 cities with strongest arts, entertainment, recreation, accommodation and food services industries (pop. 5,000+)"
#100 on the list of "Top 101 cities with largest percentage of males in industries: real estate and rental and leasing (population 5,000+)"
#101 on the list of "Top 101 cities with the most residents born in Czechoslovakia (includes Czech Republic and Slovakia) (population 500+)"
#8 on the list of "Top 101 counties with the lowest number of deaths per 1000 residents 2007-2013"
#39 on the list of "Top 101 counties with the largest number of children under 18 without health insurance coverage in 2000"
#80 on the list of "Top 101 counties with the highest percentage of residents relocating to foreign countries in 2011"
#82 on the list of "Top 101 counties with the highest percentage of residents relocating to other counties in 2011"
Top Patent Applicants
Kenneth E. Deline (8)
Morton M. Mower (6)
Mark J. Roebke (4)
Wolfgang Sauter (2)
Jonathan S. Aase (2)
Robert Laprade (1)
Daniel B. Griffith (1)
David W. Patton (1)
Hobson L. Black (1)
Joel M. Matta (1)
Total of 33 patent applications in 2008-2024.


 Recent articles from our blog. Our writers, many of them Ph.D. graduates or candidates, create easy-to-read articles on a wide variety of topics.


 (72.0 miles


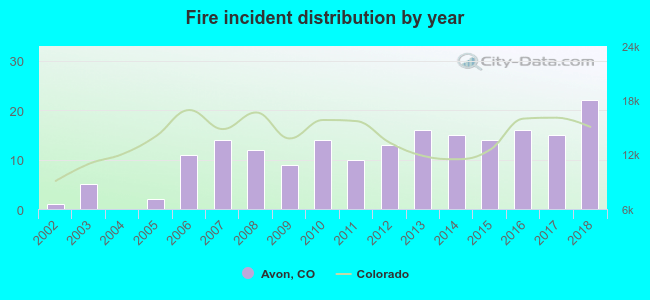 Based on the data from the years 2002 - 2018 the average number of fire incidents per year is 11. The highest number of reported fire incidents - 22 took place in 2018, and the least - 0 in 2004. The data has a growing trend.
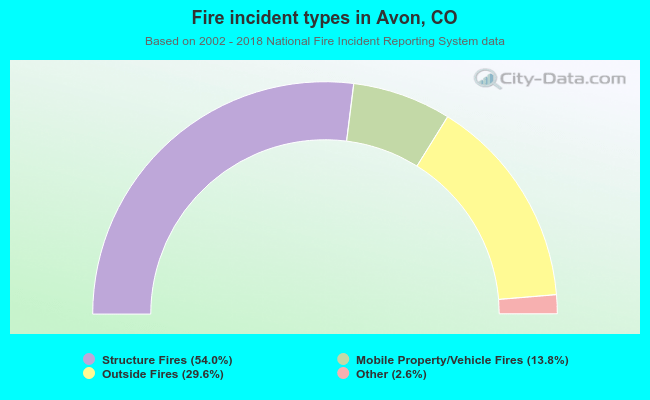 When looking into fire subcategories, the most incidents belonged to: Structure Fires (54.0%), and Outside Fires (29.6%).