Boston College Main Campus Historic District neighborhood in Chestnut Hill, Massachusetts (MA), 02467, 02135 detailed profile
Settings
X

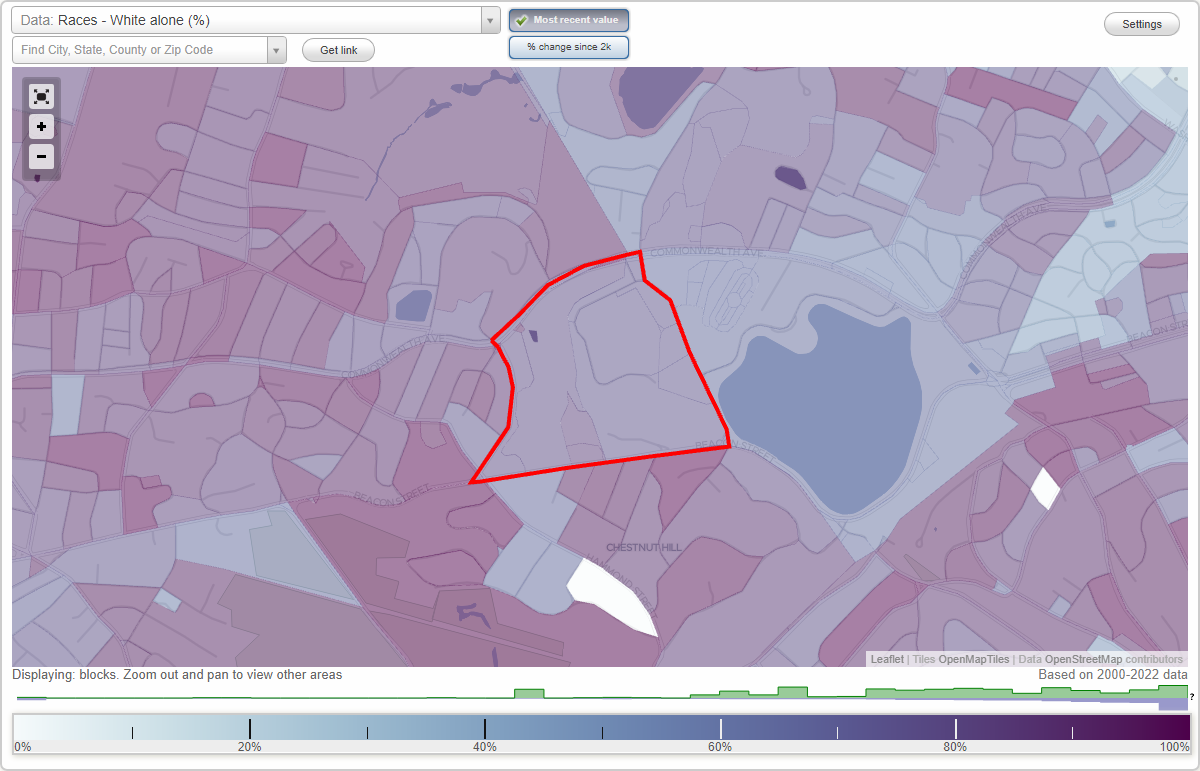
Area: 0.172 square miles
Population: 625
Population density: 3,626 people per square mile

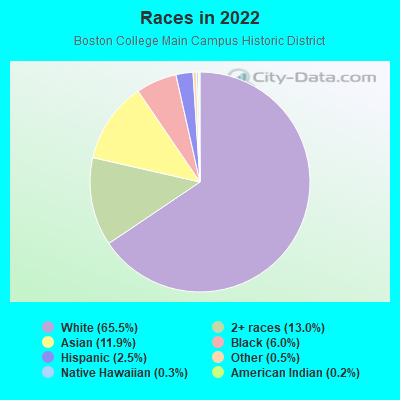
- 41265.5%White
- 8213.0%Two or more races
- 7511.9%Asian
- 386.0%Black
- 162.5%Hispanic or Latino
- 30.5%Some other race
- 20.3%Native Hawaiian and Other
Pacific Islander - 10.2%American Indian
Distribution of median household income
![Distribution of median household income]()
- 5Less than $10,000
- 13$10,000 to $19,999
- 11$20,000 to $29,999
- 13$30,000 to $39,999
- 10$40,000 to $49,999
- 8$50,000 to $59,999
- 7$60,000 to $74,999
- 13$75,000 to $99,999
- 9$100,000 to $124,999
- 17$125,000 to $149,999
- 40$150,000 to $199,999
- 107$200,000 or more

Distribution of owner-occupied house/condo value
![Distribution of owner-occupied house/condo value]()
- 2$50,000 to $99,999
- 4$100,000 to $149,999
- 1$150,000 to $199,999
- 1$200,000 to $249,999
- 2$250,000 to $299,999
- 6$300,000 to $399,999
- 13$400,000 to $499,999
- 3$500,000 to $749,999
- 12$750,000 to $999,999
- 98$1,000,000 or more

Distribution of rent paid by renters
![Distribution of rent paid by renters]()
- 1Less than $100
- 6$100 to $199
- 4$200 to $299
- 7$300 to $399
- 2$500 to $599
- 36$700 to $799
- 2$900 to $999
- 2$1,000 to $1,249
- 5$1,250 to $1,499
- 5$1,500 to $1,999
- 49$2,000 or more

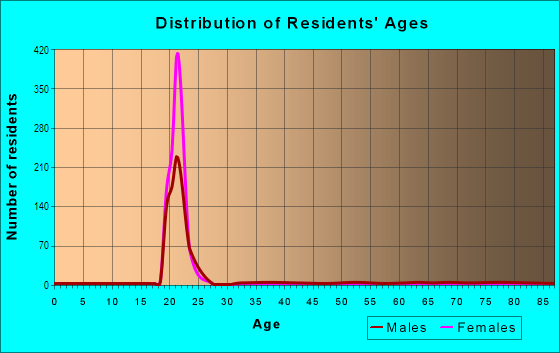
| Males: | 302 |
| Females: | 322 |
| Males: | 28.1 years |
| Females: | 28.2 years |
Percentage of family households:
| Boston College Main Campus Historic District: | 68.1% |
| Massachusetts: | 43.1% |
| Here: | 81.8% |
| Massachusetts: | 45.2% |
Percentage of married-couple families with children (among all households):
| Boston College Main Campus Historic District: | 30.5% |
| Massachusetts: | 56.2% |
Percentage of single-mother households (among all households):
| Boston College Main Campus Historic District: | 1.2% |
| Massachusetts: | 8.7% |
Percentage of never married males 15 years old and over:
Percentage of never married females 15 years old and over:
| Boston College Main Campus Historic District: | 22.7% |
| Massachusetts: | 19.4% |
Percentage of never married females 15 years old and over:
| Boston College Main Campus Historic District: | 8.4% |
| Massachusetts: | 18.4% |
Percentage of people that speak English not well or not at all:
| Boston College Main Campus Historic District: | 1.5% |
| Massachusetts: | 5.2% |
Percentage of people born in this state:
Percentage of people born in another U.S. state:
Percentage of native residents but born outside the U.S.:
Percentage of foreign born residents:
| Here: | 33.5% |
| Massachusetts: | 58.6% |
Percentage of people born in another U.S. state:
| Boston College Main Campus Historic District: | 44.1% |
| Massachusetts: | 20.5% |
Percentage of native residents but born outside the U.S.:
| Here: | 2.3% |
| Massachusetts: | 2.8% |
Percentage of foreign born residents:
| Here: | 20.1% |
| Massachusetts: | 18.0% |
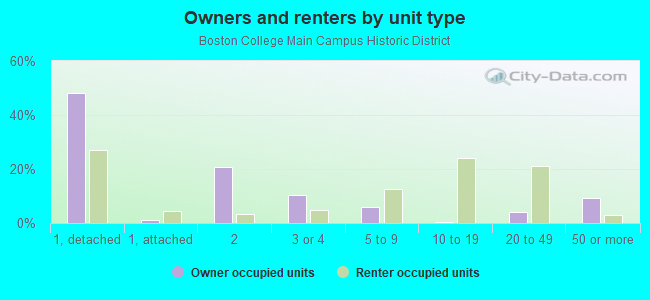
Owner-occupied
Renter-occupied

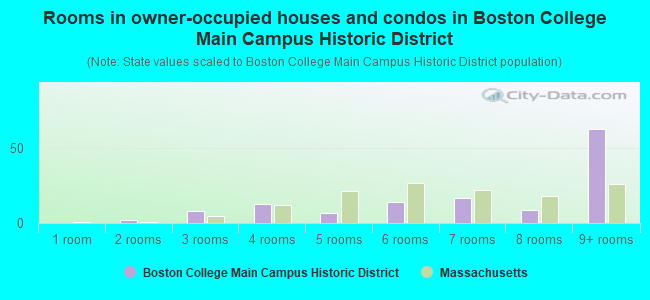
- Rooms in owner-occupied houses and condos in Boston College Main Campus Historic District
- 01 room
- 22 rooms
- 83 rooms
- 134 rooms
- 75 rooms
- 146 rooms
- 177 rooms
- 98 rooms
- 639+ rooms
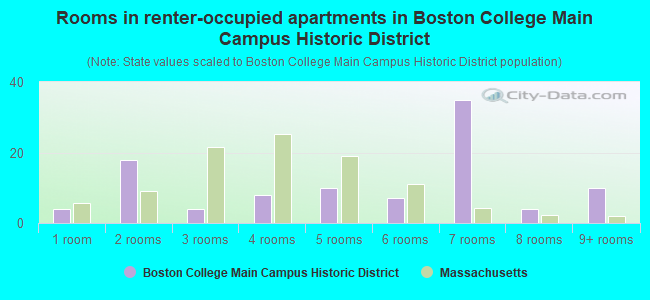
- Rooms in renter-occupied apartments in Boston College Main Campus Historic District
- 41 room
- 182 rooms
- 43 rooms
- 84 rooms
- 105 rooms
- 76 rooms
- 357 rooms
- 48 rooms
- 109+ rooms
Owner-occupied
Renter-occupied
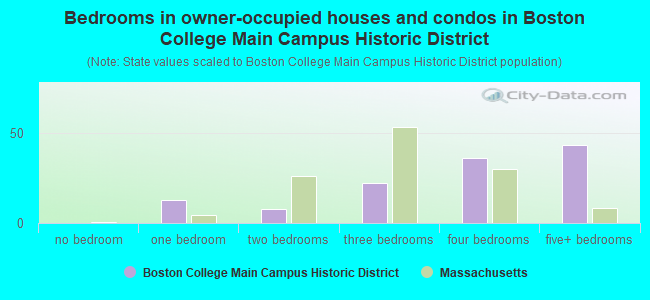
- Bedrooms in owner-occupied houses and condos in Boston College Main Campus Historic District
- 0no bedroom
- 131 bedroom
- 82 bedrooms
- 223 bedrooms
- 364 bedrooms
- 435+ bedrooms
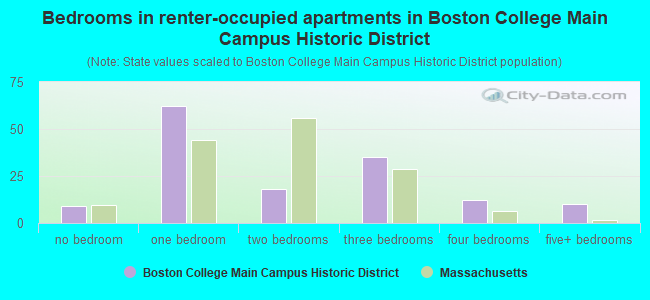
- Bedrooms in renter-occupied apartments in Boston College Main Campus Historic District
- 9no bedroom
- 621 bedroom
- 182 bedrooms
- 353 bedrooms
- 124 bedrooms
- 105+ bedrooms
Average number of cars or other vehicles available in houses/condos:
Average number of cars or other vehicles available in apartments:
| This neighborhood: | |
| Massachusetts: |
Average number of cars or other vehicles available in apartments:
| Here: | |
| Massachusetts: |
Percentage of units with a mortgage:
| Boston College Main Campus Historic District: | 81.0% |
| Massachusetts: | 65.5% |
Housing prices:
- Average estimated value of detached houses in 2022 (70.2% of all units):
Boston College Main Campus Historic District: $3,540,811 Massachusetts: $651,570
- Average estimated '22 value of housing units in 3-to-4-unit structures (13.6% of all units):
Boston College Main Campus Historic District: $454,580 Massachusetts: $601,912
- Average estimated '22 value of housing units in 5-or-more-unit structures (2.5% of all units):
Boston College Main Campus Historic District: $1,122,919 Massachusetts: $555,768
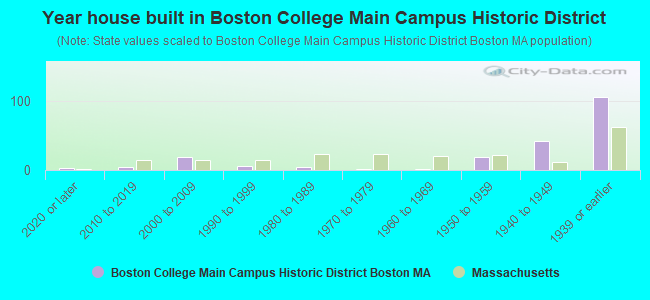
- Year house built in Boston College Main Campus Historic District
- 32020 or later
- 42010 to 2019
- 192000 to 2009
- 61990 to 1999
- 51980 to 1989
- 11970 to 1979
- 21960 to 1969
- 191950 to 1959
- 421940 to 1949
- 1061939 or earlier
Travel time to work (commute)
![Travel time to work (commute)]()
- 12Less than 5 minutes
- 295 to 9 minutes
- 2710 to 14 minutes
- 2615 to 19 minutes
- 3020 to 24 minutes
- 825 to 29 minutes
- 2630 to 34 minutes
- 835 to 39 minutes
- 2040 to 44 minutes
- 1845 to 59 minutes
- 1560 to 89 minutes

Means of transportation to work
![Means of transportation to work]()
- 35.5%98Drove a car alone
- 4.3%12Carpooled
- 8.3%23Bus
- 4.0%11Subway or elevated rail
- 1.1%3Long-distance train or commuter rail
- 1.1%3Light rail, streetcar or trolley
- 0.4%1Taxi
- 1.8%5Bicycle
- 9.0%25Walked
- 4.3%12Other means
- 45.6%126Worked at home

Time leaving home to go to work
![Time leaving home to go to work]()
- 112:00 a.m. to 4:59 a.m.
- 55:30 a.m. to 5:59 a.m.
- 76:00 a.m. to 6:29 a.m.
- 66:30 a.m. to 6:59 a.m.
- 287:00 a.m. to 7:29 a.m.
- 297:30 a.m. to 7:59 a.m.
- 378:00 a.m. to 8:29 a.m.
- 208:30 a.m. to 8:59 a.m.
- 299:00 a.m. to 9:59 a.m.
- 1410:00 a.m. to 10:59 a.m.
- 811:00 a.m. to 11:59 a.m.
- 2012:00 p.m. to 3:59 p.m.
- 324:00 p.m. to 11:59 p.m.

Occupations of males:
- Percentage of males in management occupations (except farmers):
Here: 27.8% Massachusetts: 14.0%
- Percentage of males in business and financial operations occupations:
Here: 12.8% Massachusetts: 6.5%
- Percentage of males in computer and mathematical occupations:
Here: 12.3% Massachusetts: 6.9%
- Percentage of males in life, physical, and social science occupations:
Here: 7.9% Massachusetts: 2.4%
- Percentage of males in community and social services occupations:
Here: 6.7% Massachusetts: 1.2%
- Percentage of males in legal occupations:
Here: 6.1% Massachusetts: 1.5%
- Percentage of males in education, training, and library occupations:
Here: 12.3% Massachusetts: 4.3%
- Percentage of males in healthcare practitioners and technical occupations:
Here: 2.8% Massachusetts: 3.2%
- Percentage of males in service occupations:
Here: 6.7% Massachusetts: 13.5%
- Percentage of males in sales and office occupations:
Here: 5.0% Massachusetts: 14.0%
- Percentage of males in transportation occupations:
Here: 2.6% Massachusetts: 4.9%
Occupations of females:
- Percentage of females in management occupations (except farmers):
Here: 9.0% Massachusetts: 11.3%
- Percentage of females in business and financial operations occupations:
Here: 35.9% Massachusetts: 7.6%
- Percentage of females in architecture and engineering occupations:
Here: 1.3% Massachusetts: 1.0%
- Percentage of females in life, physical, and social science occupations:
Here: 8.0% Massachusetts: 2.4%
- Percentage of females in legal occupations:
Here: 2.5% Massachusetts: 1.5%
- Percentage of females in education, training, and library occupations:
Here: 1.9% Massachusetts: 10.9%
- Percentage of females in arts, design, entertainment, sports, and media occupations:
Here: 7.7% Massachusetts: 2.6%
- Percentage of females in healthcare practitioners and technical occupations:
Here: 13.1% Massachusetts: 10.8%
- Percentage of females in service occupations:
Here: 8.9% Massachusetts: 18.3%
- Percentage of females in sales and office occupations:
Here: 11.2% Massachusetts: 22.6%
- Percentage of females in construction, extraction, and maintenance occupations:
Here: 1.4% Massachusetts: 0.3%
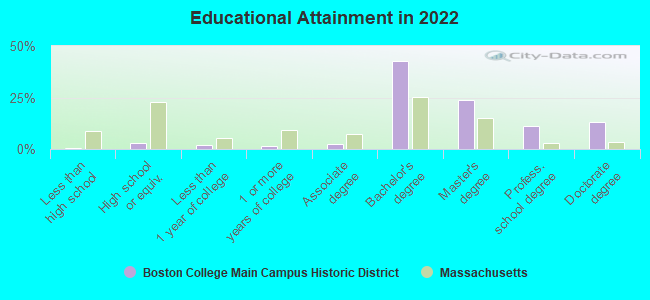
Education in this neighborhood (subdivision or community):
- Percentage of people 3 years and older in K-12 schools:
Boston College Main Campus Historic District: 27.4% Massachusetts: 14.7%
- Percentage of people 3 years and older in undergraduate colleges:
Boston College Main Campus Historic District: 41.0% Massachusetts: 5.9%
- Percentage of people 3 years and older in grad. or professional schools:
Boston College Main Campus Historic District: 3.5% Massachusetts: 2.2%
- Percentage of students K-12 enrolled in private schools:
Boston College Main Campus Historic District: 61.2% Massachusetts: 11.0%
Percentage of population below poverty level:
| Boston College Main Campus Historic District: | 18.8% |
| Massachusetts: | 10.4% |
Percentage of married-couple families with both working:
| Boston College Main Campus Historic District: | 45.3% |
| Massachusetts: | 78.0% |
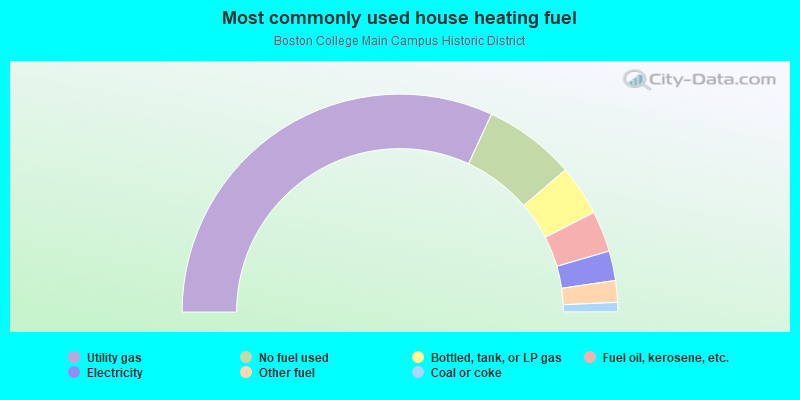
- 63.8%Utility gas
- 13.6%No fuel used
- 7.5%Bottled, tank, or LP gas
- 6.1%Fuel oil, kerosene, etc.
- 4.4%Electricity
- 3.2%Other fuel
- 1.4%Coal or coke
Highways in this neighborhood:
State Hwy 30 (Commonwealth Ave)
Length: 0.42 miles
Directions: E-W, SW-NE
Address range: 26 to 166
Directions: E-W, SW-NE
Address range: 26 to 166
Roads and streets:
Beacon St
Length: 0.35 miles
Direction: E-W
Address range: 190 to 327
Direction: E-W
Address range: 190 to 327
College Rd
Length: 0.01 miles
Directions: N-S, SE-NW, SW-NE
Address range: 190 to 199
Directions: N-S, SE-NW, SW-NE
Address range: 190 to 199
Highways in this neighborhood:
Mbta Green Line Trolley (State Hwy 30, Commonwealth Ave)
Length: 0.05 miles
Direction: E-W
Direction: E-W
Roads and streets:
Beacon St
Length: 0.41 miles
Directions: E-W, N-S, SE-NW
Directions: E-W, N-S, SE-NW
Chestnut Hill Dr
Length: 0.25 miles
Directions: N-S, SE-NW, SW-NE
Directions: N-S, SE-NW, SW-NE
St Thomas More Rd
Length: 0.07 miles
Directions: N-S, SE-NW
Address range: 66 to 180
Directions: N-S, SE-NW
Address range: 66 to 180
Lower Campus Rd
Length: 0.06 miles
Direction: SE-NW
Direction: SE-NW
N075
Length: 0.00 miles
Direction: E-W
Direction: E-W