Alamo Square neighborhood in San Francisco, California (CA), 94115, 94117 detailed profile
Settings
X

Business Search - 14 Million verified businesses
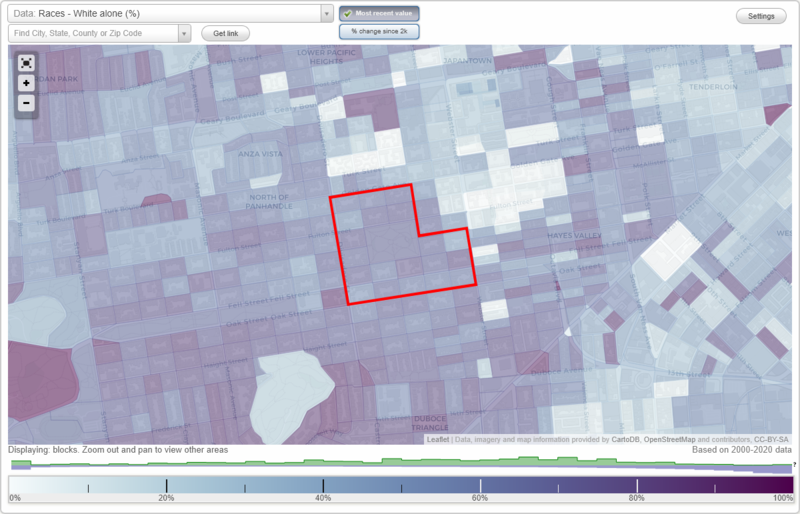
Area: 0.144 square miles
Population: 3,823
Population density:
| Alamo Square: | 26,620 people per square mile |
| San Francisco: | 17,313 people per square mile |

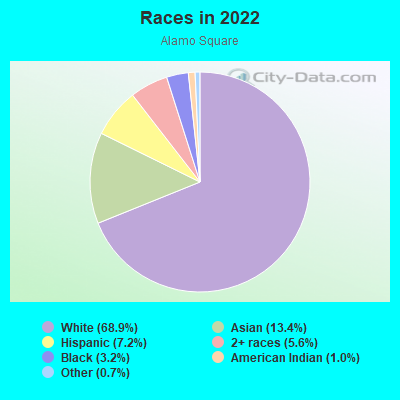
- 2,74168.9%White
- 53113.4%Asian
- 2867.2%Hispanic or Latino
- 2235.6%Two or more races
- 1283.2%Black
- 381.0%American Indian
- 260.7%Some other race
- 30.08%Native Hawaiian and Other
Pacific Islander
Median household income in 2022:
| Alamo Square: | $200,814 |
| San Francisco: | $136,692 |
Distribution of median household income
![Distribution of median household income]()
- 177Less than $10,000
- 121$10,000 to $19,999
- 78$20,000 to $29,999
- 41$30,000 to $39,999
- 119$40,000 to $49,999
- 27$50,000 to $59,999
- 45$60,000 to $74,999
- 138$75,000 to $99,999
- 27$100,000 to $124,999
- 188$125,000 to $149,999
- 104$150,000 to $199,999
- 902$200,000 or more

Distribution of owner-occupied house/condo value
![Distribution of owner-occupied house/condo value]()
- 17$100,000 to $149,999
- 22$300,000 to $399,999
- 49$400,000 to $499,999
- 39$500,000 to $749,999
- 48$750,000 to $999,999
- 240$1,000,000 or more

Distribution of rent paid by renters
![Distribution of rent paid by renters]()
- 25$100 to $199
- 163$200 to $299
- 20$400 to $499
- 23$500 to $599
- 25$600 to $699
- 61$700 to $799
- 64$800 to $899
- 16$900 to $999
- 41$1,000 to $1,249
- 177$1,250 to $1,499
- 82$1,500 to $1,999
- 1,168$2,000 or more

Median rent in 2022:
| Alamo Square: | $2,660 |
| San Francisco: | $2,001 |
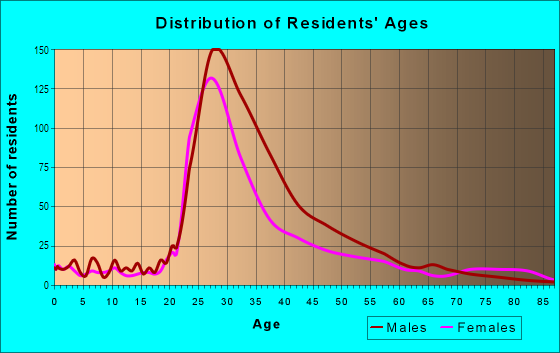
| Males: | 2,083 |
| Females: | 1,739 |
Males:
| This neighborhood: | 33.4 years |
| Whole city: | 40.3 years |
| This neighborhood: | 31.5 years |
| Whole city: | 40.5 years |
Average household size:
| Alamo Square: | 2.1 people |
| San Francisco: | 2.2 people |
Percentage of family households:
| Alamo Square: | 28.5% |
| San Francisco: | 30.3% |
| Here: | 26.9% |
| San Francisco: | 35.3% |
Percentage of married-couple families with children (among all households):
| Alamo Square: | 39.5% |
| San Francisco: | 35.9% |
Percentage of single-mother households (among all households):
| Alamo Square: | 9.6% |
| San Francisco: | 6.0% |
Percentage of never married males 15 years old and over:
Percentage of never married females 15 years old and over:
| Alamo Square: | 39.2% |
| San Francisco: | 24.6% |
Percentage of never married females 15 years old and over:
| Alamo Square: | 25.5% |
| city: | 19.9% |
Percentage of people that speak English not well or not at all:
| Alamo Square: | 2.4% |
| San Francisco: | 10.9% |
Percentage of people born in this state:
Percentage of people born in another U.S. state:
Percentage of native residents but born outside the U.S.:
Percentage of foreign born residents:
| Here: | 36.6% |
| San Francisco: | 40.8% |
Percentage of people born in another U.S. state:
| Alamo Square: | 40.9% |
| San Francisco: | 23.4% |
Percentage of native residents but born outside the U.S.:
| Here: | 2.1% |
| city: | 2.6% |
Percentage of foreign born residents:
| Here: | 20.4% |
| San Francisco: | 33.2% |
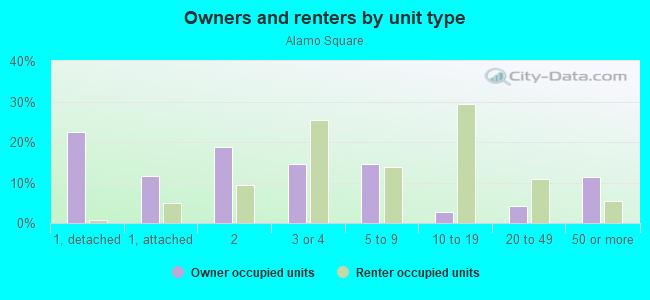
Owner-occupied
Renter-occupied

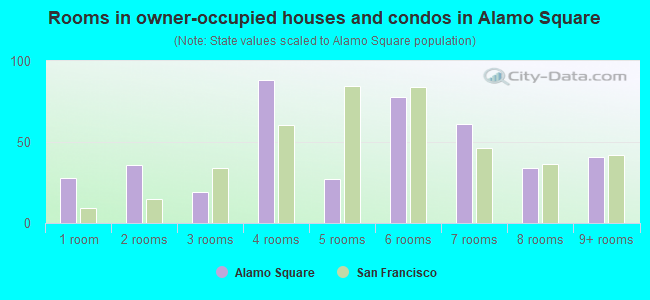
- Rooms in owner-occupied houses and condos in Alamo Square
- 281 room
- 362 rooms
- 193 rooms
- 884 rooms
- 275 rooms
- 786 rooms
- 617 rooms
- 348 rooms
- 419+ rooms
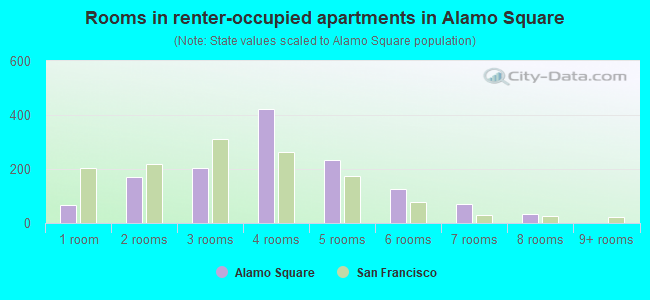
- Rooms in renter-occupied apartments in Alamo Square
- 671 room
- 1722 rooms
- 2033 rooms
- 4244 rooms
- 2335 rooms
- 1256 rooms
- 707 rooms
- 328 rooms
- 09+ rooms
Owner-occupied
Renter-occupied
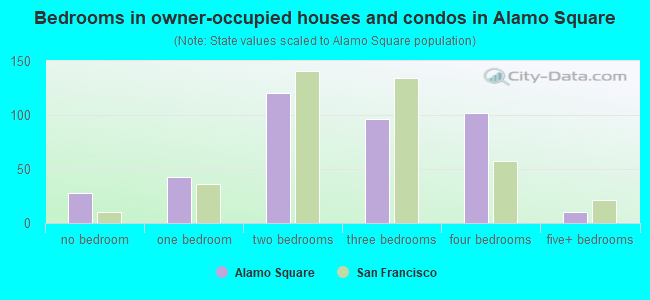
- Bedrooms in owner-occupied houses and condos in Alamo Square
- 28no bedroom
- 431 bedroom
- 1202 bedrooms
- 963 bedrooms
- 1024 bedrooms
- 105+ bedrooms
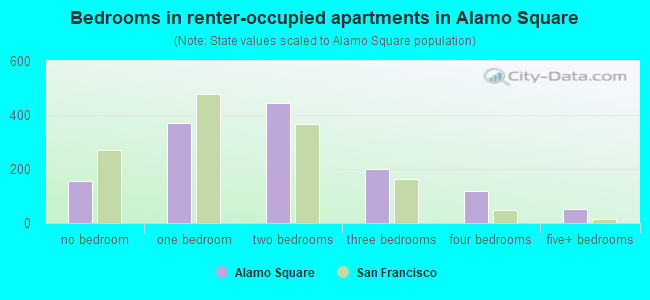
- Bedrooms in renter-occupied apartments in Alamo Square
- 156no bedroom
- 3721 bedroom
- 4452 bedrooms
- 2003 bedrooms
- 1184 bedrooms
- 535+ bedrooms
Average number of cars or other vehicles available in houses/condos:
Average number of cars or other vehicles available in apartments:
| This neighborhood: | 1.2 |
| San Francisco: | 1.5 |
Average number of cars or other vehicles available in apartments:
| Here: | 0.8 |
| city: | 0.8 |
Percentage of units with a mortgage:
| Alamo Square: | 77.6% |
| San Francisco: | 62.3% |
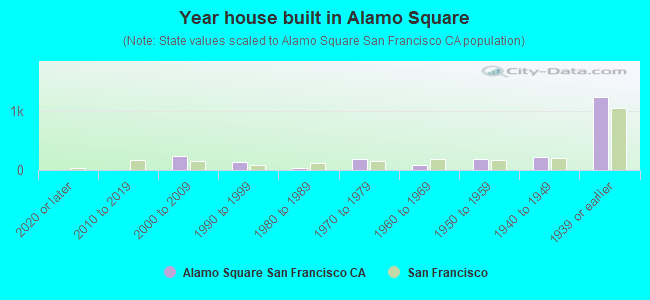
- Year house built in Alamo Square
- 02020 or later
- 02010 to 2019
- 2382000 to 2009
- 1351990 to 1999
- 381980 to 1989
- 1841970 to 1979
- 851960 to 1969
- 1841950 to 1959
- 2201940 to 1949
- 1,2371939 or earlier
City-data.com crime index for city in 2020 (higher means more crime):
| City: | 387.4 |
| U.S. average: | 219.5 |
Travel time to work (commute)
![Travel time to work (commute)]()
- 56Less than 5 minutes
- 515 to 9 minutes
- 22110 to 14 minutes
- 29815 to 19 minutes
- 49120 to 24 minutes
- 24125 to 29 minutes
- 58530 to 34 minutes
- 17135 to 39 minutes
- 12840 to 44 minutes
- 36845 to 59 minutes
- 24560 to 89 minutes
- 18890 or more minutes

Means of transportation to work
![Means of transportation to work]()
- 23.7%619Drove a car alone
- 3.7%97Carpooled
- 23.6%616Bus
- 3.6%95Subway or elevated rail
- 2.5%65Long-distance train or commuter rail
- 4.9%127Light rail, streetcar or trolley
- 2.3%59Taxi
- 3.0%79Motorcycle
- 3.1%82Bicycle
- 4.6%119Walked
- 0.5%12Other means
- 30.6%799Worked at home

Time leaving home to go to work
![Time leaving home to go to work]()
- 6112:00 a.m. to 4:59 a.m.
- 355:30 a.m. to 5:59 a.m.
- 3356:00 a.m. to 6:29 a.m.
- 2636:30 a.m. to 6:59 a.m.
- 2817:00 a.m. to 7:29 a.m.
- 3397:30 a.m. to 7:59 a.m.
- 7638:00 a.m. to 8:29 a.m.
- 3698:30 a.m. to 8:59 a.m.
- 5619:00 a.m. to 9:59 a.m.
- 7810:00 a.m. to 10:59 a.m.
- 5012:00 p.m. to 3:59 p.m.
- 804:00 p.m. to 11:59 p.m.

Occupations of males:
- Percentage of males in management occupations (except farmers):
Here: 22.5% city: 17.2%
- Percentage of males in business and financial operations occupations:
Here: 10.3% city: 8.9%
- Percentage of males in computer and mathematical occupations:
Here: 31.0% city: 14.6%
- Percentage of males in life, physical, and social science occupations:
Here: 2.9% city: 2.4%
- Percentage of males in legal occupations:
Here: 12.7% city: 2.5%
- Percentage of males in education, training, and library occupations:
Here: 3.3% city: 3.4%
- Percentage of males in arts, design, entertainment, sports, and media occupations:
Here: 4.7% city: 4.9%
- Percentage of males in sales and office occupations:
Here: 9.1% city: 13.5%
- Percentage of males in material moving occupations:
Here: 1.1% city: 1.8%
Occupations of females:
- Percentage of females in management occupations (except farmers):
Here: 21.2% city: 15.8%
- Percentage of females in business and financial operations occupations:
Here: 14.8% city: 11.5%
- Percentage of females in computer and mathematical occupations:
Here: 6.2% city: 5.1%
- Percentage of females in architecture and engineering occupations:
Here: 2.3% city: 1.6%
- Percentage of females in legal occupations:
Here: 5.1% city: 3.0%
- Percentage of females in education, training, and library occupations:
Here: 17.0% city: 7.1%
- Percentage of females in arts, design, entertainment, sports, and media occupations:
Here: 11.5% city: 5.1%
- Percentage of females in healthcare practitioners and technical occupations:
Here: 10.3% city: 8.4%
- Percentage of females in service occupations:
Here: 2.6% city: 15.4%
- Percentage of females in sales and office occupations:
Here: 8.9% city: 19.3%
- Percentage of females in production occupations:
Here: 1.2% city: 1.5%
- Percentage of females in material moving occupations:
Here: 1.1% city: 0.8%
Percentage of people 16-64 in Armed Forces:
| Alamo Square: | 1.3% |
| San Francisco: | 0.1% |
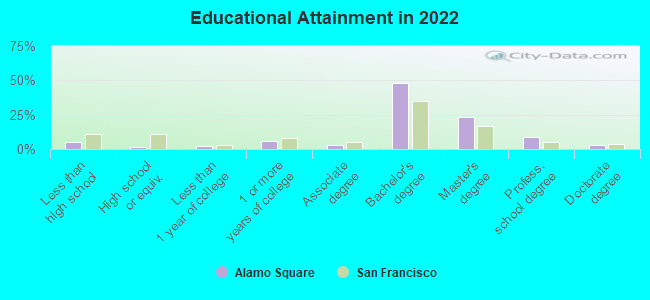
Education in this neighborhood (subdivision or community):
- Percentage of people 3 years and older in K-12 schools:
Alamo Square: 5.9% San Francisco: 9.7%
- Percentage of people 3 years and older in undergraduate colleges:
Alamo Square: 2.2% San Francisco: 4.8%
- Percentage of people 3 years and older in grad. or professional schools:
Alamo Square: 2.8% San Francisco: 2.6%
- Percentage of students K-12 enrolled in private schools:
Alamo Square: 81.0% San Francisco: 36.5%
Percentage of population below poverty level:
| Alamo Square: | 8.8% |
| San Francisco: | 10.4% |
Median year owner moved in (as recorded in 2022):
Median year renter moved in (as recorded in 2022):
| Alamo Square: | 2003 |
| San Francisco: | 2007 |
Median year renter moved in (as recorded in 2022):
| Alamo Square: | 2004 |
| San Francisco: | 2019 |
Percentage of married-couple families with both working:
| Alamo Square: | 54.4% |
| San Francisco: | 75.9% |

- 53.9%Utility gas
- 34.0%Electricity
- 9.2%No fuel used
- 2.8%Bottled, tank, or LP gas
Roads and streets:
Hayes St
Length: 0.46 miles
Direction: E-W
Address range: 900 to 1299
Direction: E-W
Address range: 900 to 1299
McAllister St
Length: 0.34 miles
Direction: E-W
Address range: 1300 to 1599
Direction: E-W
Address range: 1300 to 1599
Fulton St
Length: 0.34 miles
Direction: E-W
Address range: 1000 to 1299
Direction: E-W
Address range: 1000 to 1299
Fell St
Length: 0.34 miles
Direction: E-W
Address range: 800 to 1099
Direction: E-W
Address range: 800 to 1099
Oak St
Length: 0.34 miles
Direction: E-W
Address range: 700 to 999
Direction: E-W
Address range: 700 to 999
Steiner St
Length: 0.33 miles
Direction: N-S
Address range: 500 to 999
Direction: N-S
Address range: 500 to 999
Scott St
Length: 0.33 miles
Direction: N-S
Address range: 400 to 899
Direction: N-S
Address range: 400 to 899
Grove St
Length: 0.23 miles
Direction: E-W
Address range: 900 to 1299
Direction: E-W
Address range: 900 to 1299
Divisadero St
Length: 0.20 miles
Directions: N-S, SE-NW, SW-NE
Directions: N-S, SE-NW, SW-NE
Pierce St
Length: 0.20 miles
Direction: N-S
Address range: 400 to 899
Direction: N-S
Address range: 400 to 899
Fillmore St
Length: 0.20 miles
Direction: N-S
Address range: 500 to 799
Direction: N-S
Address range: 500 to 799