West Valley City, Utah Submit your own pictures of this city and show them to the world
OSM Map
General Map
Google Map
MSN Map
OSM Map
General Map
Google Map
MSN Map
OSM Map
General Map
Google Map
MSN Map
OSM Map
General Map
Google Map
MSN Map
Please wait while loading the map...
Population in 2022: 136,650 (100% urban, 0% rural). Population change since 2000: +25.5%Males: 69,918 Females: 66,732
March 2022 cost of living index in West Valley City: 92.0 (less than average, U.S. average is 100) Percentage of residents living in poverty in 2022: 9.5%for White Non-Hispanic residents , 20.4% for Black residents , 10.9% for Hispanic or Latino residents , 14.2% for American Indian residents , 13.2% for Native Hawaiian and other Pacific Islander residents , 14.5% for other race residents , 12.7% for two or more races residents )
Profiles of local businesses
Business Search - 14 Million verified businesses
Data:
Median household income ($)
Median household income (% change since 2000)
Household income diversity
Ratio of average income to average house value (%)
Ratio of average income to average rent
Median household income ($) - White
Median household income ($) - Black or African American
Median household income ($) - Asian
Median household income ($) - Hispanic or Latino
Median household income ($) - American Indian and Alaska Native
Median household income ($) - Multirace
Median household income ($) - Other Race
Median household income for houses/condos with a mortgage ($)
Median household income for apartments without a mortgage ($)
Races - White alone (%)
Races - White alone (% change since 2000)
Races - Black alone (%)
Races - Black alone (% change since 2000)
Races - American Indian alone (%)
Races - American Indian alone (% change since 2000)
Races - Asian alone (%)
Races - Asian alone (% change since 2000)
Races - Hispanic (%)
Races - Hispanic (% change since 2000)
Races - Native Hawaiian and Other Pacific Islander alone (%)
Races - Native Hawaiian and Other Pacific Islander alone (% change since 2000)
Races - Two or more races (%)
Races - Two or more races (% change since 2000)
Races - Other race alone (%)
Races - Other race alone (% change since 2000)
Racial diversity
Unemployment (%)
Unemployment (% change since 2000)
Unemployment (%) - White
Unemployment (%) - Black or African American
Unemployment (%) - Asian
Unemployment (%) - Hispanic or Latino
Unemployment (%) - American Indian and Alaska Native
Unemployment (%) - Multirace
Unemployment (%) - Other Race
Population density (people per square mile)
Population - Males (%)
Population - Females (%)
Population - Males (%) - White
Population - Males (%) - Black or African American
Population - Males (%) - Asian
Population - Males (%) - Hispanic or Latino
Population - Males (%) - American Indian and Alaska Native
Population - Males (%) - Multirace
Population - Males (%) - Other Race
Population - Females (%) - White
Population - Females (%) - Black or African American
Population - Females (%) - Asian
Population - Females (%) - Hispanic or Latino
Population - Females (%) - American Indian and Alaska Native
Population - Females (%) - Multirace
Population - Females (%) - Other Race
Coronavirus confirmed cases (May 23, 2024)
Deaths caused by coronavirus (May 23, 2024)
Coronavirus confirmed cases (per 100k population) (May 23, 2024)
Deaths caused by coronavirus (per 100k population) (May 23, 2024)
Daily increase in number of cases (May 23, 2024)
Weekly increase in number of cases (May 23, 2024)
Cases doubled (in days) (May 23, 2024)
Hospitalized patients (Apr 18, 2022)
Negative test results (Apr 18, 2022)
Total test results (Apr 18, 2022)
COVID Vaccine doses distributed (per 100k population) (Sep 19, 2023)
COVID Vaccine doses administered (per 100k population) (Sep 19, 2023)
COVID Vaccine doses distributed (Sep 19, 2023)
COVID Vaccine doses administered (Sep 19, 2023)
Likely homosexual households (%)
Likely homosexual households (% change since 2000)
Likely homosexual households - Lesbian couples (%)
Likely homosexual households - Lesbian couples (% change since 2000)
Likely homosexual households - Gay men (%)
Likely homosexual households - Gay men (% change since 2000)
Cost of living index
Median gross rent ($)
Median contract rent ($)
Median monthly housing costs ($)
Median house or condo value ($)
Median house or condo value ($ change since 2000)
Mean house or condo value by units in structure - 1, detached ($)
Mean house or condo value by units in structure - 1, attached ($)
Mean house or condo value by units in structure - 2 ($)
Mean house or condo value by units in structure by units in structure - 3 or 4 ($)
Mean house or condo value by units in structure - 5 or more ($)
Mean house or condo value by units in structure - Boat, RV, van, etc. ($)
Mean house or condo value by units in structure - Mobile home ($)
Median house or condo value ($) - White
Median house or condo value ($) - Black or African American
Median house or condo value ($) - Asian
Median house or condo value ($) - Hispanic or Latino
Median house or condo value ($) - American Indian and Alaska Native
Median house or condo value ($) - Multirace
Median house or condo value ($) - Other Race
Median resident age
Resident age diversity
Median resident age - Males
Median resident age - Females
Median resident age - White
Median resident age - Black or African American
Median resident age - Asian
Median resident age - Hispanic or Latino
Median resident age - American Indian and Alaska Native
Median resident age - Multirace
Median resident age - Other Race
Median resident age - Males - White
Median resident age - Males - Black or African American
Median resident age - Males - Asian
Median resident age - Males - Hispanic or Latino
Median resident age - Males - American Indian and Alaska Native
Median resident age - Males - Multirace
Median resident age - Males - Other Race
Median resident age - Females - White
Median resident age - Females - Black or African American
Median resident age - Females - Asian
Median resident age - Females - Hispanic or Latino
Median resident age - Females - American Indian and Alaska Native
Median resident age - Females - Multirace
Median resident age - Females - Other Race
Commute - mean travel time to work (minutes)
Travel time to work - Less than 5 minutes (%)
Travel time to work - Less than 5 minutes (% change since 2000)
Travel time to work - 5 to 9 minutes (%)
Travel time to work - 5 to 9 minutes (% change since 2000)
Travel time to work - 10 to 19 minutes (%)
Travel time to work - 10 to 19 minutes (% change since 2000)
Travel time to work - 20 to 29 minutes (%)
Travel time to work - 20 to 29 minutes (% change since 2000)
Travel time to work - 30 to 39 minutes (%)
Travel time to work - 30 to 39 minutes (% change since 2000)
Travel time to work - 40 to 59 minutes (%)
Travel time to work - 40 to 59 minutes (% change since 2000)
Travel time to work - 60 to 89 minutes (%)
Travel time to work - 60 to 89 minutes (% change since 2000)
Travel time to work - 90 or more minutes (%)
Travel time to work - 90 or more minutes (% change since 2000)
Marital status - Never married (%)
Marital status - Now married (%)
Marital status - Separated (%)
Marital status - Widowed (%)
Marital status - Divorced (%)
Median family income ($)
Median family income (% change since 2000)
Median non-family income ($)
Median non-family income (% change since 2000)
Median per capita income ($)
Median per capita income (% change since 2000)
Median family income ($) - White
Median family income ($) - Black or African American
Median family income ($) - Asian
Median family income ($) - Hispanic or Latino
Median family income ($) - American Indian and Alaska Native
Median family income ($) - Multirace
Median family income ($) - Other Race
Median year house/condo built
Median year apartment built
Year house built - Built 2005 or later (%)
Year house built - Built 2000 to 2004 (%)
Year house built - Built 1990 to 1999 (%)
Year house built - Built 1980 to 1989 (%)
Year house built - Built 1970 to 1979 (%)
Year house built - Built 1960 to 1969 (%)
Year house built - Built 1950 to 1959 (%)
Year house built - Built 1940 to 1949 (%)
Year house built - Built 1939 or earlier (%)
Average household size
Household density (households per square mile)
Average household size - White
Average household size - Black or African American
Average household size - Asian
Average household size - Hispanic or Latino
Average household size - American Indian and Alaska Native
Average household size - Multirace
Average household size - Other Race
Occupied housing units (%)
Vacant housing units (%)
Owner occupied housing units (%)
Renter occupied housing units (%)
Vacancy status - For rent (%)
Vacancy status - For sale only (%)
Vacancy status - Rented or sold, not occupied (%)
Vacancy status - For seasonal, recreational, or occasional use (%)
Vacancy status - For migrant workers (%)
Vacancy status - Other vacant (%)
Residents with income below the poverty level (%)
Residents with income below 50% of the poverty level (%)
Children below poverty level (%)
Poor families by family type - Married-couple family (%)
Poor families by family type - Male, no wife present (%)
Poor families by family type - Female, no husband present (%)
Poverty status for native-born residents (%)
Poverty status for foreign-born residents (%)
Poverty among high school graduates not in families (%)
Poverty among people who did not graduate high school not in families (%)
Residents with income below the poverty level (%) - White
Residents with income below the poverty level (%) - Black or African American
Residents with income below the poverty level (%) - Asian
Residents with income below the poverty level (%) - Hispanic or Latino
Residents with income below the poverty level (%) - American Indian and Alaska Native
Residents with income below the poverty level (%) - Multirace
Residents with income below the poverty level (%) - Other Race
Air pollution - Air Quality Index (AQI)
Air pollution - CO
Air pollution - NO2
Air pollution - SO2
Air pollution - Ozone
Air pollution - PM10
Air pollution - PM25
Air pollution - Pb
Crime - Murders per 100,000 population
Crime - Rapes per 100,000 population
Crime - Robberies per 100,000 population
Crime - Assaults per 100,000 population
Crime - Burglaries per 100,000 population
Crime - Thefts per 100,000 population
Crime - Auto thefts per 100,000 population
Crime - Arson per 100,000 population
Crime - City-data.com crime index
Crime - Violent crime index
Crime - Property crime index
Crime - Murders per 100,000 population (5 year average)
Crime - Rapes per 100,000 population (5 year average)
Crime - Robberies per 100,000 population (5 year average)
Crime - Assaults per 100,000 population (5 year average)
Crime - Burglaries per 100,000 population (5 year average)
Crime - Thefts per 100,000 population (5 year average)
Crime - Auto thefts per 100,000 population (5 year average)
Crime - Arson per 100,000 population (5 year average)
Crime - City-data.com crime index (5 year average)
Crime - Violent crime index (5 year average)
Crime - Property crime index (5 year average)
1996 Presidential Elections Results (%) - Democratic Party (Clinton)
1996 Presidential Elections Results (%) - Republican Party (Dole)
1996 Presidential Elections Results (%) - Other
2000 Presidential Elections Results (%) - Democratic Party (Gore)
2000 Presidential Elections Results (%) - Republican Party (Bush)
2000 Presidential Elections Results (%) - Other
2004 Presidential Elections Results (%) - Democratic Party (Kerry)
2004 Presidential Elections Results (%) - Republican Party (Bush)
2004 Presidential Elections Results (%) - Other
2008 Presidential Elections Results (%) - Democratic Party (Obama)
2008 Presidential Elections Results (%) - Republican Party (McCain)
2008 Presidential Elections Results (%) - Other
2012 Presidential Elections Results (%) - Democratic Party (Obama)
2012 Presidential Elections Results (%) - Republican Party (Romney)
2012 Presidential Elections Results (%) - Other
2016 Presidential Elections Results (%) - Democratic Party (Clinton)
2016 Presidential Elections Results (%) - Republican Party (Trump)
2016 Presidential Elections Results (%) - Other
2020 Presidential Elections Results (%) - Democratic Party (Biden)
2020 Presidential Elections Results (%) - Republican Party (Trump)
2020 Presidential Elections Results (%) - Other
Ancestries Reported - Arab (%)
Ancestries Reported - Czech (%)
Ancestries Reported - Danish (%)
Ancestries Reported - Dutch (%)
Ancestries Reported - English (%)
Ancestries Reported - French (%)
Ancestries Reported - French Canadian (%)
Ancestries Reported - German (%)
Ancestries Reported - Greek (%)
Ancestries Reported - Hungarian (%)
Ancestries Reported - Irish (%)
Ancestries Reported - Italian (%)
Ancestries Reported - Lithuanian (%)
Ancestries Reported - Norwegian (%)
Ancestries Reported - Polish (%)
Ancestries Reported - Portuguese (%)
Ancestries Reported - Russian (%)
Ancestries Reported - Scotch-Irish (%)
Ancestries Reported - Scottish (%)
Ancestries Reported - Slovak (%)
Ancestries Reported - Subsaharan African (%)
Ancestries Reported - Swedish (%)
Ancestries Reported - Swiss (%)
Ancestries Reported - Ukrainian (%)
Ancestries Reported - United States (%)
Ancestries Reported - Welsh (%)
Ancestries Reported - West Indian (%)
Ancestries Reported - Other (%)
Educational Attainment - No schooling completed (%)
Educational Attainment - Less than high school (%)
Educational Attainment - High school or equivalent (%)
Educational Attainment - Less than 1 year of college (%)
Educational Attainment - 1 or more years of college (%)
Educational Attainment - Associate degree (%)
Educational Attainment - Bachelor's degree (%)
Educational Attainment - Master's degree (%)
Educational Attainment - Professional school degree (%)
Educational Attainment - Doctorate degree (%)
School Enrollment - Nursery, preschool (%)
School Enrollment - Kindergarten (%)
School Enrollment - Grade 1 to 4 (%)
School Enrollment - Grade 5 to 8 (%)
School Enrollment - Grade 9 to 12 (%)
School Enrollment - College undergrad (%)
School Enrollment - Graduate or professional (%)
School Enrollment - Not enrolled in school (%)
School enrollment - Public schools (%)
School enrollment - Private schools (%)
School enrollment - Not enrolled (%)
Median number of rooms in houses and condos
Median number of rooms in apartments
Housing units lacking complete plumbing facilities (%)
Housing units lacking complete kitchen facilities (%)
Density of houses
Urban houses (%)
Rural houses (%)
Households with people 60 years and over (%)
Households with people 65 years and over (%)
Households with people 75 years and over (%)
Households with one or more nonrelatives (%)
Households with no nonrelatives (%)
Population in households (%)
Family households (%)
Nonfamily households (%)
Population in families (%)
Family households with own children (%)
Median number of bedrooms in owner occupied houses
Mean number of bedrooms in owner occupied houses
Median number of bedrooms in renter occupied houses
Mean number of bedrooms in renter occupied houses
Median number of vehichles in owner occupied houses
Mean number of vehichles in owner occupied houses
Median number of vehichles in renter occupied houses
Mean number of vehichles in renter occupied houses
Mortgage status - with mortgage (%)
Mortgage status - with second mortgage (%)
Mortgage status - with home equity loan (%)
Mortgage status - with both second mortgage and home equity loan (%)
Mortgage status - without a mortgage (%)
Average family size
Average family size - White
Average family size - Black or African American
Average family size - Asian
Average family size - Hispanic or Latino
Average family size - American Indian and Alaska Native
Average family size - Multirace
Average family size - Other Race
Geographical mobility - Same house 1 year ago (%)
Geographical mobility - Moved within same county (%)
Geographical mobility - Moved from different county within same state (%)
Geographical mobility - Moved from different state (%)
Geographical mobility - Moved from abroad (%)
Place of birth - Born in state of residence (%)
Place of birth - Born in other state (%)
Place of birth - Native, outside of US (%)
Place of birth - Foreign born (%)
Housing units in structures - 1, detached (%)
Housing units in structures - 1, attached (%)
Housing units in structures - 2 (%)
Housing units in structures - 3 or 4 (%)
Housing units in structures - 5 to 9 (%)
Housing units in structures - 10 to 19 (%)
Housing units in structures - 20 to 49 (%)
Housing units in structures - 50 or more (%)
Housing units in structures - Mobile home (%)
Housing units in structures - Boat, RV, van, etc. (%)
House/condo owner moved in on average (years ago)
Renter moved in on average (years ago)
Year householder moved into unit - Moved in 1999 to March 2000 (%)
Year householder moved into unit - Moved in 1995 to 1998 (%)
Year householder moved into unit - Moved in 1990 to 1994 (%)
Year householder moved into unit - Moved in 1980 to 1989 (%)
Year householder moved into unit - Moved in 1970 to 1979 (%)
Year householder moved into unit - Moved in 1969 or earlier (%)
Means of transportation to work - Drove car alone (%)
Means of transportation to work - Carpooled (%)
Means of transportation to work - Public transportation (%)
Means of transportation to work - Bus or trolley bus (%)
Means of transportation to work - Streetcar or trolley car (%)
Means of transportation to work - Subway or elevated (%)
Means of transportation to work - Railroad (%)
Means of transportation to work - Ferryboat (%)
Means of transportation to work - Taxicab (%)
Means of transportation to work - Motorcycle (%)
Means of transportation to work - Bicycle (%)
Means of transportation to work - Walked (%)
Means of transportation to work - Other means (%)
Working at home (%)
Industry diversity
Most Common Industries - Agriculture, forestry, fishing and hunting, and mining (%)
Most Common Industries - Agriculture, forestry, fishing and hunting (%)
Most Common Industries - Mining, quarrying, and oil and gas extraction (%)
Most Common Industries - Construction (%)
Most Common Industries - Manufacturing (%)
Most Common Industries - Wholesale trade (%)
Most Common Industries - Retail trade (%)
Most Common Industries - Transportation and warehousing, and utilities (%)
Most Common Industries - Transportation and warehousing (%)
Most Common Industries - Utilities (%)
Most Common Industries - Information (%)
Most Common Industries - Finance and insurance, and real estate and rental and leasing (%)
Most Common Industries - Finance and insurance (%)
Most Common Industries - Real estate and rental and leasing (%)
Most Common Industries - Professional, scientific, and management, and administrative and waste management services (%)
Most Common Industries - Professional, scientific, and technical services (%)
Most Common Industries - Management of companies and enterprises (%)
Most Common Industries - Administrative and support and waste management services (%)
Most Common Industries - Educational services, and health care and social assistance (%)
Most Common Industries - Educational services (%)
Most Common Industries - Health care and social assistance (%)
Most Common Industries - Arts, entertainment, and recreation, and accommodation and food services (%)
Most Common Industries - Arts, entertainment, and recreation (%)
Most Common Industries - Accommodation and food services (%)
Most Common Industries - Other services, except public administration (%)
Most Common Industries - Public administration (%)
Occupation diversity
Most Common Occupations - Management, business, science, and arts occupations (%)
Most Common Occupations - Management, business, and financial occupations (%)
Most Common Occupations - Management occupations (%)
Most Common Occupations - Business and financial operations occupations (%)
Most Common Occupations - Computer, engineering, and science occupations (%)
Most Common Occupations - Computer and mathematical occupations (%)
Most Common Occupations - Architecture and engineering occupations (%)
Most Common Occupations - Life, physical, and social science occupations (%)
Most Common Occupations - Education, legal, community service, arts, and media occupations (%)
Most Common Occupations - Community and social service occupations (%)
Most Common Occupations - Legal occupations (%)
Most Common Occupations - Education, training, and library occupations (%)
Most Common Occupations - Arts, design, entertainment, sports, and media occupations (%)
Most Common Occupations - Healthcare practitioners and technical occupations (%)
Most Common Occupations - Health diagnosing and treating practitioners and other technical occupations (%)
Most Common Occupations - Health technologists and technicians (%)
Most Common Occupations - Service occupations (%)
Most Common Occupations - Healthcare support occupations (%)
Most Common Occupations - Protective service occupations (%)
Most Common Occupations - Fire fighting and prevention, and other protective service workers including supervisors (%)
Most Common Occupations - Law enforcement workers including supervisors (%)
Most Common Occupations - Food preparation and serving related occupations (%)
Most Common Occupations - Building and grounds cleaning and maintenance occupations (%)
Most Common Occupations - Personal care and service occupations (%)
Most Common Occupations - Sales and office occupations (%)
Most Common Occupations - Sales and related occupations (%)
Most Common Occupations - Office and administrative support occupations (%)
Most Common Occupations - Natural resources, construction, and maintenance occupations (%)
Most Common Occupations - Farming, fishing, and forestry occupations (%)
Most Common Occupations - Construction and extraction occupations (%)
Most Common Occupations - Installation, maintenance, and repair occupations (%)
Most Common Occupations - Production, transportation, and material moving occupations (%)
Most Common Occupations - Production occupations (%)
Most Common Occupations - Transportation occupations (%)
Most Common Occupations - Material moving occupations (%)
People in Group quarters - Institutionalized population (%)
People in Group quarters - Correctional institutions (%)
People in Group quarters - Federal prisons and detention centers (%)
People in Group quarters - Halfway houses (%)
People in Group quarters - Local jails and other confinement facilities (including police lockups) (%)
People in Group quarters - Military disciplinary barracks (%)
People in Group quarters - State prisons (%)
People in Group quarters - Other types of correctional institutions (%)
People in Group quarters - Nursing homes (%)
People in Group quarters - Hospitals/wards, hospices, and schools for the handicapped (%)
People in Group quarters - Hospitals/wards and hospices for chronically ill (%)
People in Group quarters - Hospices or homes for chronically ill (%)
People in Group quarters - Military hospitals or wards for chronically ill (%)
People in Group quarters - Other hospitals or wards for chronically ill (%)
People in Group quarters - Hospitals or wards for drug/alcohol abuse (%)
People in Group quarters - Mental (Psychiatric) hospitals or wards (%)
People in Group quarters - Schools, hospitals, or wards for the mentally retarded (%)
People in Group quarters - Schools, hospitals, or wards for the physically handicapped (%)
People in Group quarters - Institutions for the deaf (%)
People in Group quarters - Institutions for the blind (%)
People in Group quarters - Orthopedic wards and institutions for the physically handicapped (%)
People in Group quarters - Wards in general hospitals for patients who have no usual home elsewhere (%)
People in Group quarters - Wards in military hospitals for patients who have no usual home elsewhere (%)
People in Group quarters - Juvenile institutions (%)
People in Group quarters - Long-term care (%)
People in Group quarters - Homes for abused, dependent, and neglected children (%)
People in Group quarters - Residential treatment centers for emotionally disturbed children (%)
People in Group quarters - Training schools for juvenile delinquents (%)
People in Group quarters - Short-term care, detention or diagnostic centers for delinquent children (%)
People in Group quarters - Type of juvenile institution unknown (%)
People in Group quarters - Noninstitutionalized population (%)
People in Group quarters - College dormitories (includes college quarters off campus) (%)
People in Group quarters - Military quarters (%)
People in Group quarters - On base (%)
People in Group quarters - Barracks, unaccompanied personnel housing (UPH), (Enlisted/Officer), ;and similar group living quarters for military personnel (%)
People in Group quarters - Transient quarters for temporary residents (%)
People in Group quarters - Military ships (%)
People in Group quarters - Group homes (%)
People in Group quarters - Homes or halfway houses for drug/alcohol abuse (%)
People in Group quarters - Homes for the mentally ill (%)
People in Group quarters - Homes for the mentally retarded (%)
People in Group quarters - Homes for the physically handicapped (%)
People in Group quarters - Other group homes (%)
People in Group quarters - Religious group quarters (%)
People in Group quarters - Dormitories (%)
People in Group quarters - Agriculture workers' dormitories on farms (%)
People in Group quarters - Job Corps and vocational training facilities (%)
People in Group quarters - Other workers' dormitories (%)
People in Group quarters - Crews of maritime vessels (%)
People in Group quarters - Other nonhousehold living situations (%)
People in Group quarters - Other noninstitutional group quarters (%)
Residents speaking English at home (%)
Residents speaking English at home - Born in the United States (%)
Residents speaking English at home - Native, born elsewhere (%)
Residents speaking English at home - Foreign born (%)
Residents speaking Spanish at home (%)
Residents speaking Spanish at home - Born in the United States (%)
Residents speaking Spanish at home - Native, born elsewhere (%)
Residents speaking Spanish at home - Foreign born (%)
Residents speaking other language at home (%)
Residents speaking other language at home - Born in the United States (%)
Residents speaking other language at home - Native, born elsewhere (%)
Residents speaking other language at home - Foreign born (%)
Class of Workers - Employee of private company (%)
Class of Workers - Self-employed in own incorporated business (%)
Class of Workers - Private not-for-profit wage and salary workers (%)
Class of Workers - Local government workers (%)
Class of Workers - State government workers (%)
Class of Workers - Federal government workers (%)
Class of Workers - Self-employed workers in own not incorporated business and Unpaid family workers (%)
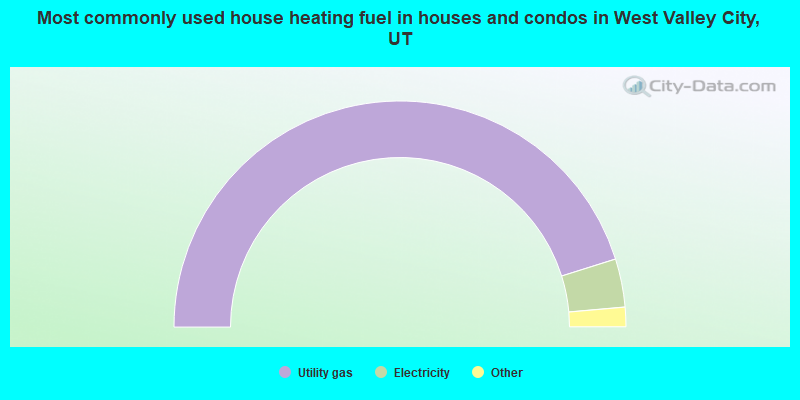
House heating fuel used in houses and condos - Utility gas (%)
House heating fuel used in houses and condos - Bottled, tank, or LP gas (%)
House heating fuel used in houses and condos - Electricity (%)
House heating fuel used in houses and condos - Fuel oil, kerosene, etc. (%)
House heating fuel used in houses and condos - Coal or coke (%)
House heating fuel used in houses and condos - Wood (%)
House heating fuel used in houses and condos - Solar energy (%)
House heating fuel used in houses and condos - Other fuel (%)
House heating fuel used in houses and condos - No fuel used (%)
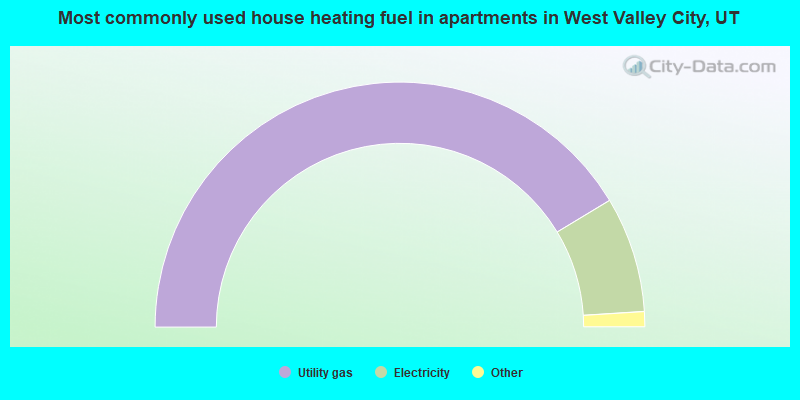
House heating fuel used in apartments - Utility gas (%)
House heating fuel used in apartments - Bottled, tank, or LP gas (%)
House heating fuel used in apartments - Electricity (%)
House heating fuel used in apartments - Fuel oil, kerosene, etc. (%)
House heating fuel used in apartments - Coal or coke (%)
House heating fuel used in apartments - Wood (%)
House heating fuel used in apartments - Solar energy (%)
House heating fuel used in apartments - Other fuel (%)
House heating fuel used in apartments - No fuel used (%)
Armed forces status - In Armed Forces (%)
Armed forces status - Civilian (%)
Armed forces status - Civilian - Veteran (%)
Armed forces status - Civilian - Nonveteran (%)
Fatal accidents locations in years 2005-2021
Fatal accidents locations in 2005
Fatal accidents locations in 2006
Fatal accidents locations in 2007
Fatal accidents locations in 2008
Fatal accidents locations in 2009
Fatal accidents locations in 2010
Fatal accidents locations in 2011
Fatal accidents locations in 2012
Fatal accidents locations in 2013
Fatal accidents locations in 2014
Fatal accidents locations in 2015
Fatal accidents locations in 2016
Fatal accidents locations in 2017
Fatal accidents locations in 2018
Fatal accidents locations in 2019
Fatal accidents locations in 2020
Fatal accidents locations in 2021
Alcohol use - People drinking some alcohol every month (%)
Alcohol use - People not drinking at all (%)
Alcohol use - Average days/month drinking alcohol
Alcohol use - Average drinks/week
Alcohol use - Average days/year people drink much
Audiometry - Average condition of hearing (%)
Audiometry - People that can hear a whisper from across a quiet room (%)
Audiometry - People that can hear normal voice from across a quiet room (%)
Audiometry - Ears ringing, roaring, buzzing (%)
Audiometry - Had a job exposure to loud noise (%)
Audiometry - Had off-work exposure to loud noise (%)
Blood Pressure & Cholesterol - Has high blood pressure (%)
Blood Pressure & Cholesterol - Checking blood pressure at home (%)
Blood Pressure & Cholesterol - Frequently checking blood cholesterol (%)
Blood Pressure & Cholesterol - Has high cholesterol level (%)
Consumer Behavior - Money monthly spent on food at supermarket/grocery store
Consumer Behavior - Money monthly spent on food at other stores
Consumer Behavior - Money monthly spent on eating out
Consumer Behavior - Money monthly spent on carryout/delivered foods
Consumer Behavior - Income spent on food at supermarket/grocery store (%)
Consumer Behavior - Income spent on food at other stores (%)
Consumer Behavior - Income spent on eating out (%)
Consumer Behavior - Income spent on carryout/delivered foods (%)
Current Health Status - General health condition (%)
Current Health Status - Blood donors (%)
Current Health Status - Has blood ever tested for HIV virus (%)
Current Health Status - Left-handed people (%)
Dermatology - People using sunscreen (%)
Diabetes - Diabetics (%)
Diabetes - Had a blood test for high blood sugar (%)
Diabetes - People taking insulin (%)
Diet Behavior & Nutrition - Diet health (%)
Diet Behavior & Nutrition - Milk product consumption (# of products/month)
Diet Behavior & Nutrition - Meals not home prepared (#/week)
Diet Behavior & Nutrition - Meals from fast food or pizza place (#/week)
Diet Behavior & Nutrition - Ready-to-eat foods (#/month)
Diet Behavior & Nutrition - Frozen meals/pizza (#/month)
Drug Use - People that ever used marijuana or hashish (%)
Drug Use - Ever used hard drugs (%)
Drug Use - Ever used any form of cocaine (%)
Drug Use - Ever used heroin (%)
Drug Use - Ever used methamphetamine (%)
Health Insurance - People covered by health insurance (%)
Kidney Conditions-Urology - Avg. # of times urinating at night
Medical Conditions - People with asthma (%)
Medical Conditions - People with anemia (%)
Medical Conditions - People with psoriasis (%)
Medical Conditions - People with overweight (%)
Medical Conditions - Elderly people having difficulties in thinking or remembering (%)
Medical Conditions - People who ever received blood transfusion (%)
Medical Conditions - People having trouble seeing even with glass/contacts (%)
Medical Conditions - People with arthritis (%)
Medical Conditions - People with gout (%)
Medical Conditions - People with congestive heart failure (%)
Medical Conditions - People with coronary heart disease (%)
Medical Conditions - People with angina pectoris (%)
Medical Conditions - People who ever had heart attack (%)
Medical Conditions - People who ever had stroke (%)
Medical Conditions - People with emphysema (%)
Medical Conditions - People with thyroid problem (%)
Medical Conditions - People with chronic bronchitis (%)
Medical Conditions - People with any liver condition (%)
Medical Conditions - People who ever had cancer or malignancy (%)
Mental Health - People who have little interest in doing things (%)
Mental Health - People feeling down, depressed, or hopeless (%)
Mental Health - People who have trouble sleeping or sleeping too much (%)
Mental Health - People feeling tired or having little energy (%)
Mental Health - People with poor appetite or overeating (%)
Mental Health - People feeling bad about themself (%)
Mental Health - People who have trouble concentrating on things (%)
Mental Health - People moving or speaking slowly or too fast (%)
Mental Health - People having thoughts they would be better off dead (%)
Oral Health - Average years since last visit a dentist
Oral Health - People embarrassed because of mouth (%)
Oral Health - People with gum disease (%)
Oral Health - General health of teeth and gums (%)
Oral Health - Average days a week using dental floss/device
Oral Health - Average days a week using mouthwash for dental problem
Oral Health - Average number of teeth
Pesticide Use - Households using pesticides to control insects (%)
Pesticide Use - Households using pesticides to kill weeds (%)
Physical Activity - People doing vigorous-intensity work activities (%)
Physical Activity - People doing moderate-intensity work activities (%)
Physical Activity - People walking or bicycling (%)
Physical Activity - People doing vigorous-intensity recreational activities (%)
Physical Activity - People doing moderate-intensity recreational activities (%)
Physical Activity - Average hours a day doing sedentary activities
Physical Activity - Average hours a day watching TV or videos
Physical Activity - Average hours a day using computer
Physical Functioning - People having limitations keeping them from working (%)
Physical Functioning - People limited in amount of work they can do (%)
Physical Functioning - People that need special equipment to walk (%)
Physical Functioning - People experiencing confusion/memory problems (%)
Physical Functioning - People requiring special healthcare equipment (%)
Prescription Medications - Average number of prescription medicines taking
Preventive Aspirin Use - Adults 40+ taking low-dose aspirin (%)
Reproductive Health - Vaginal deliveries (%)
Reproductive Health - Cesarean deliveries (%)
Reproductive Health - Deliveries resulted in a live birth (%)
Reproductive Health - Pregnancies resulted in a delivery (%)
Reproductive Health - Women breastfeeding newborns (%)
Reproductive Health - Women that had a hysterectomy (%)
Reproductive Health - Women that had both ovaries removed (%)
Reproductive Health - Women that have ever taken birth control pills (%)
Reproductive Health - Women taking birth control pills (%)
Reproductive Health - Women that have ever used Depo-Provera or injectables (%)
Reproductive Health - Women that have ever used female hormones (%)
Sexual Behavior - People 18+ that ever had sex (vaginal, anal, or oral) (%)
Sexual Behavior - Males 18+ that ever had vaginal sex with a woman (%)
Sexual Behavior - Males 18+ that ever performed oral sex on a woman (%)
Sexual Behavior - Males 18+ that ever had anal sex with a woman (%)
Sexual Behavior - Males 18+ that ever had any sex with a man (%)
Sexual Behavior - Females 18+ that ever had vaginal sex with a man (%)
Sexual Behavior - Females 18+ that ever performed oral sex on a man (%)
Sexual Behavior - Females 18+ that ever had anal sex with a man (%)
Sexual Behavior - Females 18+ that ever had any kind of sex with a woman (%)
Sexual Behavior - Average age people first had sex
Sexual Behavior - Average number of female sex partners in lifetime (males 18+)
Sexual Behavior - Average number of female vaginal sex partners in lifetime (males 18+)
Sexual Behavior - Average age people first performed oral sex on a woman (18+)
Sexual Behavior - Average number of woman performed oral sex on in lifetime (18+)
Sexual Behavior - Average number of male sex partners in lifetime (males 18+)
Sexual Behavior - Average number of male anal sex partners in lifetime (males 18+)
Sexual Behavior - Average age people first performed oral sex on a man (18+)
Sexual Behavior - Average number of male oral sex partners in lifetime (18+)
Sexual Behavior - People using protection when performing oral sex (%)
Sexual Behavior - Average number of times people have vaginal or anal sex a year
Sexual Behavior - People having sex without condom (%)
Sexual Behavior - Average number of male sex partners in lifetime (females 18+)
Sexual Behavior - Average number of male vaginal sex partners in lifetime (females 18+)
Sexual Behavior - Average number of female sex partners in lifetime (females 18+)
Sexual Behavior - Circumcised males 18+ (%)
Sleep Disorders - Average hours sleeping at night
Sleep Disorders - People that has trouble sleeping (%)
Smoking-Cigarette Use - People smoking cigarettes (%)
Taste & Smell - People 40+ having problems with smell (%)
Taste & Smell - People 40+ having problems with taste (%)
Taste & Smell - People 40+ that ever had wisdom teeth removed (%)
Taste & Smell - People 40+ that ever had tonsils teeth removed (%)
Taste & Smell - People 40+ that ever had a loss of consciousness because of a head injury (%)
Taste & Smell - People 40+ that ever had a broken nose or other serious injury to face or skull (%)
Taste & Smell - People 40+ that ever had two or more sinus infections (%)
Weight - Average height (inches)
Weight - Average weight (pounds)
Weight - Average BMI
Weight - People that are obese (%)
Weight - People that ever were obese (%)
Weight - People trying to lose weight (%)
Latest news from West Valley City, UT collected exclusively by city-data.com from local newspapers, TV, and radio stations
Ancestries: English (8.5%), American (4.4%), European (2.7%), German (2.6%), Danish (1.5%), Irish (1.2%).
Current Local Time:
Land area: 35.4 square miles.
Population density: 3,860 people per square mile (average).
32,408 residents are foreign born (15.1% Latin America , 3.6% Asia ).
Median real estate property taxes paid for housing units with mortgages in 2022: $2,358 (0.5%)Median real estate property taxes paid for housing units with no mortgage in 2022: $2,285 (0.6%)
Nearest city with pop. 200,000+: Las Vegas, NV
Nearest city with pop. 1,000,000+: Phoenix, AZ
Nearest cities:
Latitude: 40.69 N, Longitude: 111.99 W
Daytime population change due to commuting: -4,651 (-3.4%)Workers who live and work in this city: 22,006 (33.2%)
Area code commonly used in this area: 801
West Valley City tourist attractions:
Single-family new house construction building permits:
2022: 82 buildings , average cost: $308,9002021: 176 buildings , average cost: $295,7002020: 118 buildings , average cost: $273,9002019: 174 buildings , average cost: $324,5002018: 199 buildings , average cost: $261,3002017: 224 buildings , average cost: $131,8002016: 167 buildings , average cost: $125,9002015: 225 buildings , average cost: $112,4002014: 138 buildings , average cost: $104,3002013: 201 buildings , average cost: $105,2002012: 204 buildings , average cost: $97,2002011: 89 buildings , average cost: $95,2002010: 133 buildings , average cost: $99,7002009: 136 buildings , average cost: $99,3002008: 98 buildings , average cost: $108,6002007: 235 buildings , average cost: $110,1002006: 487 buildings , average cost: $114,3002005: 359 buildings , average cost: $104,5002004: 344 buildings , average cost: $96,6002003: 494 buildings , average cost: $89,2002002: 522 buildings , average cost: $84,6002001: 482 buildings , average cost: $78,8002000: 445 buildings , average cost: $79,1001999: 479 buildings , average cost: $79,6001998: 554 buildings , average cost: $74,2001997: 737 buildings , average cost: $69,200Unemployment in December 2023: Population change in the 1990s: +22,024 (+25.4%).
Most common occupations in West Valley City, UT (%)
Both Males Females
Building and grounds cleaning and maintenance occupations (6.2%)
Cooks and food preparation workers (6.0%)
Other production occupations, including supervisors (4.1%)
Material recording, scheduling, dispatching, and distributing workers (3.9%)
Customer service representatives (3.8%)
Laborers and material movers, hand (3.4%)
Driver/sales workers and truck drivers (3.3%)
Building and grounds cleaning and maintenance occupations (6.4%)
Driver/sales workers and truck drivers (5.7%)
Electrical equipment mechanics and other installation, maintenance, and repair workers, including supervisors (5.1%)
Laborers and material movers, hand (4.7%)
Other production occupations, including supervisors (4.7%)
Construction traders workers except carpenters, electricians, painters, plumbers, and construction laborers (4.5%)
Cooks and food preparation workers (4.1%)
Cooks and food preparation workers (8.5%)
Customer service representatives (6.1%)
Building and grounds cleaning and maintenance occupations (5.9%)
Information and record clerks, except customer service representatives (5.3%)
Other office and administrative support workers, including supervisors (4.2%)
Material recording, scheduling, dispatching, and distributing workers (3.8%)
Financial clerks, except bookkeeping, accounting and auditing clerks (3.7%)
Earthquake activity:
West Valley City-area historical earthquake activity is significantly above Utah state average. It is 2209% greater than the overall U.S. average. On 8/18/1959 at 06:37:13, a magnitude 7.7 (7.7 UK, Class: Major, Intensity: VIII - XII) earthquake occurred 276.7 miles away from the city center, causing $26,000,000 total damage On 10/3/1915 at 06:52:48, a magnitude 7.6 (7.6 UK) earthquake occurred 289.4 miles away from West Valley City center On 10/28/1983 at 14:06:06, a magnitude 7.3 (6.2 MB, 7.3 MS, 7.0 MW) earthquake occurred 251.9 miles away from the city center, causing 2 deaths ( 2 shaking deaths) and 3 injuries, causing $15,000,000 total damage On 3/28/1975 at 02:31:05, a magnitude 6.2 (6.1 MB, 6.0 MS, 6.2 ML, Class: Strong, Intensity: VII - IX) earthquake occurred 94.8 miles away from the city center On 3/18/2020 at 13:09:31, a magnitude 5.7 (5.7 MW, Depth: 7.4 mi, Class: Moderate, Intensity: VI - VII) earthquake occurred 6.2 miles away from the city center On 12/21/1932 at 06:10:09, a magnitude 7.2 (7.2 UK) earthquake occurred 357.8 miles away from West Valley City center Magnitude types: body-wave magnitude (MB), local magnitude (ML), surface-wave magnitude (MS), moment magnitude (MW) Natural disasters: The number of natural disasters in Salt Lake County (9) is smaller than the US average (15).Major Disasters (Presidential) Declared: 4Emergencies Declared: 1Floods: 3, Storms: 3, Fires: 2, Landslides: 2, Earthquake: 1, Hurricane: 1, Mudslide: 1, Tornado: 1, Other: 1 (Note: some incidents may be assigned to more than one category). Hospitals and medical centers in West Valley City: PIONEER VALLEY HOSPITAL (3460 SOUTH PIONEER PARKWAY) PROMISE SPECIALTY HOSPITAL OF SALT LAKE (3460 SOUTH PIONEER PARKWAY 5TH FLOOR) WEST SIDE CENTER (4028 SOUTH 4800 WEST) HAZEN NURSING HOME (2520 SOUTH REDWOOD ROAD)
ROCKY MOUNTAIN CARE - WEST VALLEY (4150 WEST 3375 SOUTH)
Heliports located in West Valley City: Amtrak station near West Valley City: 7 miles: SALT LAKE CITY (320 S. RIO GRANDE ST.) Services: ticket office, fully wheelchair accessible, enclosed waiting area, public restrooms, public payphones, vending machines, free short-term parking, free long-term parking, call for car rental service, taxi stand.
College/University in West Valley City: Everest College-Salt Lake City Full-time enrollment: 543; Location: 3280 W 3500 S; Private, for-profit; Website: www.everest.edu/campus/salt_lake_city)
Colleges/universities with over 2000 students nearest to West Valley City:
Salt Lake Community College (about 3 miles; Salt Lake City, UT ; Full-time enrollment: 20,797)
Stevens-Henager College-Murray (about 6 miles; Murray, UT ; FT enrollment: 6,395)
Western Governors University (about 7 miles; Salt Lake City, UT ; FT enrollment: 31,481)
Latter-day Saints Business College (about 8 miles; Salt Lake City, UT ; FT enrollment: 2,059)
Westminster College (about 8 miles; Salt Lake City, UT ; FT enrollment: 2,870)
University of Utah (about 10 miles; Salt Lake City, UT ; FT enrollment: 28,454)
Utah Valley University (about 32 miles; Orem, UT ; FT enrollment: 24,403)
Biggest public high schools in West Valley City: HUNTER HIGH Students: 2,150, Location: 4200 S 5600 W, Grades: 10-12)HUNTER JR HIGH Students: 1,205, Location: 6131 W 3785 S, Grades: 7-9)JOHN F. KENNEDY JR HIGH Students: 1,068, Location: 4495 S 4800 W, Grades: 7-9)EAST HOLLYWOOD HIGH Location: 2185 S 3600 W, Grades: 9-12, Charter school )
MONTICELLO ACADEMY Location: 2782 S CORPORATE PARK DRIVE, Grades: KG-9, Charter school )
MANA ACADEMY CHARTER SCHOOL Location: 2355 S TECHNOLOGY DRIVE, Grades: KG-12, Charter school )
KAIROS ACADEMY Location: 1325 WEST 2200 SOUTH SUITE A, Grades: 9-12, Charter school )
GRANGER HIGH Location: 3690 S 3600 W, Grades: 9-12)
VALLEY JR HIGH Location: 4195 S 3200 W, Grades: 7-9)
WEST LAKE JR HIGH Location: 3400 S 3450 W, Grades: 7-9)
Biggest public elementary/middle schools in West Valley City: GRANGER SCHOOL Students: 845, Location: 3702 S 1950 W, Grades: PK-6)STANSBURY SCHOOL Students: 805, Location: 3050 S 2700 W, Grades: PK-6)HILLSDALE SCHOOL Students: 801, Location: 3275 W 3100 S, Grades: PK-6)REDWOOD SCHOOL Students: 779, Location: 2650 S REDWOOD RD, Grades: PK-6)MONROE SCHOOL Students: 738, Location: 4450 W 3100 S, Grades: PK-6)DOUGLAS T. ORCHARD SCHOOL Students: 698, Location: 6744 W 3800 S, Grades: PK-6)HUNTER SCHOOL Students: 687, Location: 4351 S 5400 W, Grades: KG-6)PHILO T. FARNSWORTH SCHOOL Students: 686, Location: 3751 S 4225 W, Grades: KG-6)WHITTIER SCHOOL Students: 678, Location: 3585 S 6000 W, Grades: KG-6)ACADEMY PARK SCHOOL Students: 612, Location: 4580 WESTPOINT DR, Grades: KG-6)Private elementary/middle schools in West Valley City: DANCING MOOSE MONTESSORI SCHOOL Students: 206, Location: 4428 LINKS DR, Grades: UG-2)
SMALL WORLD CHILD CARE Students: 121, Location: 4130 S 3600 W, Grades: UG-6)
IQRA ACADEMY OF UTAH Students: 33, Location: 1293 W 2200 S STE B, Grades: KG-4)
See full list of schools located in West Valley City
Notable locations in West Valley City: (A) , Mini Warehouse Condominium (B) , Wedelco Industrial Subdivision (C) , Cyprus Siding (D) , West Valley City Fire Department Station 72 (E) , Alliant Techsystems Fire Station (F) , West Valley City Fire Department Station 71 (G) , West Valley City Fire Department Station 74 (H) , West Valley City Fire Department Station 75 (I) , Unified Fire Authority Station 107 (J) , West Valley City Fire Department Station 73 (K) . Display/hide their locations on the map
Shopping Centers: (1) , West Valley Shopping Center (2) , Legacy Plaza Shopping Center (3) , Valley Fair Mall (4) , Redwood Shopping Center (5) , Granger Shopping Center (6) . Display/hide their locations on the map
Churches in West Valley City include: (A) , The Church of Jesus Christ of Latter Day Saints (B) , Mount Calvary Family Worship Center (C) , The Church of Jesus Christ of Latter Day Saints (D) , Blake Manor Reception Center (E) , Kingdom Hall of Jehovahs Witnesses of West Valley (F) , Atonement Lutheran Church (G) , Bible Baptist Church (H) , First Apostolic (I) . Display/hide their locations on the map
Cemetery: (1) . Display/hide its location on the map
Lake: (A) . Display/hide its location on the map
Creeks: (A) , Mill Creek (B) , Coon Creek (C) . Display/hide their locations on the map
Hotel: (1) . Display/hide its approximate location on the map
Birthplace of: Ray Feinga - Football player, D. J. Jelitto - Ice hockey player.
Salt Lake County has a predicted average indoor radon screening level between 2 and 4 pCi/L (pico curies per liter) - Moderate Potential Drinking water stations with addresses in West Valley City and their reported violations in the past:
PINE MOUNTAIN MUTUAL (Population served: 328, Groundwater):
Past health violations:
MCL, Monthly (TCR) - In OCT-2009, Contaminant: Coliform. Follow-up actions: St Compliance achieved (DEC-14-2009), St Public Notif requested (DEC-17-2009), St Formal NOV issued (DEC-17-2009)
Drinking water stations with addresses in West Valley City that have no violations reported:
SAMAK COUNTRY ESTATES WUA (Population served: 35, Primary Water Source Type: Groundwater)
Average household size: This city:
3.5 peopleUtah:
3.1 people
Percentage of family households: This city:
79.6%Whole state:
75.2%
Percentage of households with unmarried partners: This city:
7.0%Whole state:
4.6%
Likely homosexual households (counted as self-reported same-sex unmarried-partner households)
Lesbian couples: 0.5% of all households Gay men: 0.4% of all households
People in group quarters in West Valley City in 2010:
77 people in nursing facilities/skilled-nursing facilities
55 people in correctional residential facilities
26 people in correctional facilities intended for juveniles
19 people in other noninstitutional facilities
16 people in group homes intended for adults
People in group quarters in West Valley City in 2000:
258 people in other noninstitutional group quarters
86 people in nursing homes
57 people in halfway houses
54 people in unknown juvenile institutions
15 people in other nonhousehold living situations
7 people in job corps and vocational training facilities
6 people in other group homes
4 people in homes for the mentally ill
4 people in homes for the mentally retarded
2 people in wards in general hospitals for patients who have no usual home elsewhere
Arenas or stadiums:
E Center. Capacity: 12,000.
Golden Spike Arena. Capacity: 8,500.
Banks with branches in West Valley City (2011 data):
Wells Fargo Bank, National Association: Fresh Market Granger Branch, Fresh Market West Valley Branch, Valley Fair Branch. Info updated 2011/04/05: Bank assets: $1,161,490.0 mil, Deposits: $905,653.0 mil, headquarters in Sioux Falls, SD, positive income , 6395 total offices , Holding Company: Wells Fargo & Company
First Utah Bank: International Branch at 3123 South Redwood Road, branch established on 2007/04/13; West Valley City Branch at 4900 West 3500 South, branch established on 1994/02/01. Info updated 2006/11/03: Bank assets: $253.4 mil, Deposits: $215.2 mil, headquarters in Salt Lake City, UT, negative income in the last year , Commercial Lending Specialization, 8 total offices , Holding Company: First Utah Bancorporation
U.S. Bank National Association: West Valley Branch at 3580 South 2700 West, branch established on 1971/01/04. Info updated 2012/01/30: Bank assets: $330,470.8 mil, Deposits: $236,091.5 mil, headquarters in Cincinnati, OH, positive income , 3121 total offices , Holding Company: U.S. Bancorp
Zions First National Bank: Bangerter Highway Branch at 3712 West 3500 South, branch established on 2001/05/09. Info updated 2006/11/03: Bank assets: $17,531.3 mil, Deposits: $14,905.3 mil, headquarters in Salt Lake City, UT, positive income , Commercial Lending Specialization, 151 total offices , Holding Company: Zions Bancorporation
JPMorgan Chase Bank, National Association: West Valley City Branch at 3029 S Colt Plaza Drive, Unit 01, branch established on 1995/04/17. Info updated 2011/11/10: Bank assets: $1,811,678.0 mil, Deposits: $1,190,738.0 mil, headquarters in Columbus, OH, positive income , International Specialization, 5577 total offices , Holding Company: Jpmorgan Chase & Co.
For population 15 years and over in West Valley City:
Never married: 35.2%Now married: 48.9%Separated: 2.3%Widowed: 3.3%Divorced: 10.3% For population 25 years and over in West Valley City:
High school or higher: 78.9%Bachelor's degree or higher: 16.2%Graduate or professional degree: 4.2%Unemployed: 2.0%Mean travel time to work (commute): 18.9 minutes
Education Gini index (Inequality in education) Here:
15.8Utah average:
10.9
Religion statistics for West Valley City, UT (based on Salt Lake County data)
Religion Adherents Congregations Other 622,807 1,452 Catholic 84,342 24 Evangelical Protestant 27,497 144 Mainline Protestant 12,789 38 Orthodox 5,352 7 Black Protestant 1,302 6 None 275,566 -
Source: Clifford Grammich, Kirk Hadaway, Richard Houseal, Dale E.Jones, Alexei Krindatch, Richie Stanley and Richard H.Taylor. 2012. 2010 U.S.Religion Census: Religious Congregations & Membership Study. Association of Statisticians of American Religious Bodies. Jones, Dale E., et al. 2002. Congregations and Membership in the United States 2000. Nashville, TN: Glenmary Research Center. Graphs represent county-level data
Food Environment Statistics: Number of grocery stores : 146Salt Lake County :
1.45 / 10,000 pop.State :
1.37 / 10,000 pop.
Number of supercenters and club stores : 16This county :
0.16 / 10,000 pop.Utah :
0.18 / 10,000 pop.
Number of convenience stores (no gas) : 47Here :
0.47 / 10,000 pop.State :
0.41 / 10,000 pop.
Number of convenience stores (with gas) : 246This county :
2.45 / 10,000 pop.Utah :
2.82 / 10,000 pop.
Number of full-service restaurants : 558Salt Lake County :
5.55 / 10,000 pop.Utah :
5.09 / 10,000 pop.
Adult diabetes rate : Salt Lake County :
6.5%Utah :
6.3%
Adult obesity rate : Salt Lake County :
22.7%State :
23.6%
Health and Nutrition: Healthy diet rate : West Valley City:
47.1%Utah:
48.9%
Average overall health of teeth and gums : This city:
44.6%Utah:
47.0%
People feeling badly about themselves : This city:
21.9%State:
21.0%
People not drinking alcohol at all : West Valley City:
10.7%State:
10.3%
Average hours sleeping at night : West Valley City:
6.8Utah:
6.8
General health condition : West Valley City:
55.9%Utah:
57.4%
Average condition of hearing : More about Health and Nutrition of West Valley City, UT Residents
Local government employment and payroll (March 2022)
Function
Full-time employees
Monthly full-time payroll
Average yearly full-time wage
Part-time employees
Monthly part-time payroll
Police Protection - Officers
217 $1,014,599 $56,107 0 $0 Firefighters
123 $626,426 $61,115 0 $0 Parks and Recreation
69 $266,297 $46,313 179 $59,788 Police - Other
55 $224,859 $49,060 68 $39,997 Streets and Highways
52 $209,164 $48,269 1 $2,644 Judicial and Legal
43 $204,817 $57,158 2 $4,767 Other Government Administration
41 $212,213 $62,111 7 $11,284 Other and Unallocable
34 $146,147 $51,581 1 $2,031 Financial Administration
29 $160,449 $66,393 0 $0 Health
20 $52,707 $31,624 3 $3,968 Housing and Community Development (Local)
13 $98,299 $90,738 2 $2,135 Fire - Other
6 $18,396 $36,792 1 $919 Solid Waste Management
3 $9,867 $39,468 0 $0 Welfare
0 $0 4 $12,723
Totals for Government
705 $3,244,239 $55,221 268 $140,255
West Valley City government finances - Expenditure in 2021 (per resident):
Construction - General - Other: $44,000 ($0.32)
General Public Buildings: $7,000 ($0.05)Current Operations - Police Protection: $28,707,000 ($210.08)
Regular Highways: $21,540,000 ($157.63)General - Other: $13,176,000 ($96.42)Local Fire Protection: $13,006,000 ($95.18)Housing and Community Development: $12,505,000 ($91.51)Parks and Recreation: $11,669,000 ($85.39)Central Staff Services: $8,413,000 ($61.57)Judicial and Legal Services: $4,665,000 ($34.14)Solid Waste Management: $4,364,000 ($31.94)Health - Other: $3,245,000 ($23.75)Financial Administration: $2,245,000 ($16.43)General Public Buildings: $1,471,000 ($10.76)Public Welfare - Other: $1,303,000 ($9.54)Protective Inspection and Regulation - Other: $980,000 ($7.17)Sewerage: $427,000 ($3.12)General - Interest on Debt: $6,241,000 ($45.67)
Intergovernmental to Local - Other - Public Welfare - Other: $304,000 ($2.22)
Other - Parks and Recreation: $80,000 ($0.59)Intergovernmental to State - Public Welfare: $209,000 ($1.53)
Other Capital Outlay - General - Other: $2,296,000 ($16.80)
Parks and Recreation: $1,156,000 ($8.46)Regular Highways: $575,000 ($4.21)Sewerage: $343,000 ($2.51)Local Fire Protection: $77,000 ($0.56)Solid Waste Management: $53,000 ($0.39)Police Protection: $10,000 ($0.07)Total Salaries and Wages: $48,910,000 ($357.92)
West Valley City government finances - Revenue in 2021 (per resident):
Charges - Other: $6,308,000 ($46.16)
Solid Waste Management: $5,992,000 ($43.85)Parks and Recreation: $5,763,000 ($42.17)Sewerage: $3,938,000 ($28.82)Regular Highways: $430,000 ($3.15)Federal Intergovernmental - Housing and Community Development: $3,742,000 ($27.38)
Public Welfare: $408,000 ($2.99)Local Intergovernmental - Public Welfare: $304,000 ($2.22)
Other: $18,000 ($0.13)Miscellaneous - Fines and Forfeits: $2,591,000 ($18.96)
Rents: $2,551,000 ($18.67)General Revenue - Other: $899,000 ($6.58)Interest Earnings: $516,000 ($3.78)Sale of Property: $310,000 ($2.27)Donations From Private Sources: $100,000 ($0.73)State Intergovernmental - Highways: $4,609,000 ($33.73)
Other: $2,614,000 ($19.13)General Local Government Support: $142,000 ($1.04)Tax - Property: $46,555,000 ($340.69)
General Sales and Gross Receipts: $35,191,000 ($257.53)Public Utilities Sales: $9,027,000 ($66.06)Other License: $3,522,000 ($25.77)Occupation and Business License - Other: $1,771,000 ($12.96)Other Selective Sales: $298,000 ($2.18)Alcoholic Beverage License: $62,000 ($0.45)
West Valley City government finances - Debt in 2021 (per resident):
Long Term Debt - Beginning Outstanding - Unspecified Public Purpose: $155,134,000 ($1135.27)
Outstanding Unspecified Public Purpose: $147,874,000 ($1082.14)Retired Unspecified Public Purpose: $24,292,000 ($177.77)Issue, Unspecified Public Purpose: $17,032,000 ($124.64)Outstanding Nonguaranteed - Industrial Revenue: $101,000 ($0.74)Beginning Outstanding - Public Debt for Private Purpose: $101,000 ($0.74)
West Valley City government finances - Cash and Securities in 2021 (per resident):
Bond Funds - Cash and Securities: $45,550,000 ($333.33)
Other Funds - Cash and Securities: $58,417,000 ($427.49)
Sinking Funds - Cash and Securities: $6,745,000 ($49.36)
6.29% of this county's 2021 resident taxpayers lived in other counties in 2020 ($73,956 average adjusted gross income )
Here:
6.29%Utah average:
7.95%
0.01% of residents moved from foreign countries ($111 average AGI )Salt Lake County:
0.01%Utah average:
0.02%
Top counties from which taxpayers relocated into this county between 2020 and 2021:
6.63% of this county's 2020 resident taxpayers moved to other counties in 2021 ($71,033 average adjusted gross income )
Here:
6.63%Utah average:
7.39%
0.01% of residents moved to foreign countries ($100 average AGI )Salt Lake County:
0.01%Utah average:
0.02%
Top counties to which taxpayers relocated from this county between 2020 and 2021:
Businesses in West Valley City, UT
Name Count Name Count
7-Eleven 7 Lowe's 1 AT&T 3 Macy's 1 Arby's 3 Maurices 1 Baskin-Robbins 1 McDonald's 3 Bath & Body Works 1 Motherhood Maternity 1 Big O Tires 2 Nike 1 Blockbuster 2 Office Depot 1 Carl\s Jr. 3 Payless 2 Chevrolet 1 Penske 1 Cricket Wireless 10 Pizza Hut 2 Curves 1 Red Robin 1 Dairy Queen 2 SONIC Drive-In 2 Famous Footwear 2 Sprint Nextel 2 FedEx 5 Staples 1 Foot Locker 1 Starbucks 1 Ford 1 Subway 5 GNC 1 T-Mobile 4 GameStop 3 T.G.I. Driday's 1 H&R Block 3 Taco Bell 2 Holiday Inn 2 Toys"R"Us 1 Home Depot 1 U-Haul 3 IHOP 2 UPS 1 Jimmy John's 1 Vans 1 Journeys 1 Verizon Wireless 2 Kmart 1 Village Inn 1 Kohl's 1 Walmart 1 Kroger 2
Strongest AM radio stations in West Valley City:
KIQN (1010 AM; 50 kW; TOOELE, UT)
KTKK (630 AM; 10 kW; SANDY, UT; Owner: UNITED BROADCASTING COMPANY)
KBEE (860 AM; 10 kW; SALT LAKE CITY, UT; Owner: CITADEL BROADCASTING COMPANY)
KSL (1160 AM; 50 kW; SALT LAKE CITY, UT; Owner: BONNEVILLE HOLDING COMPANY)
KMRI (1550 AM; 10 kW; WEST VALLEY CITY, UT; Owner: KMRI RADIO, LLC)
KBJA (1640 AM; 10 kW; SANDY, UT; Owner: UNITED BROADCASTING COMPANY, INC)
KALL (700 AM; 50 kW; NORTH SALT LAKE CITY, UT; Owner: CITICASTERS LICENSES, L.P.)
KSOP (1370 AM; 5 kW; SOUTH SALT LAKE, UT; Owner: KSOP, INC.)
KFNZ (1320 AM; 5 kW; SALT LAKE CITY, UT; Owner: CITADEL BROADCASTING COMPANY)
KNRS (570 AM; 5 kW; SALT LAKE CITY, UT; Owner: CITICASTERS LICENSES, L.P.)
KLLB (1510 AM; daytime; 10 kW; WEST JORDAN, UT; Owner: UNITED SECURITY FINANCIAL, INC.)
KKDS (1060 AM; 10 kW; SOUTH SALT LAKE, UT; Owner: HOLIDAY BROADCASTING COMPANY)
KZNS (1280 AM; 10 kW; SALT LAKE CITY, UT; Owner: SIMMONS-SLC, LS, LLC)
Strongest FM radio stations in West Valley City:
KCPX (105.7 FM; CENTERVILLE, UT; Owner: MERCURY BROADCASTING COMPANY, INC.)
KSOP-FM (104.3 FM; SALT LAKE CITY, UT; Owner: KSOP, INC.)
K272DP (102.3 FM; TOOELE, UT; Owner: FAMILY STATIONS, INC.)
KBZN (97.9 FM; OGDEN, UT; Owner: CAPITOL BROADCASTING, INC.)
KRCL (90.9 FM; SALT LAKE CITY, UT; Owner: LISTENERS COMMUNITY RADIO OF UTAH)
KBER (101.1 FM; OGDEN, UT; Owner: CITADEL BROADCASTING COMPANY)
KISN-FM (97.1 FM; SALT LAKE CITY, UT; Owner: CLEAR CHANNEL BROADCASTING LICENSES, INC.)
KKAT (101.9 FM; OGDEN, UT; Owner: CITICASTERS LICENSES, L.P.)
KSFI (100.3 FM; SALT LAKE CITY, UT; Owner: SIMMONS-SLC, LS, LLC)
KUBL-FM (93.3 FM; SALT LAKE CITY, UT; Owner: CITADEL BROADCASTING COMPANY)
KOSY-FM (106.5 FM; SPANISH FORK, UT; Owner: MERCURY BROADCASTING COMPANY, INC.)
KRSP-FM (103.5 FM; SALT LAKE CITY, UT; Owner: SIMMONS-SLC, LS, LLC)
KUER-FM (90.1 FM; SALT LAKE CITY, UT; Owner: UNIVERSITY OF UTAH)
KBYU-FM (89.1 FM; PROVO, UT; Owner: BRIGHAM YOUNG UNIVERSITY)
KODJ (94.1 FM; SALT LAKE CITY, UT; Owner: CITICASTERS LICENSES, L.P.)
KURR (99.5 FM; BOUNTIFUL, UT; Owner: CITICASTERS LICENSES, L.P.)
KBEE-FM (98.7 FM; SALT LAKE CITY, UT; Owner: CITADEL BROADCASTING COMPANY)
K248AK (97.5 FM; DRAPER, UT; Owner: CITICASTERS LICENSES, L.P.)
K252DI (98.3 FM; SALT LAKE CITY, UT; Owner: FIRST NATIONAL BROADCASTING CORPORATION)
K276DP (103.1 FM; MILLCREEK, UT; Owner: FIRST NATIONAL B/CING CORPORATION)
TV broadcast stations around West Valley City:
KUTV (Channel 2; SALT LAKE CITY, UT; Owner: KUTV HOLDINGS, INC.)
K59GS (Channel 59; SALT LAKE CITY, UT; Owner: ALPHA & OMEGA COMMUNICATIONS, LLC)
KEJT-LP (Channel 48; SALT LAKE CITY, UT; Owner: TELEMUNDO OF NORTHERN CALIFORNIA LICENSE CORP.)
KULC (Channel 9; OGDEN, UT; Owner: UTAH STATE BOARD OF REGENTS)
KUED (Channel 7; SALT LAKE CITY, UT; Owner: UNIVERSITY OF UTAH)
KSL-TV (Channel 5; SALT LAKE CITY, UT; Owner: BONNEVILLE HOLDING COMPANY)
KBYU-TV (Channel 11; PROVO, UT; Owner: BRIGHAM YOUNG UNIVERSITY)
KUWB (Channel 30; OGDEN, UT; Owner: ACME TV LICENSES OF UTAH, LLC)
KJZZ-TV (Channel 14; SALT LAKE CITY, UT; Owner: LARRY H. MILLER COMMUNICATIONS CORP.)
KTVX (Channel 4; SALT LAKE CITY, UT; Owner: CLEAR CHANNEL BROADCASTING LICENSES, INC.)
KSTU (Channel 13; SALT LAKE CITY, UT; Owner: FOX TELEVISION STATIONS INC.)
KTMW (Channel 20; SALT LAKE CITY, UT; Owner: ALPHA & OMEGA COMMUNICATIONS, LLC)
K66FN (Channel 66; SALT LAKE CITY, UT; Owner: AZTECA BROADCASTING CORPORATION)
KUBX-LP (Channel 58; SALT LAKE CITY, UT; Owner: EQUITY BROADCASTING CORPORATION)
K68FY (Channel 68; SALT LAKE CITY, UT; Owner: PRICE BROADCASTING, INC.)
KUCL-LP (Channel 26; SALT LAKE CITY, UT; Owner: CHRISTIAN LIFE BROADCASTING)
K18FJ (Channel 18; SALT LAKE CITY, UT; Owner: NATIONAL MINORITY T.V., INC.)
National Bridge Inventory (NBI) Statistics 83 Number of bridges574ft / 175m Total length $3,891,000 Total costs2,269,606 Total average daily traffic339,869 Total average daily truck traffic
New bridges - historical statistics
3 1960-1969 21 1970-1979 14 1980-1989 10 1990-1999 6 2000-2009 13 2010-2019 16 2020-2022
See full National Bridge Inventory statistics for West Valley City, UT
Home Mortgage Disclosure Act Aggregated Statistics For Year 2009(Based on 19 full and 3 partial tracts) A) FHA, FSA/RHS & VA B) Conventional C) Refinancings D) Home Improvement Loans E) Loans on Dwellings For 5+ Families F) Non-occupant Loans on G) Loans On Manufactured Number Average Value Number Average Value Number Average Value Number Average Value Number Average Value Number Average Value Number Average Value
LOANS ORIGINATED 880 $171,898 240 $138,754 3,547 $161,215 85 $61,598 5 $755,400 124 $128,210 37 $85,949 APPLICATIONS APPROVED, NOT ACCEPTED 71 $175,056 27 $126,246 556 $165,827 11 $29,309 1 $780,000 27 $128,717 15 $54,839 APPLICATIONS DENIED 146 $173,056 123 $113,100 1,250 $166,396 99 $43,407 0 $0 101 $122,800 52 $38,222 APPLICATIONS WITHDRAWN 87 $170,588 35 $134,693 670 $169,657 35 $70,359 0 $0 30 $129,215 7 $73,150 FILES CLOSED FOR INCOMPLETENESS 23 $164,033 11 $101,624 179 $171,384 11 $102,130 0 $0 8 $126,676 4 $24,500
Aggregated Statistics For Year 2008(Based on 19 full and 3 partial tracts) A) FHA, FSA/RHS & VA B) Conventional C) Refinancings D) Home Improvement Loans E) Loans on Dwellings For 5+ Families F) Non-occupant Loans on G) Loans On Manufactured Number Average Value Number Average Value Number Average Value Number Average Value Number Average Value Number Average Value Number Average Value
LOANS ORIGINATED 795 $186,406 659 $149,312 2,940 $163,396 203 $74,875 5 $6,931,400 251 $141,438 66 $53,649 APPLICATIONS APPROVED, NOT ACCEPTED 44 $184,317 126 $168,764 473 $157,081 51 $84,652 0 $0 46 $151,578 25 $50,590 APPLICATIONS DENIED 160 $180,478 302 $159,688 1,806 $169,775 383 $97,516 0 $0 171 $155,591 70 $58,332 APPLICATIONS WITHDRAWN 181 $190,251 58 $181,013 778 $176,598 84 $123,217 0 $0 49 $156,218 3 $96,307 FILES CLOSED FOR INCOMPLETENESS 10 $214,415 25 $163,790 125 $168,680 21 $84,875 0 $0 10 $134,246 0 $0
Aggregated Statistics For Year 2007(Based on 19 full and 3 partial tracts) A) FHA, FSA/RHS & VA B) Conventional C) Refinancings D) Home Improvement Loans E) Loans on Dwellings For 5+ Families F) Non-occupant Loans on G) Loans On Manufactured Number Average Value Number Average Value Number Average Value Number Average Value Number Average Value Number Average Value Number Average Value
LOANS ORIGINATED 278 $182,072 2,328 $153,039 3,336 $147,383 431 $78,282 13 $2,367,452 523 $143,710 62 $57,909 APPLICATIONS APPROVED, NOT ACCEPTED 16 $213,086 394 $145,457 635 $149,454 95 $73,703 0 $0 83 $137,923 18 $63,882 APPLICATIONS DENIED 66 $180,210 1,069 $148,804 1,941 $154,012 486 $79,481 3 $231,507 266 $145,476 89 $39,420 APPLICATIONS WITHDRAWN 47 $187,627 270 $154,378 787 $152,568 115 $93,573 0 $0 85 $139,637 4 $87,478 FILES CLOSED FOR INCOMPLETENESS 3 $184,867 114 $156,468 240 $151,188 14 $120,148 0 $0 20 $129,106 0 $0
Aggregated Statistics For Year 2006(Based on 19 full and 3 partial tracts) A) FHA, FSA/RHS & VA B) Conventional C) Refinancings D) Home Improvement Loans E) Loans on Dwellings For 5+ Families F) Non-occupant Loans on G) Loans On Manufactured Number Average Value Number Average Value Number Average Value Number Average Value Number Average Value Number Average Value Number Average Value
LOANS ORIGINATED 345 $151,098 4,009 $110,796 3,045 $116,596 356 $57,589 6 $2,031,833 916 $110,444 40 $91,452 APPLICATIONS APPROVED, NOT ACCEPTED 26 $155,175 657 $104,253 643 $115,424 98 $48,803 1 $152,890 152 $102,116 23 $56,653 APPLICATIONS DENIED 52 $141,223 1,573 $106,904 1,847 $118,549 424 $54,150 0 $0 322 $111,327 113 $62,917 APPLICATIONS WITHDRAWN 39 $142,711 758 $101,564 891 $127,840 75 $89,363 0 $0 174 $101,377 7 $61,399 FILES CLOSED FOR INCOMPLETENESS 9 $149,516 185 $113,191 280 $135,689 7 $94,071 0 $0 39 $102,249 0 $0
Aggregated Statistics For Year 2005(Based on 19 full and 3 partial tracts) A) FHA, FSA/RHS & VA B) Conventional C) Refinancings D) Home Improvement Loans E) Loans on Dwellings For 5+ Families F) Non-occupant Loans on G) Loans On Manufactured Number Average Value Number Average Value Number Average Value Number Average Value Number Average Value Number Average Value Number Average Value
LOANS ORIGINATED 449 $137,671 3,625 $91,294 2,876 $106,786 270 $44,643 1 $679,000 832 $98,830 110 $38,606 APPLICATIONS APPROVED, NOT ACCEPTED 23 $149,303 515 $87,358 634 $102,518 71 $30,007 0 $0 121 $95,563 27 $41,480 APPLICATIONS DENIED 71 $135,409 1,302 $88,966 2,063 $113,833 455 $37,391 0 $0 268 $97,016 122 $47,319 APPLICATIONS WITHDRAWN 36 $136,356 1,032 $99,605 1,127 $120,391 159 $113,362 0 $0 202 $99,072 21 $40,371 FILES CLOSED FOR INCOMPLETENESS 5 $118,878 190 $86,763 538 $132,481 7 $27,523 0 $0 38 $95,846 1 $35,000
Aggregated Statistics For Year 2004(Based on 19 full and 3 partial tracts) A) FHA, FSA/RHS & VA B) Conventional C) Refinancings D) Home Improvement Loans E) Loans on Dwellings For 5+ Families F) Non-occupant Loans on G) Loans On Manufactured Number Average Value Number Average Value Number Average Value Number Average Value Number Average Value Number Average Value Number Average Value
LOANS ORIGINATED 677 $133,654 2,468 $93,272 3,126 $110,113 205 $44,820 5 $617,072 531 $99,508 61 $43,176 APPLICATIONS APPROVED, NOT ACCEPTED 36 $127,130 682 $99,906 763 $110,514 31 $42,081 0 $0 102 $113,257 43 $50,026 APPLICATIONS DENIED 118 $130,408 839 $90,608 2,175 $115,172 343 $28,603 0 $0 233 $101,433 143 $46,148 APPLICATIONS WITHDRAWN 71 $126,801 360 $94,092 1,182 $123,798 50 $49,665 0 $0 103 $112,117 11 $81,150 FILES CLOSED FOR INCOMPLETENESS 16 $131,524 72 $99,064 423 $125,994 12 $50,763 0 $0 18 $112,508 4 $115,222
Aggregated Statistics For Year 2003(Based on 19 full and 3 partial tracts) A) FHA, FSA/RHS & VA B) Conventional C) Refinancings D) Home Improvement Loans E) Loans on Dwellings For 5+ Families F) Non-occupant Loans on Number Average Value Number Average Value Number Average Value Number Average Value Number Average Value Number Average Value
LOANS ORIGINATED 1,029 $128,181 1,459 $100,226 6,674 $111,447 142 $26,984 3 $1,816,000 478 $102,314 APPLICATIONS APPROVED, NOT ACCEPTED 34 $129,890 276 $102,586 1,041 $111,267 32 $28,913 1 $674,530 98 $107,475 APPLICATIONS DENIED 130 $128,357 513 $85,434 2,140 $110,910 221 $20,165 0 $0 158 $101,780 APPLICATIONS WITHDRAWN 95 $124,906 164 $107,873 1,335 $120,111 29 $25,991 0 $0 78 $100,326 FILES CLOSED FOR INCOMPLETENESS 21 $140,695 64 $106,836 296 $118,728 3 $25,667 0 $0 27 $107,985
Aggregated Statistics For Year 2002(Based on 14 full and 1 partial tracts) A) FHA, FSA/RHS & VA B) Conventional C) Refinancings D) Home Improvement Loans E) Loans on Dwellings For 5+ Families F) Non-occupant Loans on Number Average Value Number Average Value Number Average Value Number Average Value Number Average Value Number Average Value
LOANS ORIGINATED 749 $126,773 748 $96,543 3,571 $108,925 115 $22,916 1 $144,900 273 $106,841 APPLICATIONS APPROVED, NOT ACCEPTED 30 $116,174 154 $86,424 523 $106,407 27 $27,706 0 $0 30 $92,603 APPLICATIONS DENIED 132 $124,179 383 $75,203 1,207 $101,605 112 $16,664 1 $7,315,000 69 $95,722 APPLICATIONS WITHDRAWN 63 $128,731 106 $111,648 917 $113,235 28 $27,728 0 $0 30 $101,770 FILES CLOSED FOR INCOMPLETENESS 24 $124,468 54 $108,036 213 $118,975 4 $23,365 1 $7,825,000 25 $112,092
Aggregated Statistics For Year 2001(Based on 14 full and 1 partial tracts) A) FHA, FSA/RHS & VA B) Conventional C) Refinancings D) Home Improvement Loans E) Loans on Dwellings For 5+ Families F) Non-occupant Loans on Number Average Value Number Average Value Number Average Value Number Average Value Number Average Value Number Average Value
LOANS ORIGINATED 759 $129,027 626 $98,073 3,298 $103,899 123 $20,710 2 $3,892,500 246 $107,615 APPLICATIONS APPROVED, NOT ACCEPTED 29 $122,112 167 $74,495 369 $99,210 28 $17,850 0 $0 31 $94,737 APPLICATIONS DENIED 123 $122,697 535 $64,037 1,380 $90,634 195 $17,603 0 $0 71 $108,247 APPLICATIONS WITHDRAWN 64 $124,981 104 $101,262 949 $108,770 48 $27,012 0 $0 39 $94,870 FILES CLOSED FOR INCOMPLETENESS 10 $126,856 28 $112,516 328 $108,787 8 $27,125 0 $0 14 $115,456
Aggregated Statistics For Year 2000(Based on 14 full and 1 partial tracts) A) FHA, FSA/RHS & VA B) Conventional C) Refinancings D) Home Improvement Loans E) Loans on Dwellings For 5+ Families F) Non-occupant Loans on Number Average Value Number Average Value Number Average Value Number Average Value Number Average Value Number Average Value
LOANS ORIGINATED 810 $122,020 781 $88,129 1,026 $83,291 170 $23,821 4 $2,925,500 122 $94,501 APPLICATIONS APPROVED, NOT ACCEPTED 34 $89,325 237 $66,414 233 $81,396 73 $20,945 0 $0 17 $93,426 APPLICATIONS DENIED 108 $113,817 694 $65,102 937 $76,511 220 $27,248 0 $0 82 $106,429 APPLICATIONS WITHDRAWN 63 $117,163 158 $98,011 520 $89,967 19 $42,434 1 $2,850,000 28 $113,733 FILES CLOSED FOR INCOMPLETENESS 9 $119,503 50 $99,603 314 $104,451 2 $15,000 0 $0 9 $112,667
Aggregated Statistics For Year 1999(Based on 15 full and 3 partial tracts) A) FHA, FSA/RHS & VA B) Conventional C) Refinancings D) Home Improvement Loans E) Loans on Dwellings For 5+ Families F) Non-occupant Loans on Number Average Value Number Average Value Number Average Value Number Average Value Number Average Value Number Average Value
LOANS ORIGINATED 1,122 $118,323 1,031 $92,780 2,911 $84,947 258 $24,469 2 $719,235 198 $90,004 APPLICATIONS APPROVED, NOT ACCEPTED 25 $122,490 220 $82,722 614 $87,455 90 $19,140 0 $0 22 $90,125 APPLICATIONS DENIED 104 $119,260 802 $72,501 1,602 $84,816 281 $18,177 1 $146,000 83 $103,332 APPLICATIONS WITHDRAWN 72 $120,485 264 $97,994 1,079 $94,403 72 $46,995 0 $0 62 $112,384 FILES CLOSED FOR INCOMPLETENESS 23 $125,242 66 $85,199 580 $97,405 6 $45,582 0 $0 11 $76,059
Detailed mortgage data for all 22 tracts in West Valley City, UT
Private Mortgage Insurance Companies Aggregated Statistics For Year 2009(Based on 19 full and 3 partial tracts) A) Conventional B) Refinancings C) Non-occupant Loans on Number Average Value Number Average Value Number Average Value
LOANS ORIGINATED 54 $174,564 127 $188,882 0 $0 APPLICATIONS APPROVED, NOT ACCEPTED 32 $187,718 80 $198,480 4 $168,700 APPLICATIONS DENIED 13 $194,033 29 $192,142 1 $239,830 APPLICATIONS WITHDRAWN 17 $218,845 15 $198,038 0 $0 FILES CLOSED FOR INCOMPLETENESS 7 $201,144 2 $215,400 0 $0
Aggregated Statistics For Year 2008(Based on 19 full and 3 partial tracts) A) Conventional B) Refinancings C) Non-occupant Loans on Number Average Value Number Average Value Number Average Value
LOANS ORIGINATED 371 $183,439 259 $192,060 44 $152,635 APPLICATIONS APPROVED, NOT ACCEPTED 159 $185,549 114 $198,403 13 $160,780 APPLICATIONS DENIED 41 $197,161 36 $193,963 18 $180,072 APPLICATIONS WITHDRAWN 28 $200,851 19 $183,057 5 $165,150 FILES CLOSED FOR INCOMPLETENESS 22 $165,772 8 $167,701 10 $166,745
Aggregated Statistics For Year 2007(Based on 19 full and 3 partial tracts) A) Conventional B) Refinancings C) Non-occupant Loans on D) Loans On Manufactured Number Average Value Number Average Value Number Average Value Number Average Value
LOANS ORIGINATED 900 $191,164 326 $185,828 76 $182,830 2 $111,500 APPLICATIONS APPROVED, NOT ACCEPTED 99 $190,298 51 $182,969 12 $195,200 0 $0 APPLICATIONS DENIED 27 $208,823 6 $177,627 13 $192,348 0 $0 APPLICATIONS WITHDRAWN 45 $200,960 24 $195,670 6 $202,792 0 $0 FILES CLOSED FOR INCOMPLETENESS 2 $169,180 2 $151,180 0 $0 0 $0
Aggregated Statistics For Year 2006(Based on 19 full and 3 partial tracts) A) Conventional B) Refinancings C) Non-occupant Loans on D) Loans On Manufactured Number Average Value Number Average Value Number Average Value Number Average Value
LOANS ORIGINATED 459 $159,602 200 $153,466 46 $150,371 4 $114,700 APPLICATIONS APPROVED, NOT ACCEPTED 24 $170,760 47 $148,510 2 $136,290 0 $0 APPLICATIONS DENIED 10 $176,400 4 $170,800 2 $189,000 0 $0 APPLICATIONS WITHDRAWN 20 $157,240 12 $156,642 4 $117,158 0 $0 FILES CLOSED FOR INCOMPLETENESS 2 $139,000 2 $109,485 1 $94,970 0 $0
Aggregated Statistics For Year 2005(Based on 19 full and 3 partial tracts) A) Conventional B) Refinancings C) Non-occupant Loans on D) Loans On Manufactured Number Average Value Number Average Value Number Average Value Number Average Value
LOANS ORIGINATED 312 $139,485 258 $137,288 49 $130,433 1 $99,000 APPLICATIONS APPROVED, NOT ACCEPTED 40 $140,853 53 $142,079 9 $138,184 0 $0 APPLICATIONS DENIED 5 $135,172 4 $186,150 4 $125,850 0 $0 APPLICATIONS WITHDRAWN 20 $133,842 18 $136,232 3 $129,663 1 $99,000 FILES CLOSED FOR INCOMPLETENESS 2 $196,700 2 $135,000 0 $0 0 $0
Aggregated Statistics For Year 2004(Based on 19 full and 3 partial tracts) A) Conventional B) Refinancings C) Non-occupant Loans on D) Loans On Manufactured Number Average Value Number Average Value Number Average Value Number Average Value
LOANS ORIGINATED 314 $130,039 357 $131,502 70 $115,843 2 $124,000 APPLICATIONS APPROVED, NOT ACCEPTED 67 $132,740 90 $137,920 34 $132,016 1 $110,000 APPLICATIONS DENIED 6 $187,150 9 $128,522 6 $167,150 0 $0 APPLICATIONS WITHDRAWN 45 $126,716 52 $143,182 13 $108,320 1 $183,000 FILES CLOSED FOR INCOMPLETENESS 7 $131,349 2 $141,200 2 $127,160 0 $0
Aggregated Statistics For Year 2003(Based on 19 full and 3 partial tracts) A) Conventional B) Refinancings C) Non-occupant Loans on Number Average Value Number Average Value Number Average Value
LOANS ORIGINATED 373 $127,850 869 $132,195 95 $111,474 APPLICATIONS APPROVED, NOT ACCEPTED 43 $127,889 203 $134,948 8 $103,625 APPLICATIONS DENIED 11 $132,182 29 $132,936 6 $112,150 APPLICATIONS WITHDRAWN 27 $140,516 62 $133,467 11 $108,462 FILES CLOSED FOR INCOMPLETENESS 3 $110,607 1 $166,600 0 $0
Aggregated Statistics For Year 2002(Based on 14 full and 1 partial tracts) A) Conventional B) Refinancings C) Non-occupant Loans on Number Average Value Number Average Value Number Average Value
LOANS ORIGINATED 230 $126,070 502 $131,405 41 $108,715 APPLICATIONS APPROVED, NOT ACCEPTED 37 $141,707 123 $131,545 13 $114,352 APPLICATIONS DENIED 15 $130,377 24 $138,905 4 $120,710 APPLICATIONS WITHDRAWN 13 $133,649 29 $126,138 4 $98,250 FILES CLOSED FOR INCOMPLETENESS 1 $125,000 5 $124,382 3 $122,667
Aggregated Statistics For Year 2001(Based on 14 full and 1 partial tracts) A) Conventional B) Refinancings C) Non-occupant Loans on Number Average Value Number Average Value Number Average Value
LOANS ORIGINATED 206 $132,595 453 $127,770 44 $126,532 APPLICATIONS APPROVED, NOT ACCEPTED 45 $128,971 99 $129,768 15 $119,362 APPLICATIONS DENIED 15 $129,160 34 $132,759 7 $145,711 APPLICATIONS WITHDRAWN 5 $150,000 14 $117,699 5 $137,400 FILES CLOSED FOR INCOMPLETENESS 2 $109,970 6 $106,528 0 $0
Aggregated Statistics For Year 2000(Based on 14 full and 1 partial tracts) A) Conventional B) Refinancings C) Non-occupant Loans on Number Average Value Number Average Value Number Average Value
LOANS ORIGINATED 227 $125,223 156 $115,626 26 $112,792 APPLICATIONS APPROVED, NOT ACCEPTED 32 $135,297 30 $124,334 7 $145,429 APPLICATIONS DENIED 23 $150,505 20 $126,147 10 $181,900 APPLICATIONS WITHDRAWN 10 $128,787 10 $115,100 2 $126,500 FILES CLOSED FOR INCOMPLETENESS 0 $0 0 $0 0 $0
Aggregated Statistics For Year 1999(Based on 15 full and 3 partial tracts) A) Conventional B) Refinancings C) Non-occupant Loans on Number Average Value Number Average Value Number Average Value
LOANS ORIGINATED 378 $120,834 459 $116,723 35 $101,309 APPLICATIONS APPROVED, NOT ACCEPTED 21 $123,533 95 $116,087 3 $78,920 APPLICATIONS DENIED 34 $121,766 52 $118,374 3 $142,653 APPLICATIONS WITHDRAWN 7 $115,343 21 $120,351 1 $87,000 FILES CLOSED FOR INCOMPLETENESS 4 $120,335 17 $120,641 1 $130,860
Fire-safe hotels and motels in West Valley City, Utah:
Extended Stay America - Salt Lake City - West Valley Center, 2310 W City Center Ct, West Valley City, Utah 84119 Phone: (801) 886-2400, Fax: (801) 886-9400
Comfort Inn, 2229 W City Ctr Ct, West Valley City, Utah 84119 Phone: (801) 886-1300, Fax: (801) 886-1301
Country Inn & Suites By Carlosn, 3422 So Decker Lake Dr, West Valley City, Utah 84119 Phone: (801) 908-0311, Fax: (801) 908-0315
Home2 Suites By Hilton, 4028 Parkway Blvd, West Valley City, Utah 84120 Phone: (801) 679-8222, Fax: (801) 679-8220
TownPlace Suites by Marriott, 5473 W High Market, West valley city, Utah 84120 Phone: (801) 307-3300, Fax: (801) 307-3300
West Valley City My Place Hotel, 3074 S Decker Dr, West valley city, Utah 84119 Phone: (800) 200-5685
Best Western West Valley Inn, 3540 S 2200 W, West valley city, Utah 84119 Phone: (801) 954-9292, Fax: (801) 954-8242
All 7 fire-safe hotels and motels in West Valley City, Utah West Valley City compared to Utah state average:
Unemployed percentage significantly below state average. Black race population percentage significantly above state average. Hispanic race population percentage significantly above state average. Foreign-born population percentage significantly above state average. West Valley City on our top lists :
#3 on the list of "Top 101 cities with the smallest percentage of elementary and middle school students in private schools (5,000+ students)"
#10 on the list of "Top 101 cities with largest percentage of males in occupations: construction and extraction occupations (population 50,000+)"
#11 on the list of "Top 101 cities with largest percentage of females in occupations: office and administrative support occupations (population 50,000+)"
#11 on the list of "Top 101 cities with the least people having professional degrees (population 50,000+)"
#12 on the list of "Top 101 cities with largest percentage of males in industries: construction (population 50,000+)"
#16 on the list of "Top 101 cities with the most cars per house, population 50,000+"
#18 on the list of "Top 101 cities with largest percentage of females in industries: administrative and support and waste management services (population 50,000+)"
#26 on the list of "Top 101 cities with the highest percentage of family households, population 100,000+"
#28 on the list of "Top 101 cities with the least people having Doctorate degrees (population 50,000+)"
#30 on the list of "Top 101 cities with the smallest household incomes disparities (population 50,000+)"
#33 on the list of "Top 101 cities with the least people having Master's or Doctorate degrees (population 50,000+)"
#40 on the list of "Top 101 cities with the smallest house values disparities (population 50,000+)"
#42 on the list of "Top 100 low-educated but high-earning cities (pop. 50,000+)"
#42 on the list of "Top 101 cities with largest percentage of females in occupations: production occupations (population 50,000+)"
#44 on the list of "Top 101 cities with the lowest cost per building permit (population 50,000+)"
#45 on the list of "Top 100 cities with youngest residents (pop. 50,000+)"
#47 on the list of "Top 100 highest located cities (pop. 50,000+)"
#50 on the list of "Top 101 cities with the smallest percentage of high school students in private schools (3,000+ students)"
#53 on the list of "Top 101 cities with the lowest minimum monthly morning or afternoon humidity (population 50,000+)"
#55 on the list of "Top 101 cities with the smallest percentages of current college students (population 100,000+)"
#48 (84120) on the list of "Top 101 zip codes with the largest percentage of Danish first ancestries (pop 5,000+)"
#99 (84120) on the list of "Top 101 zip codes with the largest percentage of English first ancestries (pop 5,000+)"
#1 on the list of "Top 101 counties with the most Other adherents"
#1 on the list of "Top 101 counties with the most Other congregations"
#4 on the list of "Top 101 counties with the lowest percentage of residents that smoked 100+ cigarettes in their lives"
#11 on the list of "Top 101 counties with the highest Nitrogen Dioxide air pollution readings in 2012 (ppm)"
#14 on the list of "Top 101 counties with the highest number of births per 1000 residents 2007-2013"
Top Patent Applicants
Bill Inskeep (17)
Troy Leavitt (10)
Mukund Karanjikar (10)
Jim Matthews Bagley (10)
Gary W. Schroeder (5)
Ross M. Hinschberger (5)
Brian Parker (5)
Pallavi Chitta (5)
Carol Breinholt (5)
Giorgio Di Palma (4)
Total of 207 patent applications in 2008-2024.
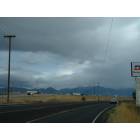
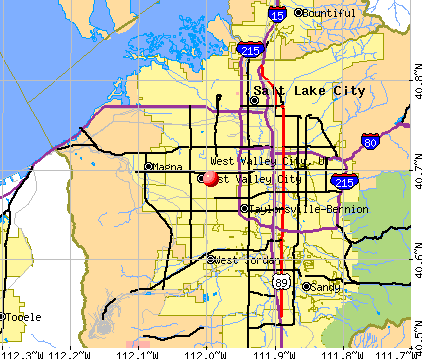


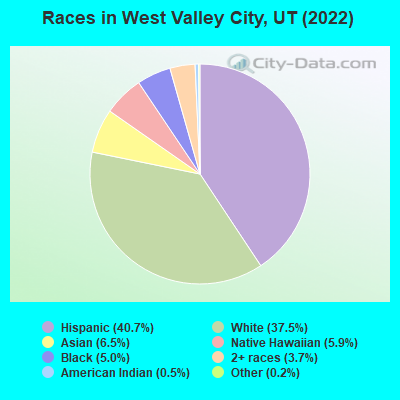
 Recent articles from our blog. Our writers, many of them Ph.D. graduates or candidates, create easy-to-read articles on a wide variety of topics.

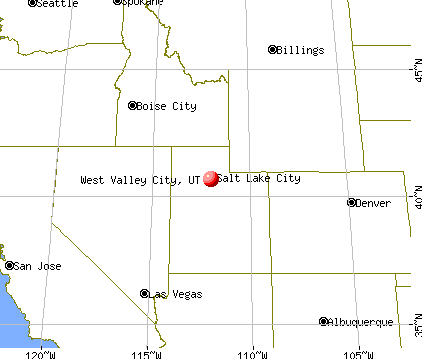
 (356.7 miles
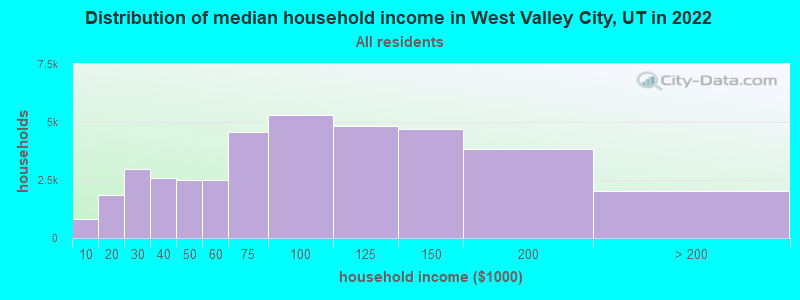
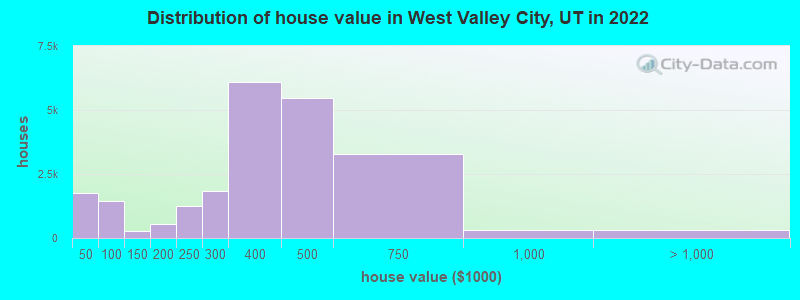
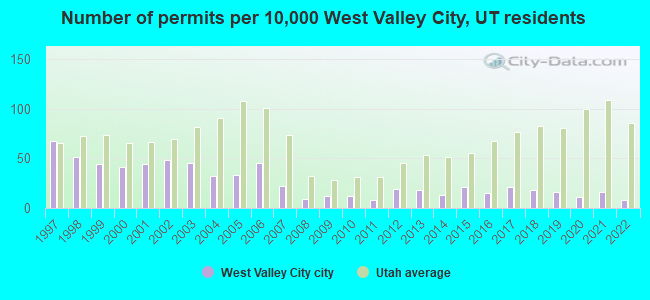
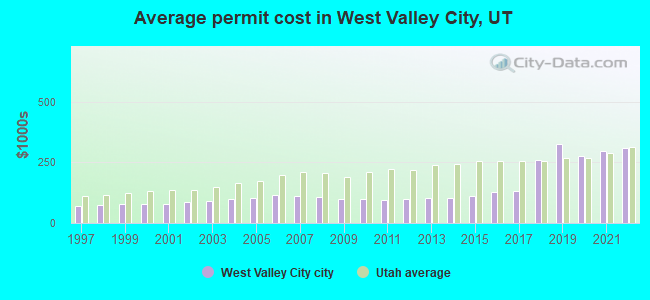
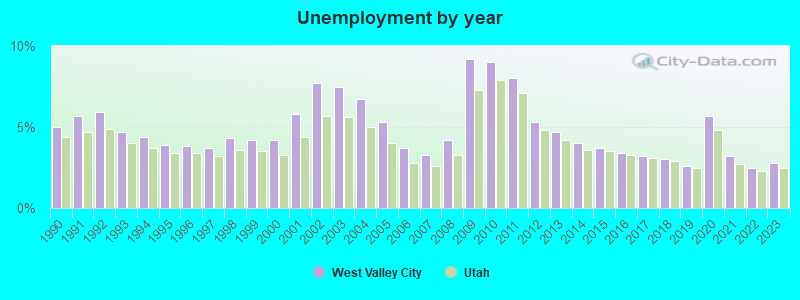
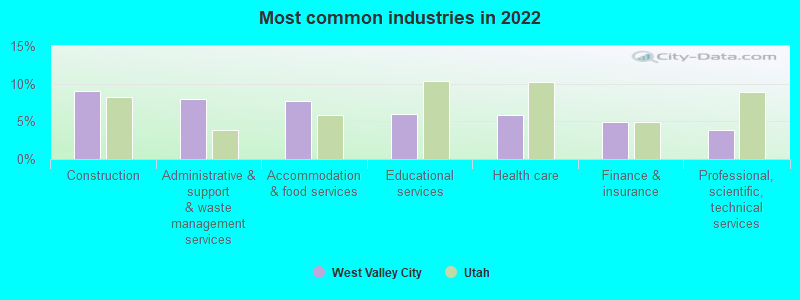
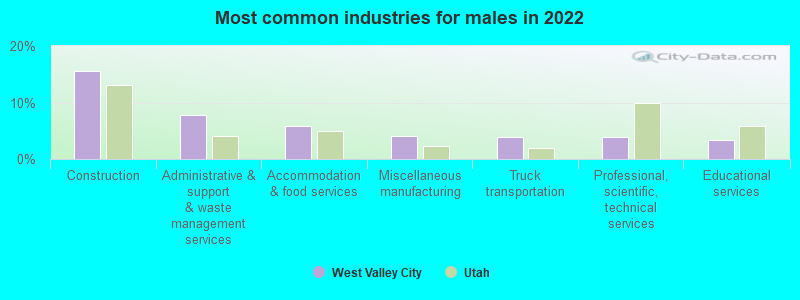
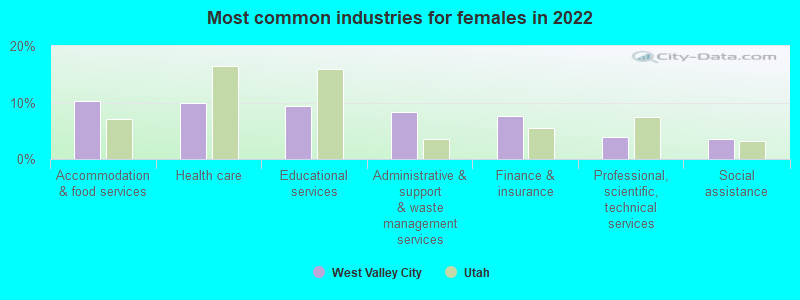
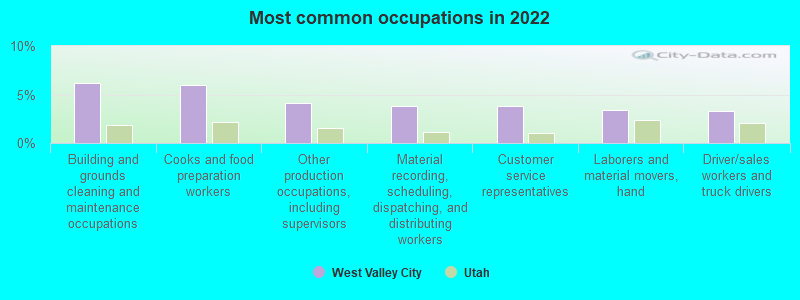
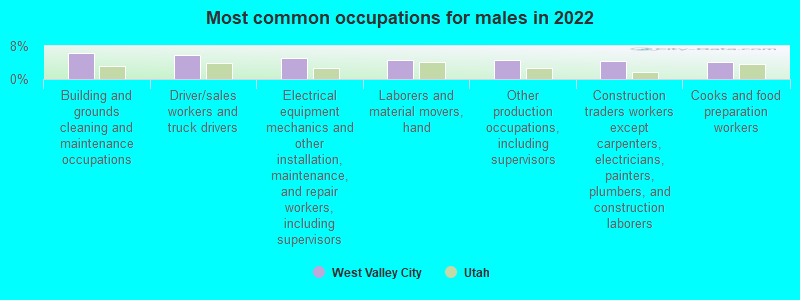
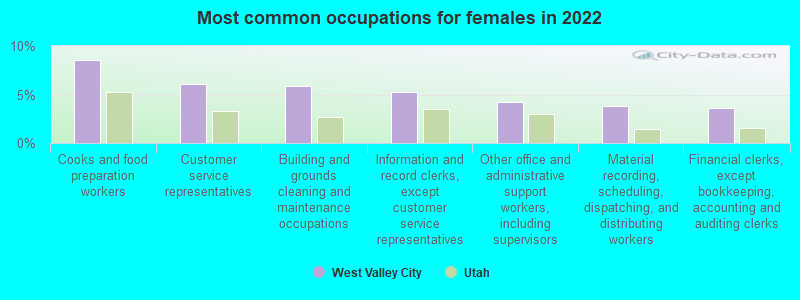


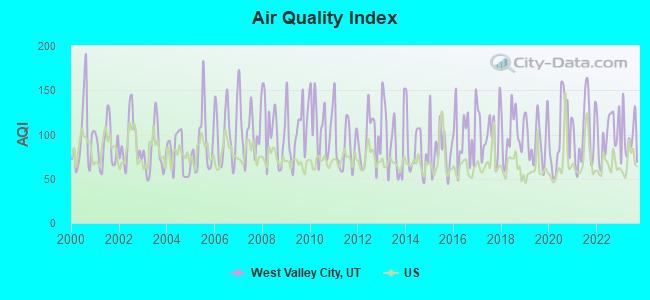
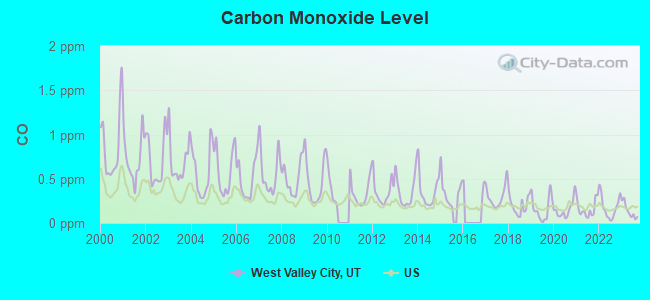
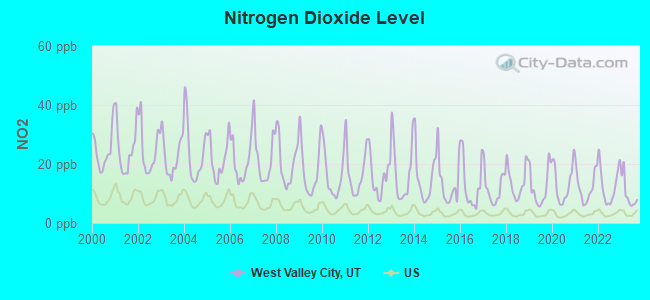
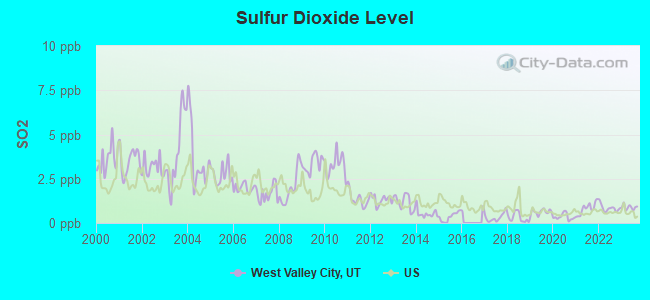
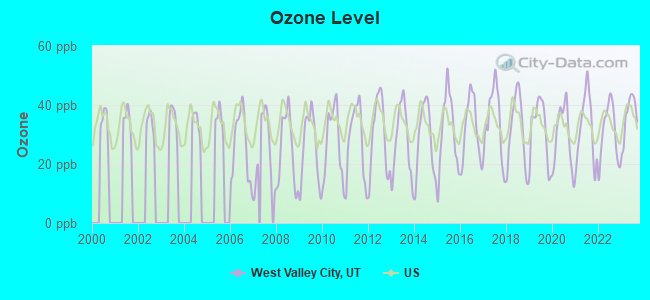
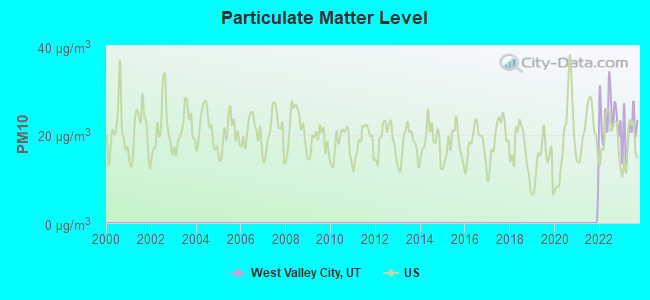
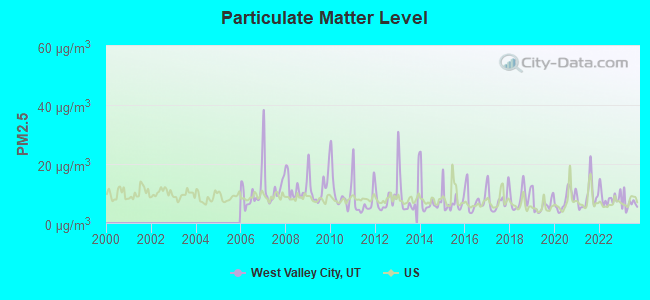
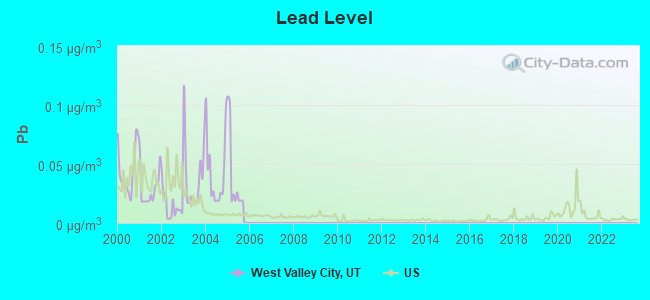

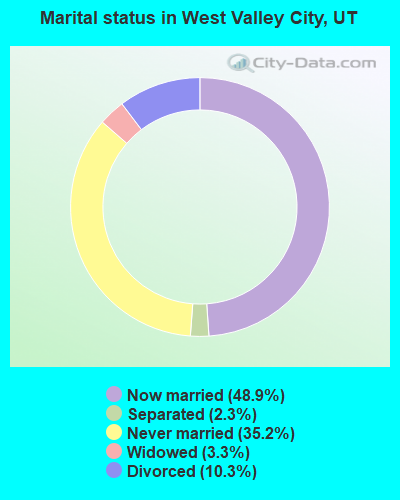
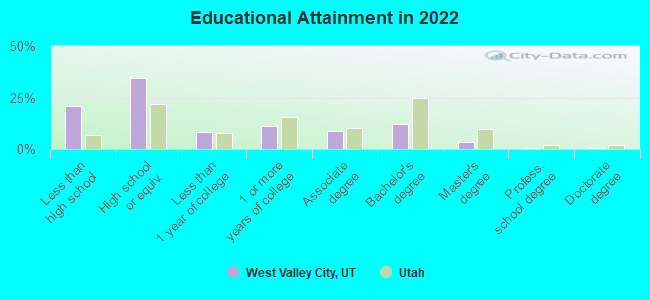
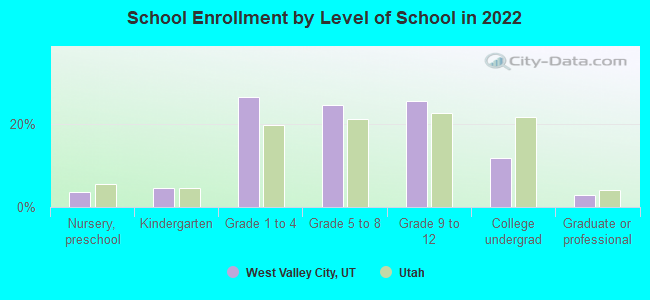
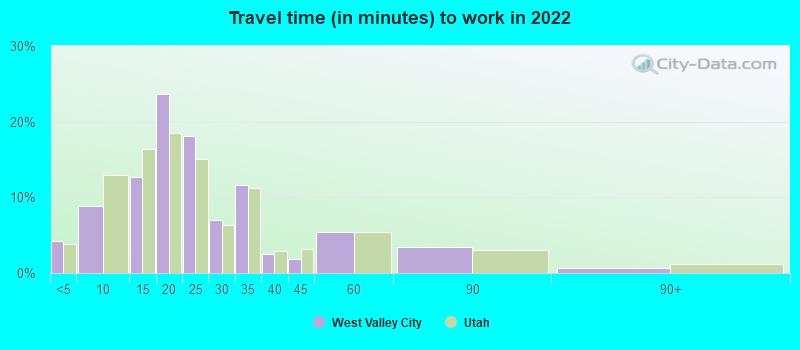
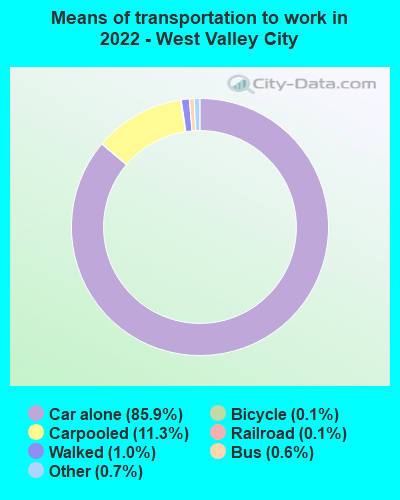
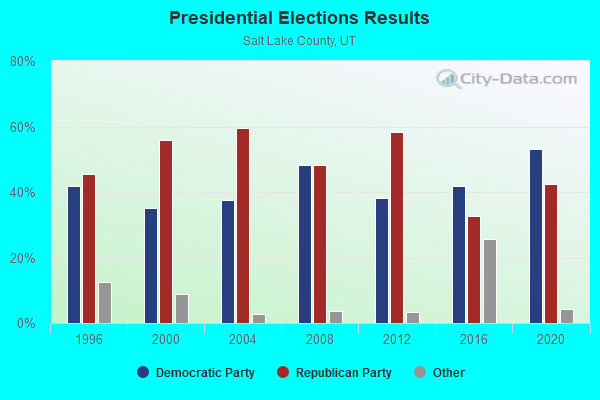
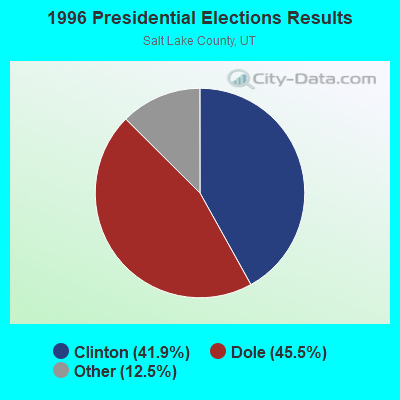
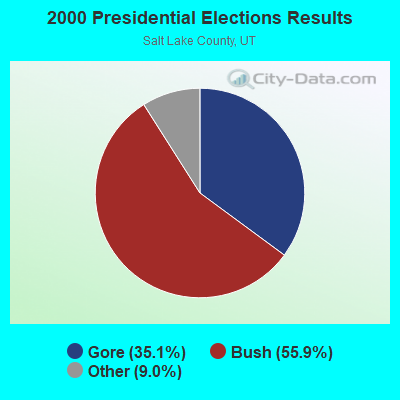
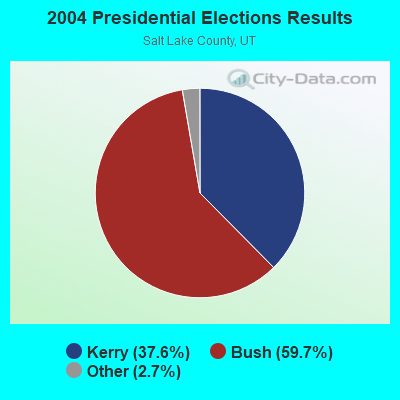
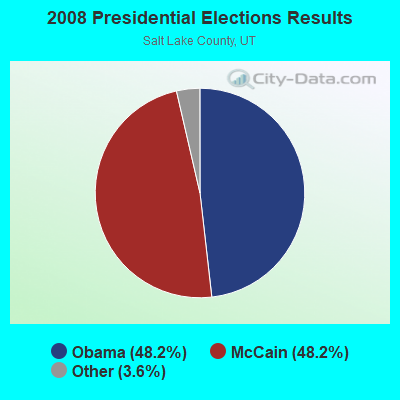

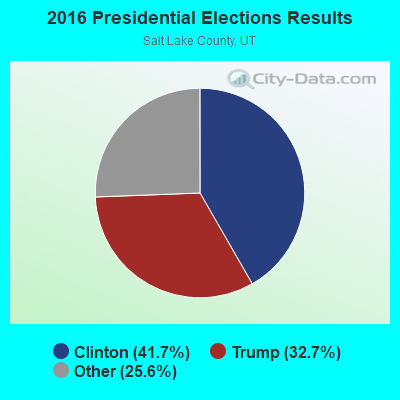
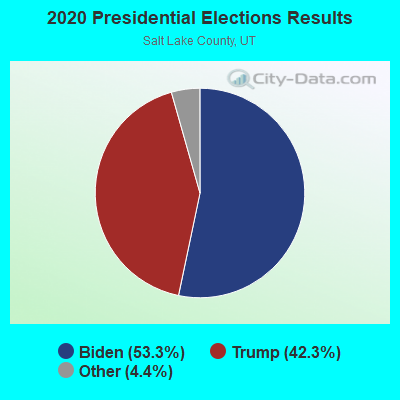
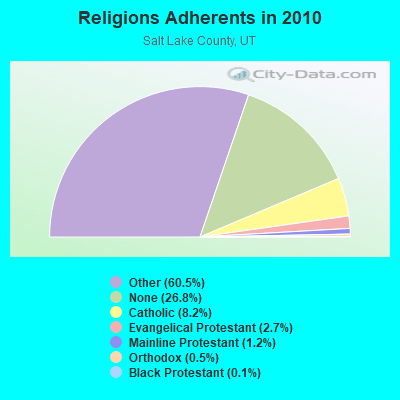
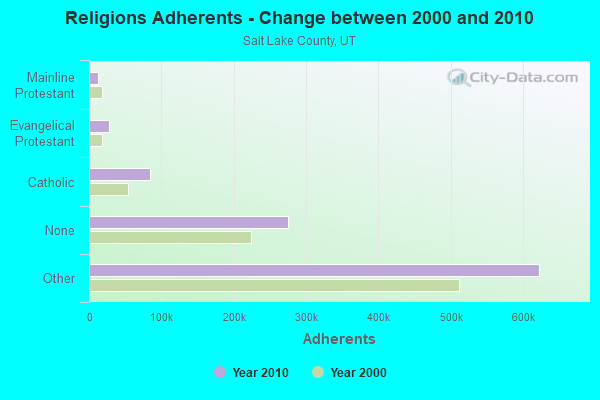
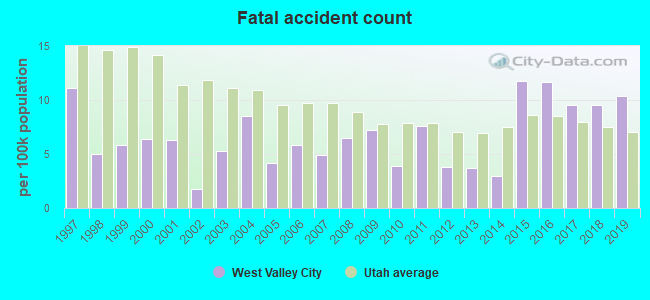
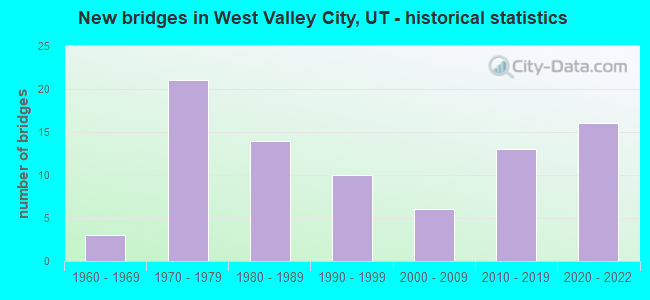
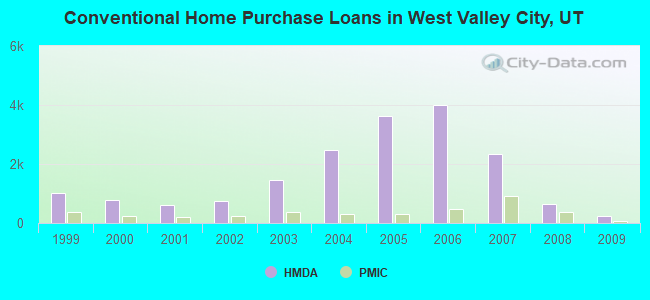
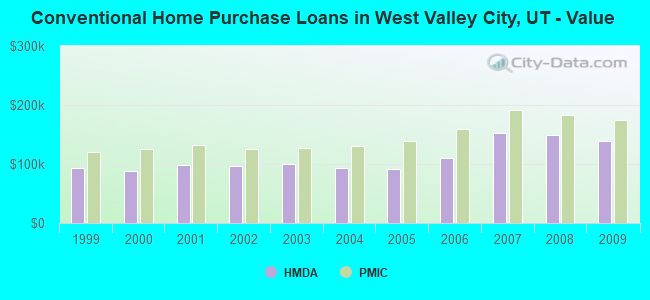
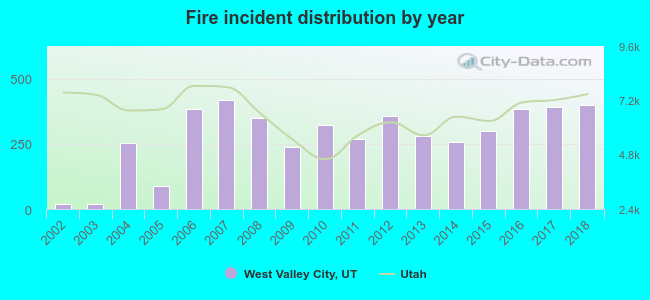 Based on the data from the years 2002 - 2018 the average number of fire incidents per year is 277. The highest number of fires - 417 took place in 2007, and the least - 18 in 2002. The data has an increasing trend.
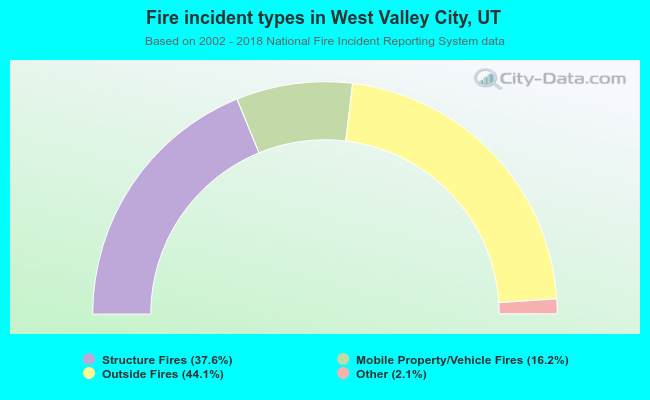 When looking into fire subcategories, the most incidents belonged to: Outside Fires (44.1%), and Structure Fires (37.6%).