West Memphis, Arkansas Submit your own pictures of this city and show them to the world
OSM Map
General Map
Google Map
MSN Map
OSM Map
General Map
Google Map
MSN Map
OSM Map
General Map
Google Map
MSN Map
OSM Map
General Map
Google Map
MSN Map
Please wait while loading the map...
Population in 2022: 23,795 (100% urban, 0% rural). Population change since 2000: -14.0%Males: 10,588 Females: 13,207
March 2022 cost of living index in West Memphis: 84.6 (less than average, U.S. average is 100) Percentage of residents living in poverty in 2022: 24.7%for White Non-Hispanic residents , 32.1% for Black residents , 26.6% for Hispanic or Latino residents , 14.7% for two or more races residents )
Profiles of local businesses
Business Search - 14 Million verified businesses
Data:
Median household income ($)
Median household income (% change since 2000)
Household income diversity
Ratio of average income to average house value (%)
Ratio of average income to average rent
Median household income ($) - White
Median household income ($) - Black or African American
Median household income ($) - Asian
Median household income ($) - Hispanic or Latino
Median household income ($) - American Indian and Alaska Native
Median household income ($) - Multirace
Median household income ($) - Other Race
Median household income for houses/condos with a mortgage ($)
Median household income for apartments without a mortgage ($)
Races - White alone (%)
Races - White alone (% change since 2000)
Races - Black alone (%)
Races - Black alone (% change since 2000)
Races - American Indian alone (%)
Races - American Indian alone (% change since 2000)
Races - Asian alone (%)
Races - Asian alone (% change since 2000)
Races - Hispanic (%)
Races - Hispanic (% change since 2000)
Races - Native Hawaiian and Other Pacific Islander alone (%)
Races - Native Hawaiian and Other Pacific Islander alone (% change since 2000)
Races - Two or more races (%)
Races - Two or more races (% change since 2000)
Races - Other race alone (%)
Races - Other race alone (% change since 2000)
Racial diversity
Unemployment (%)
Unemployment (% change since 2000)
Unemployment (%) - White
Unemployment (%) - Black or African American
Unemployment (%) - Asian
Unemployment (%) - Hispanic or Latino
Unemployment (%) - American Indian and Alaska Native
Unemployment (%) - Multirace
Unemployment (%) - Other Race
Population density (people per square mile)
Population - Males (%)
Population - Females (%)
Population - Males (%) - White
Population - Males (%) - Black or African American
Population - Males (%) - Asian
Population - Males (%) - Hispanic or Latino
Population - Males (%) - American Indian and Alaska Native
Population - Males (%) - Multirace
Population - Males (%) - Other Race
Population - Females (%) - White
Population - Females (%) - Black or African American
Population - Females (%) - Asian
Population - Females (%) - Hispanic or Latino
Population - Females (%) - American Indian and Alaska Native
Population - Females (%) - Multirace
Population - Females (%) - Other Race
Coronavirus confirmed cases (May 23, 2024)
Deaths caused by coronavirus (May 23, 2024)
Coronavirus confirmed cases (per 100k population) (May 23, 2024)
Deaths caused by coronavirus (per 100k population) (May 23, 2024)
Daily increase in number of cases (May 23, 2024)
Weekly increase in number of cases (May 23, 2024)
Cases doubled (in days) (May 23, 2024)
Hospitalized patients (Apr 18, 2022)
Negative test results (Apr 18, 2022)
Total test results (Apr 18, 2022)
COVID Vaccine doses distributed (per 100k population) (Sep 19, 2023)
COVID Vaccine doses administered (per 100k population) (Sep 19, 2023)
COVID Vaccine doses distributed (Sep 19, 2023)
COVID Vaccine doses administered (Sep 19, 2023)
Likely homosexual households (%)
Likely homosexual households (% change since 2000)
Likely homosexual households - Lesbian couples (%)
Likely homosexual households - Lesbian couples (% change since 2000)
Likely homosexual households - Gay men (%)
Likely homosexual households - Gay men (% change since 2000)
Cost of living index
Median gross rent ($)
Median contract rent ($)
Median monthly housing costs ($)
Median house or condo value ($)
Median house or condo value ($ change since 2000)
Mean house or condo value by units in structure - 1, detached ($)
Mean house or condo value by units in structure - 1, attached ($)
Mean house or condo value by units in structure - 2 ($)
Mean house or condo value by units in structure by units in structure - 3 or 4 ($)
Mean house or condo value by units in structure - 5 or more ($)
Mean house or condo value by units in structure - Boat, RV, van, etc. ($)
Mean house or condo value by units in structure - Mobile home ($)
Median house or condo value ($) - White
Median house or condo value ($) - Black or African American
Median house or condo value ($) - Asian
Median house or condo value ($) - Hispanic or Latino
Median house or condo value ($) - American Indian and Alaska Native
Median house or condo value ($) - Multirace
Median house or condo value ($) - Other Race
Median resident age
Resident age diversity
Median resident age - Males
Median resident age - Females
Median resident age - White
Median resident age - Black or African American
Median resident age - Asian
Median resident age - Hispanic or Latino
Median resident age - American Indian and Alaska Native
Median resident age - Multirace
Median resident age - Other Race
Median resident age - Males - White
Median resident age - Males - Black or African American
Median resident age - Males - Asian
Median resident age - Males - Hispanic or Latino
Median resident age - Males - American Indian and Alaska Native
Median resident age - Males - Multirace
Median resident age - Males - Other Race
Median resident age - Females - White
Median resident age - Females - Black or African American
Median resident age - Females - Asian
Median resident age - Females - Hispanic or Latino
Median resident age - Females - American Indian and Alaska Native
Median resident age - Females - Multirace
Median resident age - Females - Other Race
Commute - mean travel time to work (minutes)
Travel time to work - Less than 5 minutes (%)
Travel time to work - Less than 5 minutes (% change since 2000)
Travel time to work - 5 to 9 minutes (%)
Travel time to work - 5 to 9 minutes (% change since 2000)
Travel time to work - 10 to 19 minutes (%)
Travel time to work - 10 to 19 minutes (% change since 2000)
Travel time to work - 20 to 29 minutes (%)
Travel time to work - 20 to 29 minutes (% change since 2000)
Travel time to work - 30 to 39 minutes (%)
Travel time to work - 30 to 39 minutes (% change since 2000)
Travel time to work - 40 to 59 minutes (%)
Travel time to work - 40 to 59 minutes (% change since 2000)
Travel time to work - 60 to 89 minutes (%)
Travel time to work - 60 to 89 minutes (% change since 2000)
Travel time to work - 90 or more minutes (%)
Travel time to work - 90 or more minutes (% change since 2000)
Marital status - Never married (%)
Marital status - Now married (%)
Marital status - Separated (%)
Marital status - Widowed (%)
Marital status - Divorced (%)
Median family income ($)
Median family income (% change since 2000)
Median non-family income ($)
Median non-family income (% change since 2000)
Median per capita income ($)
Median per capita income (% change since 2000)
Median family income ($) - White
Median family income ($) - Black or African American
Median family income ($) - Asian
Median family income ($) - Hispanic or Latino
Median family income ($) - American Indian and Alaska Native
Median family income ($) - Multirace
Median family income ($) - Other Race
Median year house/condo built
Median year apartment built
Year house built - Built 2005 or later (%)
Year house built - Built 2000 to 2004 (%)
Year house built - Built 1990 to 1999 (%)
Year house built - Built 1980 to 1989 (%)
Year house built - Built 1970 to 1979 (%)
Year house built - Built 1960 to 1969 (%)
Year house built - Built 1950 to 1959 (%)
Year house built - Built 1940 to 1949 (%)
Year house built - Built 1939 or earlier (%)
Average household size
Household density (households per square mile)
Average household size - White
Average household size - Black or African American
Average household size - Asian
Average household size - Hispanic or Latino
Average household size - American Indian and Alaska Native
Average household size - Multirace
Average household size - Other Race
Occupied housing units (%)
Vacant housing units (%)
Owner occupied housing units (%)
Renter occupied housing units (%)
Vacancy status - For rent (%)
Vacancy status - For sale only (%)
Vacancy status - Rented or sold, not occupied (%)
Vacancy status - For seasonal, recreational, or occasional use (%)
Vacancy status - For migrant workers (%)
Vacancy status - Other vacant (%)
Residents with income below the poverty level (%)
Residents with income below 50% of the poverty level (%)
Children below poverty level (%)
Poor families by family type - Married-couple family (%)
Poor families by family type - Male, no wife present (%)
Poor families by family type - Female, no husband present (%)
Poverty status for native-born residents (%)
Poverty status for foreign-born residents (%)
Poverty among high school graduates not in families (%)
Poverty among people who did not graduate high school not in families (%)
Residents with income below the poverty level (%) - White
Residents with income below the poverty level (%) - Black or African American
Residents with income below the poverty level (%) - Asian
Residents with income below the poverty level (%) - Hispanic or Latino
Residents with income below the poverty level (%) - American Indian and Alaska Native
Residents with income below the poverty level (%) - Multirace
Residents with income below the poverty level (%) - Other Race
Air pollution - Air Quality Index (AQI)
Air pollution - CO
Air pollution - NO2
Air pollution - SO2
Air pollution - Ozone
Air pollution - PM10
Air pollution - PM25
Air pollution - Pb
Crime - Murders per 100,000 population
Crime - Rapes per 100,000 population
Crime - Robberies per 100,000 population
Crime - Assaults per 100,000 population
Crime - Burglaries per 100,000 population
Crime - Thefts per 100,000 population
Crime - Auto thefts per 100,000 population
Crime - Arson per 100,000 population
Crime - City-data.com crime index
Crime - Violent crime index
Crime - Property crime index
Crime - Murders per 100,000 population (5 year average)
Crime - Rapes per 100,000 population (5 year average)
Crime - Robberies per 100,000 population (5 year average)
Crime - Assaults per 100,000 population (5 year average)
Crime - Burglaries per 100,000 population (5 year average)
Crime - Thefts per 100,000 population (5 year average)
Crime - Auto thefts per 100,000 population (5 year average)
Crime - Arson per 100,000 population (5 year average)
Crime - City-data.com crime index (5 year average)
Crime - Violent crime index (5 year average)
Crime - Property crime index (5 year average)
1996 Presidential Elections Results (%) - Democratic Party (Clinton)
1996 Presidential Elections Results (%) - Republican Party (Dole)
1996 Presidential Elections Results (%) - Other
2000 Presidential Elections Results (%) - Democratic Party (Gore)
2000 Presidential Elections Results (%) - Republican Party (Bush)
2000 Presidential Elections Results (%) - Other
2004 Presidential Elections Results (%) - Democratic Party (Kerry)
2004 Presidential Elections Results (%) - Republican Party (Bush)
2004 Presidential Elections Results (%) - Other
2008 Presidential Elections Results (%) - Democratic Party (Obama)
2008 Presidential Elections Results (%) - Republican Party (McCain)
2008 Presidential Elections Results (%) - Other
2012 Presidential Elections Results (%) - Democratic Party (Obama)
2012 Presidential Elections Results (%) - Republican Party (Romney)
2012 Presidential Elections Results (%) - Other
2016 Presidential Elections Results (%) - Democratic Party (Clinton)
2016 Presidential Elections Results (%) - Republican Party (Trump)
2016 Presidential Elections Results (%) - Other
2020 Presidential Elections Results (%) - Democratic Party (Biden)
2020 Presidential Elections Results (%) - Republican Party (Trump)
2020 Presidential Elections Results (%) - Other
Ancestries Reported - Arab (%)
Ancestries Reported - Czech (%)
Ancestries Reported - Danish (%)
Ancestries Reported - Dutch (%)
Ancestries Reported - English (%)
Ancestries Reported - French (%)
Ancestries Reported - French Canadian (%)
Ancestries Reported - German (%)
Ancestries Reported - Greek (%)
Ancestries Reported - Hungarian (%)
Ancestries Reported - Irish (%)
Ancestries Reported - Italian (%)
Ancestries Reported - Lithuanian (%)
Ancestries Reported - Norwegian (%)
Ancestries Reported - Polish (%)
Ancestries Reported - Portuguese (%)
Ancestries Reported - Russian (%)
Ancestries Reported - Scotch-Irish (%)
Ancestries Reported - Scottish (%)
Ancestries Reported - Slovak (%)
Ancestries Reported - Subsaharan African (%)
Ancestries Reported - Swedish (%)
Ancestries Reported - Swiss (%)
Ancestries Reported - Ukrainian (%)
Ancestries Reported - United States (%)
Ancestries Reported - Welsh (%)
Ancestries Reported - West Indian (%)
Ancestries Reported - Other (%)
Educational Attainment - No schooling completed (%)
Educational Attainment - Less than high school (%)
Educational Attainment - High school or equivalent (%)
Educational Attainment - Less than 1 year of college (%)
Educational Attainment - 1 or more years of college (%)
Educational Attainment - Associate degree (%)
Educational Attainment - Bachelor's degree (%)
Educational Attainment - Master's degree (%)
Educational Attainment - Professional school degree (%)
Educational Attainment - Doctorate degree (%)
School Enrollment - Nursery, preschool (%)
School Enrollment - Kindergarten (%)
School Enrollment - Grade 1 to 4 (%)
School Enrollment - Grade 5 to 8 (%)
School Enrollment - Grade 9 to 12 (%)
School Enrollment - College undergrad (%)
School Enrollment - Graduate or professional (%)
School Enrollment - Not enrolled in school (%)
School enrollment - Public schools (%)
School enrollment - Private schools (%)
School enrollment - Not enrolled (%)
Median number of rooms in houses and condos
Median number of rooms in apartments
Housing units lacking complete plumbing facilities (%)
Housing units lacking complete kitchen facilities (%)
Density of houses
Urban houses (%)
Rural houses (%)
Households with people 60 years and over (%)
Households with people 65 years and over (%)
Households with people 75 years and over (%)
Households with one or more nonrelatives (%)
Households with no nonrelatives (%)
Population in households (%)
Family households (%)
Nonfamily households (%)
Population in families (%)
Family households with own children (%)
Median number of bedrooms in owner occupied houses
Mean number of bedrooms in owner occupied houses
Median number of bedrooms in renter occupied houses
Mean number of bedrooms in renter occupied houses
Median number of vehichles in owner occupied houses
Mean number of vehichles in owner occupied houses
Median number of vehichles in renter occupied houses
Mean number of vehichles in renter occupied houses
Mortgage status - with mortgage (%)
Mortgage status - with second mortgage (%)
Mortgage status - with home equity loan (%)
Mortgage status - with both second mortgage and home equity loan (%)
Mortgage status - without a mortgage (%)
Average family size
Average family size - White
Average family size - Black or African American
Average family size - Asian
Average family size - Hispanic or Latino
Average family size - American Indian and Alaska Native
Average family size - Multirace
Average family size - Other Race
Geographical mobility - Same house 1 year ago (%)
Geographical mobility - Moved within same county (%)
Geographical mobility - Moved from different county within same state (%)
Geographical mobility - Moved from different state (%)
Geographical mobility - Moved from abroad (%)
Place of birth - Born in state of residence (%)
Place of birth - Born in other state (%)
Place of birth - Native, outside of US (%)
Place of birth - Foreign born (%)
Housing units in structures - 1, detached (%)
Housing units in structures - 1, attached (%)
Housing units in structures - 2 (%)
Housing units in structures - 3 or 4 (%)
Housing units in structures - 5 to 9 (%)
Housing units in structures - 10 to 19 (%)
Housing units in structures - 20 to 49 (%)
Housing units in structures - 50 or more (%)
Housing units in structures - Mobile home (%)
Housing units in structures - Boat, RV, van, etc. (%)
House/condo owner moved in on average (years ago)
Renter moved in on average (years ago)
Year householder moved into unit - Moved in 1999 to March 2000 (%)
Year householder moved into unit - Moved in 1995 to 1998 (%)
Year householder moved into unit - Moved in 1990 to 1994 (%)
Year householder moved into unit - Moved in 1980 to 1989 (%)
Year householder moved into unit - Moved in 1970 to 1979 (%)
Year householder moved into unit - Moved in 1969 or earlier (%)
Means of transportation to work - Drove car alone (%)
Means of transportation to work - Carpooled (%)
Means of transportation to work - Public transportation (%)
Means of transportation to work - Bus or trolley bus (%)
Means of transportation to work - Streetcar or trolley car (%)
Means of transportation to work - Subway or elevated (%)
Means of transportation to work - Railroad (%)
Means of transportation to work - Ferryboat (%)
Means of transportation to work - Taxicab (%)
Means of transportation to work - Motorcycle (%)
Means of transportation to work - Bicycle (%)
Means of transportation to work - Walked (%)
Means of transportation to work - Other means (%)
Working at home (%)
Industry diversity
Most Common Industries - Agriculture, forestry, fishing and hunting, and mining (%)
Most Common Industries - Agriculture, forestry, fishing and hunting (%)
Most Common Industries - Mining, quarrying, and oil and gas extraction (%)
Most Common Industries - Construction (%)
Most Common Industries - Manufacturing (%)
Most Common Industries - Wholesale trade (%)
Most Common Industries - Retail trade (%)
Most Common Industries - Transportation and warehousing, and utilities (%)
Most Common Industries - Transportation and warehousing (%)
Most Common Industries - Utilities (%)
Most Common Industries - Information (%)
Most Common Industries - Finance and insurance, and real estate and rental and leasing (%)
Most Common Industries - Finance and insurance (%)
Most Common Industries - Real estate and rental and leasing (%)
Most Common Industries - Professional, scientific, and management, and administrative and waste management services (%)
Most Common Industries - Professional, scientific, and technical services (%)
Most Common Industries - Management of companies and enterprises (%)
Most Common Industries - Administrative and support and waste management services (%)
Most Common Industries - Educational services, and health care and social assistance (%)
Most Common Industries - Educational services (%)
Most Common Industries - Health care and social assistance (%)
Most Common Industries - Arts, entertainment, and recreation, and accommodation and food services (%)
Most Common Industries - Arts, entertainment, and recreation (%)
Most Common Industries - Accommodation and food services (%)
Most Common Industries - Other services, except public administration (%)
Most Common Industries - Public administration (%)
Occupation diversity
Most Common Occupations - Management, business, science, and arts occupations (%)
Most Common Occupations - Management, business, and financial occupations (%)
Most Common Occupations - Management occupations (%)
Most Common Occupations - Business and financial operations occupations (%)
Most Common Occupations - Computer, engineering, and science occupations (%)
Most Common Occupations - Computer and mathematical occupations (%)
Most Common Occupations - Architecture and engineering occupations (%)
Most Common Occupations - Life, physical, and social science occupations (%)
Most Common Occupations - Education, legal, community service, arts, and media occupations (%)
Most Common Occupations - Community and social service occupations (%)
Most Common Occupations - Legal occupations (%)
Most Common Occupations - Education, training, and library occupations (%)
Most Common Occupations - Arts, design, entertainment, sports, and media occupations (%)
Most Common Occupations - Healthcare practitioners and technical occupations (%)
Most Common Occupations - Health diagnosing and treating practitioners and other technical occupations (%)
Most Common Occupations - Health technologists and technicians (%)
Most Common Occupations - Service occupations (%)
Most Common Occupations - Healthcare support occupations (%)
Most Common Occupations - Protective service occupations (%)
Most Common Occupations - Fire fighting and prevention, and other protective service workers including supervisors (%)
Most Common Occupations - Law enforcement workers including supervisors (%)
Most Common Occupations - Food preparation and serving related occupations (%)
Most Common Occupations - Building and grounds cleaning and maintenance occupations (%)
Most Common Occupations - Personal care and service occupations (%)
Most Common Occupations - Sales and office occupations (%)
Most Common Occupations - Sales and related occupations (%)
Most Common Occupations - Office and administrative support occupations (%)
Most Common Occupations - Natural resources, construction, and maintenance occupations (%)
Most Common Occupations - Farming, fishing, and forestry occupations (%)
Most Common Occupations - Construction and extraction occupations (%)
Most Common Occupations - Installation, maintenance, and repair occupations (%)
Most Common Occupations - Production, transportation, and material moving occupations (%)
Most Common Occupations - Production occupations (%)
Most Common Occupations - Transportation occupations (%)
Most Common Occupations - Material moving occupations (%)
People in Group quarters - Institutionalized population (%)
People in Group quarters - Correctional institutions (%)
People in Group quarters - Federal prisons and detention centers (%)
People in Group quarters - Halfway houses (%)
People in Group quarters - Local jails and other confinement facilities (including police lockups) (%)
People in Group quarters - Military disciplinary barracks (%)
People in Group quarters - State prisons (%)
People in Group quarters - Other types of correctional institutions (%)
People in Group quarters - Nursing homes (%)
People in Group quarters - Hospitals/wards, hospices, and schools for the handicapped (%)
People in Group quarters - Hospitals/wards and hospices for chronically ill (%)
People in Group quarters - Hospices or homes for chronically ill (%)
People in Group quarters - Military hospitals or wards for chronically ill (%)
People in Group quarters - Other hospitals or wards for chronically ill (%)
People in Group quarters - Hospitals or wards for drug/alcohol abuse (%)
People in Group quarters - Mental (Psychiatric) hospitals or wards (%)
People in Group quarters - Schools, hospitals, or wards for the mentally retarded (%)
People in Group quarters - Schools, hospitals, or wards for the physically handicapped (%)
People in Group quarters - Institutions for the deaf (%)
People in Group quarters - Institutions for the blind (%)
People in Group quarters - Orthopedic wards and institutions for the physically handicapped (%)
People in Group quarters - Wards in general hospitals for patients who have no usual home elsewhere (%)
People in Group quarters - Wards in military hospitals for patients who have no usual home elsewhere (%)
People in Group quarters - Juvenile institutions (%)
People in Group quarters - Long-term care (%)
People in Group quarters - Homes for abused, dependent, and neglected children (%)
People in Group quarters - Residential treatment centers for emotionally disturbed children (%)
People in Group quarters - Training schools for juvenile delinquents (%)
People in Group quarters - Short-term care, detention or diagnostic centers for delinquent children (%)
People in Group quarters - Type of juvenile institution unknown (%)
People in Group quarters - Noninstitutionalized population (%)
People in Group quarters - College dormitories (includes college quarters off campus) (%)
People in Group quarters - Military quarters (%)
People in Group quarters - On base (%)
People in Group quarters - Barracks, unaccompanied personnel housing (UPH), (Enlisted/Officer), ;and similar group living quarters for military personnel (%)
People in Group quarters - Transient quarters for temporary residents (%)
People in Group quarters - Military ships (%)
People in Group quarters - Group homes (%)
People in Group quarters - Homes or halfway houses for drug/alcohol abuse (%)
People in Group quarters - Homes for the mentally ill (%)
People in Group quarters - Homes for the mentally retarded (%)
People in Group quarters - Homes for the physically handicapped (%)
People in Group quarters - Other group homes (%)
People in Group quarters - Religious group quarters (%)
People in Group quarters - Dormitories (%)
People in Group quarters - Agriculture workers' dormitories on farms (%)
People in Group quarters - Job Corps and vocational training facilities (%)
People in Group quarters - Other workers' dormitories (%)
People in Group quarters - Crews of maritime vessels (%)
People in Group quarters - Other nonhousehold living situations (%)
People in Group quarters - Other noninstitutional group quarters (%)
Residents speaking English at home (%)
Residents speaking English at home - Born in the United States (%)
Residents speaking English at home - Native, born elsewhere (%)
Residents speaking English at home - Foreign born (%)
Residents speaking Spanish at home (%)
Residents speaking Spanish at home - Born in the United States (%)
Residents speaking Spanish at home - Native, born elsewhere (%)
Residents speaking Spanish at home - Foreign born (%)
Residents speaking other language at home (%)
Residents speaking other language at home - Born in the United States (%)
Residents speaking other language at home - Native, born elsewhere (%)
Residents speaking other language at home - Foreign born (%)
Class of Workers - Employee of private company (%)
Class of Workers - Self-employed in own incorporated business (%)
Class of Workers - Private not-for-profit wage and salary workers (%)
Class of Workers - Local government workers (%)
Class of Workers - State government workers (%)
Class of Workers - Federal government workers (%)
Class of Workers - Self-employed workers in own not incorporated business and Unpaid family workers (%)
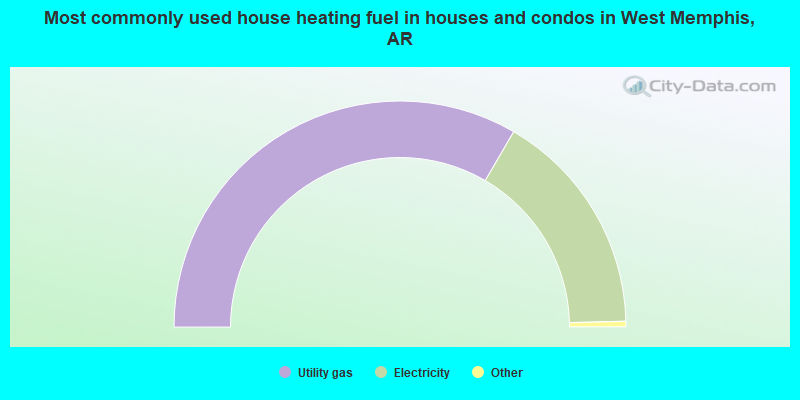
House heating fuel used in houses and condos - Utility gas (%)
House heating fuel used in houses and condos - Bottled, tank, or LP gas (%)
House heating fuel used in houses and condos - Electricity (%)
House heating fuel used in houses and condos - Fuel oil, kerosene, etc. (%)
House heating fuel used in houses and condos - Coal or coke (%)
House heating fuel used in houses and condos - Wood (%)
House heating fuel used in houses and condos - Solar energy (%)
House heating fuel used in houses and condos - Other fuel (%)
House heating fuel used in houses and condos - No fuel used (%)
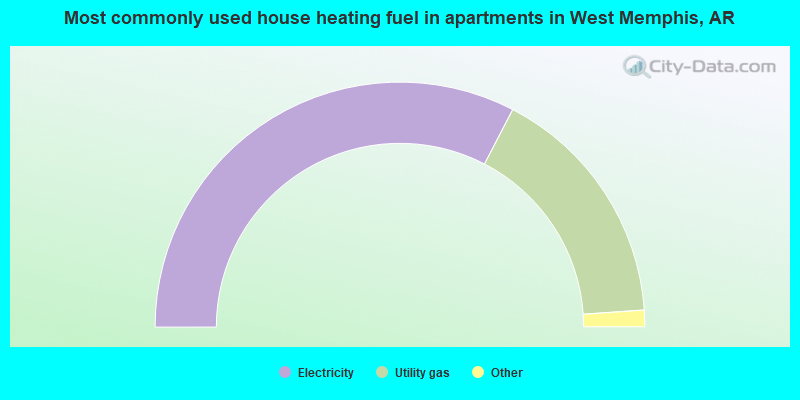
House heating fuel used in apartments - Utility gas (%)
House heating fuel used in apartments - Bottled, tank, or LP gas (%)
House heating fuel used in apartments - Electricity (%)
House heating fuel used in apartments - Fuel oil, kerosene, etc. (%)
House heating fuel used in apartments - Coal or coke (%)
House heating fuel used in apartments - Wood (%)
House heating fuel used in apartments - Solar energy (%)
House heating fuel used in apartments - Other fuel (%)
House heating fuel used in apartments - No fuel used (%)
Armed forces status - In Armed Forces (%)
Armed forces status - Civilian (%)
Armed forces status - Civilian - Veteran (%)
Armed forces status - Civilian - Nonveteran (%)
Fatal accidents locations in years 2005-2021
Fatal accidents locations in 2005
Fatal accidents locations in 2006
Fatal accidents locations in 2007
Fatal accidents locations in 2008
Fatal accidents locations in 2009
Fatal accidents locations in 2010
Fatal accidents locations in 2011
Fatal accidents locations in 2012
Fatal accidents locations in 2013
Fatal accidents locations in 2014
Fatal accidents locations in 2015
Fatal accidents locations in 2016
Fatal accidents locations in 2017
Fatal accidents locations in 2018
Fatal accidents locations in 2019
Fatal accidents locations in 2020
Fatal accidents locations in 2021
Alcohol use - People drinking some alcohol every month (%)
Alcohol use - People not drinking at all (%)
Alcohol use - Average days/month drinking alcohol
Alcohol use - Average drinks/week
Alcohol use - Average days/year people drink much
Audiometry - Average condition of hearing (%)
Audiometry - People that can hear a whisper from across a quiet room (%)
Audiometry - People that can hear normal voice from across a quiet room (%)
Audiometry - Ears ringing, roaring, buzzing (%)
Audiometry - Had a job exposure to loud noise (%)
Audiometry - Had off-work exposure to loud noise (%)
Blood Pressure & Cholesterol - Has high blood pressure (%)
Blood Pressure & Cholesterol - Checking blood pressure at home (%)
Blood Pressure & Cholesterol - Frequently checking blood cholesterol (%)
Blood Pressure & Cholesterol - Has high cholesterol level (%)
Consumer Behavior - Money monthly spent on food at supermarket/grocery store
Consumer Behavior - Money monthly spent on food at other stores
Consumer Behavior - Money monthly spent on eating out
Consumer Behavior - Money monthly spent on carryout/delivered foods
Consumer Behavior - Income spent on food at supermarket/grocery store (%)
Consumer Behavior - Income spent on food at other stores (%)
Consumer Behavior - Income spent on eating out (%)
Consumer Behavior - Income spent on carryout/delivered foods (%)
Current Health Status - General health condition (%)
Current Health Status - Blood donors (%)
Current Health Status - Has blood ever tested for HIV virus (%)
Current Health Status - Left-handed people (%)
Dermatology - People using sunscreen (%)
Diabetes - Diabetics (%)
Diabetes - Had a blood test for high blood sugar (%)
Diabetes - People taking insulin (%)
Diet Behavior & Nutrition - Diet health (%)
Diet Behavior & Nutrition - Milk product consumption (# of products/month)
Diet Behavior & Nutrition - Meals not home prepared (#/week)
Diet Behavior & Nutrition - Meals from fast food or pizza place (#/week)
Diet Behavior & Nutrition - Ready-to-eat foods (#/month)
Diet Behavior & Nutrition - Frozen meals/pizza (#/month)
Drug Use - People that ever used marijuana or hashish (%)
Drug Use - Ever used hard drugs (%)
Drug Use - Ever used any form of cocaine (%)
Drug Use - Ever used heroin (%)
Drug Use - Ever used methamphetamine (%)
Health Insurance - People covered by health insurance (%)
Kidney Conditions-Urology - Avg. # of times urinating at night
Medical Conditions - People with asthma (%)
Medical Conditions - People with anemia (%)
Medical Conditions - People with psoriasis (%)
Medical Conditions - People with overweight (%)
Medical Conditions - Elderly people having difficulties in thinking or remembering (%)
Medical Conditions - People who ever received blood transfusion (%)
Medical Conditions - People having trouble seeing even with glass/contacts (%)
Medical Conditions - People with arthritis (%)
Medical Conditions - People with gout (%)
Medical Conditions - People with congestive heart failure (%)
Medical Conditions - People with coronary heart disease (%)
Medical Conditions - People with angina pectoris (%)
Medical Conditions - People who ever had heart attack (%)
Medical Conditions - People who ever had stroke (%)
Medical Conditions - People with emphysema (%)
Medical Conditions - People with thyroid problem (%)
Medical Conditions - People with chronic bronchitis (%)
Medical Conditions - People with any liver condition (%)
Medical Conditions - People who ever had cancer or malignancy (%)
Mental Health - People who have little interest in doing things (%)
Mental Health - People feeling down, depressed, or hopeless (%)
Mental Health - People who have trouble sleeping or sleeping too much (%)
Mental Health - People feeling tired or having little energy (%)
Mental Health - People with poor appetite or overeating (%)
Mental Health - People feeling bad about themself (%)
Mental Health - People who have trouble concentrating on things (%)
Mental Health - People moving or speaking slowly or too fast (%)
Mental Health - People having thoughts they would be better off dead (%)
Oral Health - Average years since last visit a dentist
Oral Health - People embarrassed because of mouth (%)
Oral Health - People with gum disease (%)
Oral Health - General health of teeth and gums (%)
Oral Health - Average days a week using dental floss/device
Oral Health - Average days a week using mouthwash for dental problem
Oral Health - Average number of teeth
Pesticide Use - Households using pesticides to control insects (%)
Pesticide Use - Households using pesticides to kill weeds (%)
Physical Activity - People doing vigorous-intensity work activities (%)
Physical Activity - People doing moderate-intensity work activities (%)
Physical Activity - People walking or bicycling (%)
Physical Activity - People doing vigorous-intensity recreational activities (%)
Physical Activity - People doing moderate-intensity recreational activities (%)
Physical Activity - Average hours a day doing sedentary activities
Physical Activity - Average hours a day watching TV or videos
Physical Activity - Average hours a day using computer
Physical Functioning - People having limitations keeping them from working (%)
Physical Functioning - People limited in amount of work they can do (%)
Physical Functioning - People that need special equipment to walk (%)
Physical Functioning - People experiencing confusion/memory problems (%)
Physical Functioning - People requiring special healthcare equipment (%)
Prescription Medications - Average number of prescription medicines taking
Preventive Aspirin Use - Adults 40+ taking low-dose aspirin (%)
Reproductive Health - Vaginal deliveries (%)
Reproductive Health - Cesarean deliveries (%)
Reproductive Health - Deliveries resulted in a live birth (%)
Reproductive Health - Pregnancies resulted in a delivery (%)
Reproductive Health - Women breastfeeding newborns (%)
Reproductive Health - Women that had a hysterectomy (%)
Reproductive Health - Women that had both ovaries removed (%)
Reproductive Health - Women that have ever taken birth control pills (%)
Reproductive Health - Women taking birth control pills (%)
Reproductive Health - Women that have ever used Depo-Provera or injectables (%)
Reproductive Health - Women that have ever used female hormones (%)
Sexual Behavior - People 18+ that ever had sex (vaginal, anal, or oral) (%)
Sexual Behavior - Males 18+ that ever had vaginal sex with a woman (%)
Sexual Behavior - Males 18+ that ever performed oral sex on a woman (%)
Sexual Behavior - Males 18+ that ever had anal sex with a woman (%)
Sexual Behavior - Males 18+ that ever had any sex with a man (%)
Sexual Behavior - Females 18+ that ever had vaginal sex with a man (%)
Sexual Behavior - Females 18+ that ever performed oral sex on a man (%)
Sexual Behavior - Females 18+ that ever had anal sex with a man (%)
Sexual Behavior - Females 18+ that ever had any kind of sex with a woman (%)
Sexual Behavior - Average age people first had sex
Sexual Behavior - Average number of female sex partners in lifetime (males 18+)
Sexual Behavior - Average number of female vaginal sex partners in lifetime (males 18+)
Sexual Behavior - Average age people first performed oral sex on a woman (18+)
Sexual Behavior - Average number of woman performed oral sex on in lifetime (18+)
Sexual Behavior - Average number of male sex partners in lifetime (males 18+)
Sexual Behavior - Average number of male anal sex partners in lifetime (males 18+)
Sexual Behavior - Average age people first performed oral sex on a man (18+)
Sexual Behavior - Average number of male oral sex partners in lifetime (18+)
Sexual Behavior - People using protection when performing oral sex (%)
Sexual Behavior - Average number of times people have vaginal or anal sex a year
Sexual Behavior - People having sex without condom (%)
Sexual Behavior - Average number of male sex partners in lifetime (females 18+)
Sexual Behavior - Average number of male vaginal sex partners in lifetime (females 18+)
Sexual Behavior - Average number of female sex partners in lifetime (females 18+)
Sexual Behavior - Circumcised males 18+ (%)
Sleep Disorders - Average hours sleeping at night
Sleep Disorders - People that has trouble sleeping (%)
Smoking-Cigarette Use - People smoking cigarettes (%)
Taste & Smell - People 40+ having problems with smell (%)
Taste & Smell - People 40+ having problems with taste (%)
Taste & Smell - People 40+ that ever had wisdom teeth removed (%)
Taste & Smell - People 40+ that ever had tonsils teeth removed (%)
Taste & Smell - People 40+ that ever had a loss of consciousness because of a head injury (%)
Taste & Smell - People 40+ that ever had a broken nose or other serious injury to face or skull (%)
Taste & Smell - People 40+ that ever had two or more sinus infections (%)
Weight - Average height (inches)
Weight - Average weight (pounds)
Weight - Average BMI
Weight - People that are obese (%)
Weight - People that ever were obese (%)
Weight - People trying to lose weight (%)
14,539 59.2% Black alone 7,544 30.7% White alone 1,140 4.6% Two or more races 545 2.2% Hispanic 156 0.6% Asian alone 31 0.1% American Indian alone
Officers per 1,000 residents here:
2.88Arkansas average:
2.25
Latest news from West Memphis, AR collected exclusively by city-data.com from local newspapers, TV, and radio stations
Ancestries: American (10.4%), English (2.8%), Irish (2.7%), German (1.2%), African (1.1%).
Current Local Time:
Land area: 26.5 square miles.
Population density: 898 people per square mile (low).
339 residents are foreign born
This city:
1.4%Arkansas:
5.0%
Median real estate property taxes paid for housing units with mortgages in 2022: $876 (0.6%)Median real estate property taxes paid for housing units with no mortgage in 2022: $464 (0.4%)
Nearest city with pop. 50,000+: Memphis, TN
Nearest city with pop. 1,000,000+: Dallas, TX
Nearest cities:
Jericho, AR (3.1 miles),
Latitude: 35.15 N, Longitude: 90.18 W
Daytime population change due to commuting: +1,620 (+6.6%)Workers who live and work in this city: 4,647 (49.7%)
Single-family new house construction building permits:
2022: 18 buildings , average cost: $121,5002021: 12 buildings , average cost: $157,9002020: 18 buildings , average cost: $90,3002019: 12 buildings , average cost: $192,1002018: 12 buildings , average cost: $123,0002017: 10 buildings , average cost: $161,0002016: 22 buildings , average cost: $138,8002015: 9 buildings , average cost: $90,0002014: 14 buildings , average cost: $166,4002013: 10 buildings , average cost: $184,0002012: 10 buildings , average cost: $159,5002011: 4 buildings , average cost: $143,3002010: 3 buildings , average cost: $218,3002009: 6 buildings , average cost: $195,3002008: 54 buildings , average cost: $96,2002007: 74 buildings , average cost: $161,1002006: 10 buildings , average cost: $174,8002005: 48 buildings , average cost: $163,9002004: 41 buildings , average cost: $180,2002003: 141 buildings , average cost: $43,8002002: 33 buildings , average cost: $128,5002001: 57 buildings , average cost: $118,2002000: 112 buildings , average cost: $79,8001999: 50 buildings , average cost: $112,0001998: 47 buildings , average cost: $108,8001997: 68 buildings , average cost: $87,500Unemployment in December 2023:
Most common occupations in West Memphis, AR (%)
Both Males Females
Other production occupations, including supervisors (4.7%)
Driver/sales workers and truck drivers (4.3%)
Material recording, scheduling, dispatching, and distributing workers (3.9%)
Other sales and related occupations, including supervisors (3.9%)
Building and grounds cleaning and maintenance occupations (3.8%)
Other office and administrative support workers, including supervisors (3.7%)
Preschool, kindergarten, elementary, and middle school teachers (3.2%)
Driver/sales workers and truck drivers (8.3%)
Electrical equipment mechanics and other installation, maintenance, and repair workers, including supervisors (5.8%)
Other production occupations, including supervisors (5.4%)
Vehicle and mobile equipment mechanics, installers, and repairers (4.8%)
Laborers and material movers, hand (4.4%)
Material recording, scheduling, dispatching, and distributing workers (4.3%)
Other sales and related occupations, including supervisors (4.1%)
Secretaries and administrative assistants (6.3%)
Other office and administrative support workers, including supervisors (5.7%)
Preschool, kindergarten, elementary, and middle school teachers (5.4%)
Cashiers (4.7%)
Building and grounds cleaning and maintenance occupations (4.3%)
Other production occupations, including supervisors (4.0%)
Information and record clerks, except customer service representatives (3.7%)
Tornado activity:
West Memphis-area historical tornado activity is near Arkansas state average. It is 102% greater than the overall U.S. average.
On 4/21/1984, a category F3 (max. wind speeds 158-206 mph) tornado 2.2 miles away from the West Memphis city center injured 3 people and caused between $500,000 and $5,000,000 in damages.
On 12/14/1987, a category F3 tornado 4.5 miles away from the city center killed 6 people and injured 121 people and caused between $5,000,000 and $50,000,000 in damages.
Earthquake activity:
West Memphis-area historical earthquake activity is significantly above Arkansas state average. It is 387% greater than the overall U.S. average. On 3/25/1976 at 00:41:20, a magnitude 5.0 (4.9 MB, 5.0 LG, Class: Moderate, Intensity: VI - VII) earthquake occurred 34.7 miles away from the city center On 5/4/1991 at 01:18:54, a magnitude 5.0 (4.4 MB, 4.6 LG, 5.0 LG, Depth: 3.1 mi) earthquake occurred 99.8 miles away from West Memphis center On 4/27/1989 at 16:47:49, a magnitude 4.7 (4.6 MB, 4.7 LG, 4.3 LG, Class: Light, Intensity: IV - V) earthquake occurred 63.5 miles away from the city center On 3/25/1976 at 01:00:11, a magnitude 4.5 (4.1 MB, 4.5 LG) earthquake occurred 36.0 miles away from West Memphis center On 9/26/1990 at 13:18:51, a magnitude 5.0 (4.7 MB, 4.8 LG, 5.0 LG, Depth: 7.7 mi) earthquake occurred 144.0 miles away from the city center On 5/4/2001 at 06:42:12, a magnitude 4.7 (4.2 MB, 4.7 LG, 4.5 LG) earthquake occurred 114.0 miles away from West Memphis center Magnitude types: regional Lg-wave magnitude (LG), body-wave magnitude (MB) Natural disasters: The number of natural disasters in Crittenden County (15) is near the US average (15).Major Disasters (Presidential) Declared: 11Emergencies Declared: 3Storms: 9, Floods: 7, Tornadoes: 5, Winter Storms: 4, Hurricane: 1, Ice Storm: 1, Other: 1 (Note: some incidents may be assigned to more than one category). Hospitals and medical centers in West Memphis: ARKANSAS DEPARTMENT OF HEALTH HOSPICE 9E (CRITTENDEN COUNTY HU 901 NORTH 7TH) CRITTENDEN MEMORIAL HOSPITAL (Voluntary non-profit - Private, provides emergency services, 200 TYLER) HAVEN HOSPICE SERVICES (308 SOUTH RHODES) BROADWAY HEALTHCARE CENTER (800 WEST BROADWAY)
GERIATRIC NURSING CENTER (610 S AVALON)
HEALTH CARE AND REHABILITATION CENTER OF WEST MEMP (610 SOUTH AVALON ST)
LEISURE LODGE INC (111 E JACKSON)
FMCNA - EAST ARKANSAS (310 S RHODES)
CRITTENDEN COUNTY HEALTH UNIT (901 NORTH SEVENTH STREET)
CRITTENDEN REG HOSPITAL HOME HEALTH W MEMPHIS (200 TYLER CMH PAVILLION STE 1)
Amtrak station near West Memphis: 7 miles: MEMPHIS (545 S. MAIN ST.) Services: ticket office, partially wheelchair accessible, enclosed waiting area, public restrooms, public payphones, vending machines, free short-term parking, free long-term parking, call for car rental service, call for taxi service, public transit connection.
College/University in West Memphis: Mid-South Community College Full-time enrollment: 1,217; Location: 2000 W. Broadway; Public; Website: www.midsouthcc.edu)
Colleges/universities with over 2000 students nearest to West Memphis:
Southwest Tennessee Community College (about 9 miles; Memphis, TN ; Full-time enrollment: 8,043)
Rhodes College (about 11 miles; Memphis, TN ; FT enrollment: 2,052)
University of Memphis (about 12 miles; Memphis, TN ; FT enrollment: 17,427)
Northwest Mississippi Community College (about 39 miles; Senatobia, MS ; FT enrollment: 6,607)
Arkansas State University-Main Campus (about 56 miles; Jonesboro, AR ; FT enrollment: 12,323)
University of Mississippi (about 66 miles; University, MS ; FT enrollment: 17,642)
Coahoma Community College (about 66 miles; Clarksdale, MS ; FT enrollment: 2,284)
Public high schools in West Memphis: MID-SOUTH COMM COLLEGE TECH CENTER Location: 2000 W BRDWAY, Grades: 9-12)
EAST JUNIOR HIGH SCHOOL Location: 1151 GOODWIN ST, Grades: 7-9)WEST JUNIOR HIGH SCHOOL Location: 331 W BARTON ST, Grades: 7-9)WONDER JUNIOR HIGH SCHOOL Location: 1401 MADISON ST, Grades: 7-9)THE ACADEMIES OF WEST MEMPHIS CHARTER SCHOOL Location: 501 BROADWAY, Grades: 10-12, Charter school )
Private high school in West Memphis: WEST MEMPHIS CHRISTIAN Students: 219, Location: 1101 N MISSOURI ST, Grades: KG-12)
Public elementary/middle schools in West Memphis:
Private elementary/middle school in West Memphis: ST MICHAEL SCHOOL Students: 85, Location: 405 N MISSOURI STREET, Grades: PK-6)
See full list of schools located in West Memphis Library in West Memphis: WEST MEMPHIS PUBLIC LIBRARY Operating income: $588,391; Location: 213 NORTH AVALON; 50,643 books ; 1,356 audio materials ; 97 video materials ; 2 local licensed databases ; 82 state licensed databases ; 59 print serial subscriptions )
Notable locations in West Memphis: (A) , Meadowbrook Country Club (B) , Riverside Speedway (C) , Southland Park Racetrack (D) , Airport Industrial Park (E) , Interstate Industrial Park (F) , Missouri Pacific Industrial Park (G) , Rainer Industrial Park (H) , Wilson-Rich Industrial Park (I) , Eugene Woods Community Center (J) , West Memphis City Hall (K) , West Memphis Fire Department Station 1 (L) , West Memphis Fire Department Station 2 (M) , West Memphis Fire Department Station 3 (N) , West Memphis Fire Department Station 4 (O) , West Memphis Police Department (P) , Federal Bureau of Investigation West Memphis Resident Office (Q) , Crittenden County Drug Task Force (R) , Crittenden County Sheriff's Office (S) , Crittenden Emergency Medical Service (T) . Display/hide their locations on the map
Shopping Centers: (1) , Holiday Plaza Mall Shopping Center (2) , Missouri Avenue Plaza Shopping Center (3) . Display/hide their locations on the map
Churches in West Memphis include: (A) , Westwood Church (B) , Mount Harmon Church (C) , Saint Pauls Church (D) , Williams Chapel Church (E) , Whole Bible Church of Jesus Christ (F) , Westwood Acres Church of Christ (G) , Westminster Presbyterian Church (H) , Victory Fellowship Church (I) . Display/hide their locations on the map
Streams, rivers, and creeks: (A) . Display/hide its location on the map
Parks in West Memphis include: (1) , Avondale Park (2) , Franklin Park (3) , Hicks Park (4) , Hightower Park (5) , Horton Park (6) , Matthews Park (7) , Rowe Park (8) , Tenth Street Mini-Park (9) . Display/hide their locations on the map
Tourist attractions: (1) , Cj's Pool Hall (Arcades & Amusements; 1621 East Broadway Street) (2) . Display/hide their approximate locations on the map
Hotels: (1) , Budget Inn (4361 East Broadway Street) (2) , Relax Inn (2407 South Service Road) (3) , Super 8 West Memphis AR (901 Martin Luther King Jr Boulevard) (4) , Ramada Inn Limited (210 South Service Road) (5) , Twentieth Century Motel (1901 East Broadway Street) (6) , Comfort Inn West Memphis (1300 Ingram Boulevard) (7) , West Memphis Super 8 Motel (901 Martin Luther King Jr. Blvd I-40 Exit 280 Club Road Or I-5) (8) , Sunset Inn (300 Martin Luther King D) (9) . Display/hide their approximate locations on the map
Courts: (1) , Arkansas-State - Community Punishment-Department- Drug Court Color Of The- Arkansas Highway Po (250 Shoppingway Boulevard) (2) . Display/hide their approximate locations on the map
Birthplace of: Marcus Brown - Basketball player, Corey L. Brewer - Basketball player, Michael Cage - Basketball player, Shirley Brown - Singer, Sonny Weems - Basketball player, T. J. Holmes - Journalist, Keith Lee - Basketball player, Tom Watkins (American football) - Football player, Betty Blue (model) - Actor, Charles Stackhouse - Football player.
Crittenden County has a predicted average indoor radon screening level less than 2 pCi/L (pico curies per liter) - Low Potential Average household size: This city:
2.6 peopleArkansas:
2.5 people
Percentage of family households: This city:
67.5%Whole state:
67.6%
Percentage of households with unmarried partners: This city:
7.0%Whole state:
5.7%
Likely homosexual households (counted as self-reported same-sex unmarried-partner households)
Lesbian couples: 0.4% of all households Gay men: 0.3% of all households
People in group quarters in West Memphis in 2010:
299 people in local jails and other municipal confinement facilities
206 people in nursing facilities/skilled-nursing facilities
60 people in group homes intended for adults
31 people in emergency and transitional shelters (with sleeping facilities) for people experiencing homelessness
12 people in workers' group living quarters and job corps centers
People in group quarters in West Memphis in 2000:
251 people in local jails and other confinement facilities (including police lockups)
211 people in nursing homes
35 people in homes for the mentally retarded
17 people in other noninstitutional group quarters
Banks with branches in West Memphis (2011 data):
Regions Bank: Shoppingway Branch at 214 Shoppingway Boulevard, branch established on 1985/02/15; West Memphis Main Office Branch at 231 East Broadway, branch established on 1941/09/15. Info updated 2011/02/24: Bank assets: $123,368.2 mil, Deposits: $98,301.3 mil, headquarters in Birmingham, AL, positive income , Commercial Lending Specialization, 1778 total offices , Holding Company: Regions Financial Corporation
SunTrust Bank: West Memphis Civic Center 954 at 125 West Broadway, branch established on 1986/12/05; W. Memphis Walmart 953 at 798 West Service Road, branch established on 1995/02/25. Info updated 2010/05/27: Bank assets: $171,291.7 mil, Deposits: $129,833.2 mil, headquarters in Atlanta, GA, positive income , Commercial Lending Specialization, 1716 total offices , Holding Company: Suntrust Banks, Inc.
Fidelity National Bank: Mid-Continent Branch at 350 West Service Road, branch established on 1974/07/31; at 330 West Broadway, branch established on 1966/11/04. Info updated 2006/11/03: Bank assets: $332.5 mil, Deposits: $293.6 mil, local headquarters , positive income , 5 total offices , Holding Company: Carlson Bancshares, Inc.
Evolve Bank & Trust: at 301 Shoppingway Boulevard, branch established on 1925/06/05. Info updated 2010/09/22: Bank assets: $246.3 mil, Deposits: $159.6 mil, local headquarters , positive income , Mortgage Lending Specialization, 22 total offices , Holding Company: Evolve Financial Group, Inc.
First Community Bank of Eastern Arkansas: Missouri Street Branch at 1103 North Missouri Street, branch established on 2005/05/20. Info updated 2006/11/03: Bank assets: $115.5 mil, Deposits: $101.2 mil, headquarters in Marion, AR, positive income , Commercial Lending Specialization, 2 total offices , Holding Company: Fcb Financial Services, Inc
For population 15 years and over in West Memphis:
Never married: 40.6%Now married: 32.8%Separated: 3.6%Widowed: 7.9%Divorced: 15.1% For population 25 years and over in West Memphis:
High school or higher: 83.7%Bachelor's degree or higher: 14.6%Graduate or professional degree: 3.1%Unemployed: 8.1%Mean travel time to work (commute): 18.5 minutes
Education Gini index (Inequality in education) Here:
10.1Arkansas average:
11.4
Religion statistics for West Memphis, AR (based on Crittenden County data)
Religion Adherents Congregations Evangelical Protestant 16,649 48 Black Protestant 4,466 17 Mainline Protestant 2,805 8 Catholic 525 3 Other 411 3 None 26,046 -
Source: Clifford Grammich, Kirk Hadaway, Richard Houseal, Dale E.Jones, Alexei Krindatch, Richie Stanley and Richard H.Taylor. 2012. 2010 U.S.Religion Census: Religious Congregations & Membership Study. Association of Statisticians of American Religious Bodies. Jones, Dale E., et al. 2002. Congregations and Membership in the United States 2000. Nashville, TN: Glenmary Research Center. Graphs represent county-level data
Food Environment Statistics: Number of grocery stores : 14Crittenden County :
2.69 / 10,000 pop.Arkansas :
2.02 / 10,000 pop.
Number of supercenters and club stores : 1Here :
0.19 / 10,000 pop.Arkansas :
0.25 / 10,000 pop.
Number of convenience stores (no gas) : 1Crittenden County :
0.19 / 10,000 pop.Arkansas :
0.59 / 10,000 pop.
Number of convenience stores (with gas) : 25Here :
4.80 / 10,000 pop.State :
4.94 / 10,000 pop.
Number of full-service restaurants : 15This county :
2.88 / 10,000 pop.Arkansas :
6.66 / 10,000 pop.
Adult diabetes rate : Crittenden County :
12.7%Arkansas :
9.8%
Adult obesity rate : This county :
34.2%Arkansas :
29.1%
Low-income preschool obesity rate : Crittenden County :
13.9%Arkansas :
13.6%
Health and Nutrition:
Average overall health of teeth and gums : Average BMI : West Memphis:
29.8State:
28.9
People feeling badly about themselves : This city:
21.9%Arkansas:
21.6%
People not drinking alcohol at all : This city:
12.8%Arkansas:
11.3%
Average hours sleeping at night : West Memphis:
6.7State:
6.8
General health condition : West Memphis:
52.7%Arkansas:
54.4%
Average condition of hearing : More about Health and Nutrition of West Memphis, AR Residents
Local government employment and payroll (March 2022)
Function
Full-time employees
Monthly full-time payroll
Average yearly full-time wage
Part-time employees
Monthly part-time payroll
Police Protection - Officers
90 $418,122 $55,750 0 $0 Firefighters
60 $299,646 $59,929 0 $0 Solid Waste Management
30 $81,323 $32,529 0 $0 Streets and Highways
28 $95,010 $40,719 0 $0 Financial Administration
21 $95,244 $54,425 1 $1,831 Electric Power
21 $114,273 $65,299 0 $0 Police - Other
17 $51,947 $36,668 11 $5,364 Other and Unallocable
13 $65,718 $60,663 5 $5,867 Parks and Recreation
13 $49,940 $46,098 1 $1,018 Judicial and Legal
11 $48,948 $53,398 0 $0 Water Supply
10 $54,635 $65,562 0 $0 Housing and Community Development (Local)
10 $48,353 $58,024 0 $0 Airports
7 $24,443 $41,902 0 $0 Sewerage
6 $30,981 $61,962 0 $0 Other Government Administration
5 $22,775 $54,660 25 $11,669 Local Libraries
4 $13,091 $39,273 6 $5,495 Fire - Other
3 $7,904 $31,616 0 $0
Totals for Government
349 $1,522,353 $52,345 49 $31,244
West Memphis government finances - Expenditure in 2021 (per resident):
Construction - Sewerage: $3,635,000 ($152.76)
Libraries: $3,484,000 ($146.42)Electric Utilities: $668,000 ($28.07)Water Utilities: $532,000 ($22.36)Regular Highways: $531,000 ($22.32)Air Transportation: $240,000 ($10.09)Current Operations - Electric Utilities: $21,263,000 ($893.59)
Police Protection: $8,769,000 ($368.52)Local Fire Protection: $5,690,000 ($239.13)Regular Highways: $3,463,000 ($145.53)Solid Waste Management: $2,536,000 ($106.58)General - Other: $2,303,000 ($96.79)Sewerage: $1,962,000 ($82.45)Water Utilities: $1,504,000 ($63.21)Central Staff Services: $1,322,000 ($55.56)Air Transportation: $1,217,000 ($51.15)Judicial and Legal Services: $861,000 ($36.18)Financial Administration: $708,000 ($29.75)Parks and Recreation: $672,000 ($28.24)Health - Other: $614,000 ($25.80)Libraries: $599,000 ($25.17)Housing and Community Development: $347,000 ($14.58)Sea and Inland Port Facilities: $55,000 ($2.31)General - Interest on Debt: $227,000 ($9.54)
Other Capital Outlay - Local Fire Protection: $167,000 ($7.02)
General - Other: $87,000 ($3.66)Judicial and Legal Services: $68,000 ($2.86)Parks and Recreation: $62,000 ($2.61)Air Transportation: $13,000 ($0.55)Police Protection: $8,000 ($0.34)Financial Administration: $1,000 ($0.04)
West Memphis government finances - Revenue in 2021 (per resident):
Charges - Solid Waste Management: $2,553,000 ($107.29)
Sewerage: $1,397,000 ($58.71)Air Transportation: $1,252,000 ($52.62)Other: $673,000 ($28.28)Sea and Inland Port Facilities: $276,000 ($11.60)Parks and Recreation: $2,000 ($0.08)Federal Intergovernmental - Health and Hospitals: $1,047,000 ($44.00)
Highways: $570,000 ($23.95)Housing and Community Development: $376,000 ($15.80)Other: $374,000 ($15.72)Air Transportation: $69,000 ($2.90)Local Intergovernmental - General Local Government Support: $2,378,000 ($99.94)
Miscellaneous - General Revenue - Other: $1,759,000 ($73.92)
Fines and Forfeits: $997,000 ($41.90)Interest Earnings: $301,000 ($12.65)Rents: $62,000 ($2.61)Donations From Private Sources: $37,000 ($1.55)Revenue - Electric Utilities: $23,571,000 ($990.59)
Water Utilities: $1,351,000 ($56.78)State Intergovernmental - Highways: $1,981,000 ($83.25)
General Local Government Support: $401,000 ($16.85)Other: $52,000 ($2.19)Tax - General Sales and Gross Receipts: $7,656,000 ($321.75)
Pari - mutuels Sales: $6,108,000 ($256.69)Public Utilities Sales: $2,244,000 ($94.31)Other Selective Sales: $1,413,000 ($59.38)Property: $1,399,000 ($58.79)Occupation and Business License - Other: $308,000 ($12.94)Other License: $114,000 ($4.79)Alcoholic Beverage Sales: $67,000 ($2.82)
West Memphis government finances - Debt in 2021 (per resident):
Long Term Debt - Outstanding Unspecified Public Purpose: $3,081,000 ($129.48)
Beginning Outstanding - Public Debt for Private Purpose: $2,900,000 ($121.87)Beginning Outstanding - Unspecified Public Purpose: $2,893,000 ($121.58)Outstanding Nonguaranteed - Industrial Revenue: $1,500,000 ($63.04)Retired Nonguaranteed - Public Debt for Private Purpose: $1,400,000 ($58.84)Issue, Unspecified Public Purpose: $467,000 ($19.63)Retired Unspecified Public Purpose: $279,000 ($11.73)
West Memphis government finances - Cash and Securities in 2021 (per resident):
Bond Funds - Cash and Securities: $959,000 ($40.30)
Other Funds - Cash and Securities: $47,677,000 ($2003.66)
Sinking Funds - Cash and Securities: $1,811,000 ($76.11)
Businesses in West Memphis, AR
Name Count Name Count
AT&T 1 Little Caesars Pizza 1 Advance Auto Parts 1 MasterBrand Cabinets 2 Applebee's 1 McDonald's 3 Baskin-Robbins 1 Motel 6 1 Best Western 1 Nike 2 Blockbuster 1 Papa John's Pizza 1 Burger King 2 Payless 1 Comfort Suites 1 Pizza Hut 1 Cricket Wireless 2 Popeyes 1 Dairy Queen 1 Quality 1 Days Inn 1 RadioShack 1 Decora Cabinetry 1 Ramada 1 Dennys 1 Red Roof Inn 1 Domino's Pizza 1 SONIC Drive-In 1 Econo Lodge 1 Sears 1 FedEx 10 Subway 4 Ford 1 Super 8 1 H&R Block 1 T-Mobile 2 Holiday Inn 1 Taco Bell 2 Howard Johnson 1 U-Haul 2 Jones New York 1 UPS 6 KFC 2 Waffle House 1 Kroger 1 Walgreens 2 La-Z-Boy 1 Walmart 1
Strongest AM radio stations in West Memphis:
WDIA (1070 AM; 50 kW; MEMPHIS, TN; Owner: CLEAR CHANNEL BROADCASTING LICENSES, INC.)
WGSF (1030 AM; 50 kW; MEMPHIS, TN; Owner: FLINN BROADCASTING CORPORATION)
KSUD (730 AM; 1 kW; WEST MEMPHIS, AR; Owner: EDUCATIONAL MEDIA FOUNDATION)
WCRV (640 AM; 50 kW; COLLIERVILLE, TN; Owner: BOTT BROADCASTING COMPANY/TENNESSEE)
WJCE (680 AM; 10 kW; MEMPHIS, TN; Owner: ENTERCOM MEMPHIS LICENSE, LLC)
KWAM (990 AM; 10 kW; MEMPHIS, TN; Owner: CONCORD MEDIA GROUP, INC.)
WHBQ (560 AM; 5 kW; MEMPHIS, TN; Owner: FLINN BROADCASTING CORPORATION)
WREC (600 AM; 5 kW; MEMPHIS, TN; Owner: CLEAR CHANNEL BROADCASTING LICENSES, INC.)
WMQM (1600 AM; 50 kW; LAKELAND, TN; Owner: WMQM, INC.)
WBBP (1480 AM; 5 kW; MEMPHIS, TN)
WMC (790 AM; 5 kW; MEMPHIS, TN; Owner: INFINITY RADIO OPERATIONS INC.)
WLOK (1340 AM; 1 kW; MEMPHIS, TN; Owner: WLOK RADIO, INC.)
WPLX (1170 AM; 10 kW; GERMANTOWN, TN; Owner: EDUCATIONAL MEDIA FOUNDATION)
Strongest FM radio stations in West Memphis:
KJMS (101.1 FM; MEMPHIS, TN; Owner: CLEAR CHANNEL BROADCASTING LICENSES, INC.)
KXHT (107.1 FM; MARION, AR; Owner: FLINN BROADCASTING CORPORATION)
WHRK (97.1 FM; MEMPHIS, TN; Owner: CLEAR CHANNEL BROADCASTING LICENSES, INC.)
WSRR-FM (98.1 FM; MILLINGTON, TN; Owner: KOOL BROADCASTING, INC.)
WMC-FM (99.7 FM; MEMPHIS, TN; Owner: INFINITY RADIO OPERATIONS INC.)
WYPL (89.3 FM; MEMPHIS, TN; Owner: MEMPHIS/SHELBY COUNTY PUBLIC LIBRARY & INFO CNTR.)
WGKX (105.9 FM; MEMPHIS, TN; Owner: KIX BROADCASTING, INC.)
WRVR-FM (104.5 FM; MEMPHIS, TN; Owner: ENTERCOM MEMPHIS LICENSE, LLC)
WEGR (102.7 FM; MEMPHIS, TN; Owner: CLEAR CHANNEL BROADCASTING LICENSES, INC.)
WHAL-FM (95.7 FM; OLIVE BRANCH, MS; Owner: CLEAR CHANNEL BROADCASTING LICENSES, INC.)
WKNO-FM (91.1 FM; MEMPHIS, TN; Owner: MID-SOUTH PUBLIC COMMUNICATIONS FOUNDATION)
KKLV (94.7 FM; TURRELL, AR; Owner: EDUCATIONAL MEDIA FOUNDATION)
WUMR (91.7 FM; MEMPHIS, TN; Owner: THE UNIVERSITY OF MEMPHIS)
WMBZ (94.1 FM; GERMANTOWN, TN; Owner: ENTERCOM MEMPHIS LICENSE, LLC)
WQOX (88.5 FM; MEMPHIS, TN; Owner: MEMPHIS CITY SCHOOLS)
WMFS (92.9 FM; BARTLETT, TN; Owner: INFINITY BROADCASTING CORP. OF ILLINOIS)
WEVL (89.9 FM; MEMPHIS, TN; Owner: SOUTHERN COMMUNICATION VOLUNTEERS, INC.)
WMPS (107.5 FM; GERMANTOWN, TN; Owner: FLINN BROADCASTING CORPORATION)
KTRQ (102.3 FM; COLT, AR; Owner: EAST ARKANSAS BROADCASTERS, INC.)
WVIM-FM (95.3 FM; COLDWATER, MS; Owner: DESOTO COUNTY B/CING. CO.)
TV broadcast stations around West Memphis:
WBXP-CA (Channel 44; MEMPHIS, TN; Owner: THE BOX WORLDWIDE LLC)
W42BY (Channel 42; MEMPHIS, TN; Owner: THREE ANGELS BROADCASTING NETWORK, INC,)
W67CV (Channel 67; MEMPHIS, TN; Owner: GEORGE S. FLINN, JR.)
WREG-TV (Channel 3; MEMPHIS, TN; Owner: NEW YORK TIMES MANAGEMENT SERVICES)
WMC-TV (Channel 5; MEMPHIS, TN; Owner: RAYCOM AMERICA, INC.)
WHBQ-TV (Channel 13; MEMPHIS, TN; Owner: FOX TELEVISION STATIONS, INC.)
WKNO (Channel 10; MEMPHIS, TN; Owner: MID-SOUTH PUBLIC COMMUNICATIONS FOUNDATION)
WPXX-TV (Channel 50; MEMPHIS, TN; Owner: FLINN BROADCASTING CORPORATION)
WJRJ-LP (Channel 59; MEMPHIS, TN; Owner: WORD OF GOD FELLOWSHIP, INC.)
WLMT (Channel 30; MEMPHIS, TN; Owner: CLEAR CHANNEL BROADCASTING LICENSES, INC.)
WPTY-TV (Channel 24; MEMPHIS, TN; Owner: CLEAR CHANNEL BROADCASTING LICENSES, INC.)
W57CG (Channel 57; MEMPHIS, TN; Owner: GEORGE S. FLINN, JR.)
W61BP (Channel 61; MEMPHIS, TN; Owner: JIMMY BOYD)
KVTJ (Channel 48; JONESBORO, AR; Owner: AGAPE CHURCH, INC.)
WBUY (Channel 40; HOLLY SPRINGS, MS; Owner: TRINITY BROADCASTING NETWORK)
National Bridge Inventory (NBI) Statistics 135 Number of bridges2,470ft / 753m Total length $14,409,000 Total costs1,888,788 Total average daily traffic284,656 Total average daily truck traffic
New bridges - historical statistics
2 1920-1929 1 1940-1949 9 1950-1959 17 1960-1969 4 1970-1979 15 1980-1989 10 1990-1999 20 2000-2009 7 2010-2019
See full National Bridge Inventory statistics for West Memphis, AR
Home Mortgage Disclosure Act Aggregated Statistics For Year 2009(Based on 8 full and 3 partial tracts) A) FHA, FSA/RHS & VA B) Conventional C) Refinancings D) Home Improvement Loans E) Loans on Dwellings For 5+ Families F) Non-occupant Loans on G) Loans On Manufactured Number Average Value Number Average Value Number Average Value Number Average Value Number Average Value Number Average Value Number Average Value
LOANS ORIGINATED 137 $106,039 61 $75,566 141 $110,225 31 $11,270 2 $4,052,540 59 $48,871 0 $0 APPLICATIONS APPROVED, NOT ACCEPTED 4 $95,722 5 $91,230 11 $131,495 3 $13,757 0 $0 0 $0 1 $31,820 APPLICATIONS DENIED 8 $137,570 13 $69,376 96 $109,661 27 $16,147 0 $0 12 $92,931 5 $50,164 APPLICATIONS WITHDRAWN 8 $93,994 4 $113,088 64 $102,782 4 $41,155 0 $0 4 $110,352 0 $0 FILES CLOSED FOR INCOMPLETENESS 3 $92,773 0 $0 9 $108,788 0 $0 0 $0 0 $0 0 $0
Aggregated Statistics For Year 2008(Based on 9 full and 3 partial tracts) A) FHA, FSA/RHS & VA B) Conventional C) Refinancings D) Home Improvement Loans E) Loans on Dwellings For 5+ Families F) Non-occupant Loans on G) Loans On Manufactured Number Average Value Number Average Value Number Average Value Number Average Value Number Average Value Number Average Value Number Average Value
LOANS ORIGINATED 119 $106,806 83 $79,877 141 $95,696 55 $27,510 1 $498,110 85 $56,432 2 $42,065 APPLICATIONS APPROVED, NOT ACCEPTED 7 $98,437 10 $73,761 14 $103,007 3 $24,797 1 $153,000 4 $60,388 5 $53,388 APPLICATIONS DENIED 28 $124,398 21 $74,034 126 $108,330 57 $16,450 0 $0 12 $188,266 9 $42,791 APPLICATIONS WITHDRAWN 6 $149,403 9 $73,262 58 $94,842 0 $0 0 $0 12 $58,676 0 $0 FILES CLOSED FOR INCOMPLETENESS 3 $165,280 1 $152,220 11 $99,181 0 $0 0 $0 4 $71,500 0 $0
Aggregated Statistics For Year 2007(Based on 9 full and 3 partial tracts) A) FHA, FSA/RHS & VA B) Conventional C) Refinancings D) Home Improvement Loans E) Loans on Dwellings For 5+ Families F) Non-occupant Loans on G) Loans On Manufactured Number Average Value Number Average Value Number Average Value Number Average Value Number Average Value Number Average Value Number Average Value
LOANS ORIGINATED 96 $102,747 200 $95,093 156 $91,535 69 $25,217 2 $1,014,300 81 $57,350 3 $33,677 APPLICATIONS APPROVED, NOT ACCEPTED 5 $86,002 22 $78,122 22 $88,294 9 $37,488 0 $0 4 $68,125 3 $49,303 APPLICATIONS DENIED 9 $85,478 68 $99,086 164 $82,603 63 $21,317 0 $0 29 $60,760 8 $57,396 APPLICATIONS WITHDRAWN 5 $94,346 23 $82,350 67 $90,596 4 $35,500 0 $0 11 $61,831 1 $50,000 FILES CLOSED FOR INCOMPLETENESS 2 $116,765 6 $92,690 39 $90,162 1 $51,140 0 $0 5 $55,800 0 $0
Aggregated Statistics For Year 2006(Based on 9 full and 3 partial tracts) A) FHA, FSA/RHS & VA B) Conventional C) Refinancings D) Home Improvement Loans E) Loans on Dwellings For 5+ Families F) Non-occupant Loans on G) Loans On Manufactured Number Average Value Number Average Value Number Average Value Number Average Value Number Average Value Number Average Value Number Average Value
LOANS ORIGINATED 114 $97,189 209 $92,200 204 $87,071 47 $21,614 1 $165,280 68 $61,195 2 $22,285 APPLICATIONS APPROVED, NOT ACCEPTED 0 $0 22 $81,985 42 $112,039 7 $17,331 0 $0 5 $76,642 3 $42,920 APPLICATIONS DENIED 10 $94,304 99 $83,773 182 $87,925 52 $17,995 0 $0 25 $54,127 14 $41,306 APPLICATIONS WITHDRAWN 7 $78,990 33 $102,091 101 $94,354 6 $58,492 0 $0 8 $84,874 0 $0 FILES CLOSED FOR INCOMPLETENESS 1 $44,340 34 $85,469 31 $116,497 0 $0 0 $0 1 $40,420 0 $0
Aggregated Statistics For Year 2005(Based on 9 full and 3 partial tracts) A) FHA, FSA/RHS & VA B) Conventional C) Refinancings D) Home Improvement Loans E) Loans on Dwellings For 5+ Families F) Non-occupant Loans on G) Loans On Manufactured Number Average Value Number Average Value Number Average Value Number Average Value Number Average Value Number Average Value Number Average Value
LOANS ORIGINATED 110 $101,513 225 $87,001 233 $84,063 56 $27,929 2 $1,762,350 73 $49,651 1 $24,490 APPLICATIONS APPROVED, NOT ACCEPTED 0 $0 29 $82,158 60 $67,943 5 $21,116 0 $0 4 $48,445 3 $38,643 APPLICATIONS DENIED 16 $86,649 103 $85,447 254 $71,066 81 $24,563 0 $0 34 $46,974 10 $37,109 APPLICATIONS WITHDRAWN 5 $94,410 142 $82,945 95 $98,953 13 $146,178 0 $0 7 $85,340 0 $0 FILES CLOSED FOR INCOMPLETENESS 0 $0 11 $133,194 34 $95,567 0 $0 0 $0 1 $89,000 0 $0
Aggregated Statistics For Year 2004(Based on 9 full and 3 partial tracts) A) FHA, FSA/RHS & VA B) Conventional C) Refinancings D) Home Improvement Loans E) Loans on Dwellings For 5+ Families F) Non-occupant Loans on G) Loans On Manufactured Number Average Value Number Average Value Number Average Value Number Average Value Number Average Value Number Average Value Number Average Value
LOANS ORIGINATED 105 $88,027 193 $87,933 268 $82,008 47 $23,121 1 $1,440,260 74 $62,930 2 $59,900 APPLICATIONS APPROVED, NOT ACCEPTED 0 $0 18 $78,346 102 $70,560 6 $37,547 0 $0 3 $46,297 3 $55,507 APPLICATIONS DENIED 18 $91,559 72 $65,207 279 $73,628 53 $23,624 1 $445,600 31 $53,584 18 $38,930 APPLICATIONS WITHDRAWN 5 $78,440 33 $83,641 97 $80,456 3 $38,597 0 $0 5 $45,156 0 $0 FILES CLOSED FOR INCOMPLETENESS 1 $48,000 6 $75,382 49 $80,534 0 $0 0 $0 2 $40,755 0 $0
Aggregated Statistics For Year 2003(Based on 9 full and 3 partial tracts) A) FHA, FSA/RHS & VA B) Conventional C) Refinancings D) Home Improvement Loans E) Loans on Dwellings For 5+ Families F) Non-occupant Loans on Number Average Value Number Average Value Number Average Value Number Average Value Number Average Value Number Average Value
LOANS ORIGINATED 129 $84,408 184 $100,106 433 $89,486 47 $10,444 1 $1,680,000 78 $67,427 APPLICATIONS APPROVED, NOT ACCEPTED 1 $37,180 13 $67,478 78 $74,098 4 $18,538 0 $0 3 $85,993 APPLICATIONS DENIED 20 $63,929 51 $60,157 266 $68,251 45 $13,295 0 $0 23 $41,277 APPLICATIONS WITHDRAWN 13 $80,277 29 $104,984 123 $78,078 3 $17,510 0 $0 9 $49,710 FILES CLOSED FOR INCOMPLETENESS 0 $0 3 $121,687 23 $78,595 0 $0 0 $0 0 $0
Aggregated Statistics For Year 2002(Based on 1 partial tract) A) FHA, FSA/RHS & VA B) Conventional C) Refinancings Number Average Value Number Average Value Number Average Value
LOANS ORIGINATED 1 $49,820 1 $53,510 1 $105,820 APPLICATIONS APPROVED, NOT ACCEPTED 0 $0 0 $0 0 $0 APPLICATIONS DENIED 0 $0 0 $0 1 $41,600 APPLICATIONS WITHDRAWN 0 $0 0 $0 0 $0 FILES CLOSED FOR INCOMPLETENESS 0 $0 0 $0 0 $0
Aggregated Statistics For Year 2001(Based on 1 partial tract) A) FHA, FSA/RHS & VA B) Conventional C) Refinancings Number Average Value Number Average Value Number Average Value
LOANS ORIGINATED 1 $80,300 1 $33,430 1 $82,370 APPLICATIONS APPROVED, NOT ACCEPTED 0 $0 0 $0 0 $0 APPLICATIONS DENIED 0 $0 0 $0 0 $0 APPLICATIONS WITHDRAWN 0 $0 0 $0 0 $0 FILES CLOSED FOR INCOMPLETENESS 0 $0 0 $0 0 $0
Aggregated Statistics For Year 2000(Based on 1 partial tract) B) Conventional C) Refinancings Number Average Value Number Average Value
LOANS ORIGINATED 1 $52,260 0 $0 APPLICATIONS APPROVED, NOT ACCEPTED 0 $0 0 $0 APPLICATIONS DENIED 0 $0 1 $40,190 APPLICATIONS WITHDRAWN 0 $0 0 $0 FILES CLOSED FOR INCOMPLETENESS 0 $0 0 $0
Aggregated Statistics For Year 1999(Based on 4 full and 3 partial tracts) A) FHA, FSA/RHS & VA B) Conventional C) Refinancings D) Home Improvement Loans F) Non-occupant Loans on Number Average Value Number Average Value Number Average Value Number Average Value Number Average Value
LOANS ORIGINATED 148 $70,511 116 $68,094 227 $56,784 128 $9,717 84 $35,917 APPLICATIONS APPROVED, NOT ACCEPTED 3 $78,733 32 $47,920 63 $45,798 12 $20,058 7 $25,801 APPLICATIONS DENIED 48 $63,815 79 $43,173 331 $48,999 162 $12,159 25 $33,010 APPLICATIONS WITHDRAWN 22 $68,087 32 $61,878 132 $50,383 20 $17,590 17 $57,775 FILES CLOSED FOR INCOMPLETENESS 4 $44,555 5 $73,242 30 $67,326 1 $34,540 5 $75,200
Detailed mortgage data for all 12 tracts in West Memphis, AR
Private Mortgage Insurance Companies Aggregated Statistics For Year 2009(Based on 3 full and 3 partial tracts) A) Conventional B) Refinancings Number Average Value Number Average Value
LOANS ORIGINATED 6 $149,527 7 $174,150 APPLICATIONS APPROVED, NOT ACCEPTED 0 $0 3 $160,267 APPLICATIONS DENIED 0 $0 3 $130,790 APPLICATIONS WITHDRAWN 0 $0 1 $62,760 FILES CLOSED FOR INCOMPLETENESS 0 $0 0 $0
Aggregated Statistics For Year 2008(Based on 7 full and 3 partial tracts) A) Conventional B) Refinancings C) Non-occupant Loans on Number Average Value Number Average Value Number Average Value
LOANS ORIGINATED 26 $127,855 14 $84,736 6 $84,342 APPLICATIONS APPROVED, NOT ACCEPTED 12 $113,512 7 $134,093 0 $0 APPLICATIONS DENIED 1 $173,300 1 $122,220 1 $44,160 APPLICATIONS WITHDRAWN 0 $0 0 $0 0 $0 FILES CLOSED FOR INCOMPLETENESS 0 $0 0 $0 0 $0
Aggregated Statistics For Year 2007(Based on 8 full and 3 partial tracts) A) Conventional B) Refinancings C) Non-occupant Loans on Number Average Value Number Average Value Number Average Value
LOANS ORIGINATED 101 $108,813 22 $109,744 5 $81,312 APPLICATIONS APPROVED, NOT ACCEPTED 19 $89,727 8 $101,591 1 $61,000 APPLICATIONS DENIED 3 $75,210 0 $0 0 $0 APPLICATIONS WITHDRAWN 3 $59,033 1 $117,930 0 $0 FILES CLOSED FOR INCOMPLETENESS 1 $28,470 0 $0 1 $28,470
Aggregated Statistics For Year 2006(Based on 6 full and 3 partial tracts) A) Conventional B) Refinancings C) Non-occupant Loans on Number Average Value Number Average Value Number Average Value
LOANS ORIGINATED 59 $115,689 26 $105,542 7 $83,851 APPLICATIONS APPROVED, NOT ACCEPTED 5 $116,874 2 $104,355 0 $0 APPLICATIONS DENIED 1 $119,490 1 $189,000 0 $0 APPLICATIONS WITHDRAWN 1 $234,500 0 $0 0 $0 FILES CLOSED FOR INCOMPLETENESS 1 $110,000 0 $0 0 $0
Aggregated Statistics For Year 2005(Based on 8 full and 3 partial tracts) A) Conventional B) Refinancings C) Non-occupant Loans on Number Average Value Number Average Value Number Average Value
LOANS ORIGINATED 46 $108,533 26 $112,010 6 $60,858 APPLICATIONS APPROVED, NOT ACCEPTED 7 $136,047 6 $75,218 0 $0 APPLICATIONS DENIED 0 $0 0 $0 0 $0 APPLICATIONS WITHDRAWN 1 $81,290 1 $189,170 0 $0 FILES CLOSED FOR INCOMPLETENESS 1 $57,000 0 $0 0 $0
Aggregated Statistics For Year 2004(Based on 6 full and 3 partial tracts) A) Conventional B) Refinancings C) Non-occupant Loans on Number Average Value Number Average Value Number Average Value
LOANS ORIGINATED 44 $105,324 25 $92,816 6 $56,852 APPLICATIONS APPROVED, NOT ACCEPTED 4 $106,862 7 $91,764 3 $71,333 APPLICATIONS DENIED 3 $41,000 0 $0 3 $41,000 APPLICATIONS WITHDRAWN 1 $147,140 1 $64,230 0 $0 FILES CLOSED FOR INCOMPLETENESS 0 $0 0 $0 0 $0
Aggregated Statistics For Year 2003(Based on 6 full and 3 partial tracts) A) Conventional B) Refinancings C) Non-occupant Loans on Number Average Value Number Average Value Number Average Value
LOANS ORIGINATED 37 $112,187 62 $109,086 10 $92,509 APPLICATIONS APPROVED, NOT ACCEPTED 7 $86,964 6 $105,517 2 $66,000 APPLICATIONS DENIED 0 $0 0 $0 0 $0 APPLICATIONS WITHDRAWN 3 $151,667 1 $96,000 0 $0 FILES CLOSED FOR INCOMPLETENESS 0 $0 0 $0 0 $0
Aggregated Statistics For Year 1999(Based on 3 full and 3 partial tracts) A) Conventional B) Refinancings C) Non-occupant Loans on Number Average Value Number Average Value Number Average Value
LOANS ORIGINATED 10 $85,878 9 $58,376 1 $76,990 APPLICATIONS APPROVED, NOT ACCEPTED 1 $135,000 0 $0 0 $0 APPLICATIONS DENIED 1 $135,000 0 $0 0 $0 APPLICATIONS WITHDRAWN 0 $0 0 $0 0 $0 FILES CLOSED FOR INCOMPLETENESS 2 $31,000 0 $0 2 $31,000
Fire-safe hotels and motels in West Memphis, Arkansas:
Econo Lodge, 2315 S Service Rd, West Memphis, Arkansas 72301 Phone: (870) 732-2830, Fax: (870) 735-9970
Ramada West Memphis, 2003 S Service Rd, West Memphis, Arkansas 72301 Phone: (870) 732-1102, Fax: (870) 432-1517
Days Inn, 1100 Ingram Blvd, West Memphis, Arkansas 72301 Phone: (870) 735-8600
Howard Johnson, 210 W Service Rd, West Memphis, Arkansas 72301 Phone: (870) 735-3232, Fax: (870) 735-5998
Comfort Inn, 1300 Ingram Blvd, West Memphis, Arkansas 72301 Phone: (870) 732-0044, Fax: (870) 732-1423
Holiday Inn West Memphis, 2007 S Service Rd, West Memphis, Arkansas 72301 Phone: (870) 735-4055
Red Roof Inn, 1401 N Ingram bld, West Memphis, Arkansas 72301 Phone: (870) 735-7100
Americas Best Value Inn, 2411 E Service Rd, West Memphis, Arkansas 72301 Phone: (870) 732-9654, Fax: (870) 735-3034
3 other hotels and motels
All 11 fire-safe hotels and motels in West Memphis, Arkansas
Most common first names in West Memphis, AR among deceased individuals Name Count Lived (average)
James 246 70.6 years Mary 201 76.3 years John 186 72.6 years Willie 164 73.1 years William 148 71.1 years Robert 120 69.6 years Charles 89 67.9 years George 81 75.8 years Thomas 76 69.8 years Henry 70 74.3 years
Most common last names in West Memphis, AR among deceased individuals Last name Count Lived (average)
Williams 151 70.3 years Smith 140 70.8 years Johnson 133 72.5 years Jones 127 73.0 years Brown 93 71.7 years Davis 75 73.0 years Thomas 61 69.0 years Miller 58 72.8 years Harris 54 71.6 years Robinson 51 68.5 years
West Memphis compared to Arkansas state average:
Unemployed percentage below state average. Black race population percentage significantly above state average. Hispanic race population percentage significantly below state average. Median age below state average. Foreign-born population percentage significantly below state average. Renting percentage above state average. Length of stay since moving in significantly above state average. West Memphis on our top lists :
#4 on the list of "Top 101 cities with the highest number of burglaries per 100,000 residents, excludes tourist destinations and others with a lot of outsiders visiting based on city industries data (population 5,000+)"
#7 on the list of "Top 101 cities with the highest city-data.com crime index, excludes tourist destinations and others with a lot of outsiders visiting based on city industries data (population 5,000+)"
#11 on the list of "Top 101 cities with the highest number of assaults per 100,000 residents, excludes tourist destinations and others with a lot of outsiders visiting based on city industries data (population 5,000+)"
#31 on the list of "Top 101 cities with the highest percentage of single-parent households, population 5,000+"
#41 on the list of "Top 100 least-safe cities (highest city-data.com crime index)"
#46 on the list of "Top 101 cities with the highest number of robberies per 100,000 residents, excludes tourist destinations and others with a lot of outsiders visiting based on city industries data (population 5,000+)"
#64 on the list of "Top 101 cities with largest percentage of males in industries: wholesale trade (population 5,000+)"
#75 on the list of "Top 101 cities with the largest city-data.com crime index per police officer (population 5,000+)"
#22 on the list of "Top 101 counties with the smallest number of people without health insurance coverage in 2000 (pop. 50,000+)"
#53 on the list of "Top 101 counties with the largest number of people moving out compared to moving in (pop. 50,000+)"
#81 on the list of "Top 101 counties with the highest Nitrogen Dioxide air pollution readings in 2012 (ppm)"
Top Patent Applicants
Eric Daniel Densford (1)
Harry S. Courtney (1)
Eric Densford (1)
Total of 3 patent applications in 2008-2024.

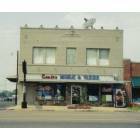
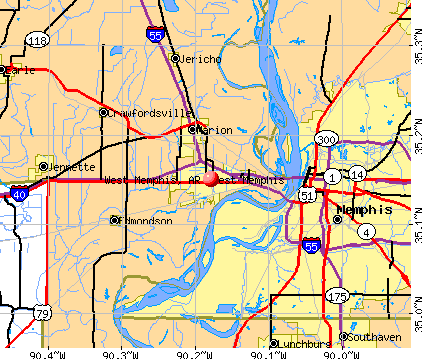


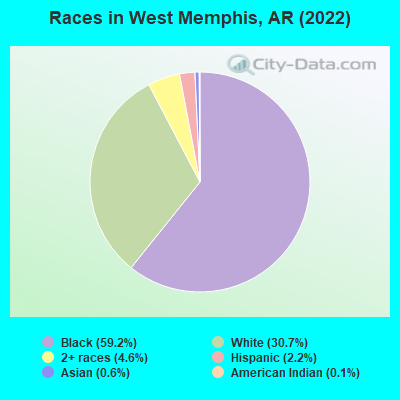
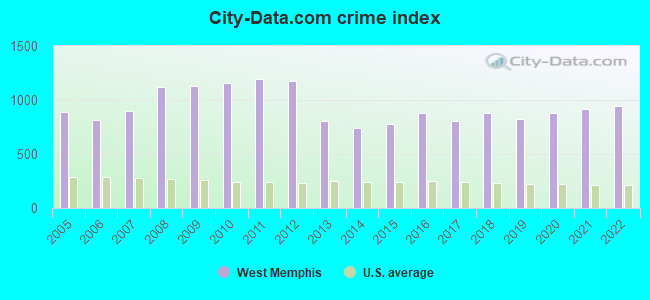
 Recent articles from our blog. Our writers, many of them Ph.D. graduates or candidates, create easy-to-read articles on a wide variety of topics.

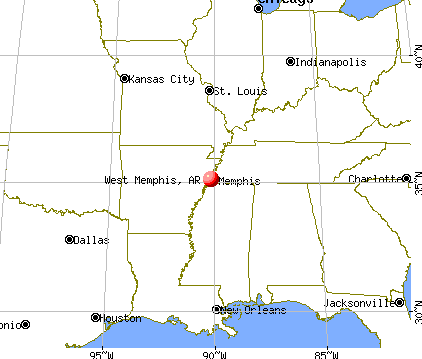
 (12.0 miles
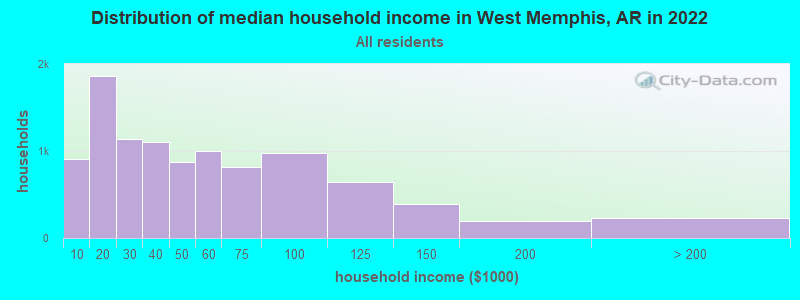
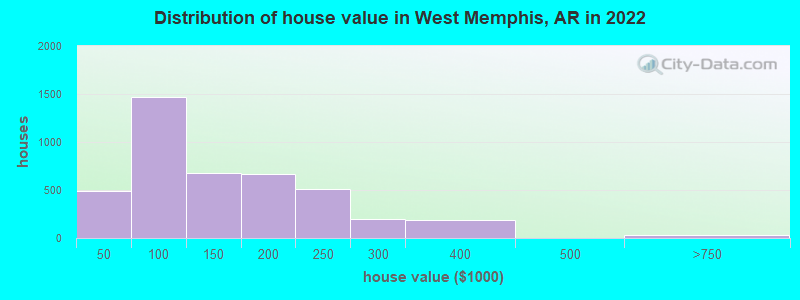
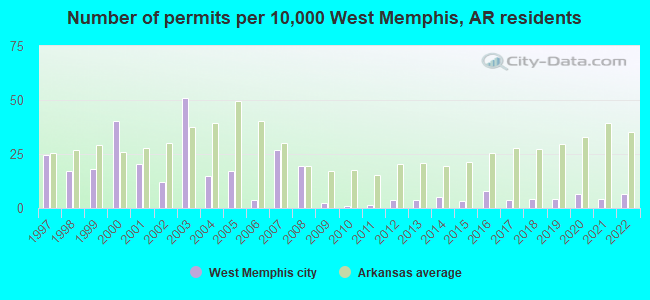
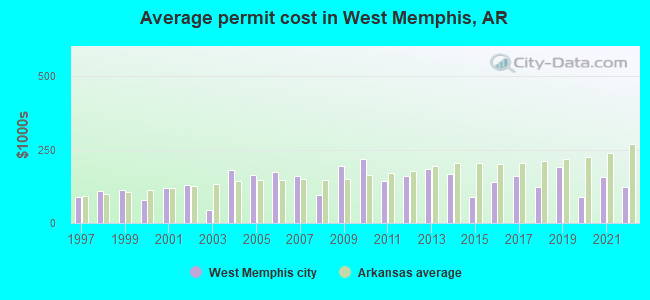
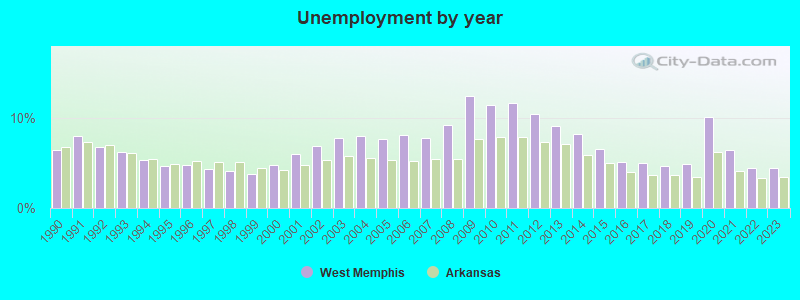
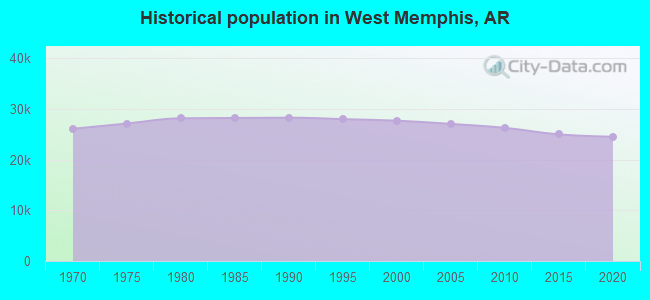
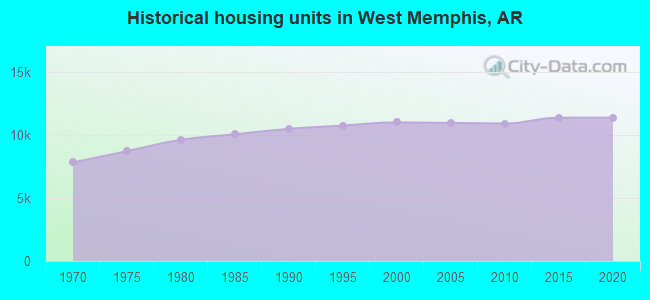
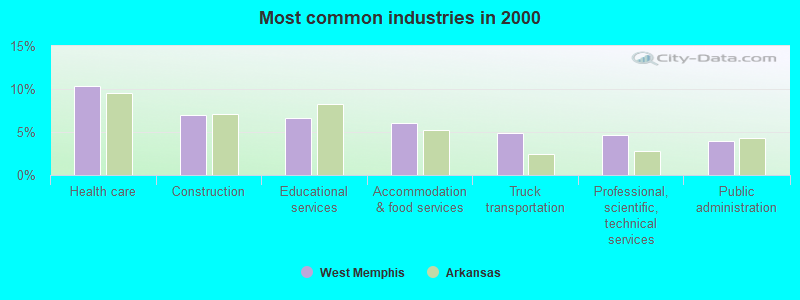
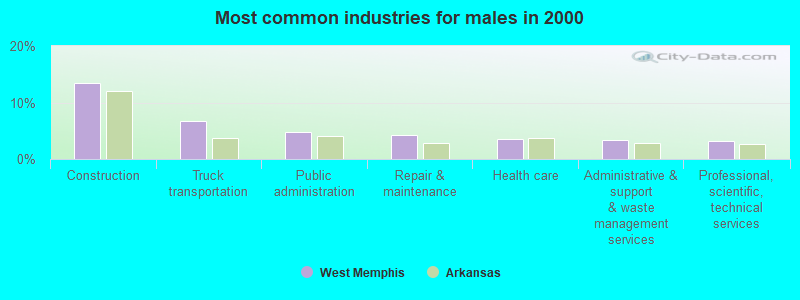
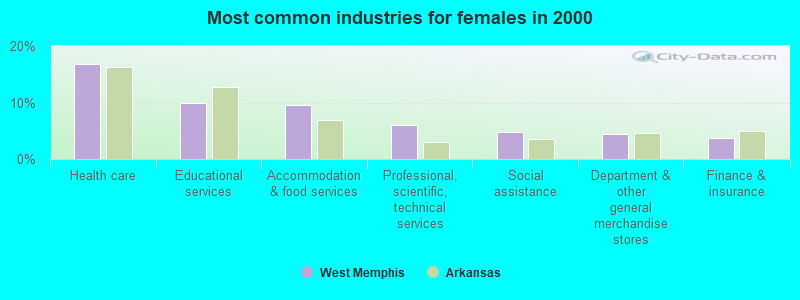
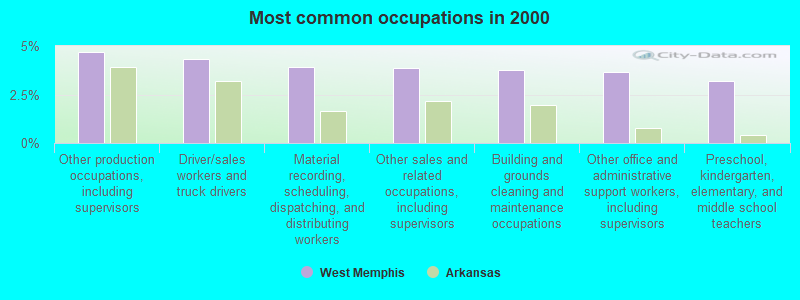
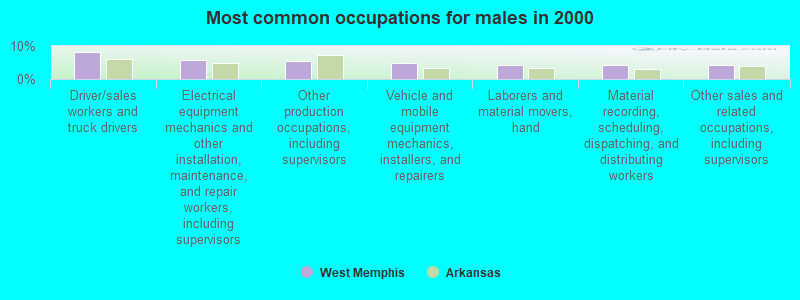
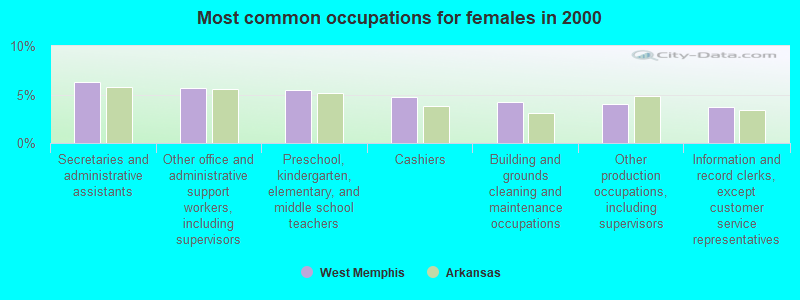
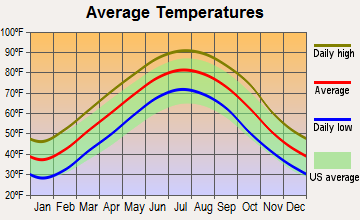
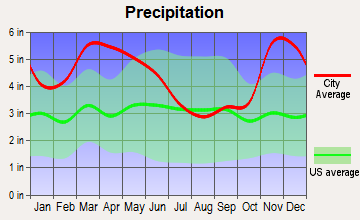
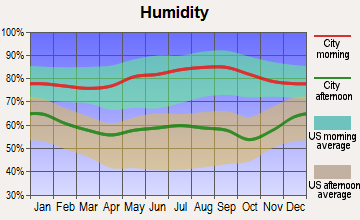
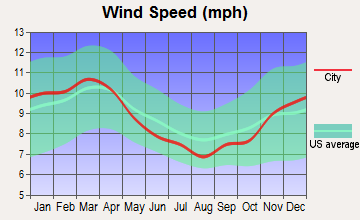
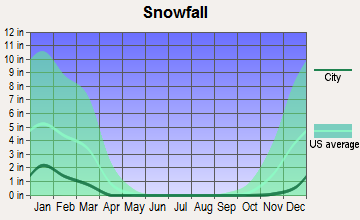
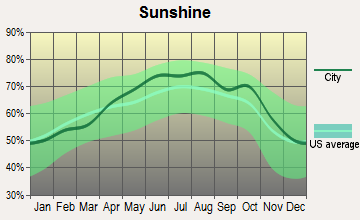
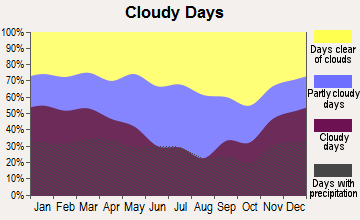
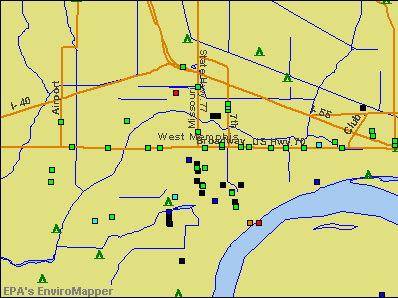

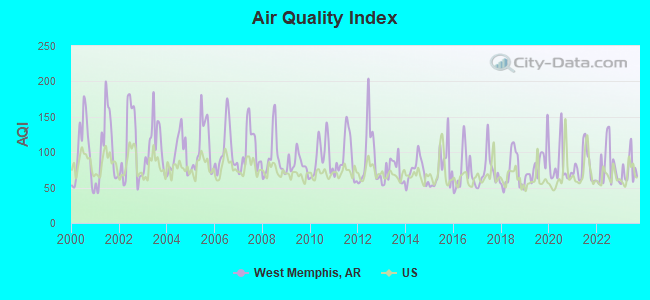
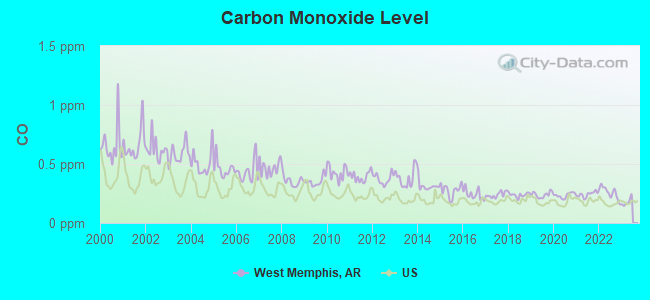
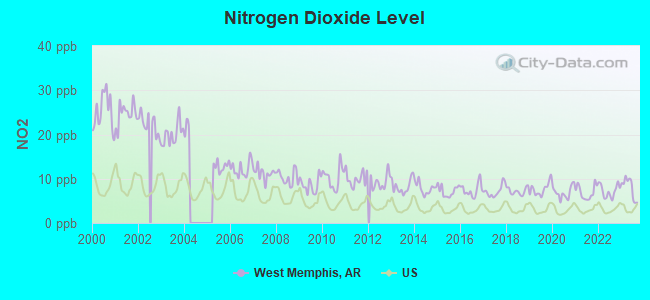
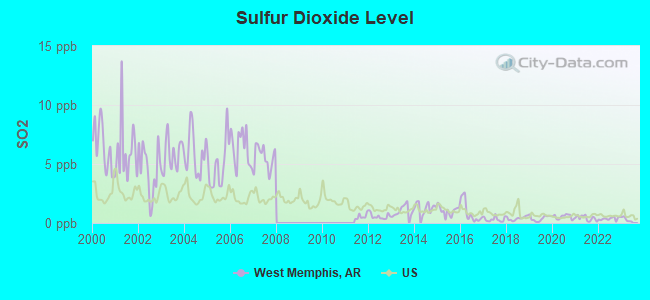
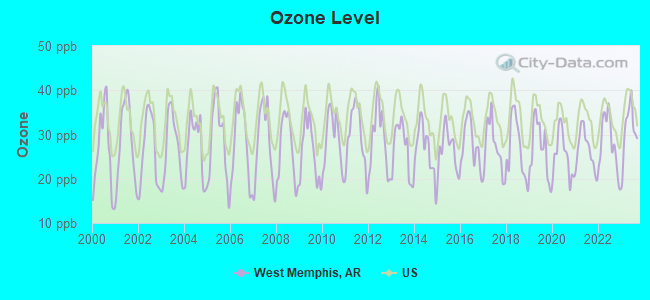
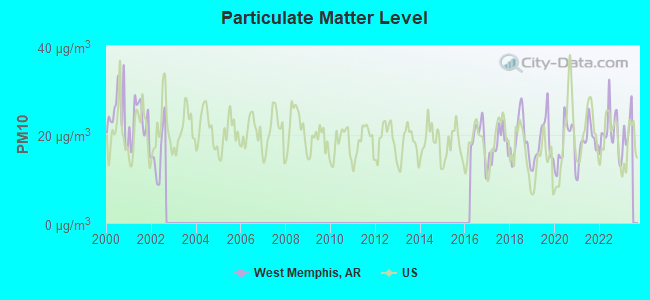
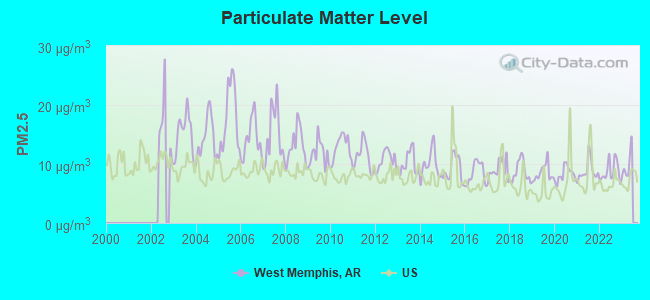
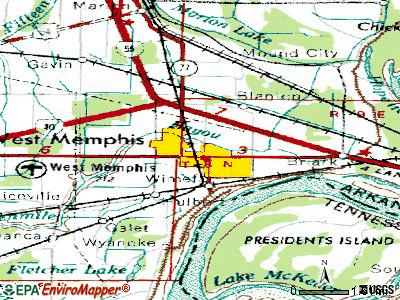
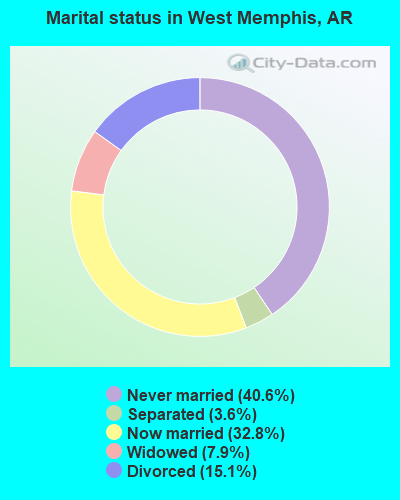
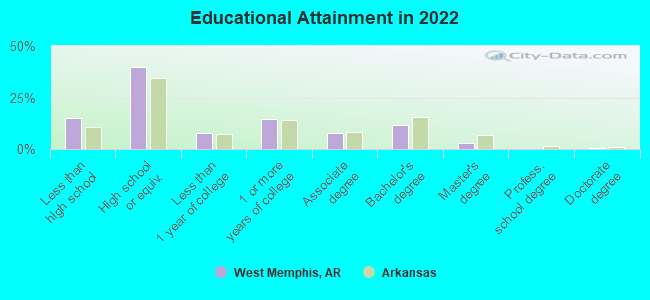
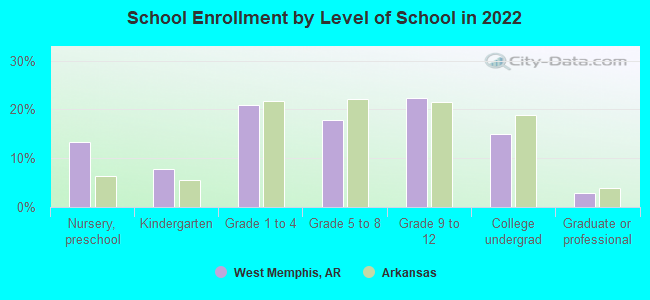
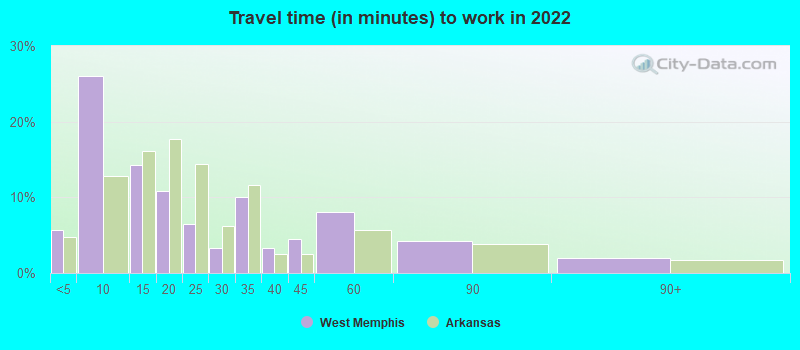
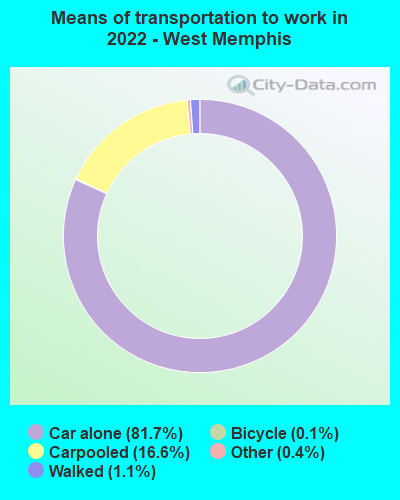
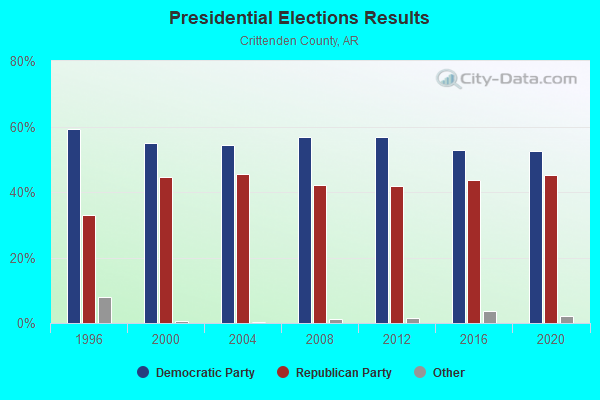
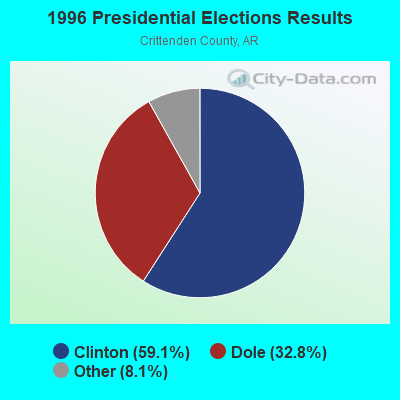
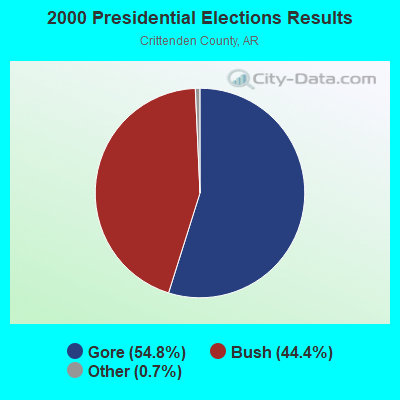
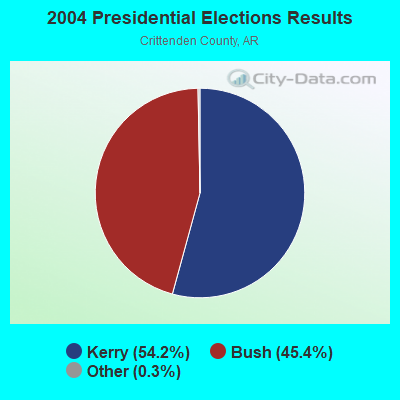
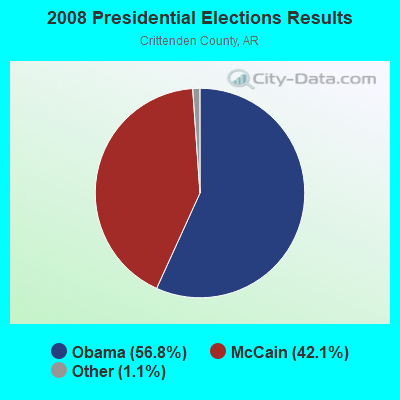


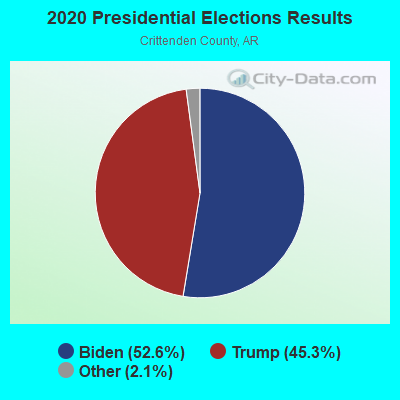
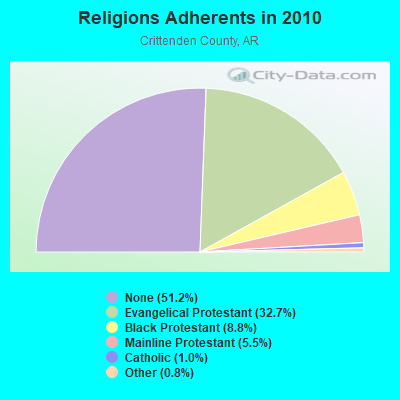
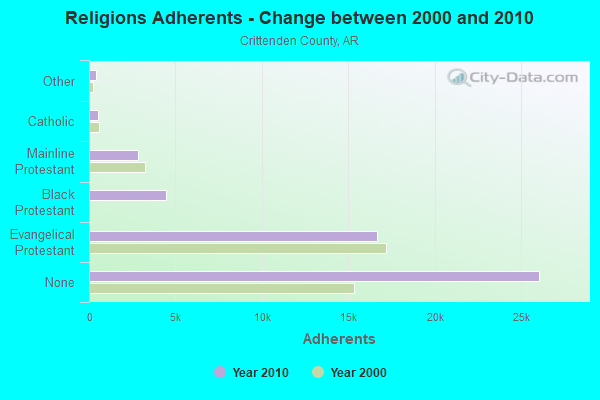
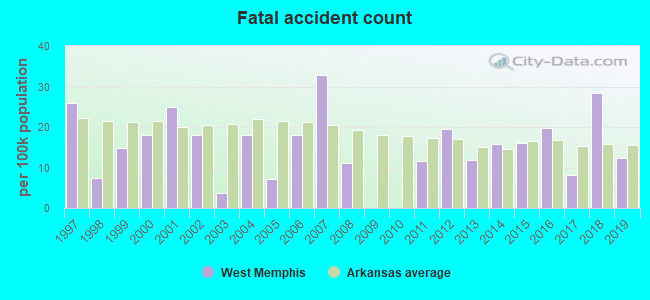
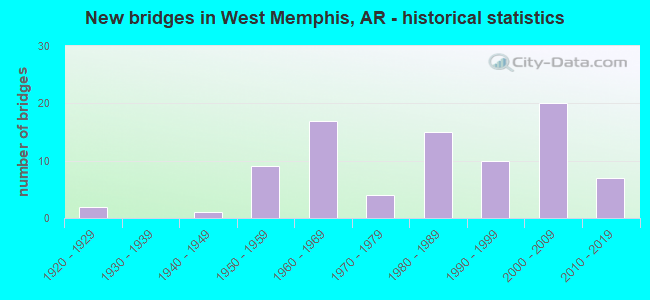
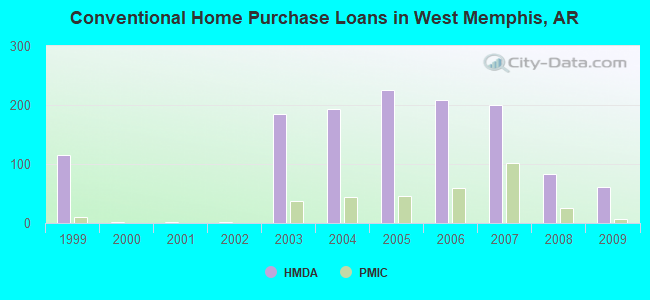
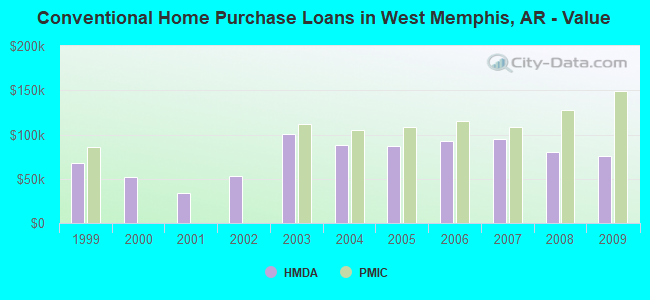
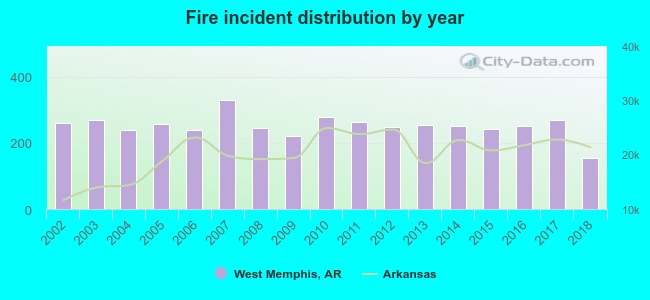 Based on the data from the years 2002 - 2018 the average number of fire incidents per year is 251. The highest number of reported fire incidents - 329 took place in 2007, and the least - 154 in 2018. The data has a decreasing trend.
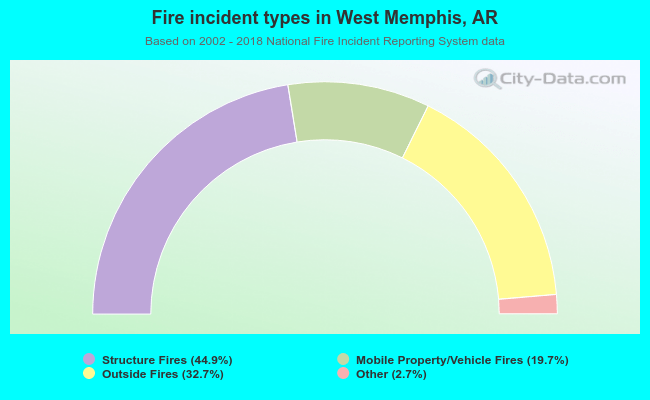 When looking into fire subcategories, the most incidents belonged to: Structure Fires (44.9%), and Outside Fires (32.7%).